Mean State
Download Data |
Period Mean (original grids) [W/m2] |
Model Period Mean (intersection) [W/m2] |
Model Period Mean (complement) [W/m2] |
Benchmark Period Mean (intersection) [W/m2] |
Benchmark Period Mean (complement) [W/m2] |
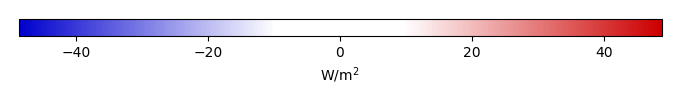
Bias [W/m2] |
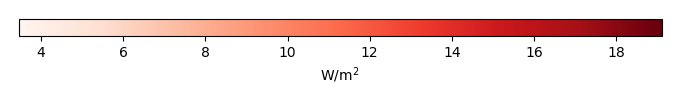
RMSE [W/m2] |
Phase Shift [months] |
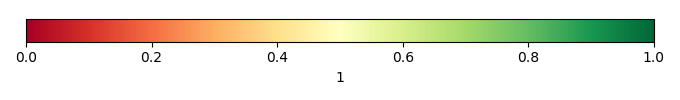
Bias Score [1] |
RMSE Score [1] |
Seasonal Cycle Score [1] |
Spatial Distribution Score [1] |
Interannual Variability Score [1] |
Overall Score [1] |
|||
|---|---|---|---|---|---|---|---|---|---|---|---|---|---|---|---|---|---|
| Benchmark | [-] | 131. | |||||||||||||||
| CLM5PHSOFF | [-] | 115. | 115. | 130. | 157. | -14.2 | 23.1 | 1.40 | 0.504 | 0.418 | 0.815 | 0.994 | 0.714 | 0.644 | |||
| CLM5PHSON | [-] | 116. | 116. | 130. | 157. | -13.7 | 22.6 | 1.40 | 0.513 | 0.420 | 0.812 | 0.990 | 0.694 | 0.642 |
Download Data |
Period Mean (original grids) [W/m2] |
Model Period Mean (intersection) [W/m2] |
Model Period Mean (complement) [W/m2] |
Benchmark Period Mean (intersection) [W/m2] |
Benchmark Period Mean (complement) [W/m2] |
Bias [W/m2] |
RMSE [W/m2] |
Phase Shift [months] |
Bias Score [1] |
RMSE Score [1] |
Seasonal Cycle Score [1] |
Spatial Distribution Score [1] |
Interannual Variability Score [1] |
Overall Score [1] |
|||
|---|---|---|---|---|---|---|---|---|---|---|---|---|---|---|---|---|---|
| Benchmark | [-] | 123. | |||||||||||||||
| CLM5PHSOFF | [-] | 96.1 | 95.6 | 122. | 160. | -26.2 | 31.5 | 1.41 | 0.353 | 0.499 | 0.790 | 0.923 | 0.695 | 0.627 | |||
| CLM5PHSON | [-] | 97.4 | 96.9 | 122. | 160. | -24.8 | 30.3 | 1.43 | 0.374 | 0.505 | 0.789 | 0.941 | 0.650 | 0.627 |
Download Data |
Period Mean (original grids) [W/m2] |
Model Period Mean (intersection) [W/m2] |
Model Period Mean (complement) [W/m2] |
Benchmark Period Mean (intersection) [W/m2] |
Benchmark Period Mean (complement) [W/m2] |
Bias [W/m2] |
RMSE [W/m2] |
Phase Shift [months] |
Bias Score [1] |
RMSE Score [1] |
Seasonal Cycle Score [1] |
Spatial Distribution Score [1] |
Interannual Variability Score [1] |
Overall Score [1] |
|||
|---|---|---|---|---|---|---|---|---|---|---|---|---|---|---|---|---|---|
| Benchmark | [-] | 123. | |||||||||||||||
| CLM5PHSOFF | [-] | 104. | 104. | 121. | 157. | -17.7 | 25.7 | 1.10 | 0.571 | 0.598 | 0.850 | 0.938 | 0.731 | 0.714 | |||
| CLM5PHSON | [-] | 105. | 105. | 121. | 157. | -15.0 | 25.1 | 1.49 | 0.616 | 0.570 | 0.774 | 0.955 | 0.683 | 0.695 |
Download Data |
Period Mean (original grids) [W/m2] |
Model Period Mean (intersection) [W/m2] |
Model Period Mean (complement) [W/m2] |
Benchmark Period Mean (intersection) [W/m2] |
Benchmark Period Mean (complement) [W/m2] |
Bias [W/m2] |
RMSE [W/m2] |
Phase Shift [months] |
Bias Score [1] |
RMSE Score [1] |
Seasonal Cycle Score [1] |
Spatial Distribution Score [1] |
Interannual Variability Score [1] |
Overall Score [1] |
|||
|---|---|---|---|---|---|---|---|---|---|---|---|---|---|---|---|---|---|
| Benchmark | [-] | 34.4 | |||||||||||||||
| CLM5PHSOFF | [-] | 28.4 | 28.5 | 34.5 | 33.0 | -5.96 | 21.4 | 0.284 | 0.842 | 0.724 | 0.981 | 0.831 | 0.732 | 0.806 | |||
| CLM5PHSON | [-] | 32.9 | 33.0 | 34.5 | 33.0 | -3.11 | 20.8 | 0.266 | 0.864 | 0.725 | 0.982 | 0.819 | 0.736 | 0.808 |
Download Data |
Period Mean (original grids) [W/m2] |
Model Period Mean (intersection) [W/m2] |
Model Period Mean (complement) [W/m2] |
Benchmark Period Mean (intersection) [W/m2] |
Benchmark Period Mean (complement) [W/m2] |
Bias [W/m2] |
RMSE [W/m2] |
Phase Shift [months] |
Bias Score [1] |
RMSE Score [1] |
Seasonal Cycle Score [1] |
Spatial Distribution Score [1] |
Interannual Variability Score [1] |
Overall Score [1] |
|||
|---|---|---|---|---|---|---|---|---|---|---|---|---|---|---|---|---|---|
| Benchmark | [-] | 147. | |||||||||||||||
| CLM5PHSOFF | [-] | 133. | 132. | 145. | 156. | -12.6 | 21.7 | 1.65 | 0.483 | 0.431 | 0.739 | 0.987 | 0.692 | 0.627 | |||
| CLM5PHSON | [-] | 128. | 127. | 145. | 156. | -13.0 | 21.7 | 1.63 | 0.478 | 0.433 | 0.743 | 0.986 | 0.685 | 0.626 |
Download Data |
Period Mean (original grids) [W/m2] |
Model Period Mean (intersection) [W/m2] |
Model Period Mean (complement) [W/m2] |
Benchmark Period Mean (intersection) [W/m2] |
Benchmark Period Mean (complement) [W/m2] |
Bias [W/m2] |
RMSE [W/m2] |
Phase Shift [months] |
Bias Score [1] |
RMSE Score [1] |
Seasonal Cycle Score [1] |
Spatial Distribution Score [1] |
Interannual Variability Score [1] |
Overall Score [1] |
|||
|---|---|---|---|---|---|---|---|---|---|---|---|---|---|---|---|---|---|
| Benchmark | [-] | 53.7 | |||||||||||||||
| CLM5PHSOFF | [-] | 42.8 | 42.7 | 53.5 | 64.9 | -10.8 | 19.7 | 0.208 | 0.819 | 0.763 | 0.986 | 0.935 | 0.723 | 0.832 | |||
| CLM5PHSON | [-] | 48.1 | 48.1 | 53.5 | 64.9 | -5.14 | 17.0 | 0.214 | 0.875 | 0.774 | 0.986 | 0.903 | 0.721 | 0.839 |
Download Data |
Period Mean (original grids) [W/m2] |
Model Period Mean (intersection) [W/m2] |
Model Period Mean (complement) [W/m2] |
Benchmark Period Mean (intersection) [W/m2] |
Benchmark Period Mean (complement) [W/m2] |
Bias [W/m2] |
RMSE [W/m2] |
Phase Shift [months] |
Bias Score [1] |
RMSE Score [1] |
Seasonal Cycle Score [1] |
Spatial Distribution Score [1] |
Interannual Variability Score [1] |
Overall Score [1] |
|||
|---|---|---|---|---|---|---|---|---|---|---|---|---|---|---|---|---|---|
| Benchmark | [-] | 71.7 | |||||||||||||||
| CLM5PHSOFF | [-] | 62.1 | 62.0 | 71.1 | 90.6 | -9.09 | 19.7 | 0.442 | 0.793 | 0.717 | 0.963 | 0.994 | 0.696 | 0.813 | |||
| CLM5PHSON | [-] | 62.6 | 62.6 | 71.1 | 90.6 | -7.26 | 19.0 | 0.429 | 0.810 | 0.717 | 0.964 | 0.994 | 0.706 | 0.818 |
Download Data |
Period Mean (original grids) [W/m2] |
Model Period Mean (intersection) [W/m2] |
Model Period Mean (complement) [W/m2] |
Benchmark Period Mean (intersection) [W/m2] |
Benchmark Period Mean (complement) [W/m2] |
Bias [W/m2] |
RMSE [W/m2] |
Phase Shift [months] |
Bias Score [1] |
RMSE Score [1] |
Seasonal Cycle Score [1] |
Spatial Distribution Score [1] |
Interannual Variability Score [1] |
Overall Score [1] |
|||
|---|---|---|---|---|---|---|---|---|---|---|---|---|---|---|---|---|---|
| Benchmark | [-] | 120. | |||||||||||||||
| CLM5PHSOFF | [-] | 97.2 | 96.5 | 118. | 153. | -21.4 | 28.8 | 0.658 | 0.506 | 0.556 | 0.925 | 0.992 | 0.661 | 0.699 | |||
| CLM5PHSON | [-] | 95.0 | 94.6 | 118. | 153. | -18.8 | 27.5 | 0.690 | 0.545 | 0.541 | 0.922 | 0.994 | 0.647 | 0.698 |
Download Data |
Period Mean (original grids) [W/m2] |
Model Period Mean (intersection) [W/m2] |
Model Period Mean (complement) [W/m2] |
Benchmark Period Mean (intersection) [W/m2] |
Benchmark Period Mean (complement) [W/m2] |
Bias [W/m2] |
RMSE [W/m2] |
Phase Shift [months] |
Bias Score [1] |
RMSE Score [1] |
Seasonal Cycle Score [1] |
Spatial Distribution Score [1] |
Interannual Variability Score [1] |
Overall Score [1] |
|||
|---|---|---|---|---|---|---|---|---|---|---|---|---|---|---|---|---|---|
| Benchmark | [-] | 30.5 | |||||||||||||||
| CLM5PHSOFF | [-] | 21.8 | 22.2 | 31.0 | 19.5 | -8.80 | 19.8 | 0.202 | 0.844 | 0.736 | 0.987 | 0.979 | 0.743 | 0.837 | |||
| CLM5PHSON | [-] | 24.2 | 24.5 | 31.0 | 19.5 | -7.63 | 19.3 | 0.205 | 0.860 | 0.736 | 0.986 | 0.981 | 0.754 | 0.842 |
Download Data |
Period Mean (original grids) [W/m2] |
Model Period Mean (intersection) [W/m2] |
Model Period Mean (complement) [W/m2] |
Benchmark Period Mean (intersection) [W/m2] |
Benchmark Period Mean (complement) [W/m2] |
Bias [W/m2] |
RMSE [W/m2] |
Phase Shift [months] |
Bias Score [1] |
RMSE Score [1] |
Seasonal Cycle Score [1] |
Spatial Distribution Score [1] |
Interannual Variability Score [1] |
Overall Score [1] |
|||
|---|---|---|---|---|---|---|---|---|---|---|---|---|---|---|---|---|---|
| Benchmark | [-] | 109. | |||||||||||||||
| CLM5PHSOFF | [-] | 94.0 | 93.9 | 108. | 131. | -13.8 | 20.9 | 0.505 | 0.728 | 0.729 | 0.962 | 0.945 | 0.796 | 0.815 | |||
| CLM5PHSON | [-] | 93.6 | 93.6 | 108. | 131. | -12.2 | 20.1 | 0.514 | 0.751 | 0.727 | 0.960 | 0.956 | 0.769 | 0.815 |
Download Data |
Period Mean (original grids) [W/m2] |
Model Period Mean (intersection) [W/m2] |
Model Period Mean (complement) [W/m2] |
Benchmark Period Mean (intersection) [W/m2] |
Benchmark Period Mean (complement) [W/m2] |
Bias [W/m2] |
RMSE [W/m2] |
Phase Shift [months] |
Bias Score [1] |
RMSE Score [1] |
Seasonal Cycle Score [1] |
Spatial Distribution Score [1] |
Interannual Variability Score [1] |
Overall Score [1] |
|||
|---|---|---|---|---|---|---|---|---|---|---|---|---|---|---|---|---|---|
| Benchmark | [-] | 65.7 | |||||||||||||||
| CLM5PHSOFF | [-] | 54.8 | 54.7 | 63.8 | 85.4 | -9.07 | 18.1 | 0.215 | 0.851 | 0.779 | 0.986 | 0.986 | 0.675 | 0.843 | |||
| CLM5PHSON | [-] | 54.7 | 54.7 | 63.8 | 85.4 | -6.96 | 17.5 | 0.197 | 0.873 | 0.775 | 0.987 | 0.991 | 0.682 | 0.847 |
Download Data |
Period Mean (original grids) [W/m2] |
Model Period Mean (intersection) [W/m2] |
Model Period Mean (complement) [W/m2] |
Benchmark Period Mean (intersection) [W/m2] |
Benchmark Period Mean (complement) [W/m2] |
Bias [W/m2] |
RMSE [W/m2] |
Phase Shift [months] |
Bias Score [1] |
RMSE Score [1] |
Seasonal Cycle Score [1] |
Spatial Distribution Score [1] |
Interannual Variability Score [1] |
Overall Score [1] |
|||
|---|---|---|---|---|---|---|---|---|---|---|---|---|---|---|---|---|---|
| Benchmark | [-] | 109. | |||||||||||||||
| CLM5PHSOFF | [-] | 65.0 | 65.0 | 80.5 | 123. | -15.5 | 23.9 | 0.654 | 0.620 | 0.615 | 0.924 | 0.979 | 0.693 | 0.741 | |||
| CLM5PHSON | [-] | 65.1 | 65.1 | 80.5 | 123. | -13.7 | 23.0 | 0.692 | 0.642 | 0.614 | 0.917 | 0.978 | 0.684 | 0.742 |
Download Data |
Period Mean (original grids) [W/m2] |
Model Period Mean (intersection) [W/m2] |
Model Period Mean (complement) [W/m2] |
Benchmark Period Mean (intersection) [W/m2] |
Benchmark Period Mean (complement) [W/m2] |
Bias [W/m2] |
RMSE [W/m2] |
Phase Shift [months] |
Bias Score [1] |
RMSE Score [1] |
Seasonal Cycle Score [1] |
Spatial Distribution Score [1] |
Interannual Variability Score [1] |
Overall Score [1] |
|||
|---|---|---|---|---|---|---|---|---|---|---|---|---|---|---|---|---|---|
| Benchmark | [-] | 76.6 | |||||||||||||||
| CLM5PHSOFF | [-] | 55.2 | 55.1 | 73.9 | 144. | -18.8 | 25.0 | 0.885 | 0.547 | 0.619 | 0.901 | 0.930 | 0.702 | 0.720 | |||
| CLM5PHSON | [-] | 53.6 | 53.6 | 73.9 | 144. | -18.0 | 24.8 | 0.888 | 0.556 | 0.615 | 0.901 | 0.940 | 0.708 | 0.723 |
Download Data |
Period Mean (original grids) [W/m2] |
Model Period Mean (intersection) [W/m2] |
Model Period Mean (complement) [W/m2] |
Benchmark Period Mean (intersection) [W/m2] |
Benchmark Period Mean (complement) [W/m2] |
Bias [W/m2] |
RMSE [W/m2] |
Phase Shift [months] |
Bias Score [1] |
RMSE Score [1] |
Seasonal Cycle Score [1] |
Spatial Distribution Score [1] |
Interannual Variability Score [1] |
Overall Score [1] |
|||
|---|---|---|---|---|---|---|---|---|---|---|---|---|---|---|---|---|---|
| Benchmark | [-] | 36.2 | |||||||||||||||
| CLM5PHSOFF | [-] | 24.1 | 23.9 | 36.2 | 36.3 | -12.3 | 22.1 | 0.0876 | 0.801 | 0.726 | 0.994 | 0.946 | 0.765 | 0.826 | |||
| CLM5PHSON | [-] | 27.4 | 27.3 | 36.2 | 36.3 | -10.9 | 21.5 | 0.0841 | 0.819 | 0.726 | 0.994 | 0.929 | 0.770 | 0.827 |
Download Data |
Period Mean (original grids) [W/m2] |
Model Period Mean (intersection) [W/m2] |
Model Period Mean (complement) [W/m2] |
Benchmark Period Mean (intersection) [W/m2] |
Benchmark Period Mean (complement) [W/m2] |
Bias [W/m2] |
RMSE [W/m2] |
Phase Shift [months] |
Bias Score [1] |
RMSE Score [1] |
Seasonal Cycle Score [1] |
Spatial Distribution Score [1] |
Interannual Variability Score [1] |
Overall Score [1] |
|||
|---|---|---|---|---|---|---|---|---|---|---|---|---|---|---|---|---|---|
| Benchmark | [-] | 138. | |||||||||||||||
| CLM5PHSOFF | [-] | 110. | 110. | 133. | 161. | -22.3 | 29.0 | 1.06 | 0.529 | 0.618 | 0.872 | 0.990 | 0.717 | 0.724 | |||
| CLM5PHSON | [-] | 107. | 107. | 133. | 161. | -20.2 | 27.5 | 1.29 | 0.558 | 0.616 | 0.830 | 0.989 | 0.695 | 0.717 |
Download Data |
Period Mean (original grids) [W/m2] |
Model Period Mean (intersection) [W/m2] |
Model Period Mean (complement) [W/m2] |
Benchmark Period Mean (intersection) [W/m2] |
Benchmark Period Mean (complement) [W/m2] |
Bias [W/m2] |
RMSE [W/m2] |
Phase Shift [months] |
Bias Score [1] |
RMSE Score [1] |
Seasonal Cycle Score [1] |
Spatial Distribution Score [1] |
Interannual Variability Score [1] |
Overall Score [1] |
|||
|---|---|---|---|---|---|---|---|---|---|---|---|---|---|---|---|---|---|
| Benchmark | [-] | 98.6 | |||||||||||||||
| CLM5PHSOFF | [-] | 80.1 | 79.9 | 96.9 | 135. | -16.9 | 22.4 | 0.478 | 0.732 | 0.758 | 0.964 | 0.954 | 0.732 | 0.816 | |||
| CLM5PHSON | [-] | 81.8 | 81.9 | 96.9 | 135. | -13.3 | 19.7 | 0.468 | 0.783 | 0.765 | 0.965 | 0.928 | 0.729 | 0.822 |
Download Data |
Period Mean (original grids) [W/m2] |
Model Period Mean (intersection) [W/m2] |
Model Period Mean (complement) [W/m2] |
Benchmark Period Mean (intersection) [W/m2] |
Benchmark Period Mean (complement) [W/m2] |
Bias [W/m2] |
RMSE [W/m2] |
Phase Shift [months] |
Bias Score [1] |
RMSE Score [1] |
Seasonal Cycle Score [1] |
Spatial Distribution Score [1] |
Interannual Variability Score [1] |
Overall Score [1] |
|||
|---|---|---|---|---|---|---|---|---|---|---|---|---|---|---|---|---|---|
| Benchmark | [-] | 63.9 | |||||||||||||||
| CLM5PHSOFF | [-] | 53.2 | 53.4 | 63.6 | 72.9 | -10.3 | 18.5 | 0.149 | 0.834 | 0.782 | 0.990 | 0.991 | 0.722 | 0.850 | |||
| CLM5PHSON | [-] | 58.2 | 58.3 | 63.6 | 72.9 | -5.21 | 15.3 | 0.153 | 0.895 | 0.794 | 0.990 | 0.990 | 0.707 | 0.862 |
Download Data |
Period Mean (original grids) [W/m2] |
Model Period Mean (intersection) [W/m2] |
Model Period Mean (complement) [W/m2] |
Benchmark Period Mean (intersection) [W/m2] |
Benchmark Period Mean (complement) [W/m2] |
Bias [W/m2] |
RMSE [W/m2] |
Phase Shift [months] |
Bias Score [1] |
RMSE Score [1] |
Seasonal Cycle Score [1] |
Spatial Distribution Score [1] |
Interannual Variability Score [1] |
Overall Score [1] |
|||
|---|---|---|---|---|---|---|---|---|---|---|---|---|---|---|---|---|---|
| Benchmark | [-] | 82.3 | |||||||||||||||
| CLM5PHSOFF | [-] | 68.6 | 68.8 | 81.8 | 110. | -13.1 | 20.1 | 0.526 | 0.780 | 0.765 | 0.955 | 0.944 | 0.738 | 0.824 | |||
| CLM5PHSON | [-] | 71.4 | 71.6 | 81.8 | 110. | -9.78 | 18.5 | 0.542 | 0.815 | 0.767 | 0.952 | 0.949 | 0.744 | 0.832 |
Download Data |
Period Mean (original grids) [W/m2] |
Model Period Mean (intersection) [W/m2] |
Model Period Mean (complement) [W/m2] |
Benchmark Period Mean (intersection) [W/m2] |
Benchmark Period Mean (complement) [W/m2] |
Bias [W/m2] |
RMSE [W/m2] |
Phase Shift [months] |
Bias Score [1] |
RMSE Score [1] |
Seasonal Cycle Score [1] |
Spatial Distribution Score [1] |
Interannual Variability Score [1] |
Overall Score [1] |
|||
|---|---|---|---|---|---|---|---|---|---|---|---|---|---|---|---|---|---|
| Benchmark | [-] | 139. | |||||||||||||||
| CLM5PHSOFF | [-] | 121. | 121. | 138. | 170. | -16.7 | 24.5 | 1.09 | 0.350 | 0.398 | 0.851 | 0.981 | 0.744 | 0.620 | |||
| CLM5PHSON | [-] | 121. | 122. | 138. | 170. | -15.8 | 24.0 | 1.23 | 0.359 | 0.398 | 0.823 | 0.974 | 0.724 | 0.613 |
Download Data |
Period Mean (original grids) [W/m2] |
Model Period Mean (intersection) [W/m2] |
Model Period Mean (complement) [W/m2] |
Benchmark Period Mean (intersection) [W/m2] |
Benchmark Period Mean (complement) [W/m2] |
Bias [W/m2] |
RMSE [W/m2] |
Phase Shift [months] |
Bias Score [1] |
RMSE Score [1] |
Seasonal Cycle Score [1] |
Spatial Distribution Score [1] |
Interannual Variability Score [1] |
Overall Score [1] |
|||
|---|---|---|---|---|---|---|---|---|---|---|---|---|---|---|---|---|---|
| Benchmark | [-] | 121. | |||||||||||||||
| CLM5PHSOFF | [-] | 105. | 105. | 120. | 143. | -15.5 | 24.0 | 0.868 | 0.626 | 0.614 | 0.906 | 0.845 | 0.737 | 0.724 | |||
| CLM5PHSON | [-] | 107. | 107. | 120. | 143. | -12.8 | 22.6 | 0.892 | 0.665 | 0.612 | 0.897 | 0.818 | 0.703 | 0.718 |
Download Data |
Period Mean (original grids) [W/m2] |
Model Period Mean (intersection) [W/m2] |
Model Period Mean (complement) [W/m2] |
Benchmark Period Mean (intersection) [W/m2] |
Benchmark Period Mean (complement) [W/m2] |
Bias [W/m2] |
RMSE [W/m2] |
Phase Shift [months] |
Bias Score [1] |
RMSE Score [1] |
Seasonal Cycle Score [1] |
Spatial Distribution Score [1] |
Interannual Variability Score [1] |
Overall Score [1] |
|||
|---|---|---|---|---|---|---|---|---|---|---|---|---|---|---|---|---|---|
| Benchmark | [-] | 98.1 | |||||||||||||||
| CLM5PHSOFF | [-] | 88.4 | 87.6 | 95.8 | 118. | -8.41 | 24.3 | 0.514 | 0.748 | 0.703 | 0.954 | 0.991 | 0.638 | 0.789 | |||
| CLM5PHSON | [-] | 90.4 | 89.8 | 95.8 | 118. | -7.08 | 23.4 | 0.560 | 0.761 | 0.706 | 0.947 | 0.991 | 0.642 | 0.792 |
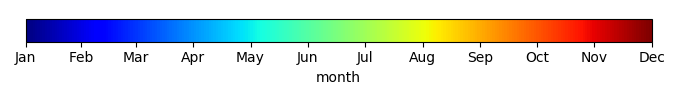
Temporally integrated period mean