Mean State
Download Data |
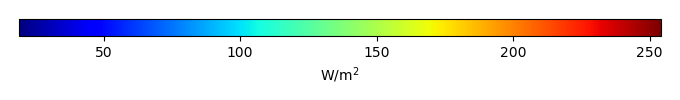
Period Mean (original grids) [W/m2] |
Model Period Mean (intersection) [W/m2] |
Model Period Mean (complement) [W/m2] |
Benchmark Period Mean (intersection) [W/m2] |
Benchmark Period Mean (complement) [W/m2] |
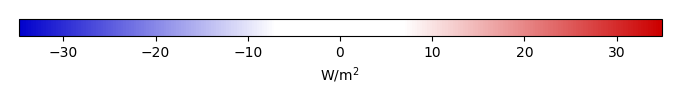
Bias [W/m2] |
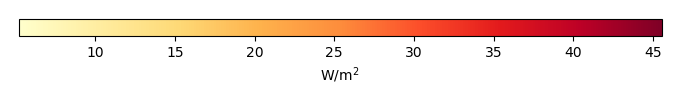
RMSE [W/m2] |
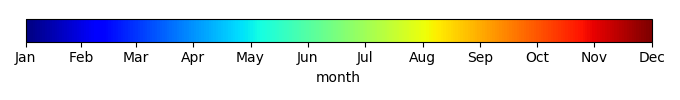
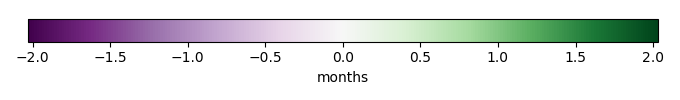
Phase Shift [months] |
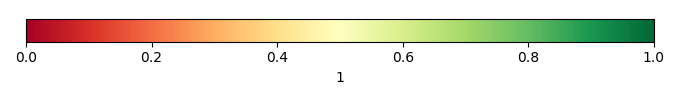
Bias Score [1] |
RMSE Score [1] |
Seasonal Cycle Score [1] |
Spatial Distribution Score [1] |
Interannual Variability Score [1] |
Overall Score [1] |
|||
|---|---|---|---|---|---|---|---|---|---|---|---|---|---|---|---|---|---|
| Benchmark | [-] | 187. | |||||||||||||||
| CLM5PHSOFF | [-] | 181. | 181. | 186. | 206. | -4.89 | 15.2 | 0.808 | 0.720 | 0.495 | 0.903 | 0.940 | 0.800 | 0.726 | |||
| CLM5PHSON | [-] | 182. | 182. | 186. | 206. | -4.45 | 15.1 | 0.823 | 0.728 | 0.493 | 0.901 | 0.939 | 0.801 | 0.726 |
Download Data |
Period Mean (original grids) [W/m2] |
Model Period Mean (intersection) [W/m2] |
Model Period Mean (complement) [W/m2] |
Benchmark Period Mean (intersection) [W/m2] |
Benchmark Period Mean (complement) [W/m2] |
Bias [W/m2] |
RMSE [W/m2] |
Phase Shift [months] |
Bias Score [1] |
RMSE Score [1] |
Seasonal Cycle Score [1] |
Spatial Distribution Score [1] |
Interannual Variability Score [1] |
Overall Score [1] |
|||
|---|---|---|---|---|---|---|---|---|---|---|---|---|---|---|---|---|---|
| Benchmark | [-] | 198. | |||||||||||||||
| CLM5PHSOFF | [-] | 194. | 194. | 198. | 214. | -3.94 | 14.6 | 0.751 | 0.704 | 0.510 | 0.913 | 0.974 | 0.850 | 0.743 | |||
| CLM5PHSON | [-] | 195. | 195. | 198. | 214. | -2.80 | 14.2 | 0.767 | 0.714 | 0.516 | 0.906 | 0.964 | 0.852 | 0.745 |
Download Data |
Period Mean (original grids) [W/m2] |
Model Period Mean (intersection) [W/m2] |
Model Period Mean (complement) [W/m2] |
Benchmark Period Mean (intersection) [W/m2] |
Benchmark Period Mean (complement) [W/m2] |
Bias [W/m2] |
RMSE [W/m2] |
Phase Shift [months] |
Bias Score [1] |
RMSE Score [1] |
Seasonal Cycle Score [1] |
Spatial Distribution Score [1] |
Interannual Variability Score [1] |
Overall Score [1] |
|||
|---|---|---|---|---|---|---|---|---|---|---|---|---|---|---|---|---|---|
| Benchmark | [-] | 199. | |||||||||||||||
| CLM5PHSOFF | [-] | 195. | 195. | 198. | 219. | -3.15 | 15.5 | 0.706 | 0.795 | 0.573 | 0.904 | 0.994 | 0.748 | 0.765 | |||
| CLM5PHSON | [-] | 196. | 196. | 198. | 219. | -2.87 | 15.6 | 0.787 | 0.797 | 0.569 | 0.893 | 0.996 | 0.748 | 0.762 |
Download Data |
Period Mean (original grids) [W/m2] |
Model Period Mean (intersection) [W/m2] |
Model Period Mean (complement) [W/m2] |
Benchmark Period Mean (intersection) [W/m2] |
Benchmark Period Mean (complement) [W/m2] |
Bias [W/m2] |
RMSE [W/m2] |
Phase Shift [months] |
Bias Score [1] |
RMSE Score [1] |
Seasonal Cycle Score [1] |
Spatial Distribution Score [1] |
Interannual Variability Score [1] |
Overall Score [1] |
|||
|---|---|---|---|---|---|---|---|---|---|---|---|---|---|---|---|---|---|
| Benchmark | [-] | 70.7 | |||||||||||||||
| CLM5PHSOFF | [-] | 69.4 | 69.6 | 70.5 | 72.8 | -0.883 | 18.9 | 0.310 | 0.906 | 0.766 | 0.979 | 0.996 | 0.737 | 0.858 | |||
| CLM5PHSON | [-] | 73.1 | 73.3 | 70.5 | 72.8 | 1.86 | 18.4 | 0.331 | 0.906 | 0.772 | 0.978 | 0.996 | 0.741 | 0.861 |
Download Data |
Period Mean (original grids) [W/m2] |
Model Period Mean (intersection) [W/m2] |
Model Period Mean (complement) [W/m2] |
Benchmark Period Mean (intersection) [W/m2] |
Benchmark Period Mean (complement) [W/m2] |
Bias [W/m2] |
RMSE [W/m2] |
Phase Shift [months] |
Bias Score [1] |
RMSE Score [1] |
Seasonal Cycle Score [1] |
Spatial Distribution Score [1] |
Interannual Variability Score [1] |
Overall Score [1] |
|||
|---|---|---|---|---|---|---|---|---|---|---|---|---|---|---|---|---|---|
| Benchmark | [-] | 194. | |||||||||||||||
| CLM5PHSOFF | [-] | 179. | 178. | 190. | 207. | -11.6 | 19.3 | 1.25 | 0.532 | 0.437 | 0.803 | 0.957 | 0.769 | 0.656 | |||
| CLM5PHSON | [-] | 175. | 175. | 190. | 207. | -11.2 | 19.1 | 1.25 | 0.542 | 0.437 | 0.802 | 0.963 | 0.769 | 0.658 |
Download Data |
Period Mean (original grids) [W/m2] |
Model Period Mean (intersection) [W/m2] |
Model Period Mean (complement) [W/m2] |
Benchmark Period Mean (intersection) [W/m2] |
Benchmark Period Mean (complement) [W/m2] |
Bias [W/m2] |
RMSE [W/m2] |
Phase Shift [months] |
Bias Score [1] |
RMSE Score [1] |
Seasonal Cycle Score [1] |
Spatial Distribution Score [1] |
Interannual Variability Score [1] |
Overall Score [1] |
|||
|---|---|---|---|---|---|---|---|---|---|---|---|---|---|---|---|---|---|
| Benchmark | [-] | 97.8 | |||||||||||||||
| CLM5PHSOFF | [-] | 96.3 | 96.2 | 97.6 | 118. | -1.32 | 17.7 | 0.230 | 0.919 | 0.787 | 0.985 | 0.987 | 0.707 | 0.862 | |||
| CLM5PHSON | [-] | 100. | 100. | 97.6 | 118. | 2.99 | 15.5 | 0.231 | 0.921 | 0.817 | 0.985 | 0.995 | 0.687 | 0.870 |
Download Data |
Period Mean (original grids) [W/m2] |
Model Period Mean (intersection) [W/m2] |
Model Period Mean (complement) [W/m2] |
Benchmark Period Mean (intersection) [W/m2] |
Benchmark Period Mean (complement) [W/m2] |
Bias [W/m2] |
RMSE [W/m2] |
Phase Shift [months] |
Bias Score [1] |
RMSE Score [1] |
Seasonal Cycle Score [1] |
Spatial Distribution Score [1] |
Interannual Variability Score [1] |
Overall Score [1] |
|||
|---|---|---|---|---|---|---|---|---|---|---|---|---|---|---|---|---|---|
| Benchmark | [-] | 139. | |||||||||||||||
| CLM5PHSOFF | [-] | 135. | 135. | 138. | 149. | -3.17 | 16.1 | 0.353 | 0.880 | 0.764 | 0.970 | 0.999 | 0.671 | 0.842 | |||
| CLM5PHSON | [-] | 135. | 135. | 138. | 149. | -2.61 | 15.9 | 0.340 | 0.883 | 0.767 | 0.972 | 0.999 | 0.666 | 0.842 |
Download Data |
Period Mean (original grids) [W/m2] |
Model Period Mean (intersection) [W/m2] |
Model Period Mean (complement) [W/m2] |
Benchmark Period Mean (intersection) [W/m2] |
Benchmark Period Mean (complement) [W/m2] |
Bias [W/m2] |
RMSE [W/m2] |
Phase Shift [months] |
Bias Score [1] |
RMSE Score [1] |
Seasonal Cycle Score [1] |
Spatial Distribution Score [1] |
Interannual Variability Score [1] |
Overall Score [1] |
|||
|---|---|---|---|---|---|---|---|---|---|---|---|---|---|---|---|---|---|
| Benchmark | [-] | 181. | |||||||||||||||
| CLM5PHSOFF | [-] | 175. | 175. | 179. | 205. | -4.15 | 18.2 | 0.328 | 0.763 | 0.611 | 0.974 | 0.938 | 0.719 | 0.769 | |||
| CLM5PHSON | [-] | 174. | 174. | 179. | 205. | -3.72 | 18.1 | 0.320 | 0.770 | 0.610 | 0.974 | 0.938 | 0.722 | 0.771 |
Download Data |
Period Mean (original grids) [W/m2] |
Model Period Mean (intersection) [W/m2] |
Model Period Mean (complement) [W/m2] |
Benchmark Period Mean (intersection) [W/m2] |
Benchmark Period Mean (complement) [W/m2] |
Bias [W/m2] |
RMSE [W/m2] |
Phase Shift [months] |
Bias Score [1] |
RMSE Score [1] |
Seasonal Cycle Score [1] |
Spatial Distribution Score [1] |
Interannual Variability Score [1] |
Overall Score [1] |
|||
|---|---|---|---|---|---|---|---|---|---|---|---|---|---|---|---|---|---|
| Benchmark | [-] | 62.8 | |||||||||||||||
| CLM5PHSOFF | [-] | 62.7 | 63.1 | 63.2 | 54.4 | -0.0956 | 15.9 | 0.179 | 0.929 | 0.788 | 0.988 | 0.991 | 0.738 | 0.870 | |||
| CLM5PHSON | [-] | 64.7 | 65.0 | 63.2 | 54.4 | 0.684 | 15.6 | 0.199 | 0.931 | 0.792 | 0.987 | 0.990 | 0.748 | 0.873 |
Download Data |
Period Mean (original grids) [W/m2] |
Model Period Mean (intersection) [W/m2] |
Model Period Mean (complement) [W/m2] |
Benchmark Period Mean (intersection) [W/m2] |
Benchmark Period Mean (complement) [W/m2] |
Bias [W/m2] |
RMSE [W/m2] |
Phase Shift [months] |
Bias Score [1] |
RMSE Score [1] |
Seasonal Cycle Score [1] |
Spatial Distribution Score [1] |
Interannual Variability Score [1] |
Overall Score [1] |
|||
|---|---|---|---|---|---|---|---|---|---|---|---|---|---|---|---|---|---|
| Benchmark | [-] | 198. | |||||||||||||||
| CLM5PHSOFF | [-] | 190. | 190. | 198. | 197. | -8.29 | 16.0 | 0.373 | 0.833 | 0.763 | 0.972 | 1.00 | 0.713 | 0.841 | |||
| CLM5PHSON | [-] | 192. | 192. | 198. | 197. | -7.59 | 15.6 | 0.385 | 0.846 | 0.765 | 0.971 | 0.999 | 0.718 | 0.844 |
Download Data |
Period Mean (original grids) [W/m2] |
Model Period Mean (intersection) [W/m2] |
Model Period Mean (complement) [W/m2] |
Benchmark Period Mean (intersection) [W/m2] |
Benchmark Period Mean (complement) [W/m2] |
Bias [W/m2] |
RMSE [W/m2] |
Phase Shift [months] |
Bias Score [1] |
RMSE Score [1] |
Seasonal Cycle Score [1] |
Spatial Distribution Score [1] |
Interannual Variability Score [1] |
Overall Score [1] |
|||
|---|---|---|---|---|---|---|---|---|---|---|---|---|---|---|---|---|---|
| Benchmark | [-] | 120. | |||||||||||||||
| CLM5PHSOFF | [-] | 115. | 115. | 118. | 145. | -2.77 | 13.7 | 0.238 | 0.917 | 0.840 | 0.984 | 0.991 | 0.664 | 0.873 | |||
| CLM5PHSON | [-] | 113. | 113. | 118. | 145. | -2.30 | 13.6 | 0.227 | 0.921 | 0.839 | 0.985 | 0.990 | 0.660 | 0.872 |
Download Data |
Period Mean (original grids) [W/m2] |
Model Period Mean (intersection) [W/m2] |
Model Period Mean (complement) [W/m2] |
Benchmark Period Mean (intersection) [W/m2] |
Benchmark Period Mean (complement) [W/m2] |
Bias [W/m2] |
RMSE [W/m2] |
Phase Shift [months] |
Bias Score [1] |
RMSE Score [1] |
Seasonal Cycle Score [1] |
Spatial Distribution Score [1] |
Interannual Variability Score [1] |
Overall Score [1] |
|||
|---|---|---|---|---|---|---|---|---|---|---|---|---|---|---|---|---|---|
| Benchmark | [-] | 163. | |||||||||||||||
| CLM5PHSOFF | [-] | 136. | 136. | 142. | 173. | -5.43 | 16.4 | 0.384 | 0.813 | 0.701 | 0.960 | 0.998 | 0.716 | 0.815 | |||
| CLM5PHSON | [-] | 137. | 137. | 142. | 173. | -4.59 | 16.0 | 0.394 | 0.818 | 0.705 | 0.958 | 0.998 | 0.713 | 0.816 |
Download Data |
Period Mean (original grids) [W/m2] |
Model Period Mean (intersection) [W/m2] |
Model Period Mean (complement) [W/m2] |
Benchmark Period Mean (intersection) [W/m2] |
Benchmark Period Mean (complement) [W/m2] |
Bias [W/m2] |
RMSE [W/m2] |
Phase Shift [months] |
Bias Score [1] |
RMSE Score [1] |
Seasonal Cycle Score [1] |
Spatial Distribution Score [1] |
Interannual Variability Score [1] |
Overall Score [1] |
|||
|---|---|---|---|---|---|---|---|---|---|---|---|---|---|---|---|---|---|
| Benchmark | [-] | 177. | |||||||||||||||
| CLM5PHSOFF | [-] | 163. | 163. | 175. | 217. | -12.2 | 17.9 | 0.296 | 0.707 | 0.763 | 0.978 | 0.963 | 0.676 | 0.808 | |||
| CLM5PHSON | [-] | 162. | 162. | 175. | 217. | -12.0 | 18.0 | 0.296 | 0.708 | 0.763 | 0.978 | 0.960 | 0.674 | 0.808 |
Download Data |
Period Mean (original grids) [W/m2] |
Model Period Mean (intersection) [W/m2] |
Model Period Mean (complement) [W/m2] |
Benchmark Period Mean (intersection) [W/m2] |
Benchmark Period Mean (complement) [W/m2] |
Bias [W/m2] |
RMSE [W/m2] |
Phase Shift [months] |
Bias Score [1] |
RMSE Score [1] |
Seasonal Cycle Score [1] |
Spatial Distribution Score [1] |
Interannual Variability Score [1] |
Overall Score [1] |
|||
|---|---|---|---|---|---|---|---|---|---|---|---|---|---|---|---|---|---|
| Benchmark | [-] | 69.7 | |||||||||||||||
| CLM5PHSOFF | [-] | 68.1 | 67.9 | 69.6 | 71.1 | -1.70 | 17.5 | 0.0891 | 0.916 | 0.779 | 0.994 | 0.988 | 0.750 | 0.868 | |||
| CLM5PHSON | [-] | 70.7 | 70.6 | 69.6 | 71.1 | -0.616 | 17.1 | 0.0938 | 0.915 | 0.784 | 0.994 | 0.981 | 0.747 | 0.867 |
Download Data |
Period Mean (original grids) [W/m2] |
Model Period Mean (intersection) [W/m2] |
Model Period Mean (complement) [W/m2] |
Benchmark Period Mean (intersection) [W/m2] |
Benchmark Period Mean (complement) [W/m2] |
Bias [W/m2] |
RMSE [W/m2] |
Phase Shift [months] |
Bias Score [1] |
RMSE Score [1] |
Seasonal Cycle Score [1] |
Spatial Distribution Score [1] |
Interannual Variability Score [1] |
Overall Score [1] |
|||
|---|---|---|---|---|---|---|---|---|---|---|---|---|---|---|---|---|---|
| Benchmark | [-] | 204. | |||||||||||||||
| CLM5PHSOFF | [-] | 193. | 193. | 201. | 219. | -7.37 | 17.0 | 0.480 | 0.760 | 0.678 | 0.943 | 0.988 | 0.751 | 0.800 | |||
| CLM5PHSON | [-] | 192. | 192. | 201. | 219. | -6.91 | 16.8 | 0.470 | 0.768 | 0.678 | 0.943 | 0.986 | 0.754 | 0.801 |
Download Data |
Period Mean (original grids) [W/m2] |
Model Period Mean (intersection) [W/m2] |
Model Period Mean (complement) [W/m2] |
Benchmark Period Mean (intersection) [W/m2] |
Benchmark Period Mean (complement) [W/m2] |
Bias [W/m2] |
RMSE [W/m2] |
Phase Shift [months] |
Bias Score [1] |
RMSE Score [1] |
Seasonal Cycle Score [1] |
Spatial Distribution Score [1] |
Interannual Variability Score [1] |
Overall Score [1] |
|||
|---|---|---|---|---|---|---|---|---|---|---|---|---|---|---|---|---|---|
| Benchmark | [-] | 150. | |||||||||||||||
| CLM5PHSOFF | [-] | 145. | 145. | 148. | 192. | -3.12 | 14.2 | 0.274 | 0.929 | 0.790 | 0.982 | 0.994 | 0.710 | 0.866 | |||
| CLM5PHSON | [-] | 145. | 145. | 148. | 192. | -2.06 | 13.6 | 0.274 | 0.938 | 0.797 | 0.982 | 0.987 | 0.700 | 0.867 |
Download Data |
Period Mean (original grids) [W/m2] |
Model Period Mean (intersection) [W/m2] |
Model Period Mean (complement) [W/m2] |
Benchmark Period Mean (intersection) [W/m2] |
Benchmark Period Mean (complement) [W/m2] |
Bias [W/m2] |
RMSE [W/m2] |
Phase Shift [months] |
Bias Score [1] |
RMSE Score [1] |
Seasonal Cycle Score [1] |
Spatial Distribution Score [1] |
Interannual Variability Score [1] |
Overall Score [1] |
|||
|---|---|---|---|---|---|---|---|---|---|---|---|---|---|---|---|---|---|
| Benchmark | [-] | 110. | |||||||||||||||
| CLM5PHSOFF | [-] | 108. | 108. | 110. | 117. | -1.86 | 15.9 | 0.110 | 0.910 | 0.817 | 0.993 | 0.999 | 0.712 | 0.874 | |||
| CLM5PHSON | [-] | 111. | 111. | 110. | 117. | 1.63 | 13.7 | 0.114 | 0.925 | 0.840 | 0.992 | 0.999 | 0.676 | 0.879 |
Download Data |
Period Mean (original grids) [W/m2] |
Model Period Mean (intersection) [W/m2] |
Model Period Mean (complement) [W/m2] |
Benchmark Period Mean (intersection) [W/m2] |
Benchmark Period Mean (complement) [W/m2] |
Bias [W/m2] |
RMSE [W/m2] |
Phase Shift [months] |
Bias Score [1] |
RMSE Score [1] |
Seasonal Cycle Score [1] |
Spatial Distribution Score [1] |
Interannual Variability Score [1] |
Overall Score [1] |
|||
|---|---|---|---|---|---|---|---|---|---|---|---|---|---|---|---|---|---|
| Benchmark | [-] | 161. | |||||||||||||||
| CLM5PHSOFF | [-] | 158. | 158. | 161. | 163. | -3.08 | 14.7 | 0.214 | 0.928 | 0.818 | 0.986 | 0.994 | 0.720 | 0.877 | |||
| CLM5PHSON | [-] | 159. | 159. | 161. | 163. | -1.43 | 14.3 | 0.202 | 0.931 | 0.822 | 0.986 | 0.985 | 0.698 | 0.874 |
Download Data |
Period Mean (original grids) [W/m2] |
Model Period Mean (intersection) [W/m2] |
Model Period Mean (complement) [W/m2] |
Benchmark Period Mean (intersection) [W/m2] |
Benchmark Period Mean (complement) [W/m2] |
Bias [W/m2] |
RMSE [W/m2] |
Phase Shift [months] |
Bias Score [1] |
RMSE Score [1] |
Seasonal Cycle Score [1] |
Spatial Distribution Score [1] |
Interannual Variability Score [1] |
Overall Score [1] |
|||
|---|---|---|---|---|---|---|---|---|---|---|---|---|---|---|---|---|---|
| Benchmark | [-] | 179. | |||||||||||||||
| CLM5PHSOFF | [-] | 174. | 174. | 178. | 218. | -4.08 | 14.5 | 0.772 | 0.719 | 0.452 | 0.901 | 0.957 | 0.804 | 0.714 | |||
| CLM5PHSON | [-] | 173. | 173. | 178. | 218. | -3.71 | 14.5 | 0.798 | 0.732 | 0.449 | 0.896 | 0.956 | 0.805 | 0.714 |
Download Data |
Period Mean (original grids) [W/m2] |
Model Period Mean (intersection) [W/m2] |
Model Period Mean (complement) [W/m2] |
Benchmark Period Mean (intersection) [W/m2] |
Benchmark Period Mean (complement) [W/m2] |
Bias [W/m2] |
RMSE [W/m2] |
Phase Shift [months] |
Bias Score [1] |
RMSE Score [1] |
Seasonal Cycle Score [1] |
Spatial Distribution Score [1] |
Interannual Variability Score [1] |
Overall Score [1] |
|||
|---|---|---|---|---|---|---|---|---|---|---|---|---|---|---|---|---|---|
| Benchmark | [-] | 185. | |||||||||||||||
| CLM5PHSOFF | [-] | 179. | 179. | 184. | 202. | -5.01 | 16.0 | 0.635 | 0.803 | 0.644 | 0.924 | 0.974 | 0.713 | 0.784 | |||
| CLM5PHSON | [-] | 180. | 180. | 184. | 202. | -4.33 | 15.8 | 0.702 | 0.816 | 0.642 | 0.912 | 0.970 | 0.717 | 0.783 |
Download Data |
Period Mean (original grids) [W/m2] |
Model Period Mean (intersection) [W/m2] |
Model Period Mean (complement) [W/m2] |
Benchmark Period Mean (intersection) [W/m2] |
Benchmark Period Mean (complement) [W/m2] |
Bias [W/m2] |
RMSE [W/m2] |
Phase Shift [months] |
Bias Score [1] |
RMSE Score [1] |
Seasonal Cycle Score [1] |
Spatial Distribution Score [1] |
Interannual Variability Score [1] |
Overall Score [1] |
|||
|---|---|---|---|---|---|---|---|---|---|---|---|---|---|---|---|---|---|
| Benchmark | [-] | 178. | |||||||||||||||
| CLM5PHSOFF | [-] | 173. | 172. | 179. | 169. | -7.64 | 20.8 | 0.405 | 0.788 | 0.712 | 0.958 | 0.998 | 0.690 | 0.810 | |||
| CLM5PHSON | [-] | 176. | 175. | 179. | 169. | -8.13 | 21.0 | 0.401 | 0.784 | 0.713 | 0.958 | 0.998 | 0.686 | 0.808 |
Temporally integrated period mean