Mean State
Download Data |
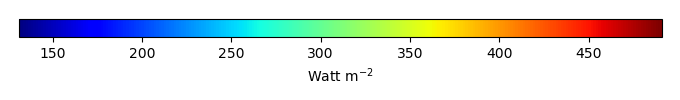
Period Mean (original grids) [Watt m-2] |
Model Period Mean (intersection) [Watt m-2] |
Model Period Mean (complement) [Watt m-2] |
Benchmark Period Mean (intersection) [Watt m-2] |
Benchmark Period Mean (complement) [Watt m-2] |
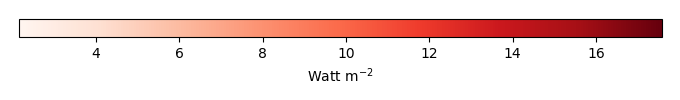
Bias [Watt m-2] |
RMSE [Watt m-2] |
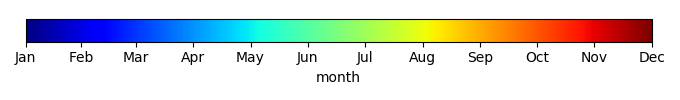
Phase Shift [months] |
Bias Score [1] |
RMSE Score [1] |
Seasonal Cycle Score [1] |
Spatial Distribution Score [1] |
Interannual Variability Score [1] |
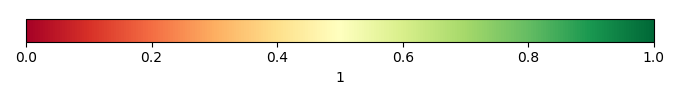
Overall Score [1] |
|||
|---|---|---|---|---|---|---|---|---|---|---|---|---|---|---|---|---|---|
| Benchmark | [-] | 453. | |||||||||||||||
| CLM5PHSOFF | [-] | 462. | 462. | 453. | 460. | 9.50 | 15.9 | 1.55 | 0.359 | 0.368 | 0.776 | 0.993 | 0.730 | 0.599 | |||
| CLM5PHSON | [-] | 462. | 462. | 453. | 460. | 9.34 | 15.7 | 1.72 | 0.344 | 0.372 | 0.753 | 0.988 | 0.715 | 0.591 |
Download Data |
Period Mean (original grids) [Watt m-2] |
Model Period Mean (intersection) [Watt m-2] |
Model Period Mean (complement) [Watt m-2] |
Benchmark Period Mean (intersection) [Watt m-2] |
Benchmark Period Mean (complement) [Watt m-2] |
Bias [Watt m-2] |
RMSE [Watt m-2] |
Phase Shift [months] |
Bias Score [1] |
RMSE Score [1] |
Seasonal Cycle Score [1] |
Spatial Distribution Score [1] |
Interannual Variability Score [1] |
Overall Score [1] |
|||
|---|---|---|---|---|---|---|---|---|---|---|---|---|---|---|---|---|---|
| Benchmark | [-] | 471. | |||||||||||||||
| CLM5PHSOFF | [-] | 482. | 482. | 471. | 456. | 10.5 | 20.6 | 0.623 | 0.556 | 0.523 | 0.954 | 0.913 | 0.738 | 0.701 | |||
| CLM5PHSON | [-] | 481. | 482. | 471. | 456. | 10.1 | 20.9 | 0.713 | 0.562 | 0.498 | 0.945 | 0.949 | 0.707 | 0.693 |
Download Data |
Period Mean (original grids) [Watt m-2] |
Model Period Mean (intersection) [Watt m-2] |
Model Period Mean (complement) [Watt m-2] |
Benchmark Period Mean (intersection) [Watt m-2] |
Benchmark Period Mean (complement) [Watt m-2] |
Bias [Watt m-2] |
RMSE [Watt m-2] |
Phase Shift [months] |
Bias Score [1] |
RMSE Score [1] |
Seasonal Cycle Score [1] |
Spatial Distribution Score [1] |
Interannual Variability Score [1] |
Overall Score [1] |
|||
|---|---|---|---|---|---|---|---|---|---|---|---|---|---|---|---|---|---|
| Benchmark | [-] | 443. | |||||||||||||||
| CLM5PHSOFF | [-] | 454. | 454. | 443. | 444. | 10.2 | 18.5 | 0.793 | 0.512 | 0.528 | 0.902 | 0.993 | 0.639 | 0.684 | |||
| CLM5PHSON | [-] | 451. | 451. | 443. | 444. | 7.63 | 17.9 | 1.14 | 0.566 | 0.494 | 0.853 | 0.988 | 0.608 | 0.667 |
Download Data |
Period Mean (original grids) [Watt m-2] |
Model Period Mean (intersection) [Watt m-2] |
Model Period Mean (complement) [Watt m-2] |
Benchmark Period Mean (intersection) [Watt m-2] |
Benchmark Period Mean (complement) [Watt m-2] |
Bias [Watt m-2] |
RMSE [Watt m-2] |
Phase Shift [months] |
Bias Score [1] |
RMSE Score [1] |
Seasonal Cycle Score [1] |
Spatial Distribution Score [1] |
Interannual Variability Score [1] |
Overall Score [1] |
|||
|---|---|---|---|---|---|---|---|---|---|---|---|---|---|---|---|---|---|
| Benchmark | [-] | 276. | |||||||||||||||
| CLM5PHSOFF | [-] | 278. | 278. | 275. | 292. | 3.71 | 15.7 | 0.0619 | 0.899 | 0.804 | 0.996 | 0.988 | 0.794 | 0.881 | |||
| CLM5PHSON | [-] | 275. | 275. | 275. | 292. | 3.64 | 16.0 | 0.0557 | 0.901 | 0.799 | 0.996 | 0.989 | 0.793 | 0.880 |
Download Data |
Period Mean (original grids) [Watt m-2] |
Model Period Mean (intersection) [Watt m-2] |
Model Period Mean (complement) [Watt m-2] |
Benchmark Period Mean (intersection) [Watt m-2] |
Benchmark Period Mean (complement) [Watt m-2] |
Bias [Watt m-2] |
RMSE [Watt m-2] |
Phase Shift [months] |
Bias Score [1] |
RMSE Score [1] |
Seasonal Cycle Score [1] |
Spatial Distribution Score [1] |
Interannual Variability Score [1] |
Overall Score [1] |
|||
|---|---|---|---|---|---|---|---|---|---|---|---|---|---|---|---|---|---|
| Benchmark | [-] | 456. | |||||||||||||||
| CLM5PHSOFF | [-] | 458. | 458. | 453. | 465. | 5.06 | 10.0 | 1.72 | 0.317 | 0.405 | 0.734 | 0.942 | 0.712 | 0.586 | |||
| CLM5PHSON | [-] | 458. | 458. | 453. | 465. | 5.84 | 10.1 | 1.76 | 0.314 | 0.411 | 0.732 | 0.934 | 0.717 | 0.587 |
Download Data |
Period Mean (original grids) [Watt m-2] |
Model Period Mean (intersection) [Watt m-2] |
Model Period Mean (complement) [Watt m-2] |
Benchmark Period Mean (intersection) [Watt m-2] |
Benchmark Period Mean (complement) [Watt m-2] |
Bias [Watt m-2] |
RMSE [Watt m-2] |
Phase Shift [months] |
Bias Score [1] |
RMSE Score [1] |
Seasonal Cycle Score [1] |
Spatial Distribution Score [1] |
Interannual Variability Score [1] |
Overall Score [1] |
|||
|---|---|---|---|---|---|---|---|---|---|---|---|---|---|---|---|---|---|
| Benchmark | [-] | 306. | |||||||||||||||
| CLM5PHSOFF | [-] | 317. | 317. | 306. | 329. | 11.4 | 15.4 | 0.0176 | 0.844 | 0.869 | 0.999 | 0.994 | 0.891 | 0.911 | |||
| CLM5PHSON | [-] | 316. | 315. | 306. | 329. | 10.1 | 14.8 | 0.0215 | 0.860 | 0.862 | 0.999 | 0.997 | 0.891 | 0.912 |
Download Data |
Period Mean (original grids) [Watt m-2] |
Model Period Mean (intersection) [Watt m-2] |
Model Period Mean (complement) [Watt m-2] |
Benchmark Period Mean (intersection) [Watt m-2] |
Benchmark Period Mean (complement) [Watt m-2] |
Bias [Watt m-2] |
RMSE [Watt m-2] |
Phase Shift [months] |
Bias Score [1] |
RMSE Score [1] |
Seasonal Cycle Score [1] |
Spatial Distribution Score [1] |
Interannual Variability Score [1] |
Overall Score [1] |
|||
|---|---|---|---|---|---|---|---|---|---|---|---|---|---|---|---|---|---|
| Benchmark | [-] | 362. | |||||||||||||||
| CLM5PHSOFF | [-] | 367. | 366. | 361. | 395. | 6.05 | 15.6 | 0.132 | 0.848 | 0.821 | 0.991 | 0.993 | 0.727 | 0.867 | |||
| CLM5PHSON | [-] | 364. | 363. | 361. | 395. | 4.75 | 15.4 | 0.151 | 0.860 | 0.817 | 0.990 | 0.991 | 0.730 | 0.867 |
Download Data |
Period Mean (original grids) [Watt m-2] |
Model Period Mean (intersection) [Watt m-2] |
Model Period Mean (complement) [Watt m-2] |
Benchmark Period Mean (intersection) [Watt m-2] |
Benchmark Period Mean (complement) [Watt m-2] |
Bias [Watt m-2] |
RMSE [Watt m-2] |
Phase Shift [months] |
Bias Score [1] |
RMSE Score [1] |
Seasonal Cycle Score [1] |
Spatial Distribution Score [1] |
Interannual Variability Score [1] |
Overall Score [1] |
|||
|---|---|---|---|---|---|---|---|---|---|---|---|---|---|---|---|---|---|
| Benchmark | [-] | 450. | |||||||||||||||
| CLM5PHSOFF | [-] | 456. | 456. | 450. | 463. | 6.85 | 18.2 | 0.649 | 0.613 | 0.571 | 0.936 | 1.00 | 0.637 | 0.721 | |||
| CLM5PHSON | [-] | 452. | 452. | 450. | 463. | 4.66 | 17.7 | 0.767 | 0.653 | 0.557 | 0.922 | 1.00 | 0.627 | 0.719 |
Download Data |
Period Mean (original grids) [Watt m-2] |
Model Period Mean (intersection) [Watt m-2] |
Model Period Mean (complement) [Watt m-2] |
Benchmark Period Mean (intersection) [Watt m-2] |
Benchmark Period Mean (complement) [Watt m-2] |
Bias [Watt m-2] |
RMSE [Watt m-2] |
Phase Shift [months] |
Bias Score [1] |
RMSE Score [1] |
Seasonal Cycle Score [1] |
Spatial Distribution Score [1] |
Interannual Variability Score [1] |
Overall Score [1] |
|||
|---|---|---|---|---|---|---|---|---|---|---|---|---|---|---|---|---|---|
| Benchmark | [-] | 275. | |||||||||||||||
| CLM5PHSOFF | [-] | 282. | 283. | 275. | 280. | 8.28 | 15.3 | 0.0348 | 0.870 | 0.821 | 0.997 | 0.995 | 0.848 | 0.892 | |||
| CLM5PHSON | [-] | 282. | 282. | 275. | 280. | 7.91 | 15.3 | 0.0355 | 0.875 | 0.817 | 0.997 | 0.996 | 0.851 | 0.892 |
Download Data |
Period Mean (original grids) [Watt m-2] |
Model Period Mean (intersection) [Watt m-2] |
Model Period Mean (complement) [Watt m-2] |
Benchmark Period Mean (intersection) [Watt m-2] |
Benchmark Period Mean (complement) [Watt m-2] |
Bias [Watt m-2] |
RMSE [Watt m-2] |
Phase Shift [months] |
Bias Score [1] |
RMSE Score [1] |
Seasonal Cycle Score [1] |
Spatial Distribution Score [1] |
Interannual Variability Score [1] |
Overall Score [1] |
|||
|---|---|---|---|---|---|---|---|---|---|---|---|---|---|---|---|---|---|
| Benchmark | [-] | 448. | |||||||||||||||
| CLM5PHSOFF | [-] | 447. | 448. | 450. | 423. | -1.97 | 14.5 | 0.320 | 0.772 | 0.712 | 0.975 | 0.991 | 0.710 | 0.812 | |||
| CLM5PHSON | [-] | 449. | 450. | 450. | 423. | -3.08 | 14.6 | 0.337 | 0.785 | 0.707 | 0.974 | 0.994 | 0.702 | 0.812 |
Download Data |
Period Mean (original grids) [Watt m-2] |
Model Period Mean (intersection) [Watt m-2] |
Model Period Mean (complement) [Watt m-2] |
Benchmark Period Mean (intersection) [Watt m-2] |
Benchmark Period Mean (complement) [Watt m-2] |
Bias [Watt m-2] |
RMSE [Watt m-2] |
Phase Shift [months] |
Bias Score [1] |
RMSE Score [1] |
Seasonal Cycle Score [1] |
Spatial Distribution Score [1] |
Interannual Variability Score [1] |
Overall Score [1] |
|||
|---|---|---|---|---|---|---|---|---|---|---|---|---|---|---|---|---|---|
| Benchmark | [-] | 364. | |||||||||||||||
| CLM5PHSOFF | [-] | 367. | 367. | 362. | 385. | 5.26 | 11.2 | 0.371 | 0.842 | 0.814 | 0.975 | 0.997 | 0.833 | 0.879 | |||
| CLM5PHSON | [-] | 363. | 363. | 362. | 385. | 3.66 | 10.8 | 0.476 | 0.859 | 0.809 | 0.968 | 0.993 | 0.830 | 0.878 |
Download Data |
Period Mean (original grids) [Watt m-2] |
Model Period Mean (intersection) [Watt m-2] |
Model Period Mean (complement) [Watt m-2] |
Benchmark Period Mean (intersection) [Watt m-2] |
Benchmark Period Mean (complement) [Watt m-2] |
Bias [Watt m-2] |
RMSE [Watt m-2] |
Phase Shift [months] |
Bias Score [1] |
RMSE Score [1] |
Seasonal Cycle Score [1] |
Spatial Distribution Score [1] |
Interannual Variability Score [1] |
Overall Score [1] |
|||
|---|---|---|---|---|---|---|---|---|---|---|---|---|---|---|---|---|---|
| Benchmark | [-] | 397. | |||||||||||||||
| CLM5PHSOFF | [-] | 382. | 382. | 376. | 406. | 5.66 | 16.6 | 0.466 | 0.685 | 0.690 | 0.949 | 0.999 | 0.744 | 0.793 | |||
| CLM5PHSON | [-] | 380. | 380. | 376. | 406. | 4.60 | 16.3 | 0.517 | 0.699 | 0.685 | 0.943 | 0.998 | 0.739 | 0.792 |
Download Data |
Period Mean (original grids) [Watt m-2] |
Model Period Mean (intersection) [Watt m-2] |
Model Period Mean (complement) [Watt m-2] |
Benchmark Period Mean (intersection) [Watt m-2] |
Benchmark Period Mean (complement) [Watt m-2] |
Bias [Watt m-2] |
RMSE [Watt m-2] |
Phase Shift [months] |
Bias Score [1] |
RMSE Score [1] |
Seasonal Cycle Score [1] |
Spatial Distribution Score [1] |
Interannual Variability Score [1] |
Overall Score [1] |
|||
|---|---|---|---|---|---|---|---|---|---|---|---|---|---|---|---|---|---|
| Benchmark | [-] | 464. | |||||||||||||||
| CLM5PHSOFF | [-] | 450. | 450. | 465. | 441. | -14.8 | 23.9 | 0.425 | 0.711 | 0.732 | 0.967 | 0.962 | 0.644 | 0.791 | |||
| CLM5PHSON | [-] | 450. | 449. | 465. | 441. | -15.4 | 24.1 | 0.443 | 0.709 | 0.731 | 0.965 | 0.973 | 0.645 | 0.792 |
Download Data |
Period Mean (original grids) [Watt m-2] |
Model Period Mean (intersection) [Watt m-2] |
Model Period Mean (complement) [Watt m-2] |
Benchmark Period Mean (intersection) [Watt m-2] |
Benchmark Period Mean (complement) [Watt m-2] |
Bias [Watt m-2] |
RMSE [Watt m-2] |
Phase Shift [months] |
Bias Score [1] |
RMSE Score [1] |
Seasonal Cycle Score [1] |
Spatial Distribution Score [1] |
Interannual Variability Score [1] |
Overall Score [1] |
|||
|---|---|---|---|---|---|---|---|---|---|---|---|---|---|---|---|---|---|
| Benchmark | [-] | 278. | |||||||||||||||
| CLM5PHSOFF | [-] | 286. | 286. | 277. | 289. | 8.73 | 14.5 | 0.0610 | 0.853 | 0.834 | 0.996 | 0.994 | 0.814 | 0.888 | |||
| CLM5PHSON | [-] | 285. | 285. | 277. | 289. | 8.39 | 14.5 | 0.0541 | 0.857 | 0.830 | 0.996 | 0.995 | 0.817 | 0.887 |
Download Data |
Period Mean (original grids) [Watt m-2] |
Model Period Mean (intersection) [Watt m-2] |
Model Period Mean (complement) [Watt m-2] |
Benchmark Period Mean (intersection) [Watt m-2] |
Benchmark Period Mean (complement) [Watt m-2] |
Bias [Watt m-2] |
RMSE [Watt m-2] |
Phase Shift [months] |
Bias Score [1] |
RMSE Score [1] |
Seasonal Cycle Score [1] |
Spatial Distribution Score [1] |
Interannual Variability Score [1] |
Overall Score [1] |
|||
|---|---|---|---|---|---|---|---|---|---|---|---|---|---|---|---|---|---|
| Benchmark | [-] | 444. | |||||||||||||||
| CLM5PHSOFF | [-] | 452. | 452. | 442. | 455. | 9.58 | 15.4 | 0.563 | 0.521 | 0.583 | 0.940 | 0.991 | 0.718 | 0.723 | |||
| CLM5PHSON | [-] | 446. | 446. | 442. | 455. | 7.88 | 14.4 | 0.674 | 0.552 | 0.584 | 0.934 | 0.989 | 0.719 | 0.727 |
Download Data |
Period Mean (original grids) [Watt m-2] |
Model Period Mean (intersection) [Watt m-2] |
Model Period Mean (complement) [Watt m-2] |
Benchmark Period Mean (intersection) [Watt m-2] |
Benchmark Period Mean (complement) [Watt m-2] |
Bias [Watt m-2] |
RMSE [Watt m-2] |
Phase Shift [months] |
Bias Score [1] |
RMSE Score [1] |
Seasonal Cycle Score [1] |
Spatial Distribution Score [1] |
Interannual Variability Score [1] |
Overall Score [1] |
|||
|---|---|---|---|---|---|---|---|---|---|---|---|---|---|---|---|---|---|
| Benchmark | [-] | 386. | |||||||||||||||
| CLM5PHSOFF | [-] | 395. | 395. | 384. | 429. | 11.1 | 13.7 | 0.170 | 0.785 | 0.864 | 0.988 | 1.00 | 0.869 | 0.895 | |||
| CLM5PHSON | [-] | 390. | 390. | 384. | 429. | 8.58 | 11.9 | 0.176 | 0.825 | 0.859 | 0.988 | 1.00 | 0.865 | 0.899 |
Download Data |
Period Mean (original grids) [Watt m-2] |
Model Period Mean (intersection) [Watt m-2] |
Model Period Mean (complement) [Watt m-2] |
Benchmark Period Mean (intersection) [Watt m-2] |
Benchmark Period Mean (complement) [Watt m-2] |
Bias [Watt m-2] |
RMSE [Watt m-2] |
Phase Shift [months] |
Bias Score [1] |
RMSE Score [1] |
Seasonal Cycle Score [1] |
Spatial Distribution Score [1] |
Interannual Variability Score [1] |
Overall Score [1] |
|||
|---|---|---|---|---|---|---|---|---|---|---|---|---|---|---|---|---|---|
| Benchmark | [-] | 319. | |||||||||||||||
| CLM5PHSOFF | [-] | 330. | 330. | 318. | 343. | 11.8 | 15.5 | 0.0938 | 0.810 | 0.844 | 0.994 | 0.996 | 0.843 | 0.889 | |||
| CLM5PHSON | [-] | 327. | 327. | 318. | 343. | 10.1 | 14.6 | 0.138 | 0.832 | 0.838 | 0.991 | 0.990 | 0.839 | 0.888 |
Download Data |
Period Mean (original grids) [Watt m-2] |
Model Period Mean (intersection) [Watt m-2] |
Model Period Mean (complement) [Watt m-2] |
Benchmark Period Mean (intersection) [Watt m-2] |
Benchmark Period Mean (complement) [Watt m-2] |
Bias [Watt m-2] |
RMSE [Watt m-2] |
Phase Shift [months] |
Bias Score [1] |
RMSE Score [1] |
Seasonal Cycle Score [1] |
Spatial Distribution Score [1] |
Interannual Variability Score [1] |
Overall Score [1] |
|||
|---|---|---|---|---|---|---|---|---|---|---|---|---|---|---|---|---|---|
| Benchmark | [-] | 376. | |||||||||||||||
| CLM5PHSOFF | [-] | 382. | 383. | 376. | 379. | 7.05 | 16.4 | 0.0962 | 0.840 | 0.804 | 0.993 | 0.978 | 0.715 | 0.856 | |||
| CLM5PHSON | [-] | 380. | 381. | 376. | 379. | 5.26 | 16.3 | 0.108 | 0.854 | 0.798 | 0.993 | 0.979 | 0.711 | 0.856 |
Download Data |
Period Mean (original grids) [Watt m-2] |
Model Period Mean (intersection) [Watt m-2] |
Model Period Mean (complement) [Watt m-2] |
Benchmark Period Mean (intersection) [Watt m-2] |
Benchmark Period Mean (complement) [Watt m-2] |
Bias [Watt m-2] |
RMSE [Watt m-2] |
Phase Shift [months] |
Bias Score [1] |
RMSE Score [1] |
Seasonal Cycle Score [1] |
Spatial Distribution Score [1] |
Interannual Variability Score [1] |
Overall Score [1] |
|||
|---|---|---|---|---|---|---|---|---|---|---|---|---|---|---|---|---|---|
| Benchmark | [-] | 449. | |||||||||||||||
| CLM5PHSOFF | [-] | 458. | 458. | 449. | 458. | 8.49 | 14.1 | 1.23 | 0.433 | 0.392 | 0.824 | 0.889 | 0.650 | 0.596 | |||
| CLM5PHSON | [-] | 457. | 457. | 449. | 458. | 7.86 | 13.4 | 1.25 | 0.424 | 0.399 | 0.822 | 0.935 | 0.629 | 0.601 |
Download Data |
Period Mean (original grids) [Watt m-2] |
Model Period Mean (intersection) [Watt m-2] |
Model Period Mean (complement) [Watt m-2] |
Benchmark Period Mean (intersection) [Watt m-2] |
Benchmark Period Mean (complement) [Watt m-2] |
Bias [Watt m-2] |
RMSE [Watt m-2] |
Phase Shift [months] |
Bias Score [1] |
RMSE Score [1] |
Seasonal Cycle Score [1] |
Spatial Distribution Score [1] |
Interannual Variability Score [1] |
Overall Score [1] |
|||
|---|---|---|---|---|---|---|---|---|---|---|---|---|---|---|---|---|---|
| Benchmark | [-] | 440. | |||||||||||||||
| CLM5PHSOFF | [-] | 450. | 450. | 440. | 430. | 9.16 | 13.9 | 0.681 | 0.606 | 0.610 | 0.908 | 0.981 | 0.762 | 0.746 | |||
| CLM5PHSON | [-] | 448. | 448. | 440. | 430. | 6.99 | 12.9 | 0.794 | 0.659 | 0.605 | 0.895 | 0.980 | 0.735 | 0.746 |
Download Data |
Period Mean (original grids) [Watt m-2] |
Model Period Mean (intersection) [Watt m-2] |
Model Period Mean (complement) [Watt m-2] |
Benchmark Period Mean (intersection) [Watt m-2] |
Benchmark Period Mean (complement) [Watt m-2] |
Bias [Watt m-2] |
RMSE [Watt m-2] |
Phase Shift [months] |
Bias Score [1] |
RMSE Score [1] |
Seasonal Cycle Score [1] |
Spatial Distribution Score [1] |
Interannual Variability Score [1] |
Overall Score [1] |
|||
|---|---|---|---|---|---|---|---|---|---|---|---|---|---|---|---|---|---|
| Benchmark | [-] | 387. | |||||||||||||||
| CLM5PHSOFF | [-] | 390. | 389. | 386. | 394. | 2.60 | 17.2 | 0.562 | 0.613 | 0.628 | 0.941 | 0.998 | 0.702 | 0.752 | |||
| CLM5PHSON | [-] | 387. | 386. | 386. | 394. | 0.770 | 16.4 | 0.562 | 0.638 | 0.632 | 0.940 | 0.997 | 0.707 | 0.758 |
Temporally integrated period mean