
clm50_r270_1deg_GSWP3V1_iso_newpopd_hist
and
clm50_r267_1deg_GSWP3V1_iso_hist
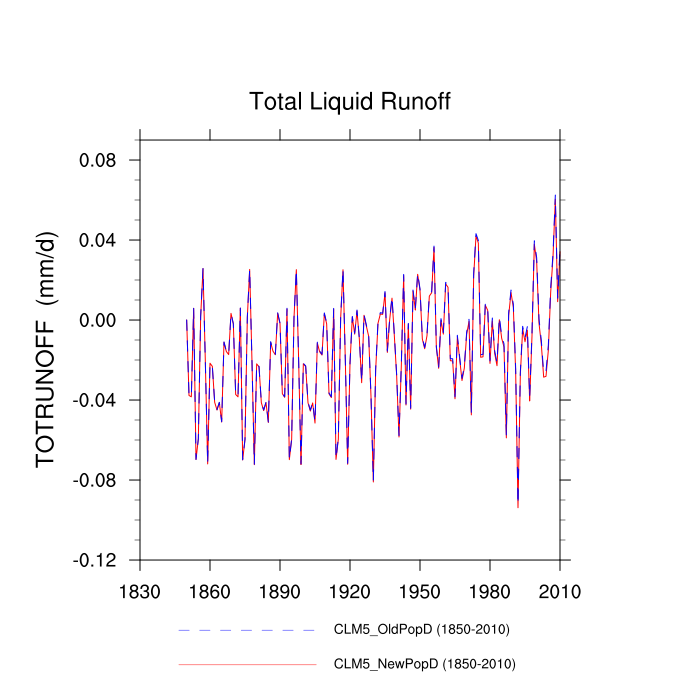
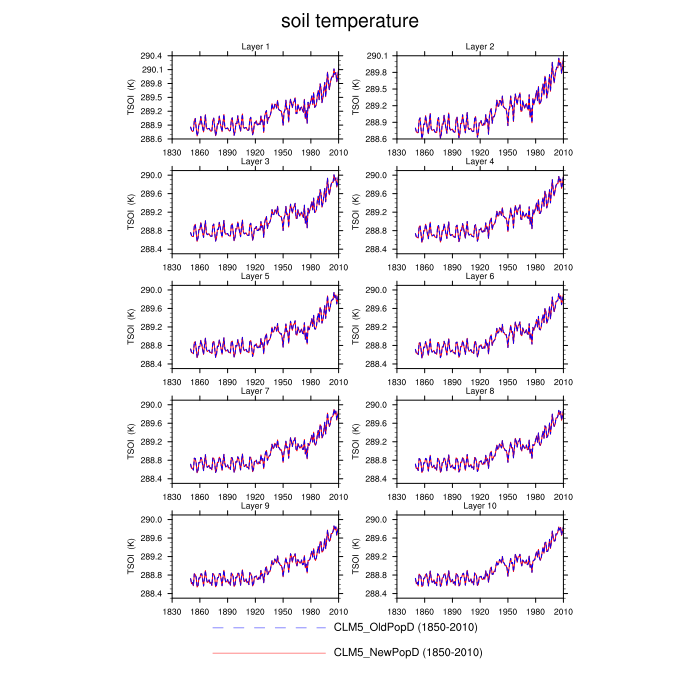
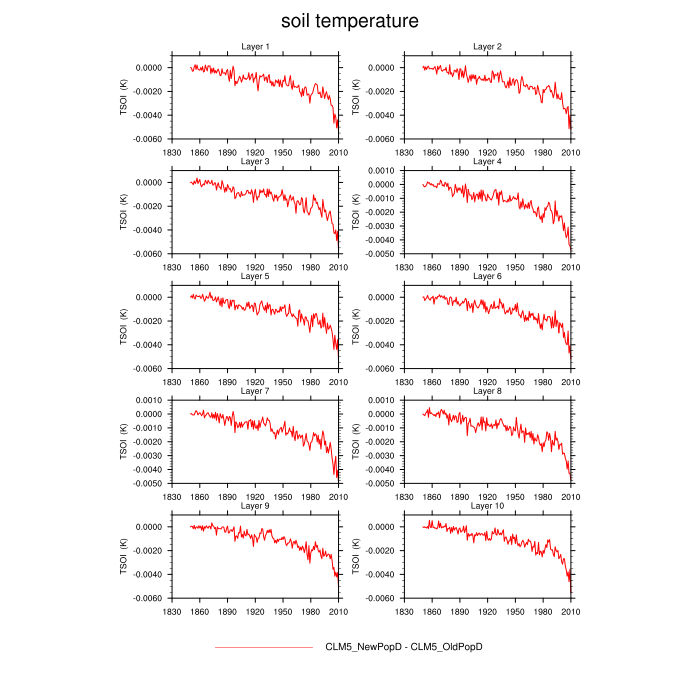
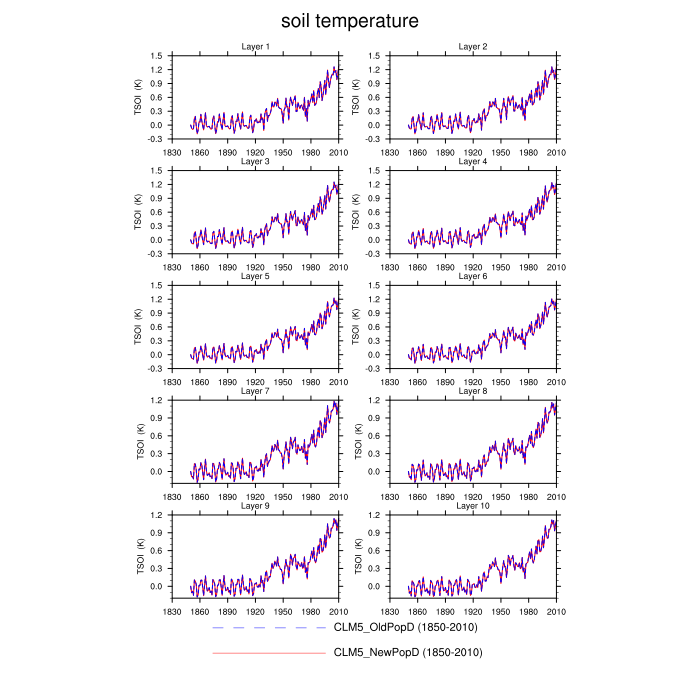
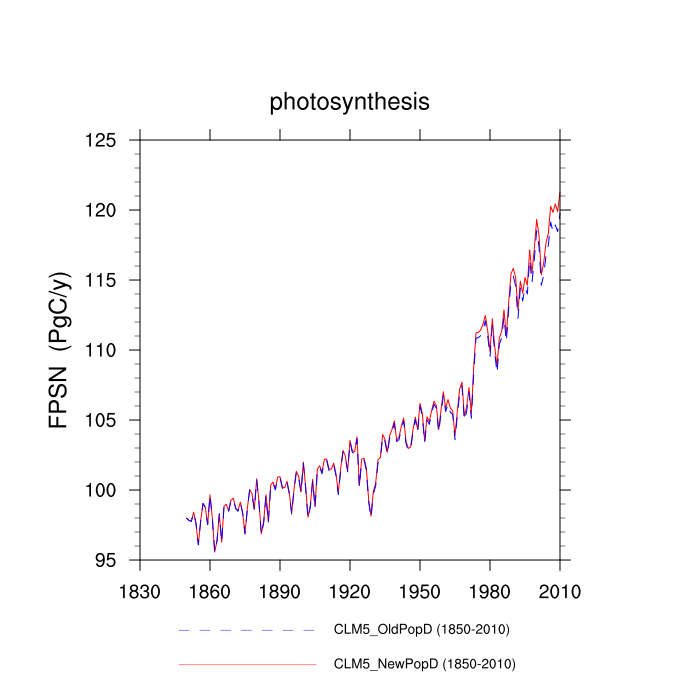
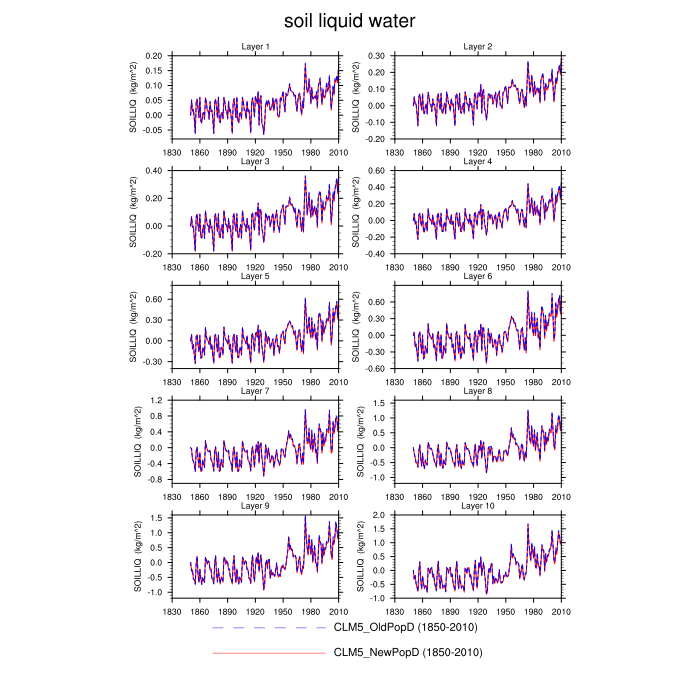
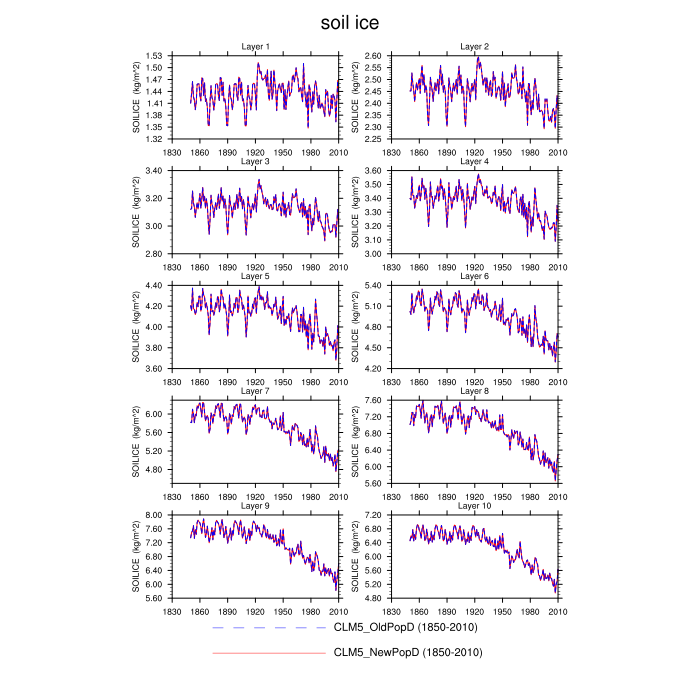
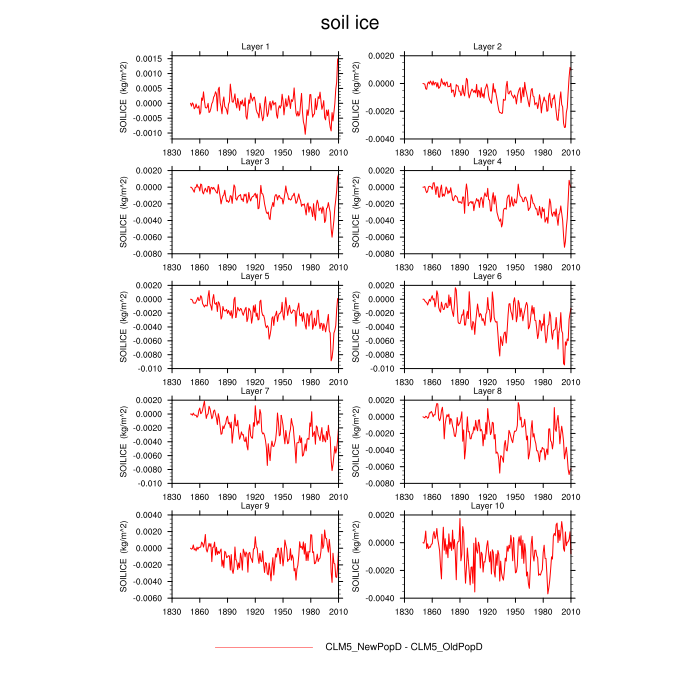
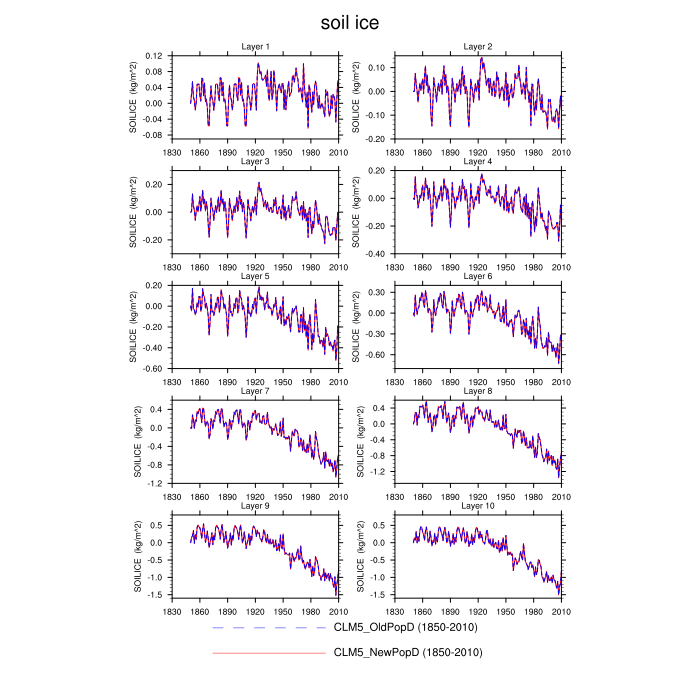
Set 1 Description: Line plots of annual trends in energy balance, soil water/ice and temperature, runoff, snow water/ice, photosynthesis
Lookup Table: Set 1 Variable Definition
| Trend | Difference | Anomaly | |||
|---|---|---|---|---|---|
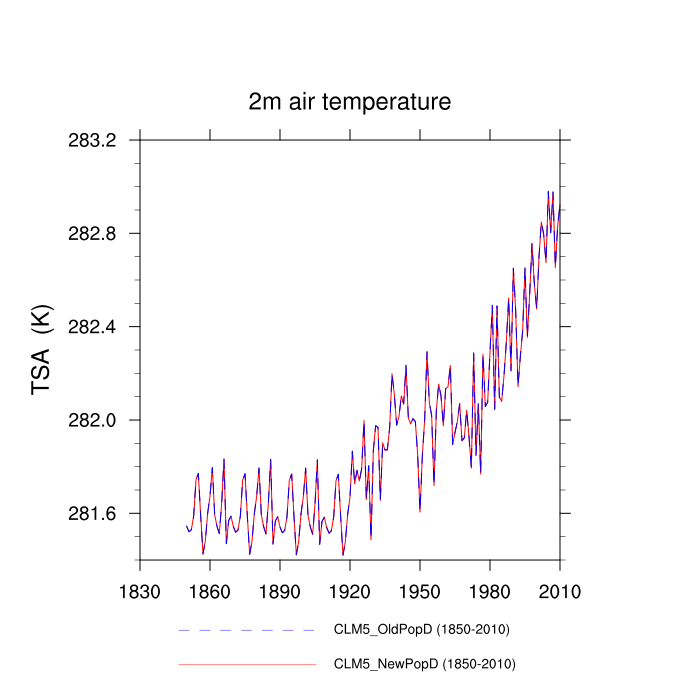
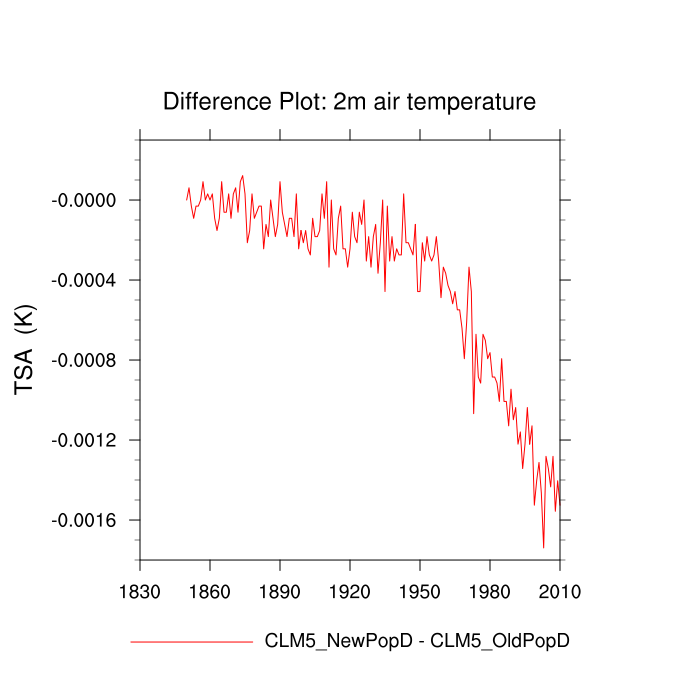
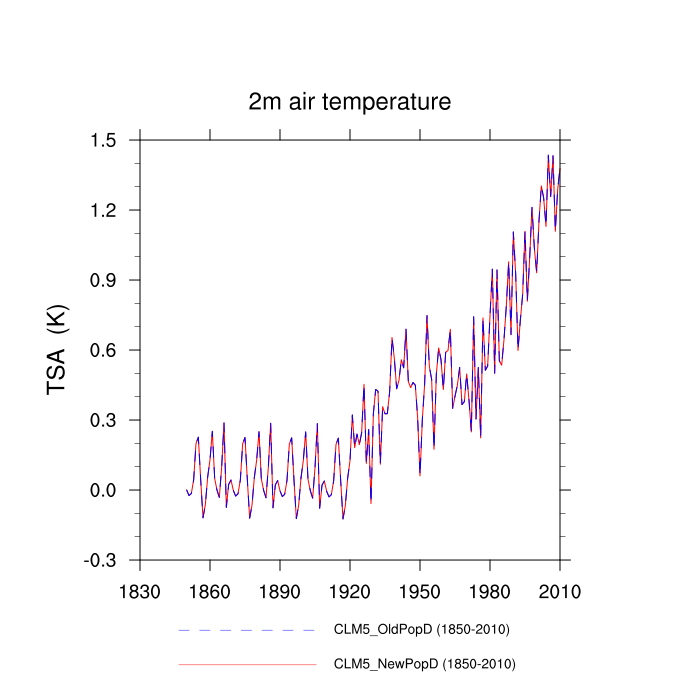
| 2m air temperature (TSA) | TrendPlot | DifferencePlot | AnomalyPlot | ||
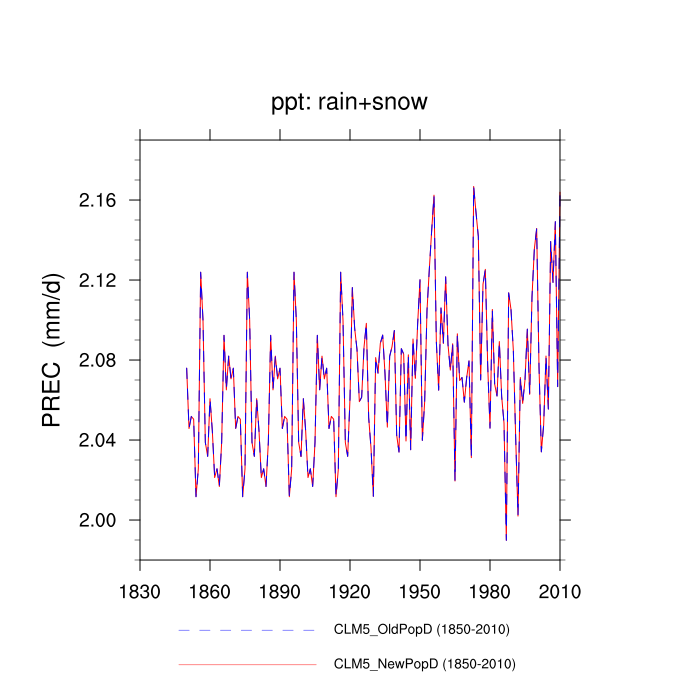
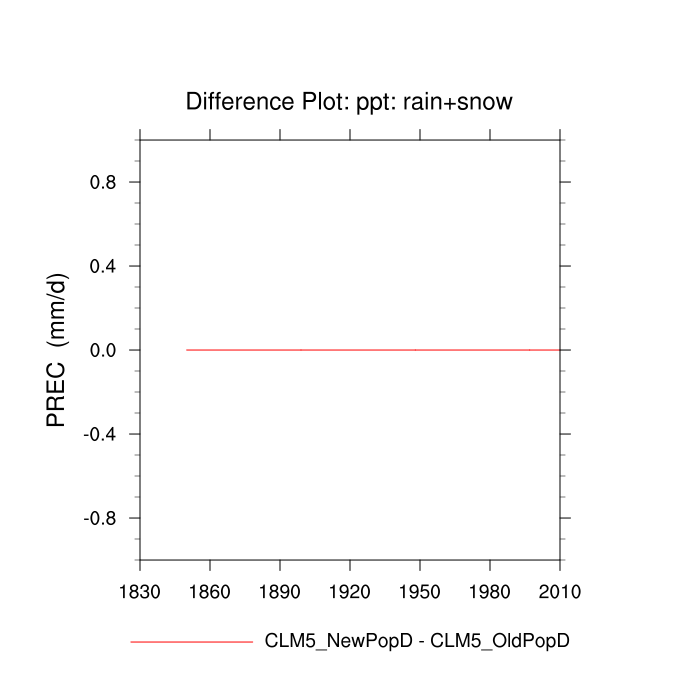
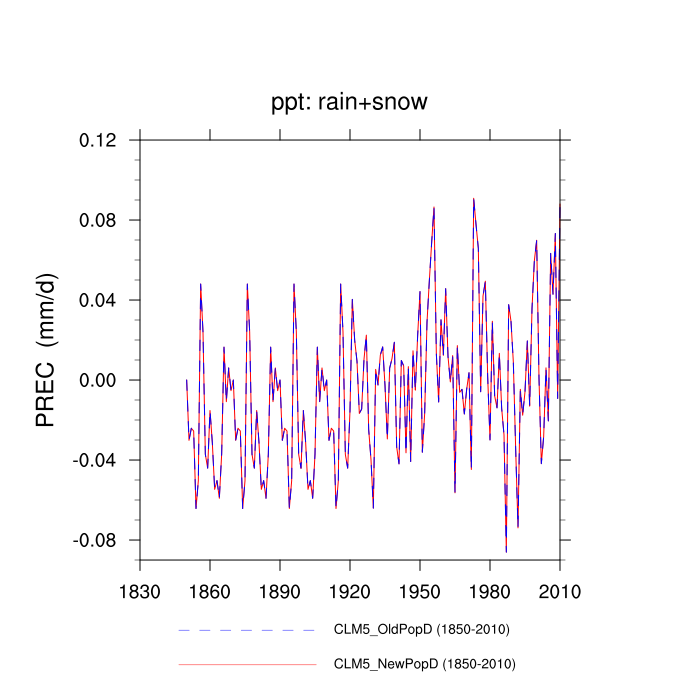
| ppt: rain+snow (PREC) | TrendPlot | DifferencePlot | AnomalyPlot | ||
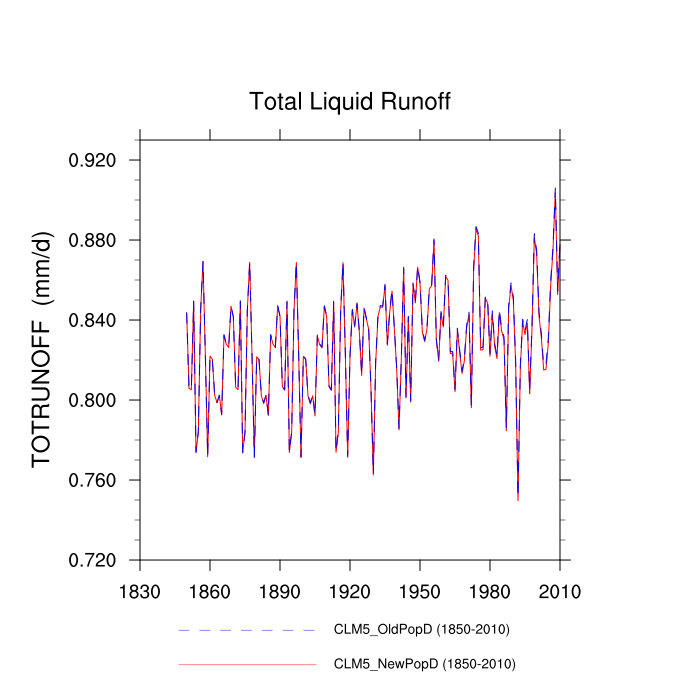
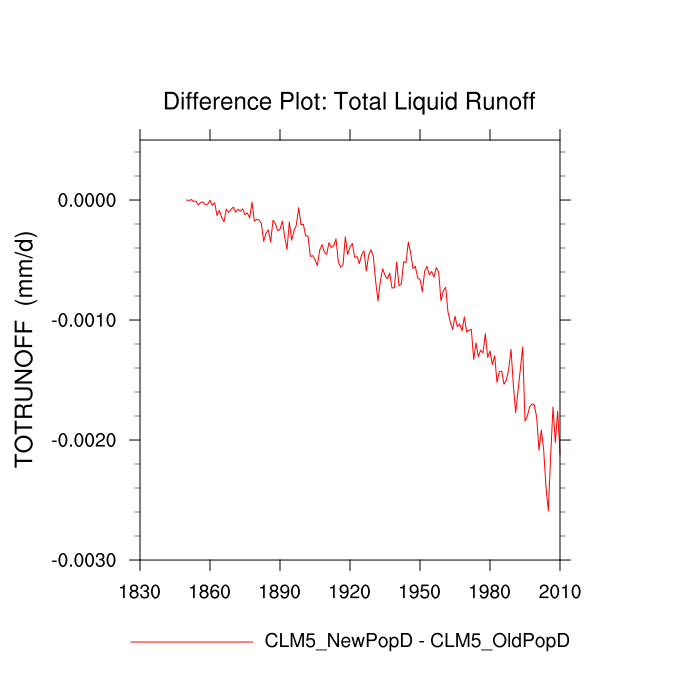
| Total Liquid Runoff (TOTRUNOFF) | TrendPlot | DifferencePlot | AnomalyPlot | ||
| soil temperature: layers 1,5,10 (TSOI) | TrendPlot | DifferencePlot | AnomalyPlot | ||
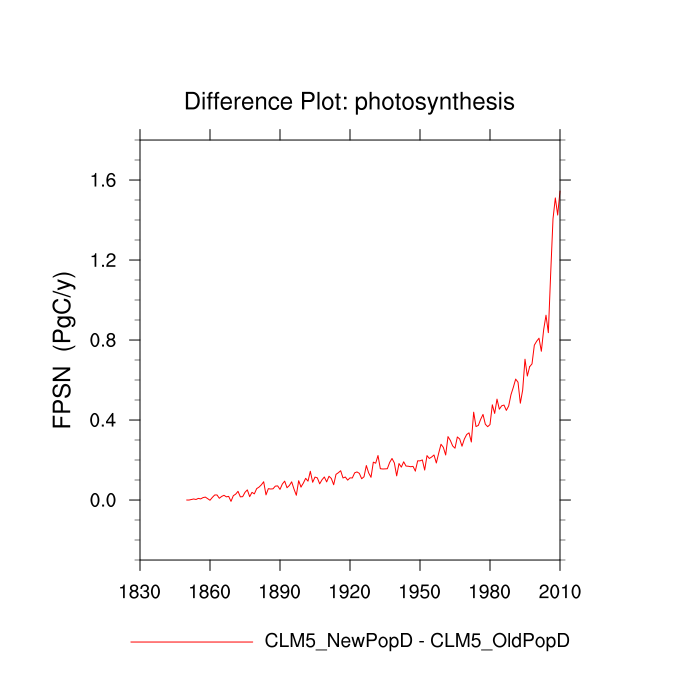
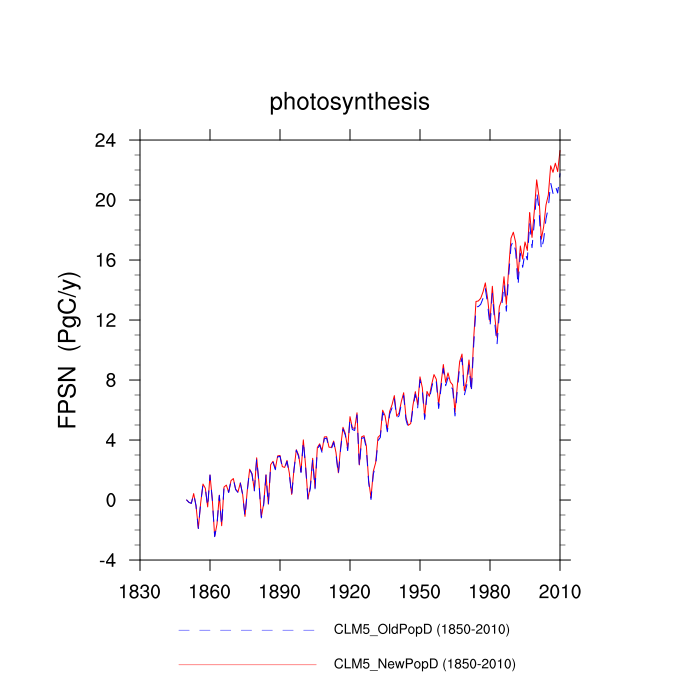
| photosynthesis (FPSN) | TrendPlot | DifferencePlot | AnomalyPlot | ||
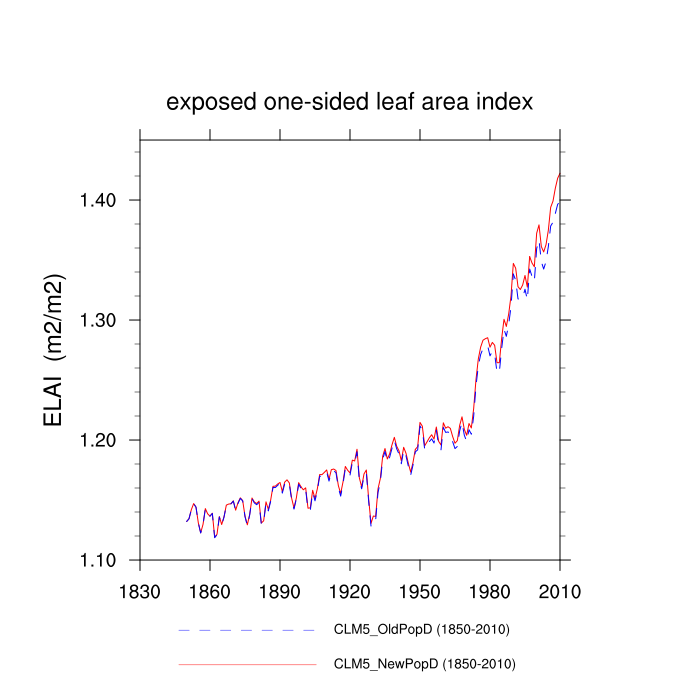
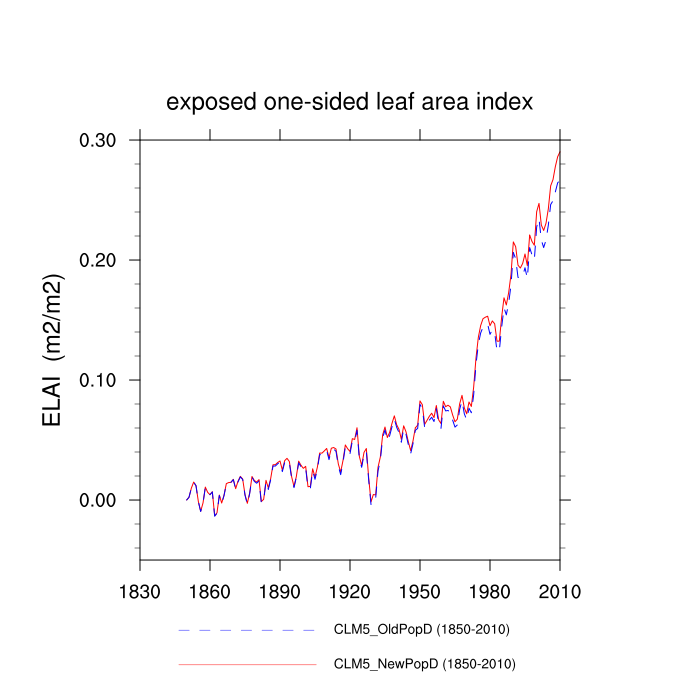
| exposed one-sided leaf area index (ELAI) | TrendPlot | DifferencePlot | AnomalyPlot | ||
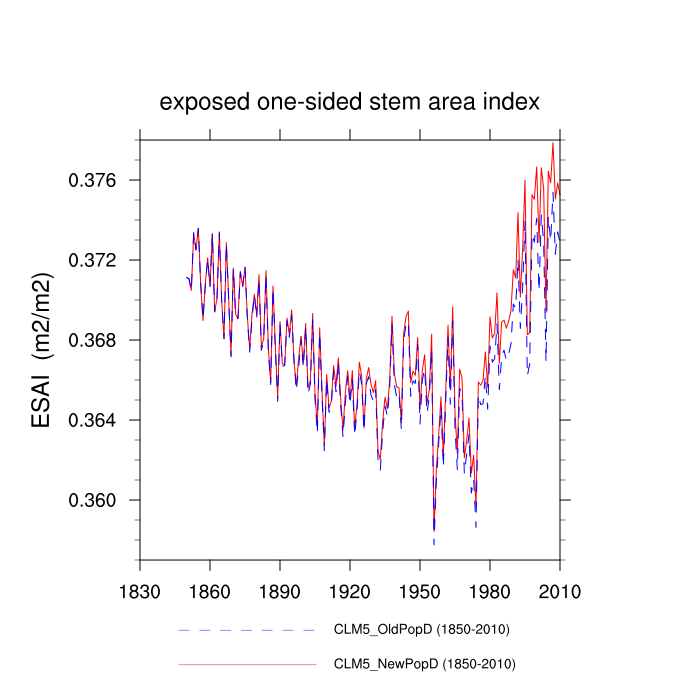
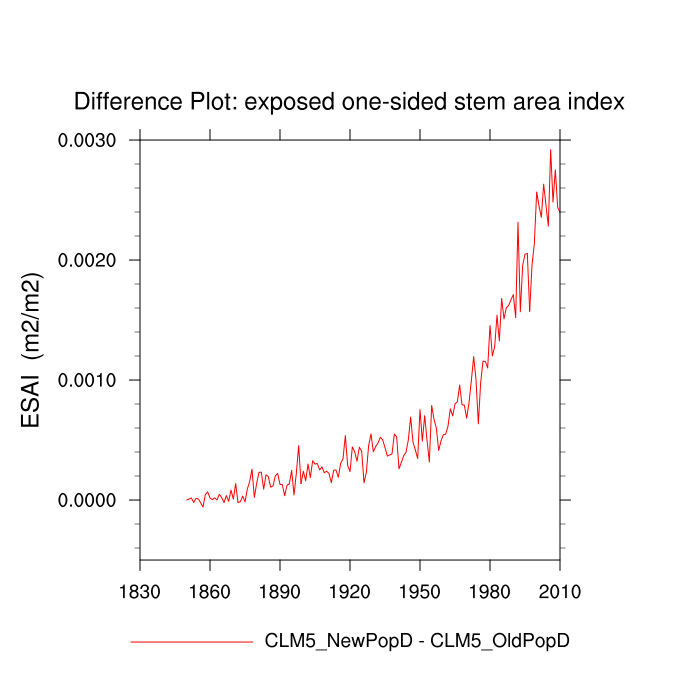
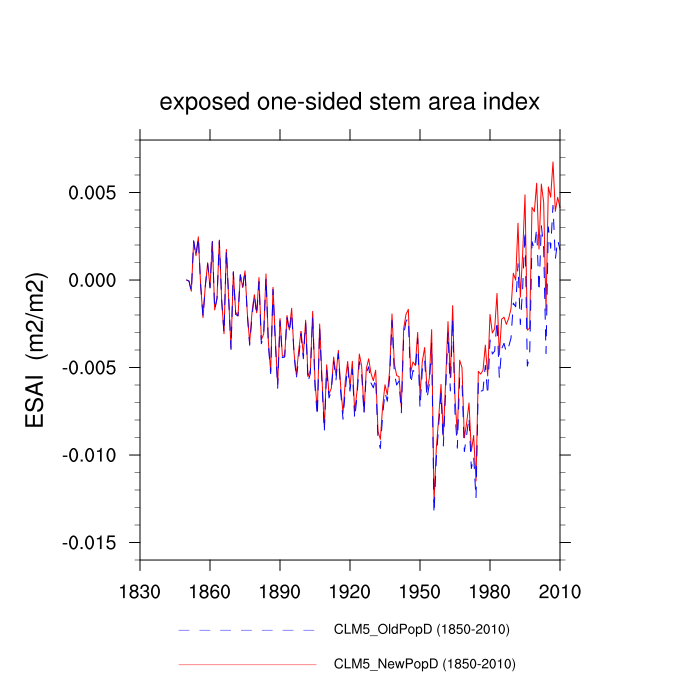
| exposed one-sided stem area index (ESAI) | TrendPlot | DifferencePlot | AnomalyPlot | ||
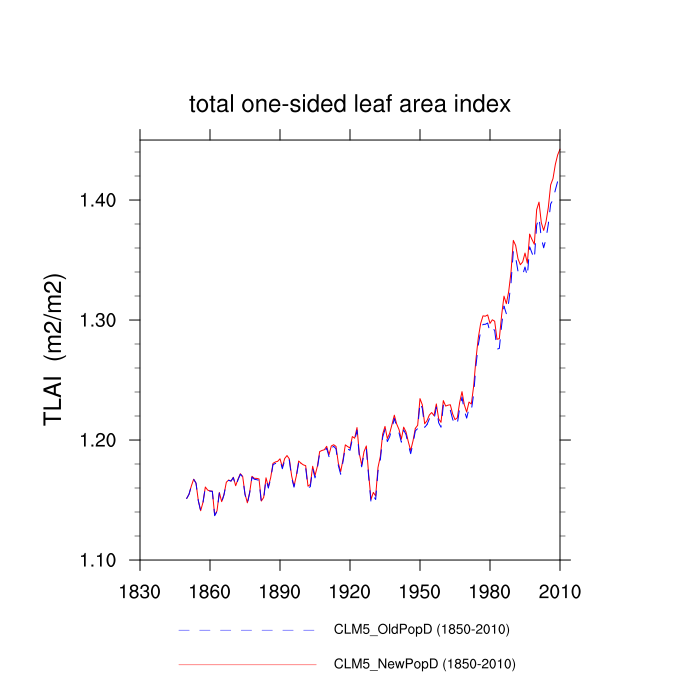
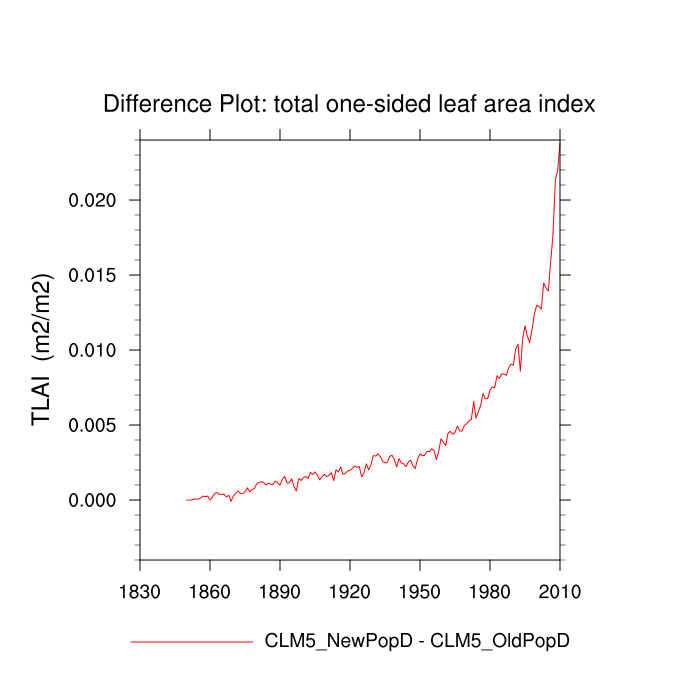
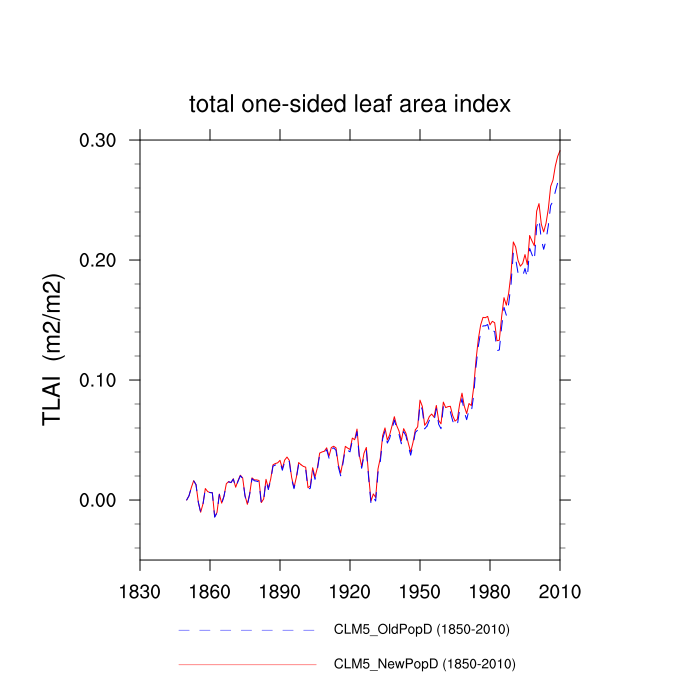
| total one-sided leaf area index (TLAI) | TrendPlot | DifferencePlot | AnomalyPlot | ||
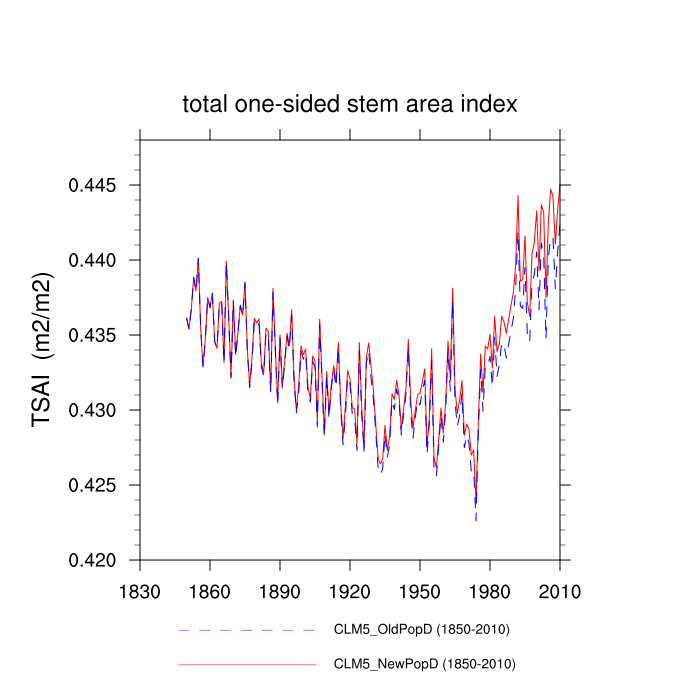
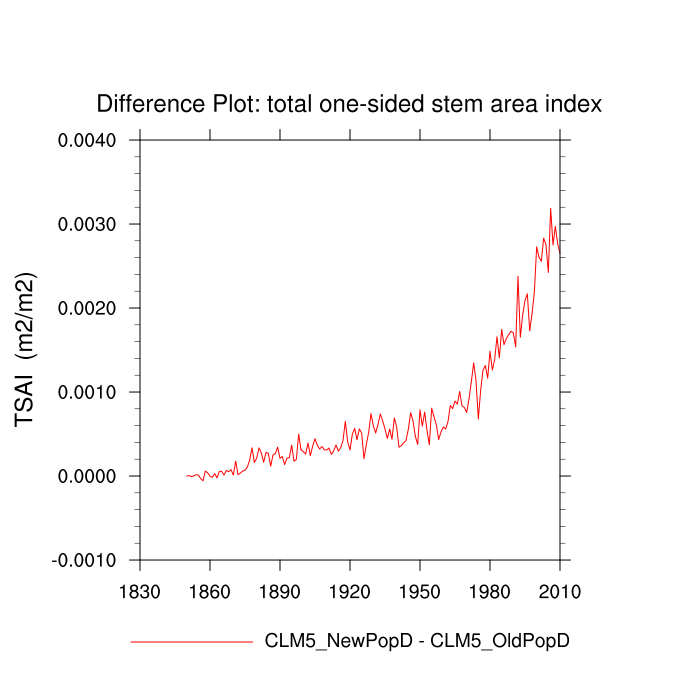
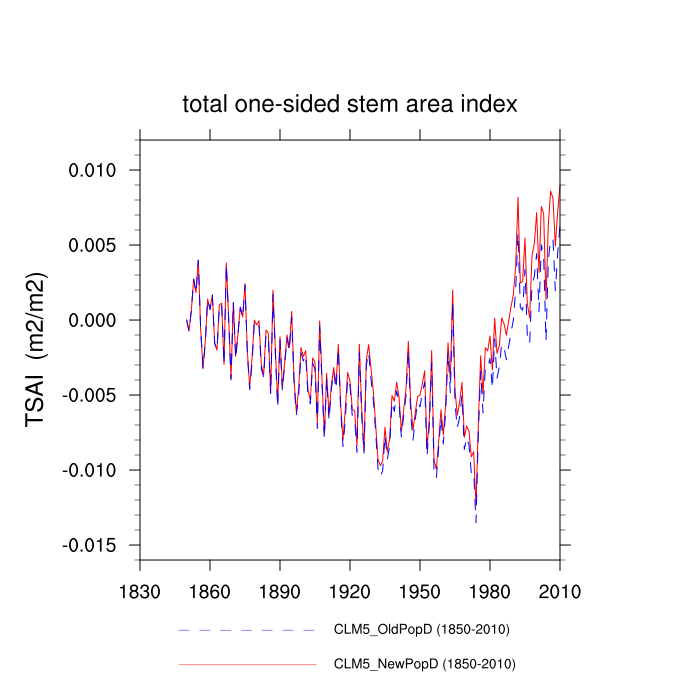
| total one-sided stem area index (TSAI) | TrendPlot | DifferencePlot | AnomalyPlot | ||
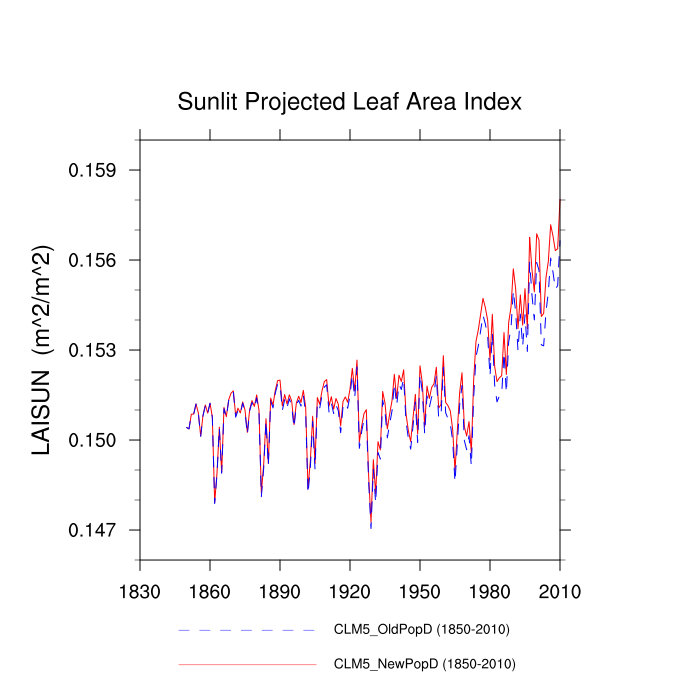
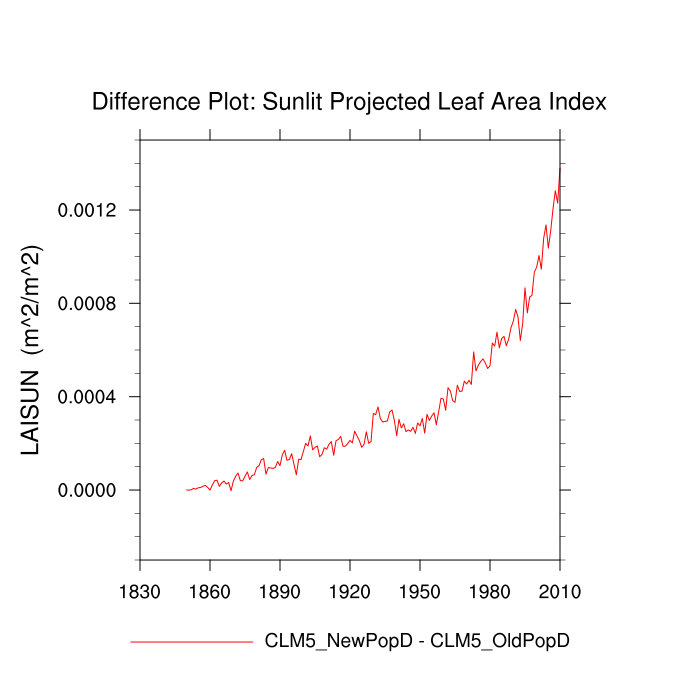
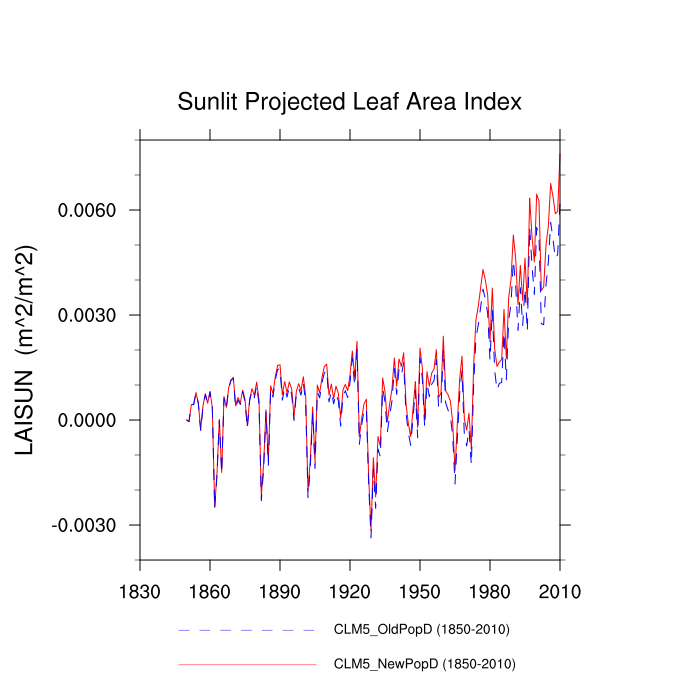
| Sunlit Projected Leaf Area Index (LAISUN) | TrendPlot | DifferencePlot | AnomalyPlot | ||
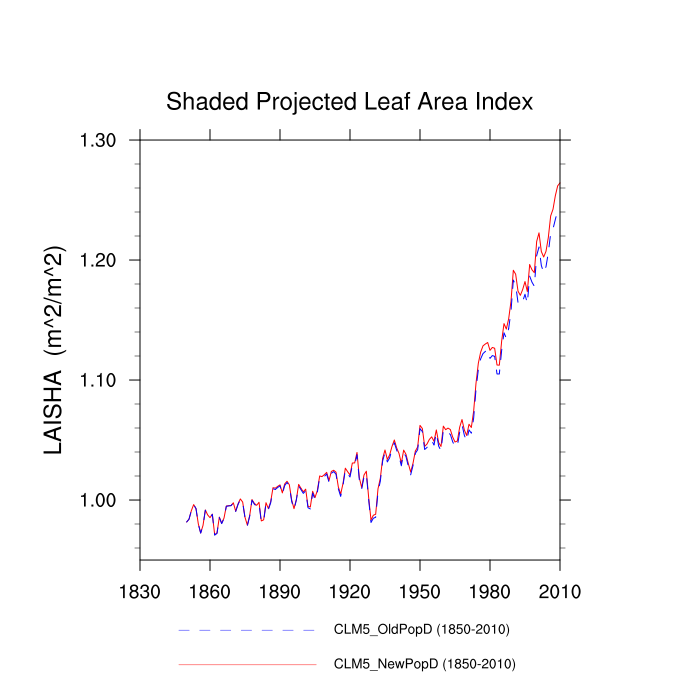
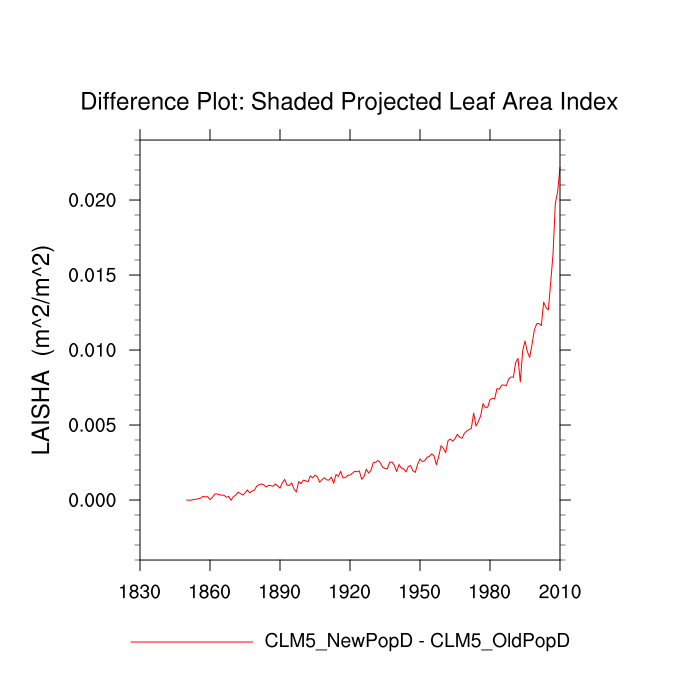
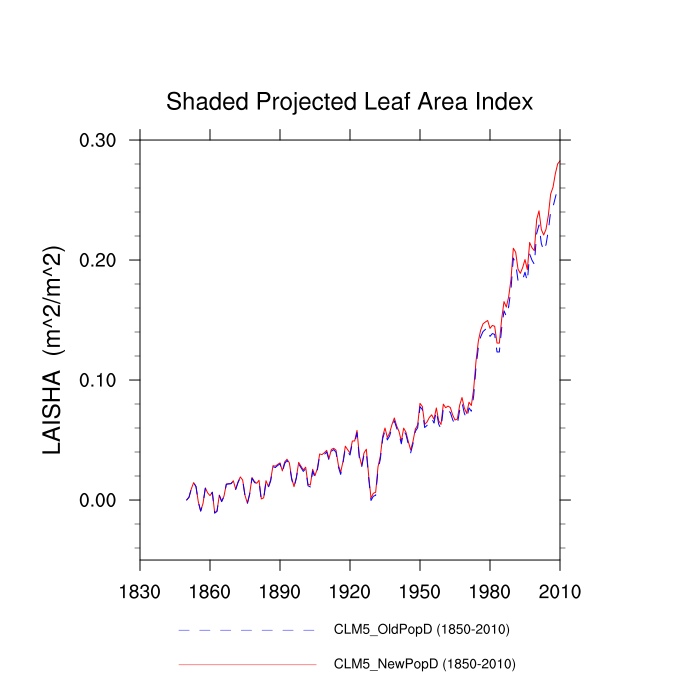
| Shaded Projected Leaf Area Index (LAISHA) | TrendPlot | DifferencePlot | AnomalyPlot | ||
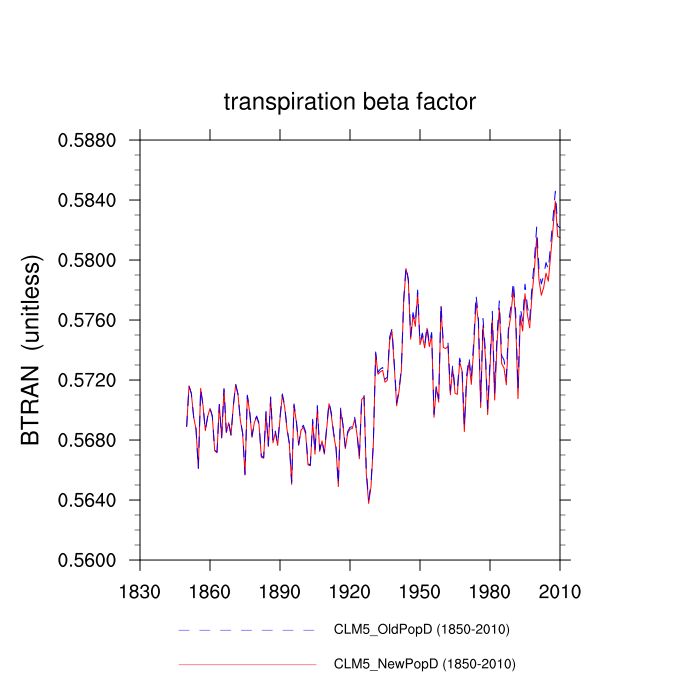
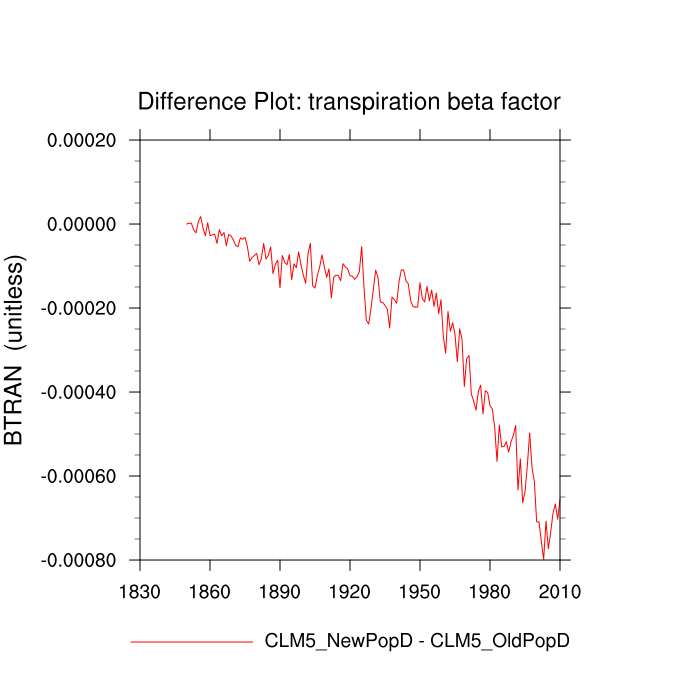
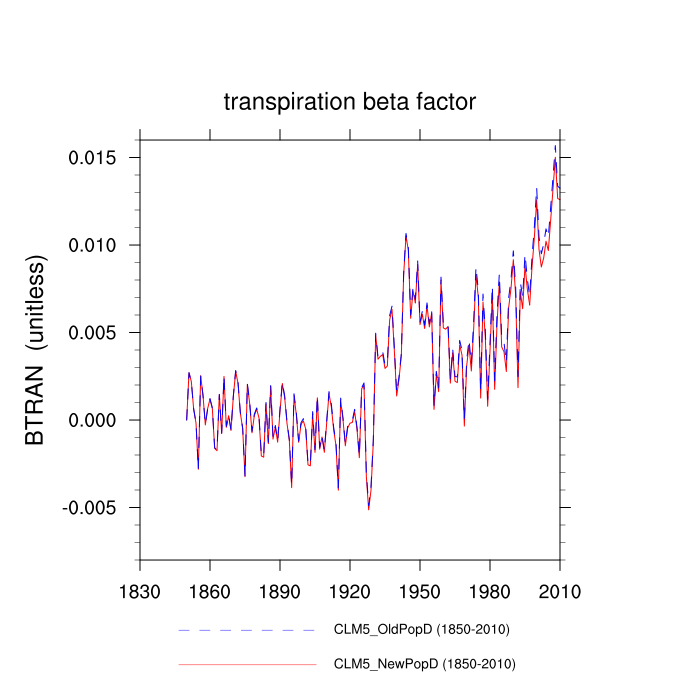
| transpiration beta factor (BTRAN) | TrendPlot | DifferencePlot | AnomalyPlot | ||
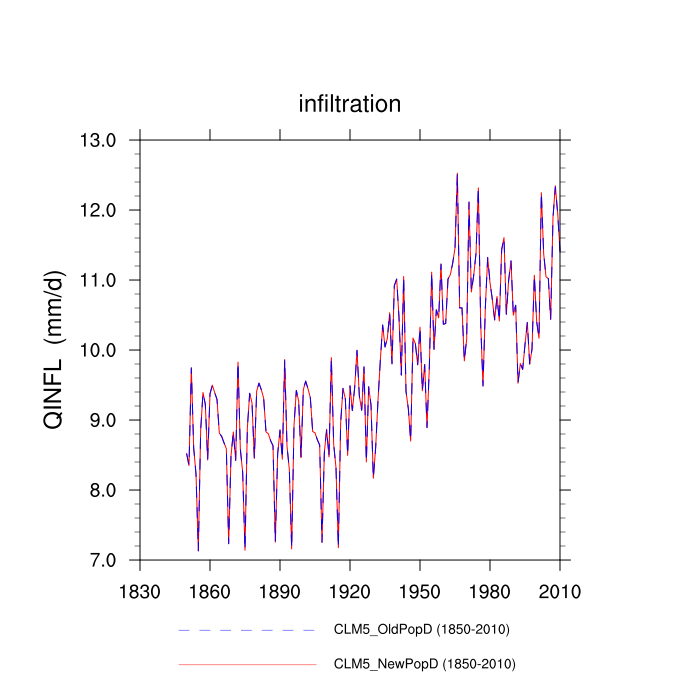
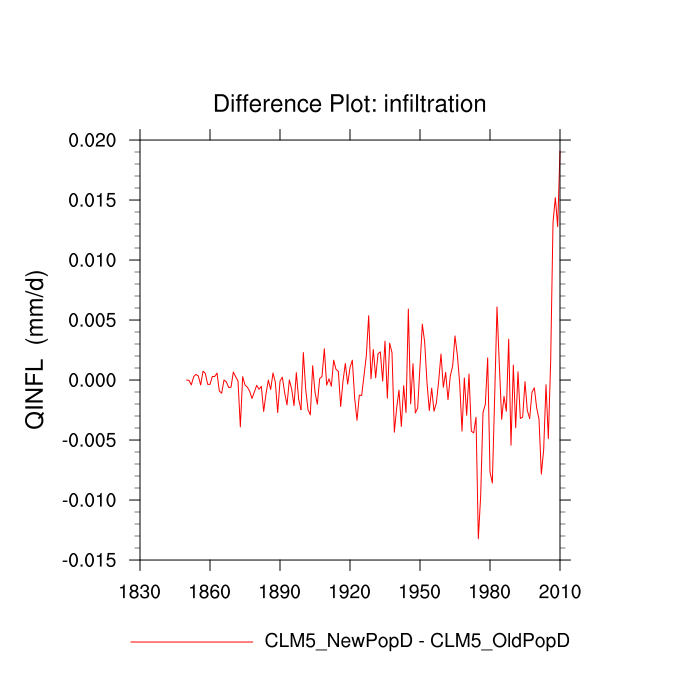
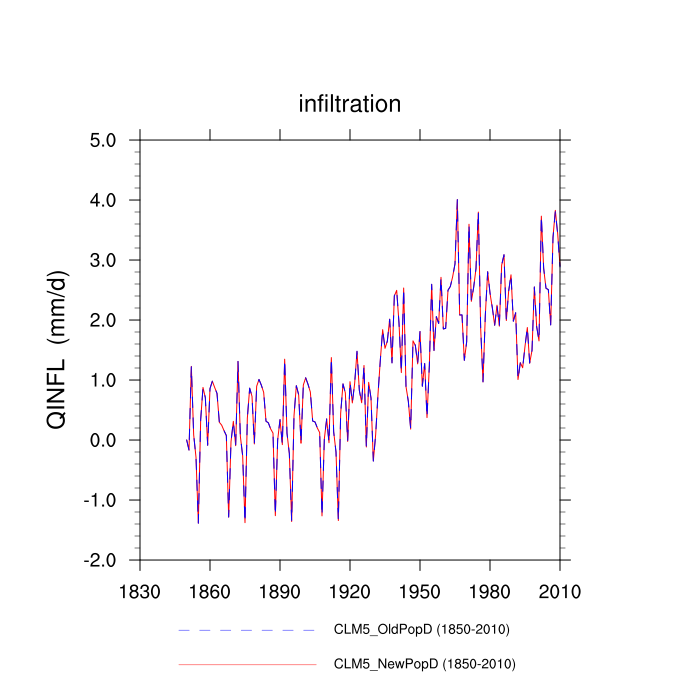
| infiltration (QINFL) | TrendPlot | DifferencePlot | AnomalyPlot | ||
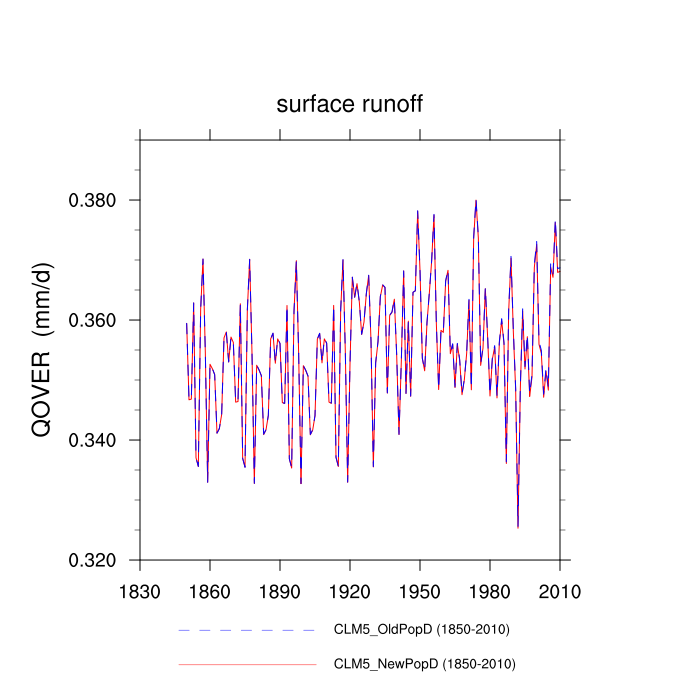
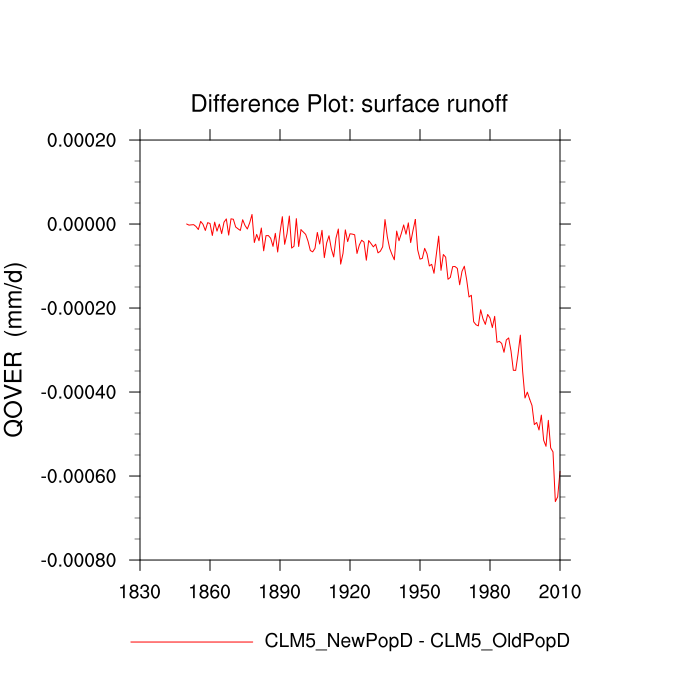
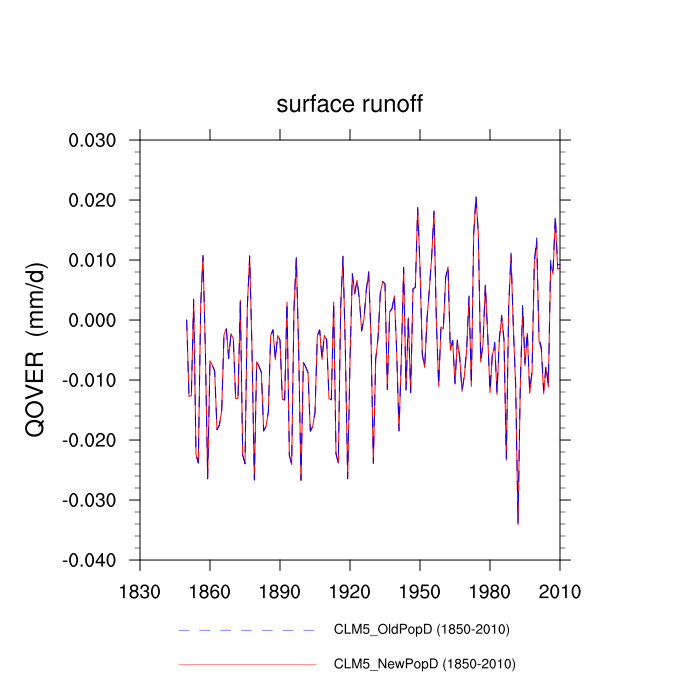
| surface runoff (QOVER) | TrendPlot | DifferencePlot | AnomalyPlot | ||
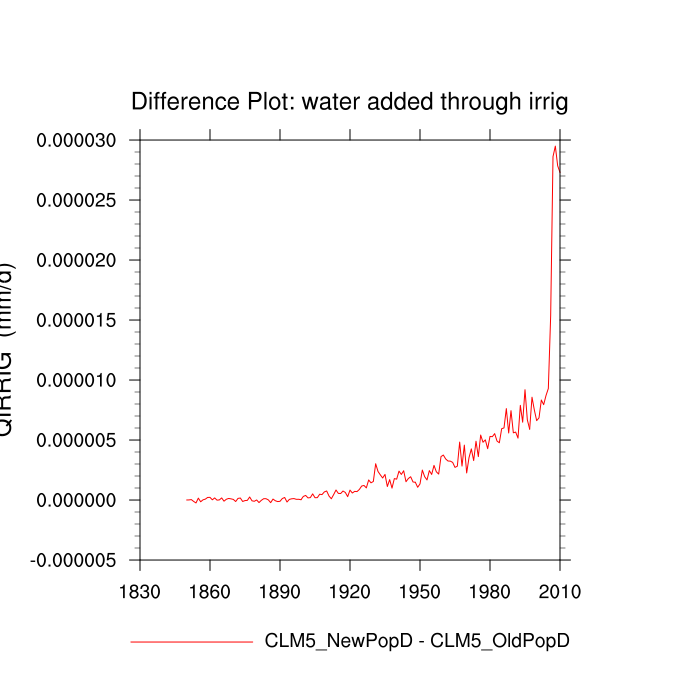
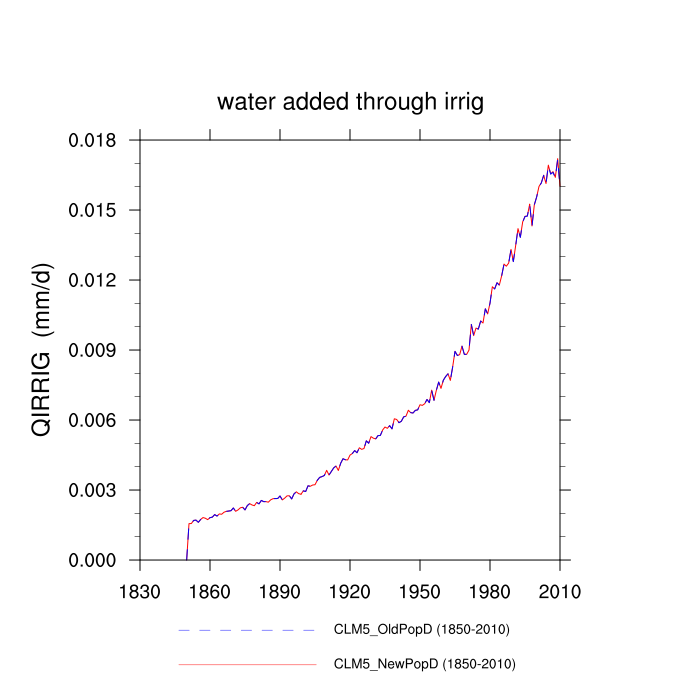
| water added through irrig (QIRRIG) | TrendPlot | DifferencePlot | AnomalyPlot | ||
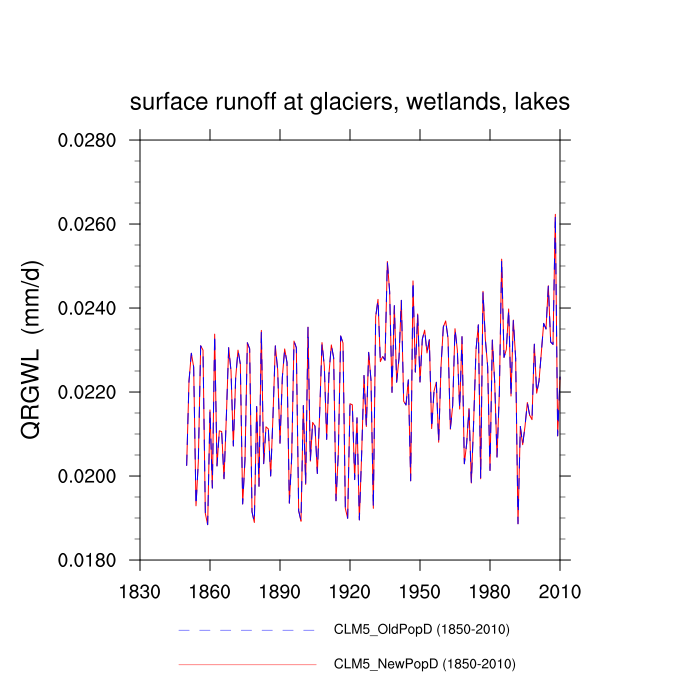
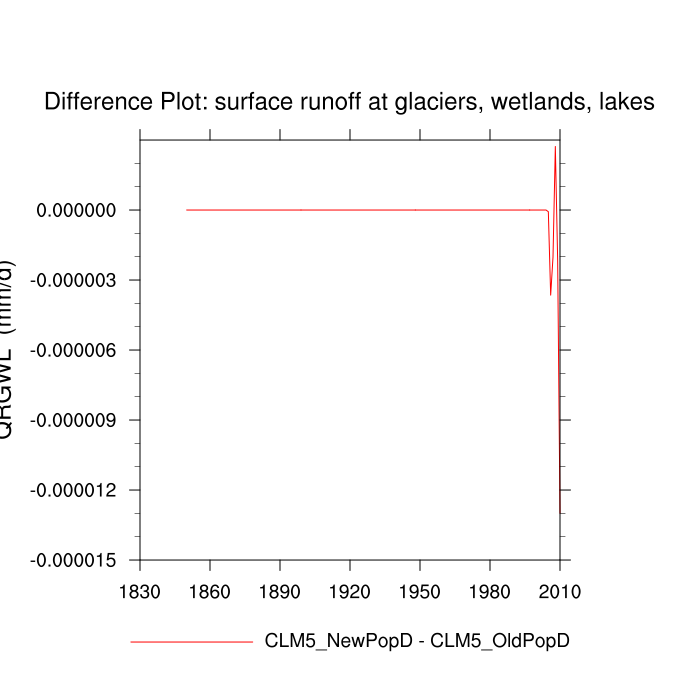
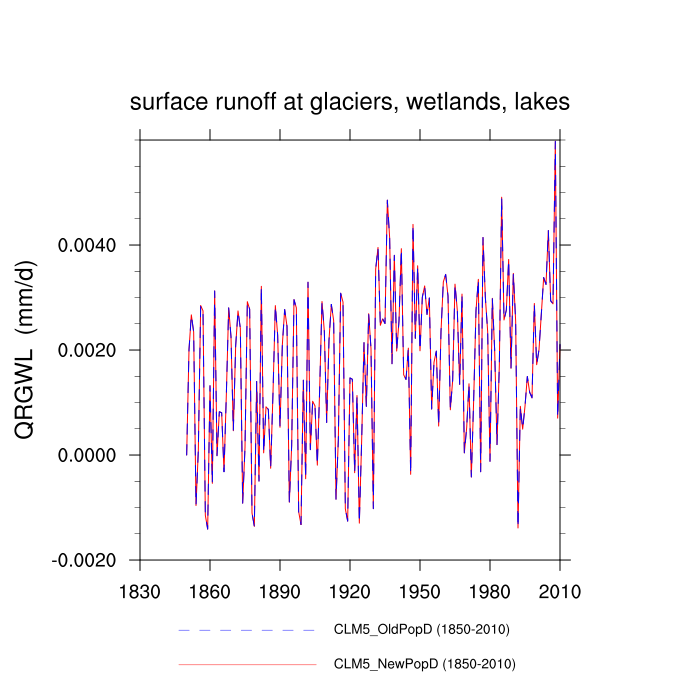
| surface runoff at glaciers, wetlands, lakes (QRGWL) | TrendPlot | DifferencePlot | AnomalyPlot | ||
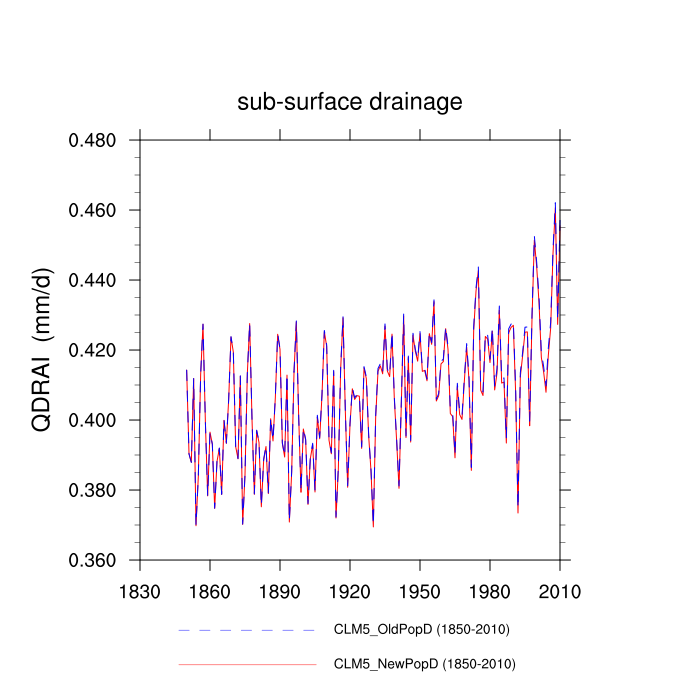
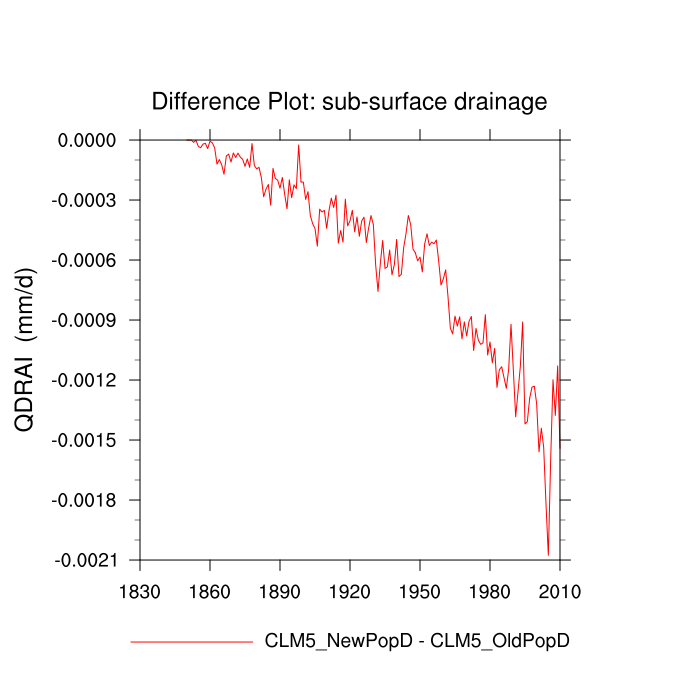
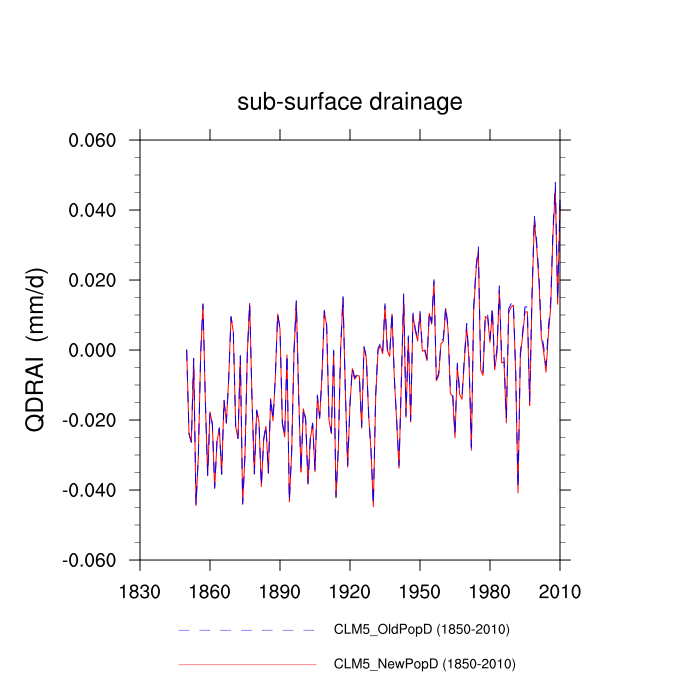
| sub-surface drainage (QDRAI) | TrendPlot | DifferencePlot | AnomalyPlot | ||
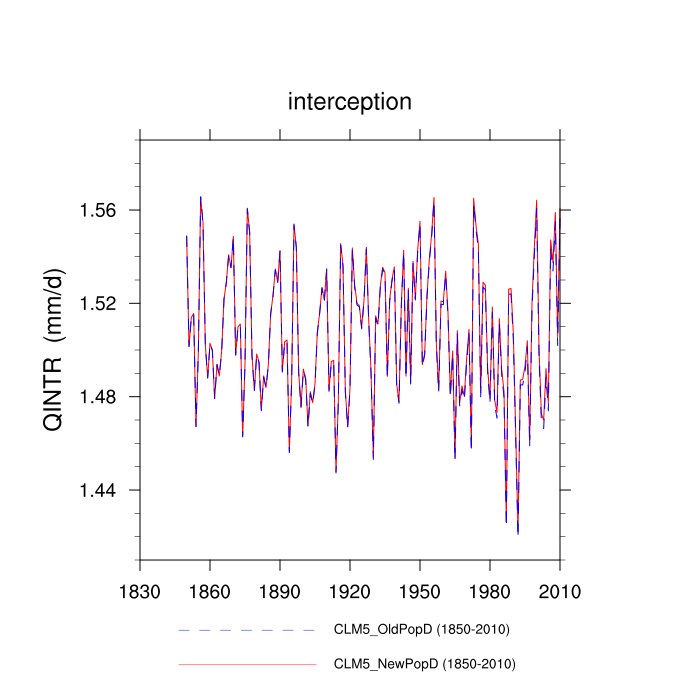
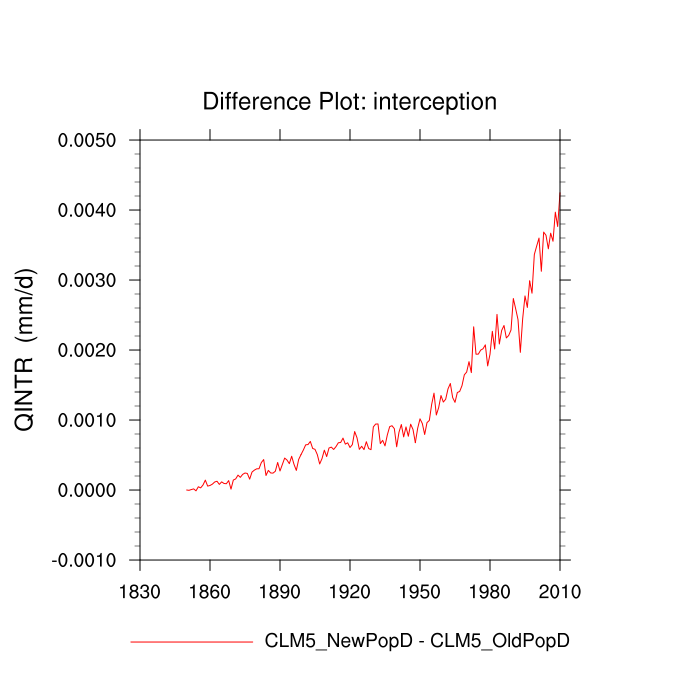
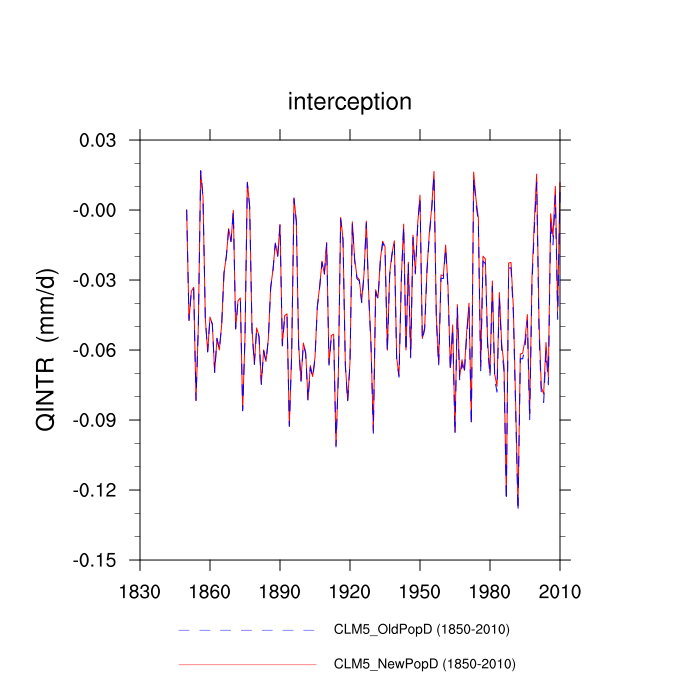
| interception (QINTR) | TrendPlot | DifferencePlot | AnomalyPlot | ||
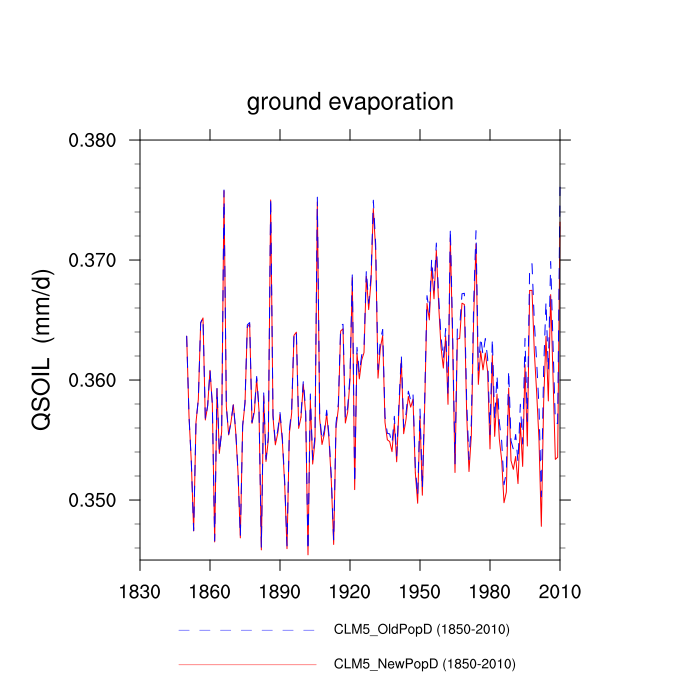
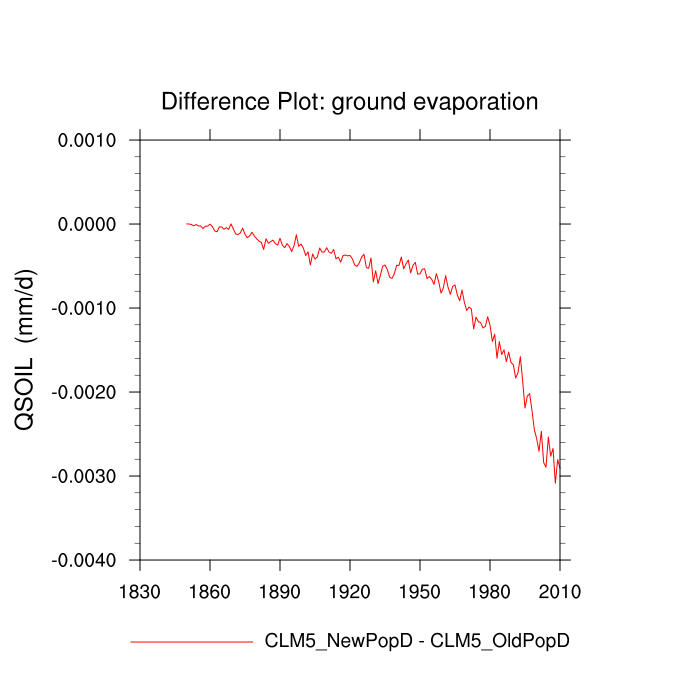
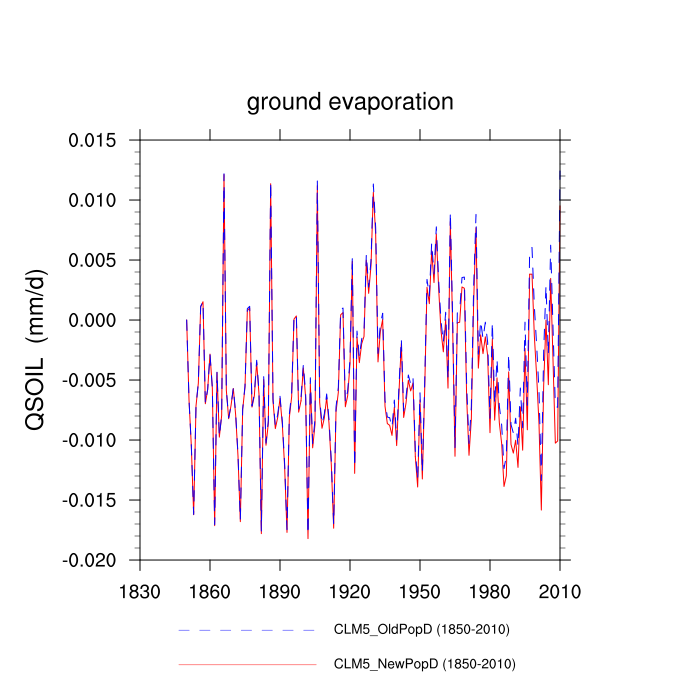
| ground evaporation (QSOIL) | TrendPlot | DifferencePlot | AnomalyPlot | ||
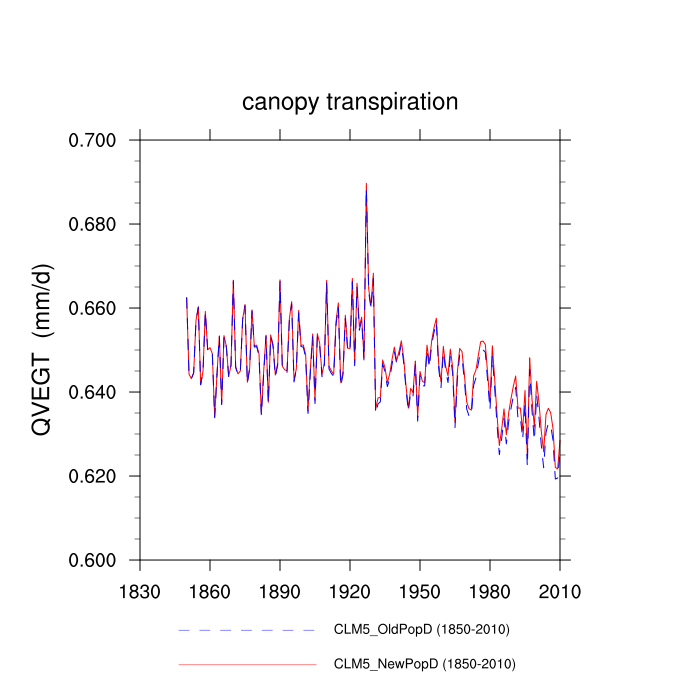
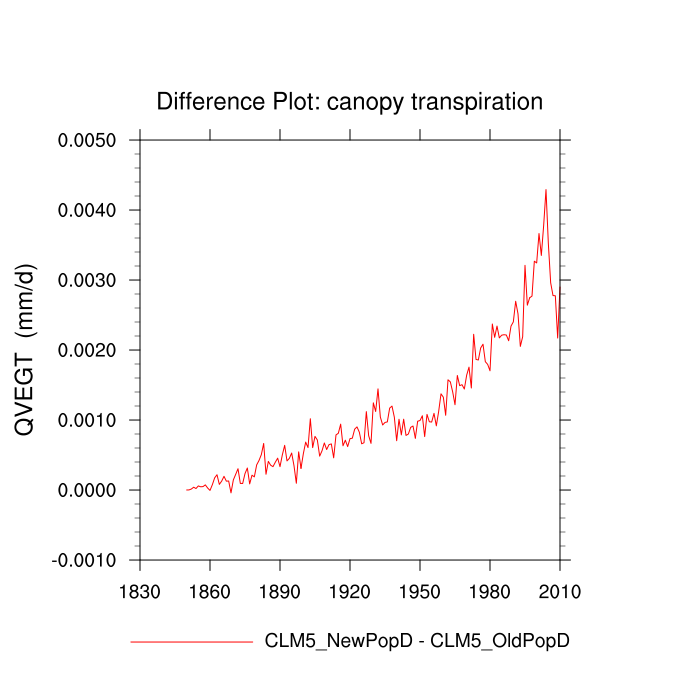
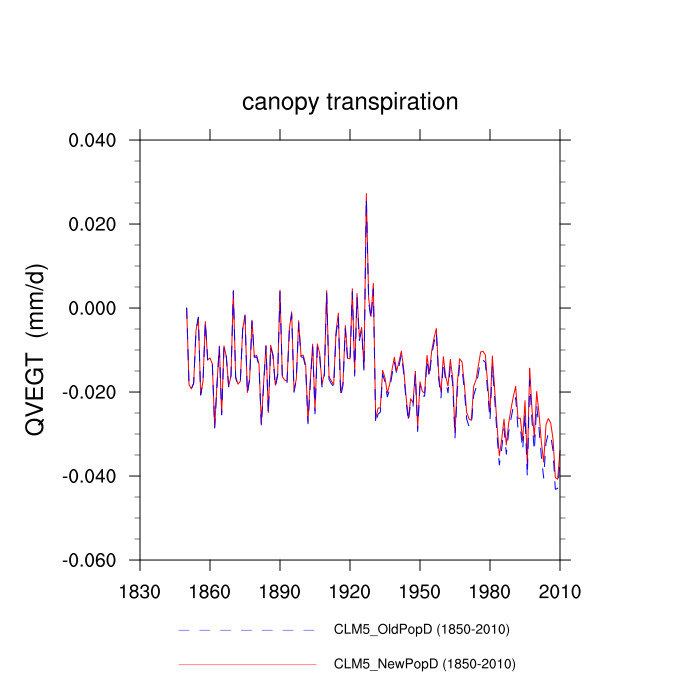
| canopy transpiration (QVEGT) | TrendPlot | DifferencePlot | AnomalyPlot | ||
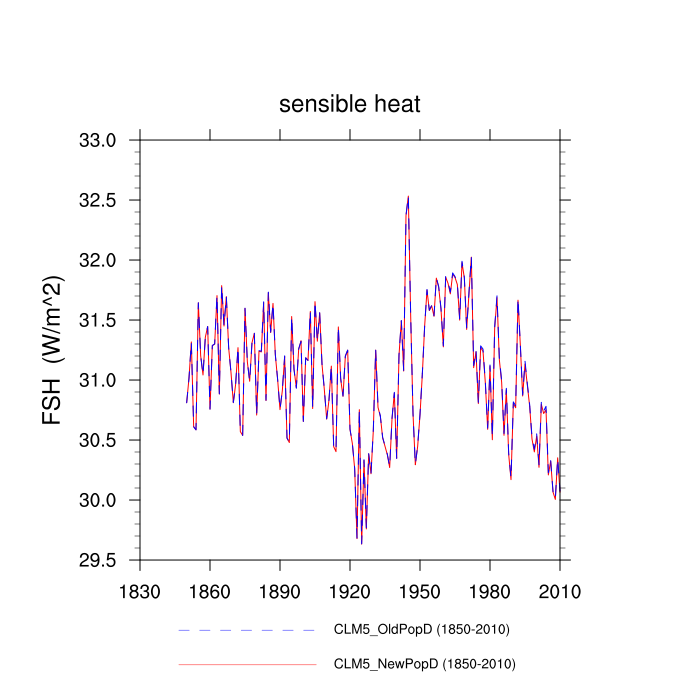
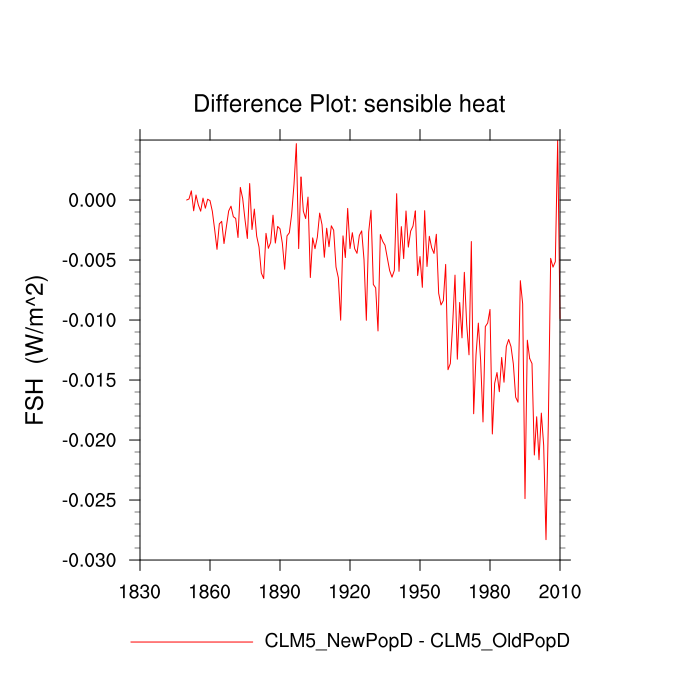
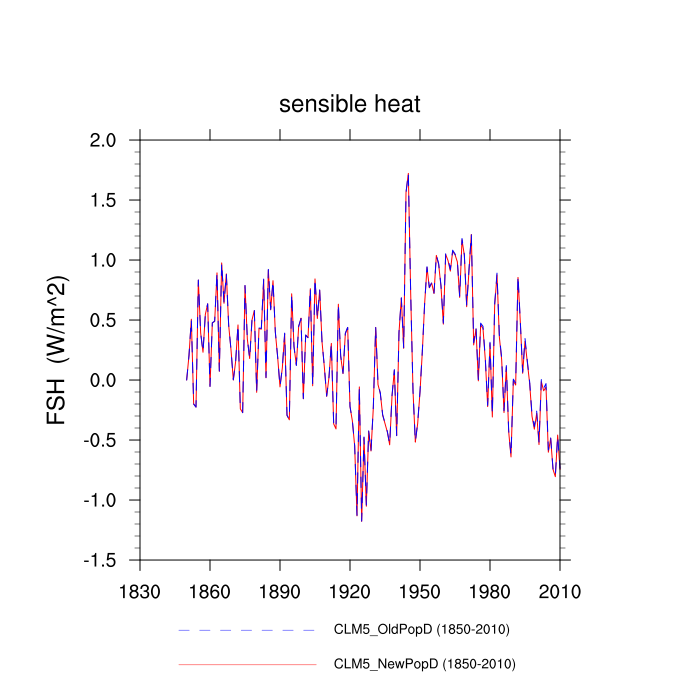
| sensible heat (FSH) | TrendPlot | DifferencePlot | AnomalyPlot | ||
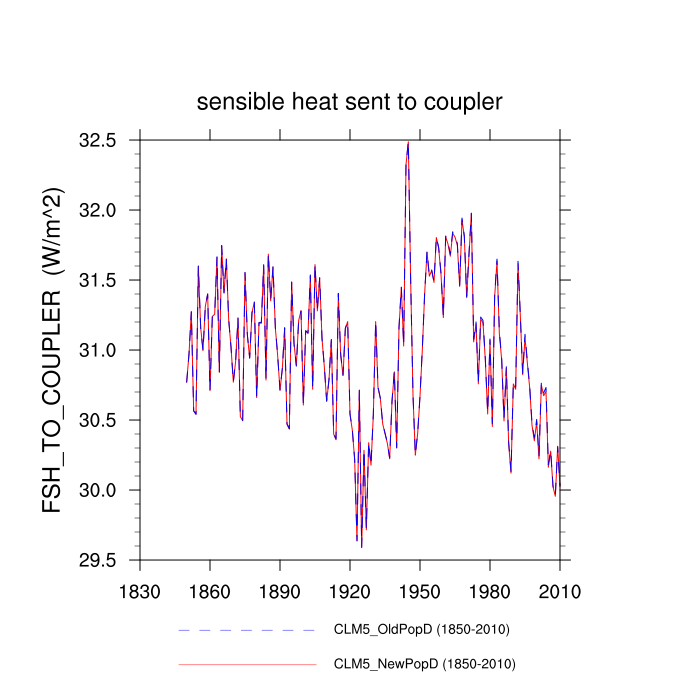
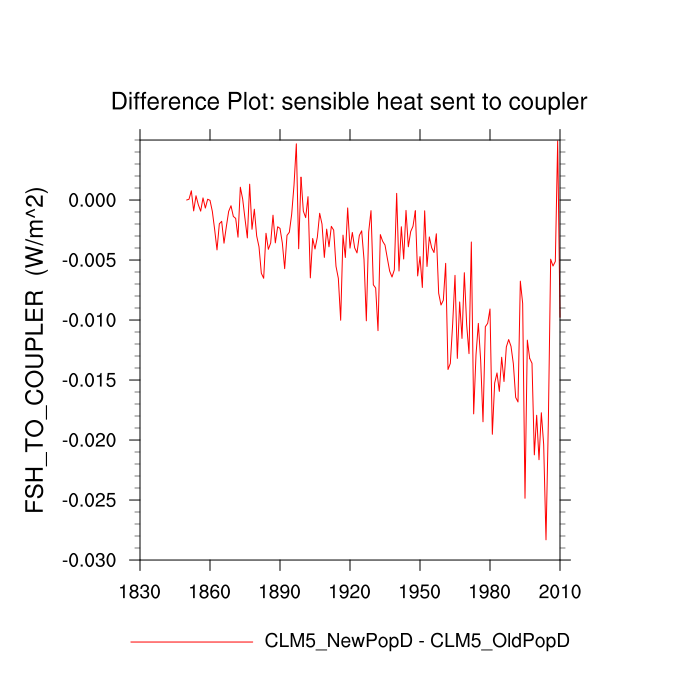
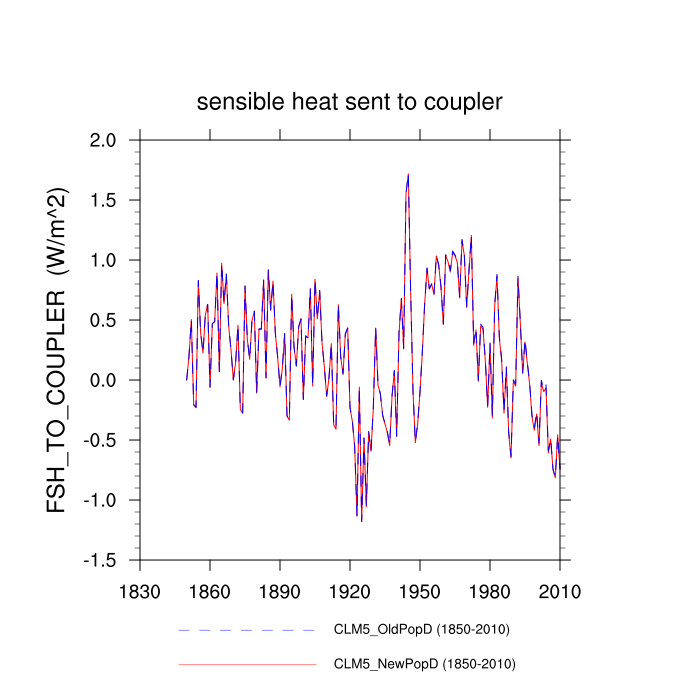
| sensible heat sent to coupler (FSH_TO_COUPLER) | TrendPlot | DifferencePlot | AnomalyPlot | ||
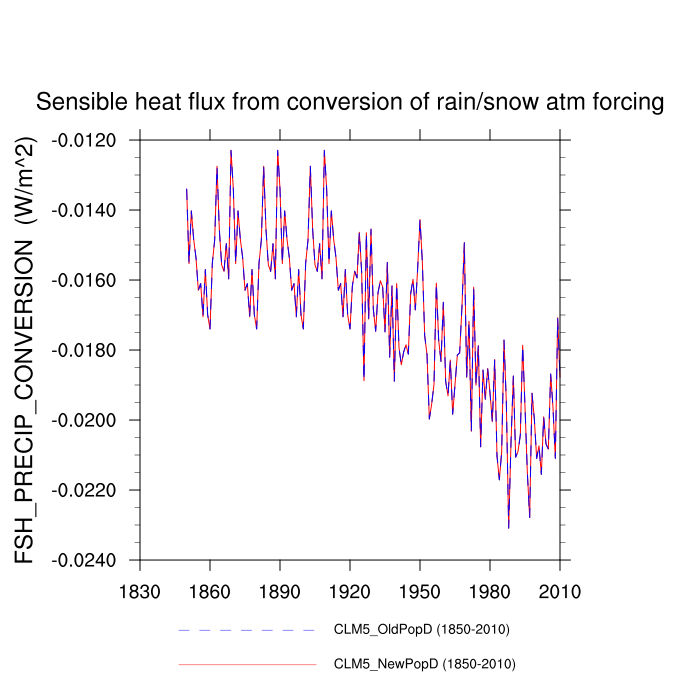
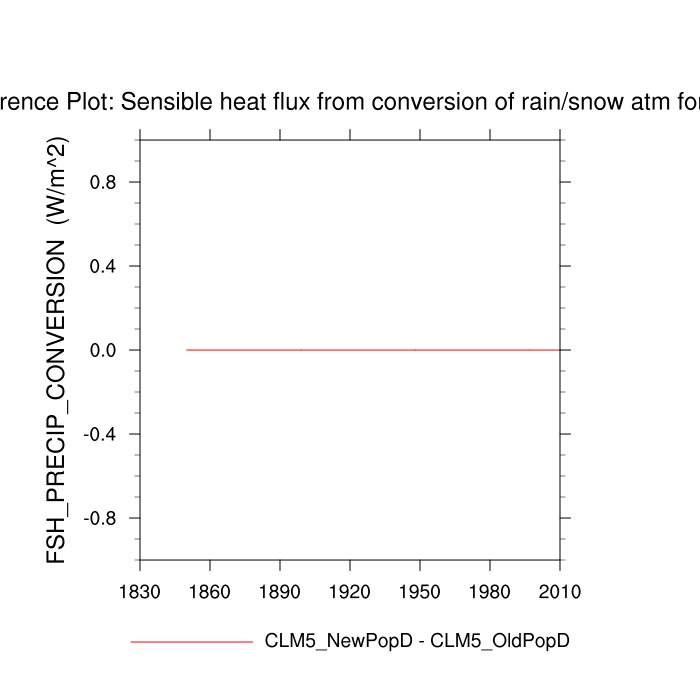
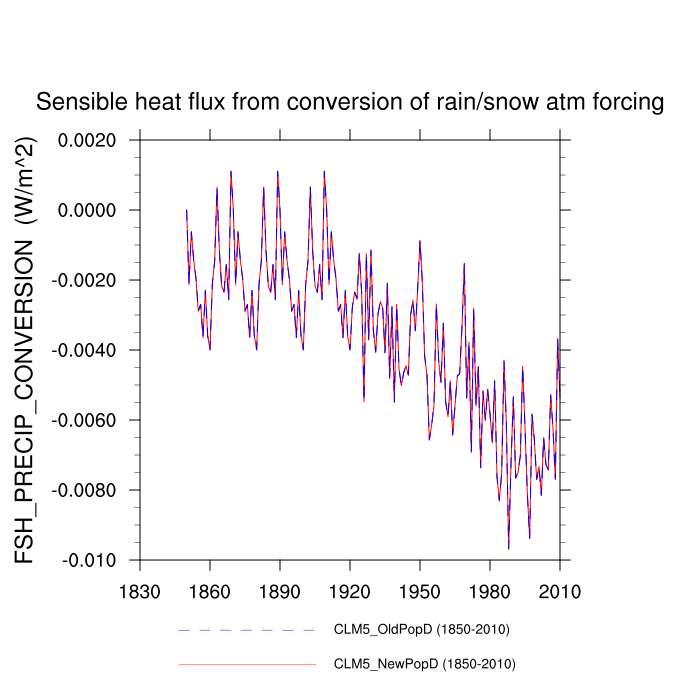
| Sensible heat flux from conversion of rain/snow atm forcing (FSH_PRECIP_CONVERSION) | TrendPlot | DifferencePlot | AnomalyPlot | ||
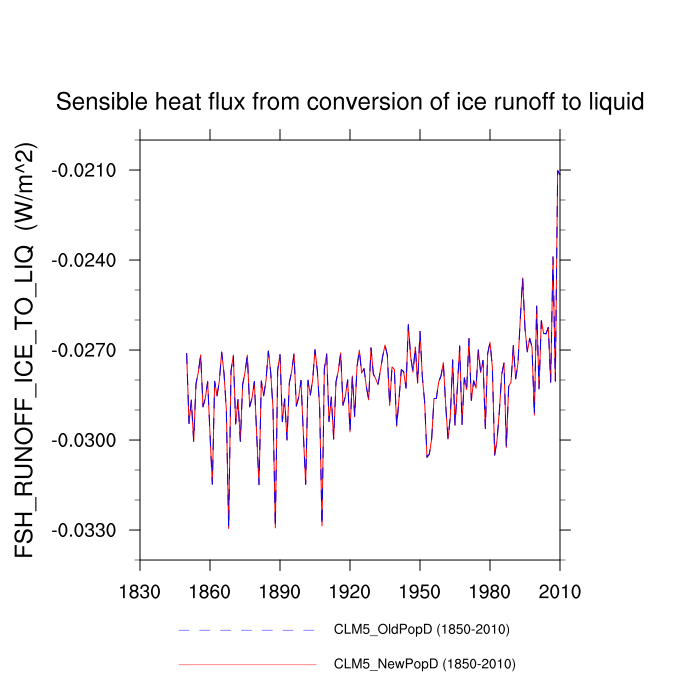
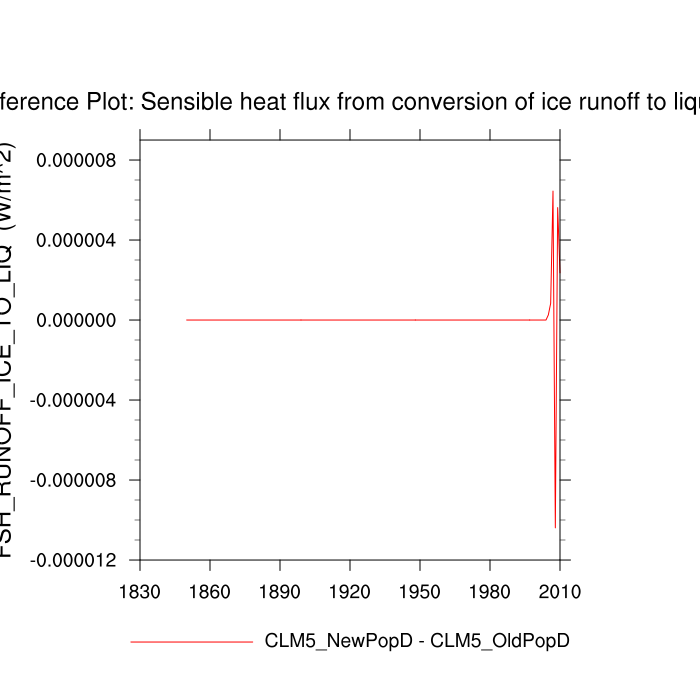
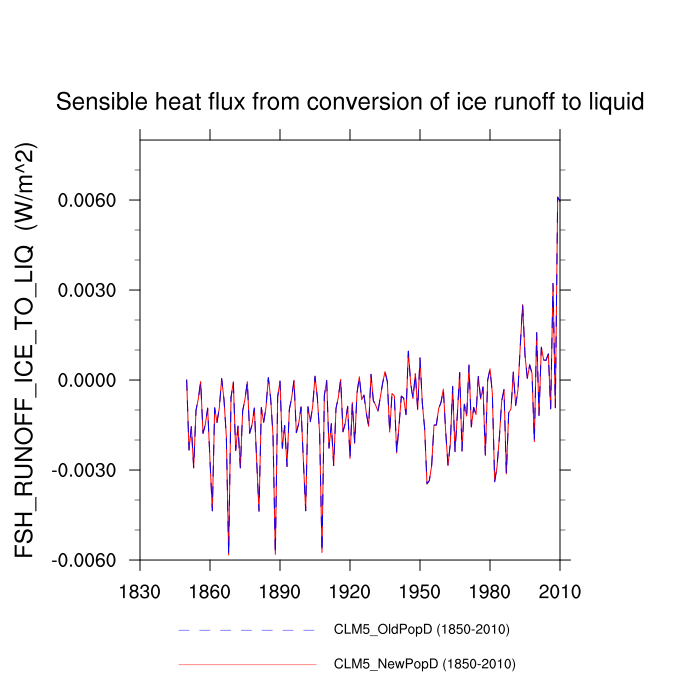
| Sensible heat flux from conversion of ice runoff to liquid (FSH_RUNOFF_ICE_TO_LIQ) | TrendPlot | DifferencePlot | AnomalyPlot | ||
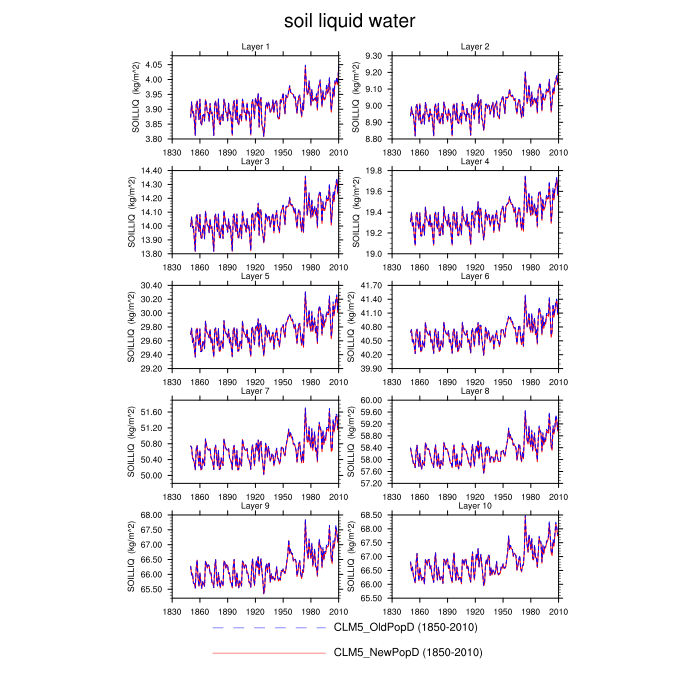
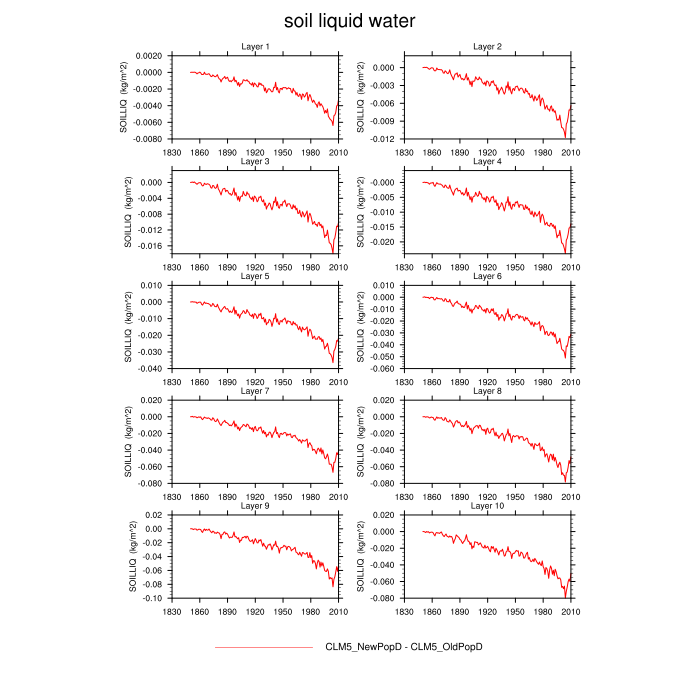
| soil liquid water: layers 1,5,10 (SOILLIQ) | TrendPlot | DifferencePlot | AnomalyPlot | ||
| soil ice: layers 1,5,10 (SOILICE) | TrendPlot | DifferencePlot | AnomalyPlot | ||
| Soil Water Potential in Each Soil Layer (SOILPSI) | --- | --- | --- | ||
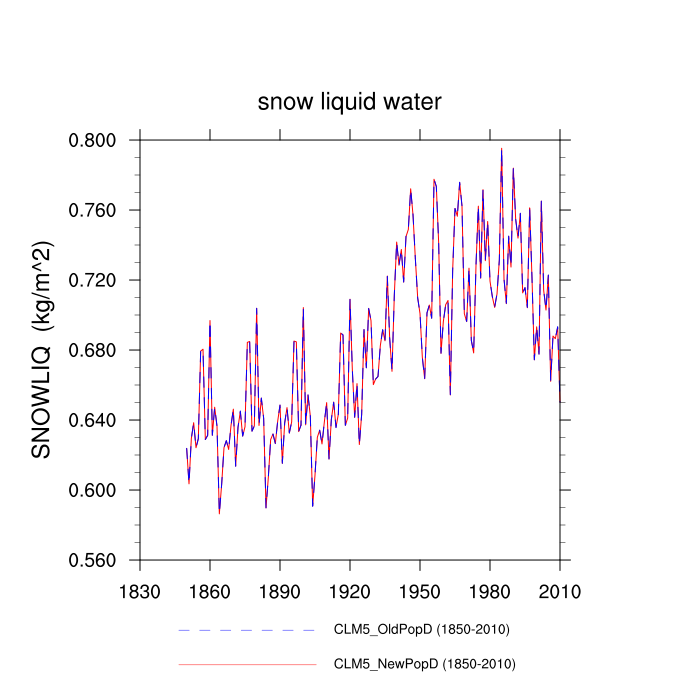
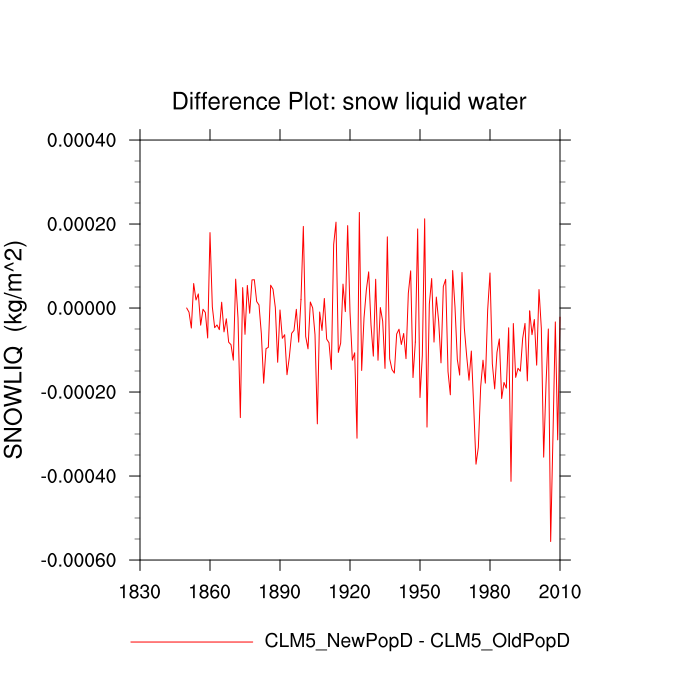
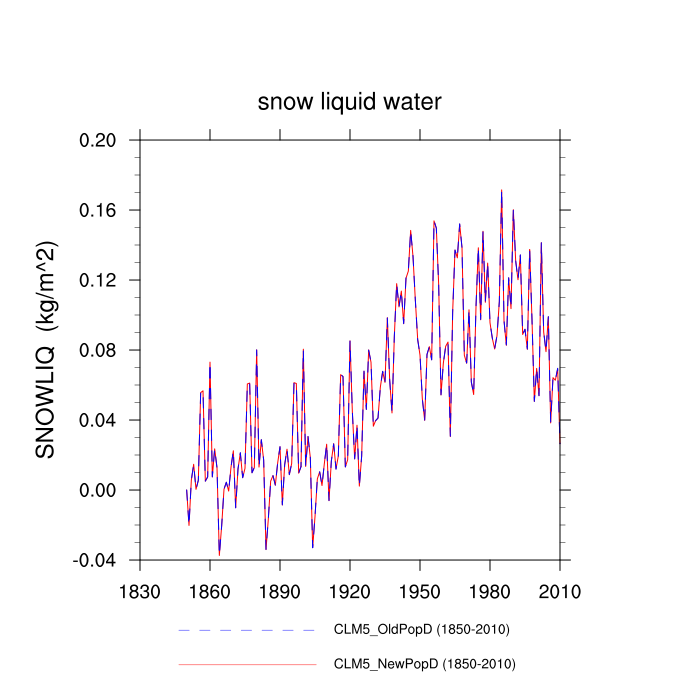
| snow liquid water (SNOWLIQ) | TrendPlot | DifferencePlot | AnomalyPlot | ||
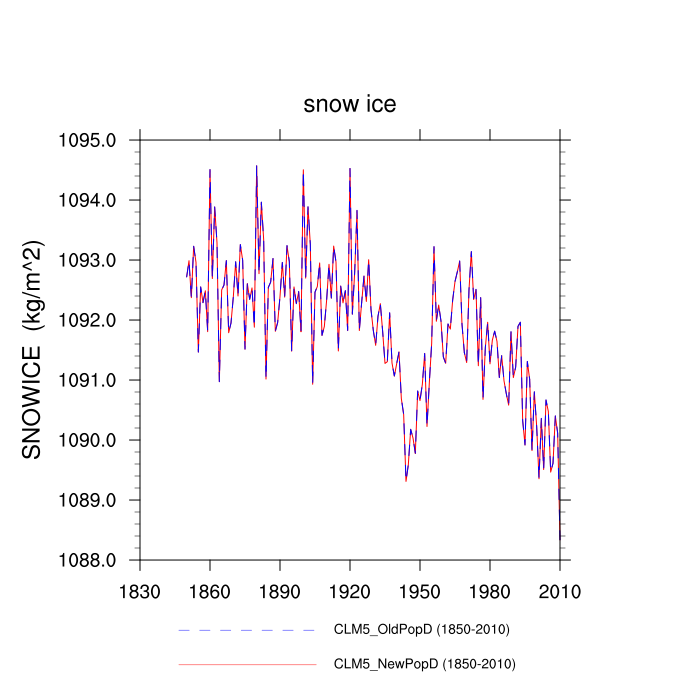
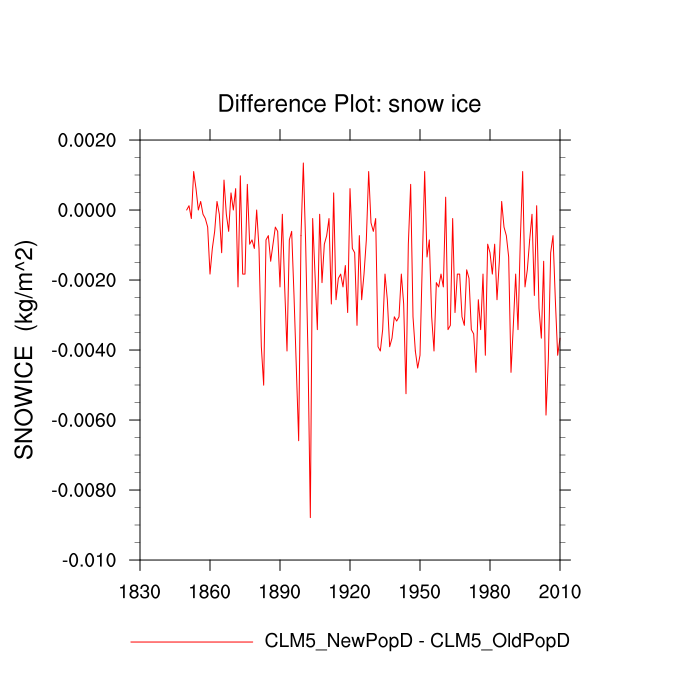
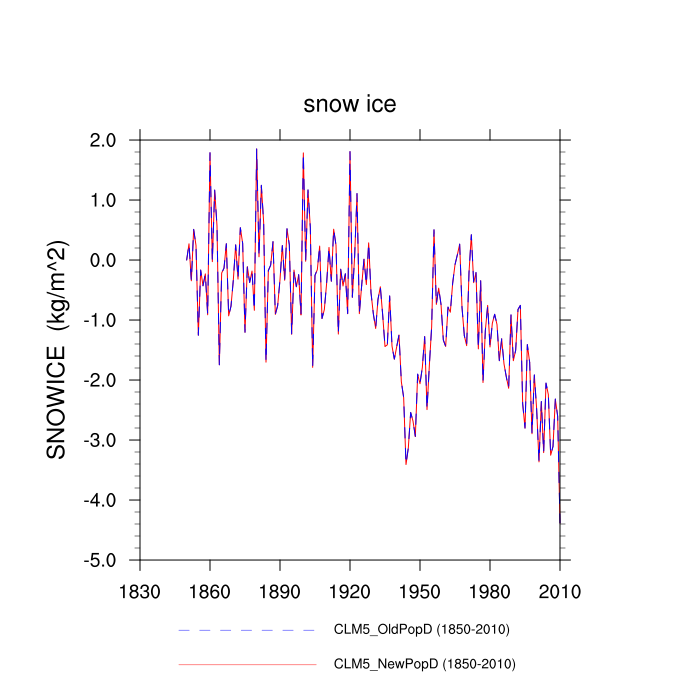
| snow ice (SNOWICE) | TrendPlot | DifferencePlot | AnomalyPlot | ||
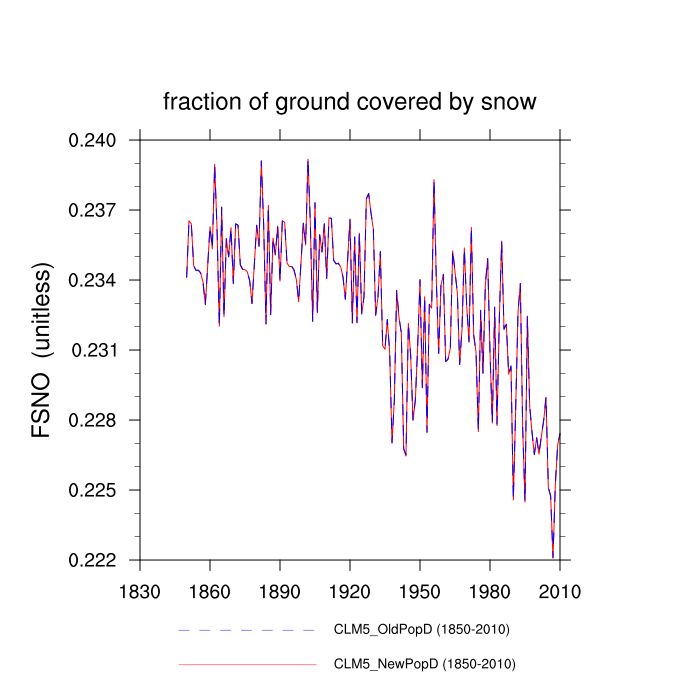
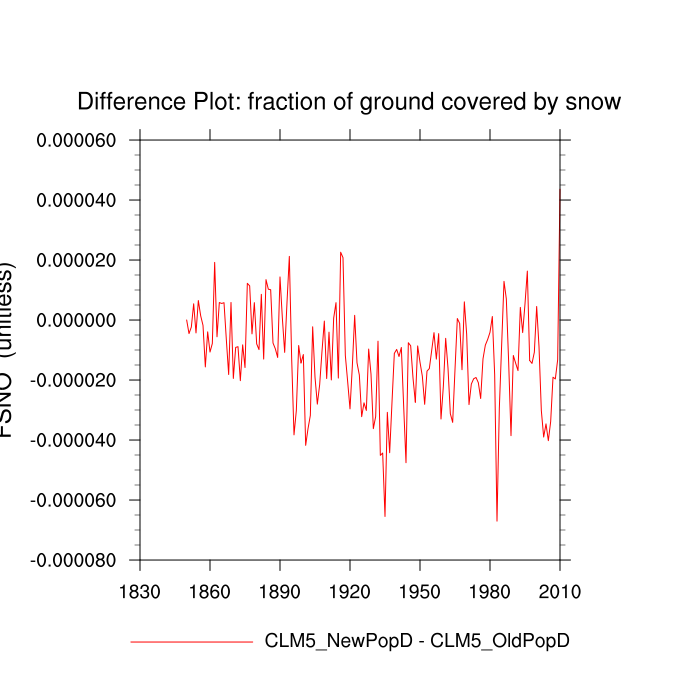
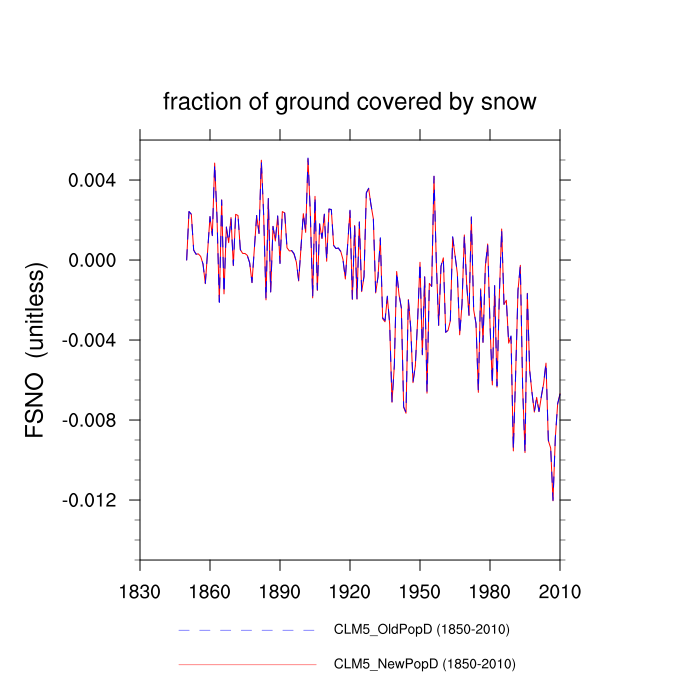
| fraction of ground covered by snow (FSNO) | TrendPlot | DifferencePlot | AnomalyPlot | ||
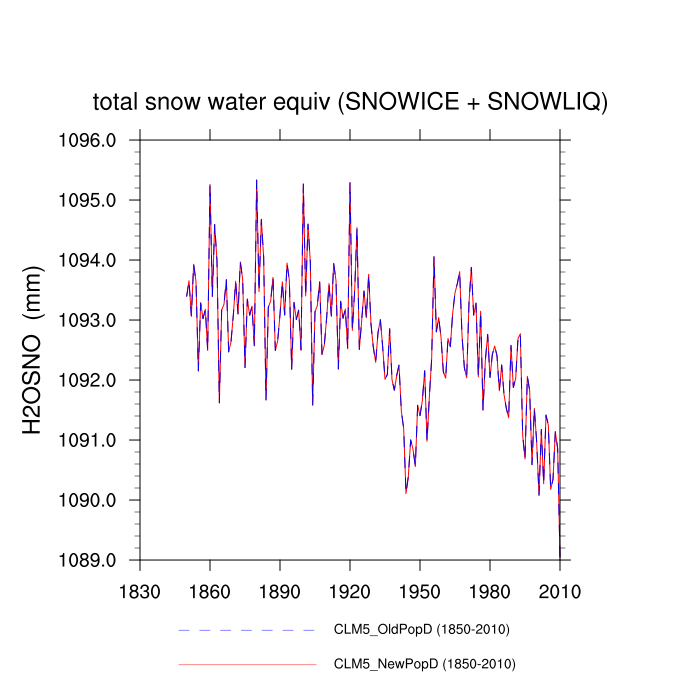
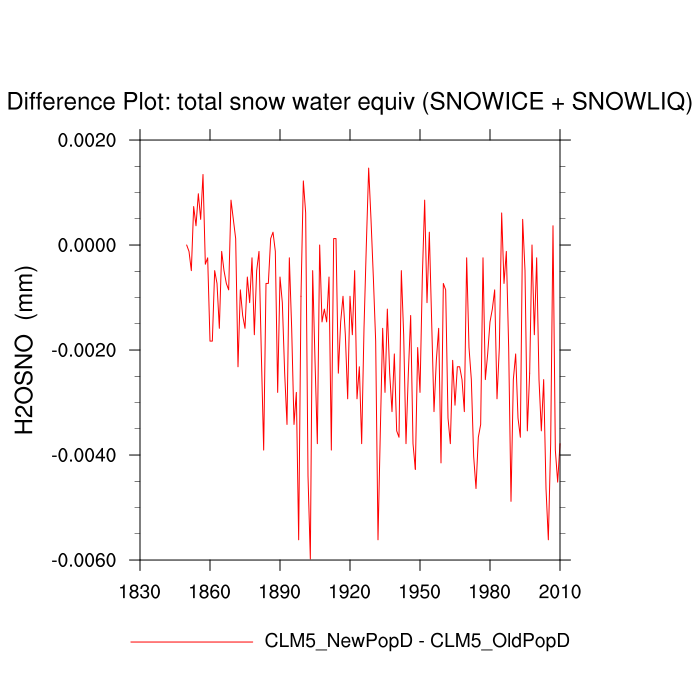
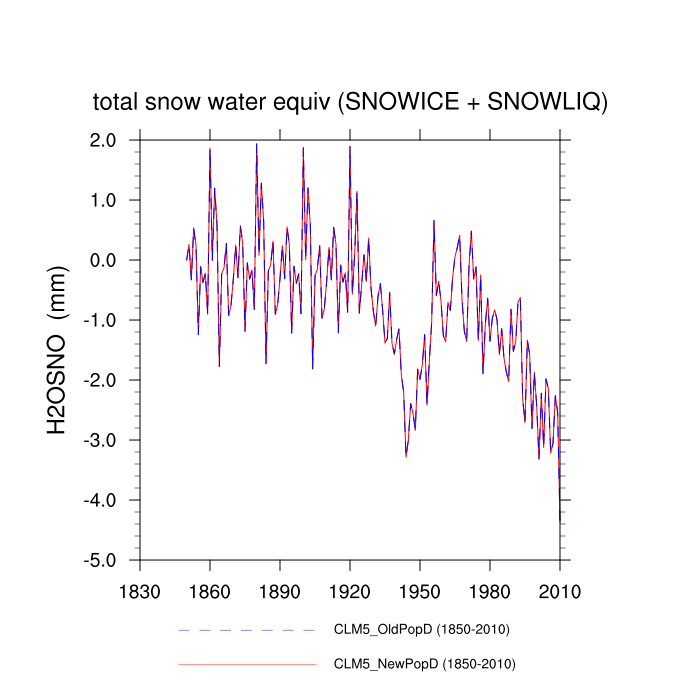
| total snow water equiv (SNOWICE + SNOWLIQ) (H2OSNO) | TrendPlot | DifferencePlot | AnomalyPlot | ||
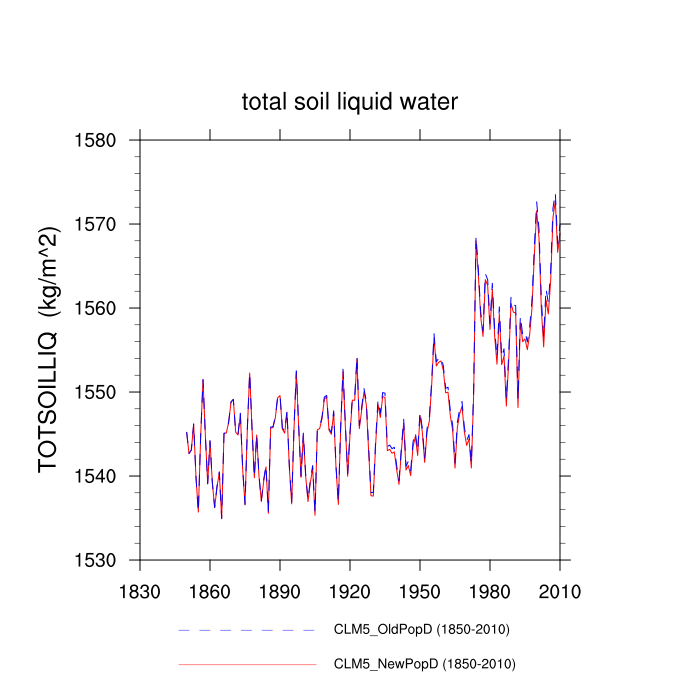
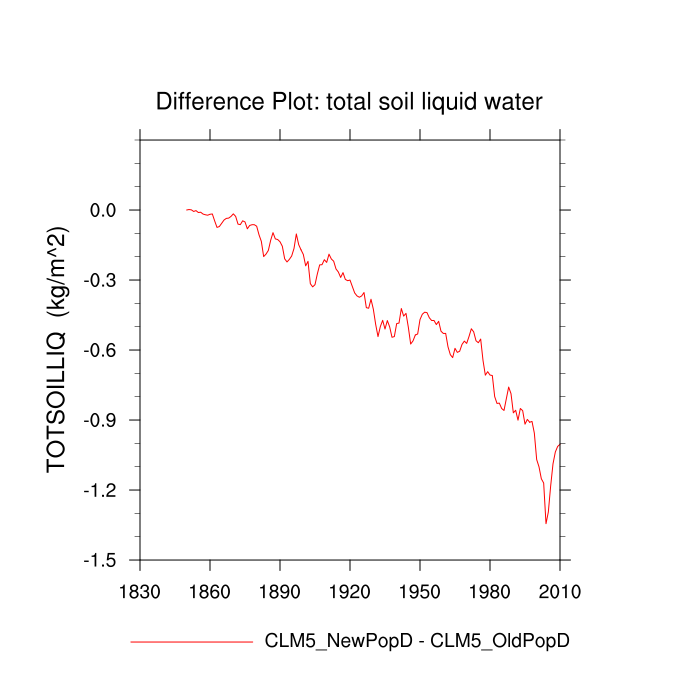
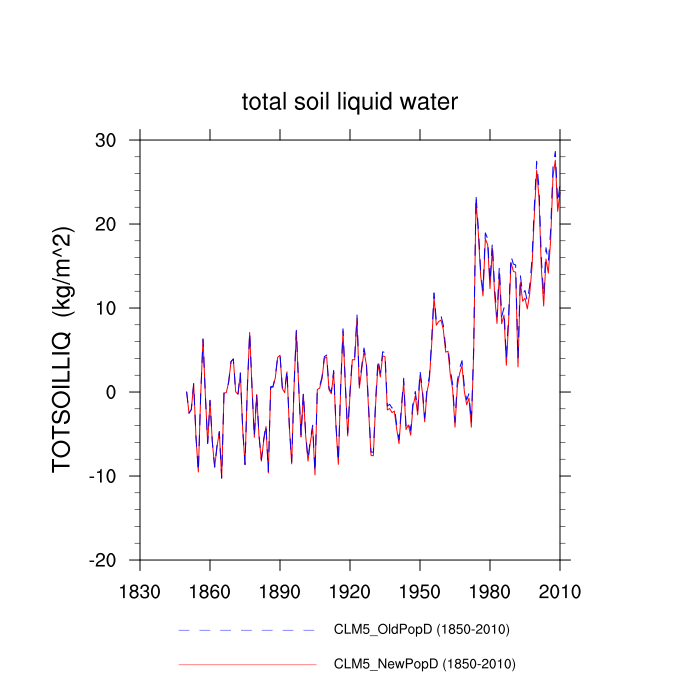
| total soil liquid water (TOTSOILLIQ) | TrendPlot | DifferencePlot | AnomalyPlot | ||
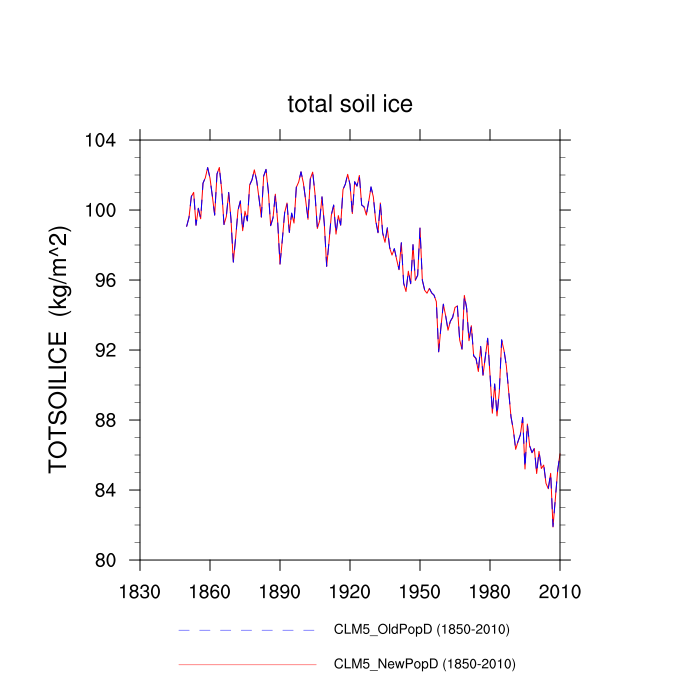
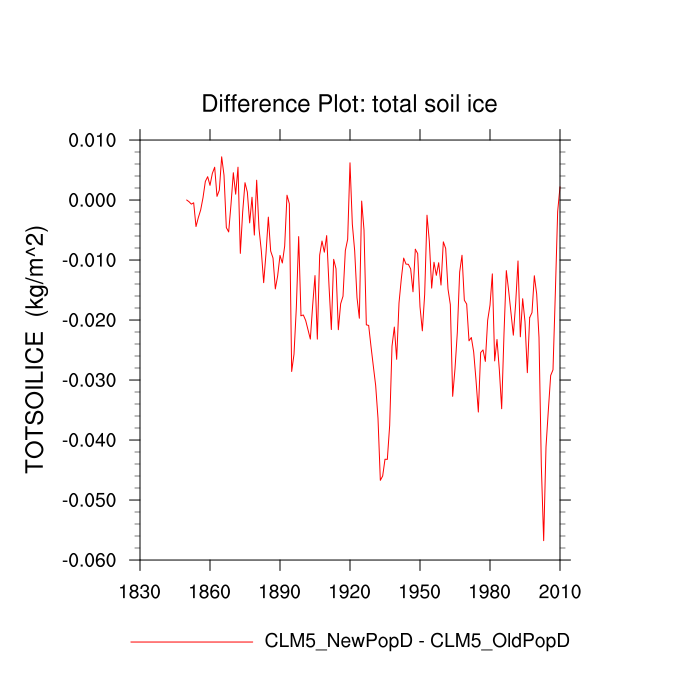
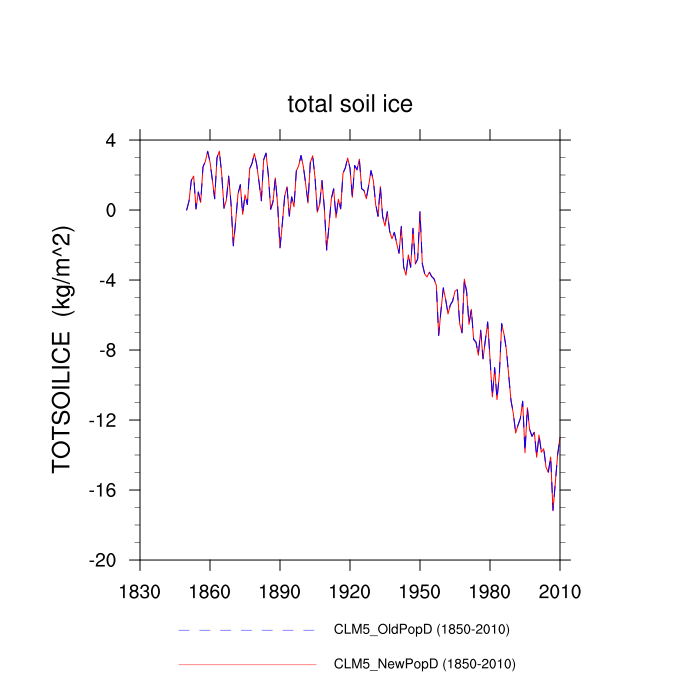
| total soil ice (TOTSOILICE) | TrendPlot | DifferencePlot | AnomalyPlot | ||
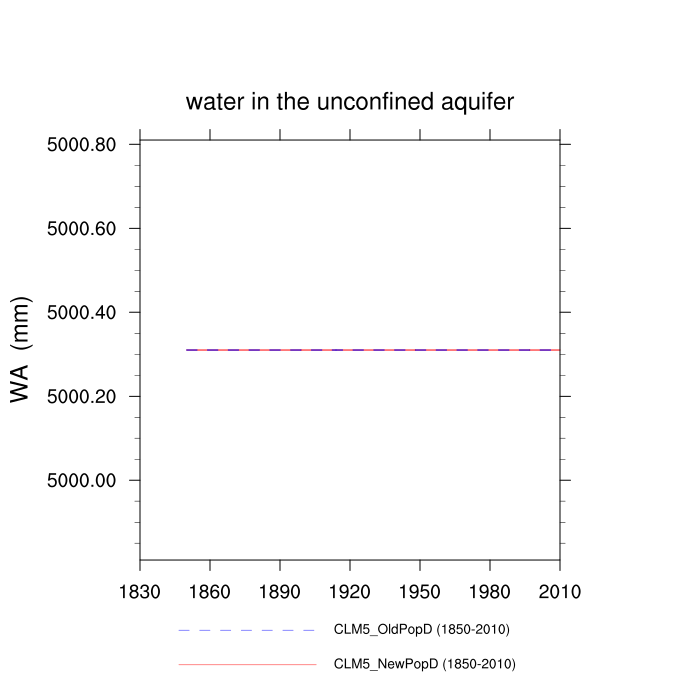
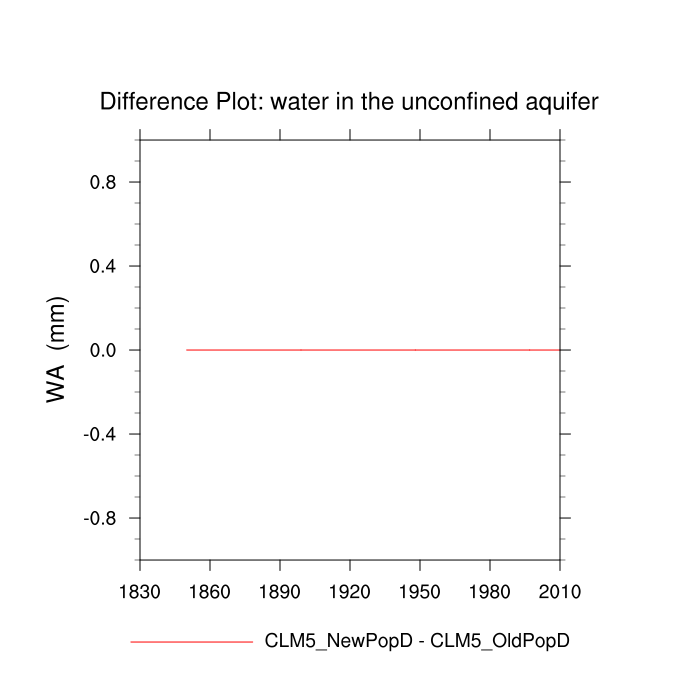
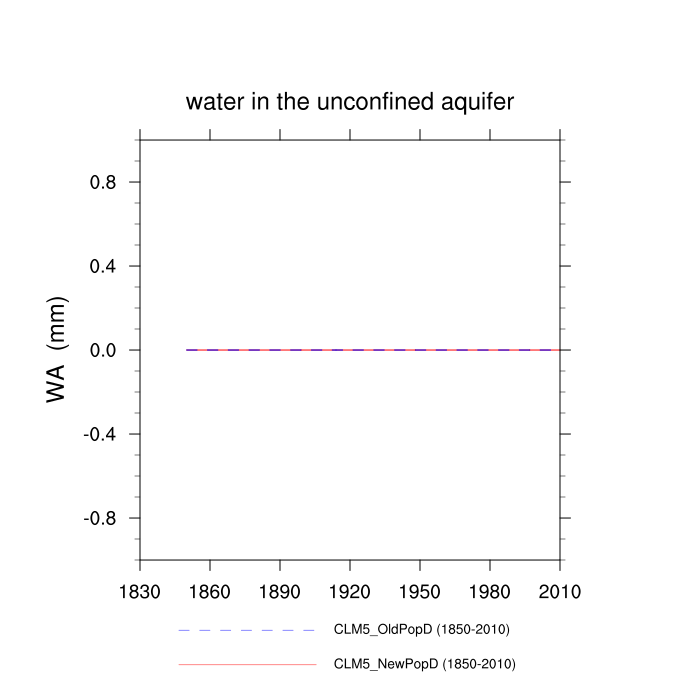
| water in the unconfined aquifer (WA) | TrendPlot | DifferencePlot | AnomalyPlot | ||
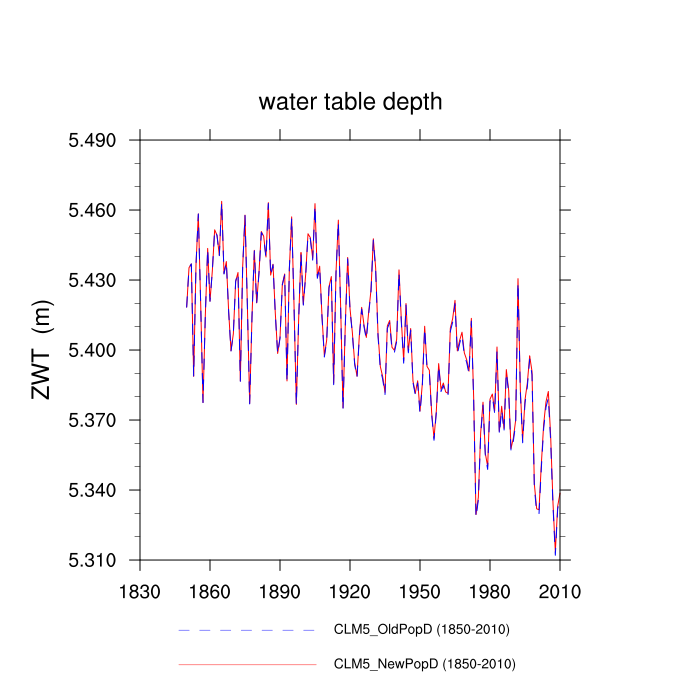
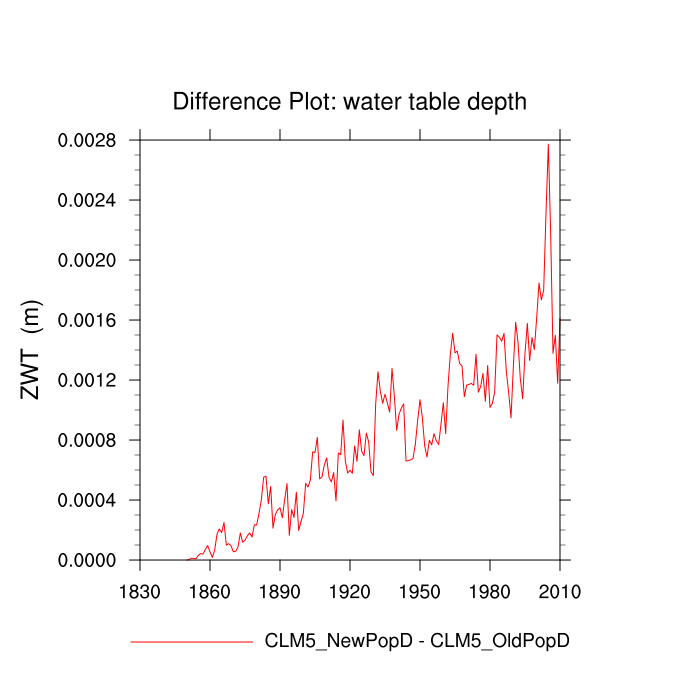
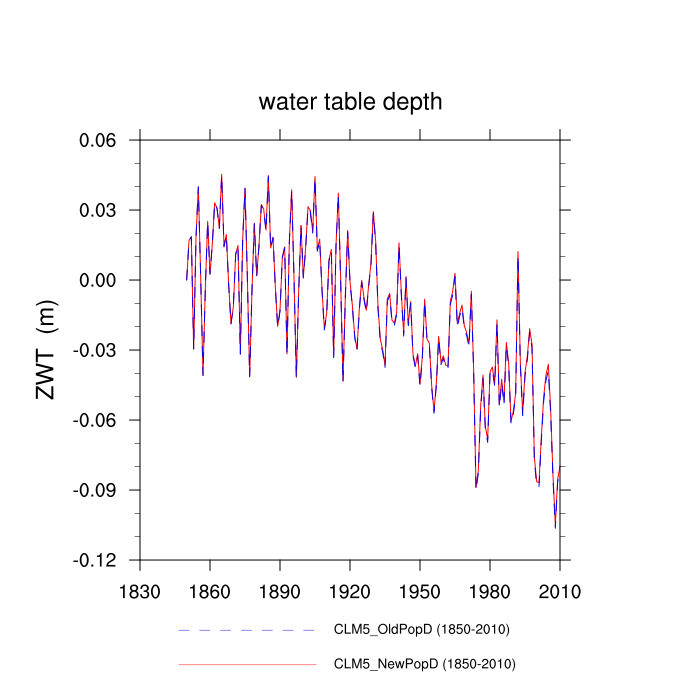
| water table depth (ZWT) | TrendPlot | DifferencePlot | AnomalyPlot | ||
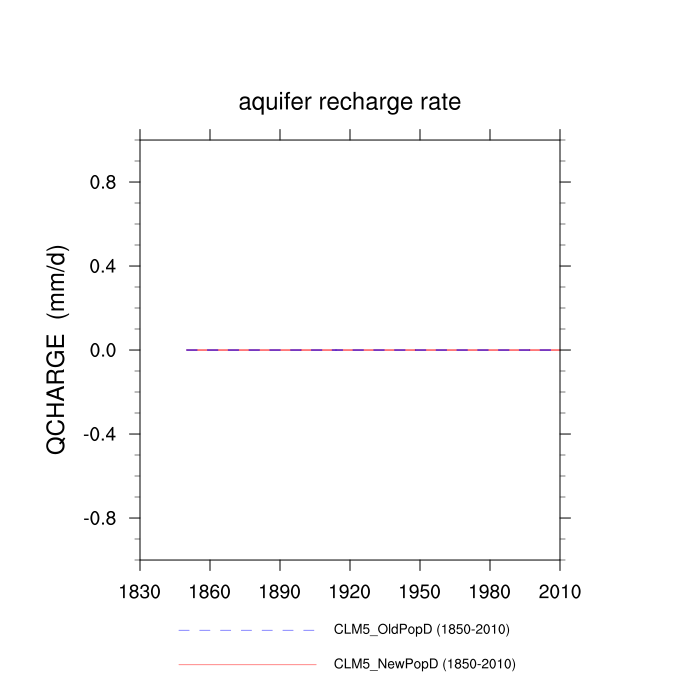
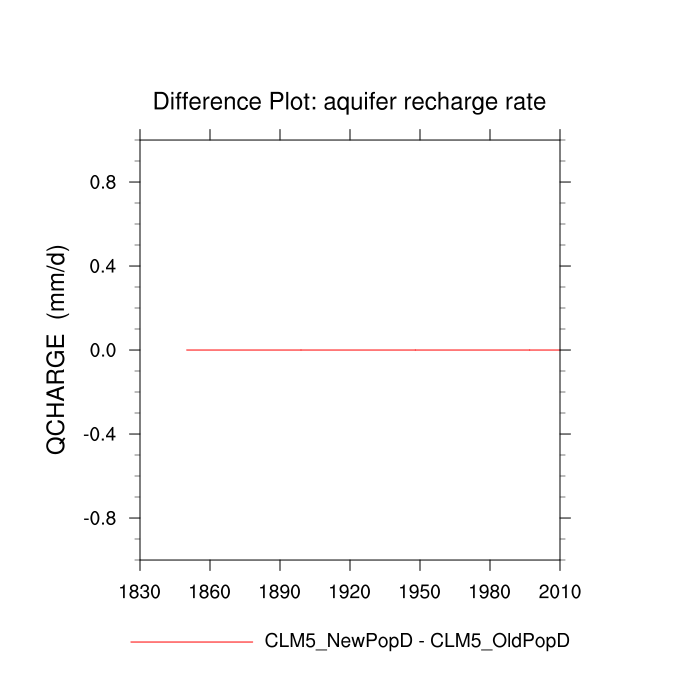
| aquifer recharge rate (QCHARGE) | TrendPlot | DifferencePlot | AnomalyPlot | ||
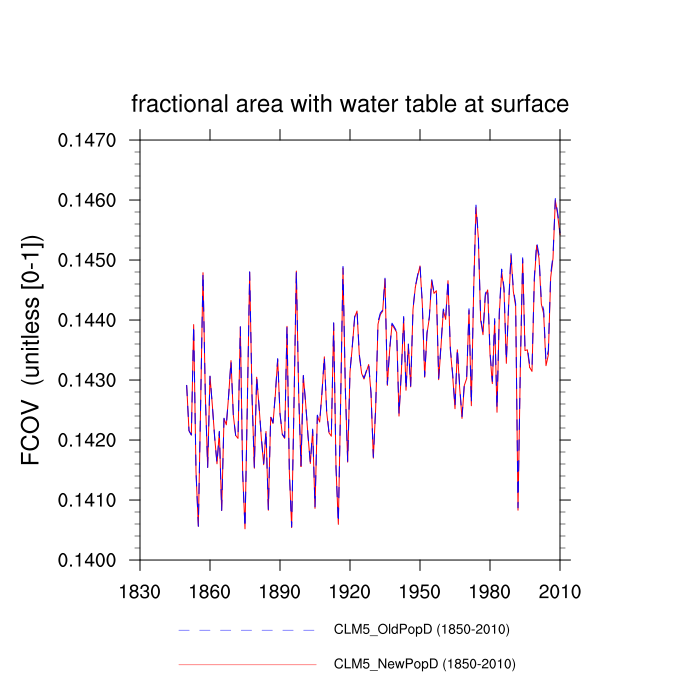
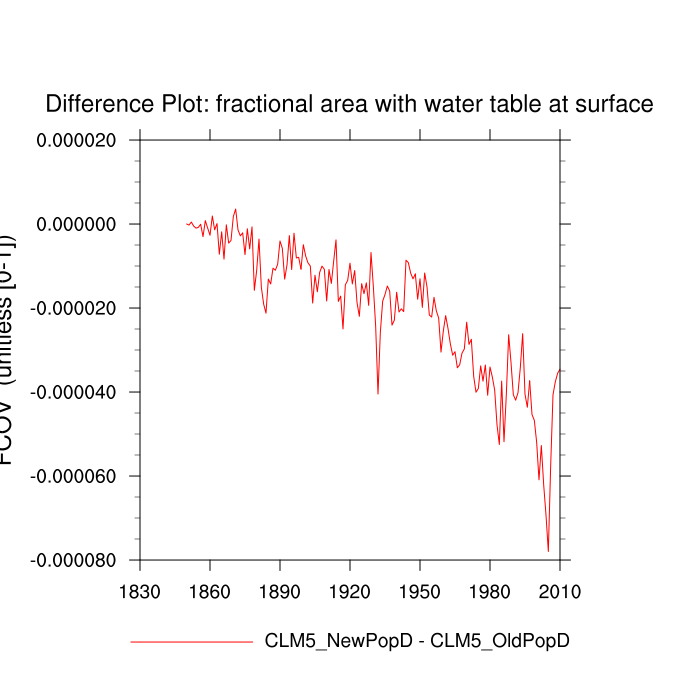
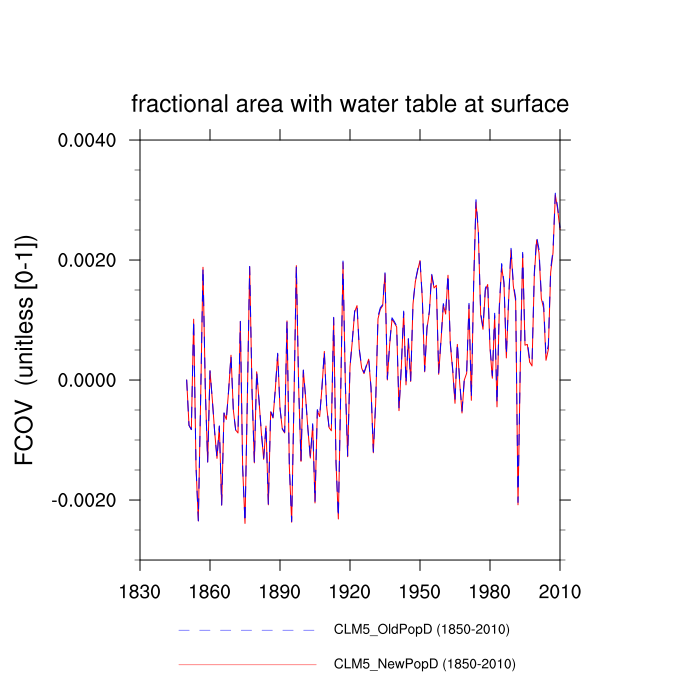
| fractional area with water table at surface (FCOV) | TrendPlot | DifferencePlot | AnomalyPlot | ||
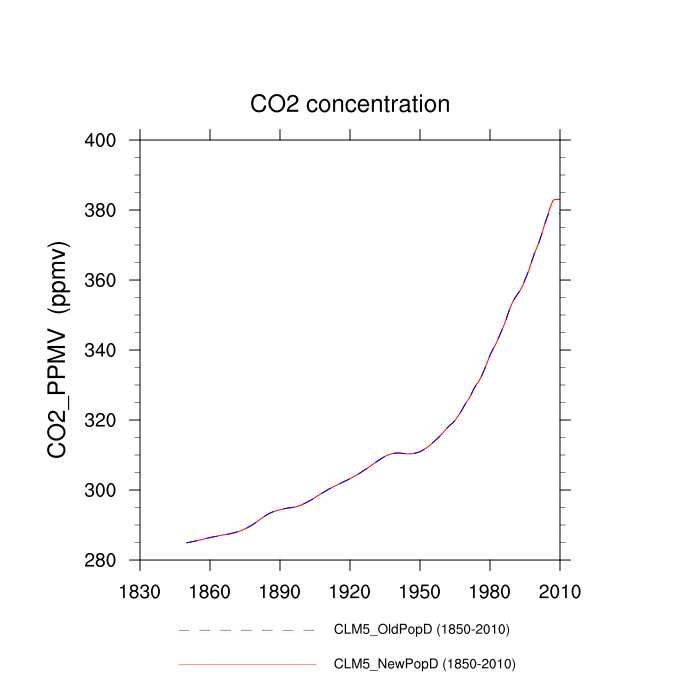
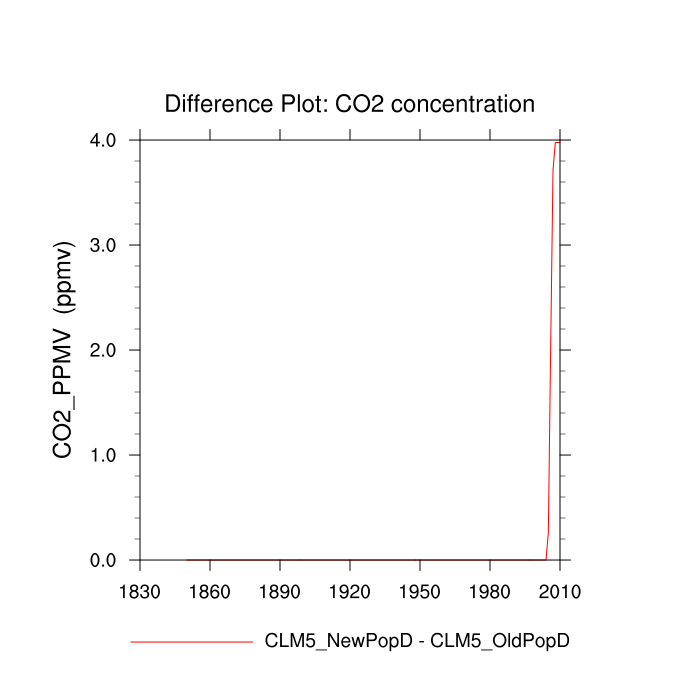
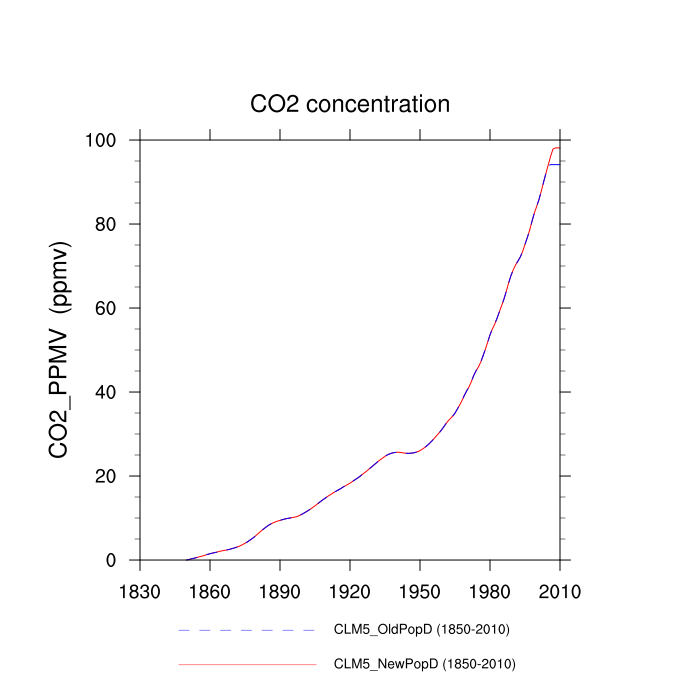
| CO2 concentration (CO2_PPMV) | TrendPlot | DifferencePlot | AnomalyPlot | ||
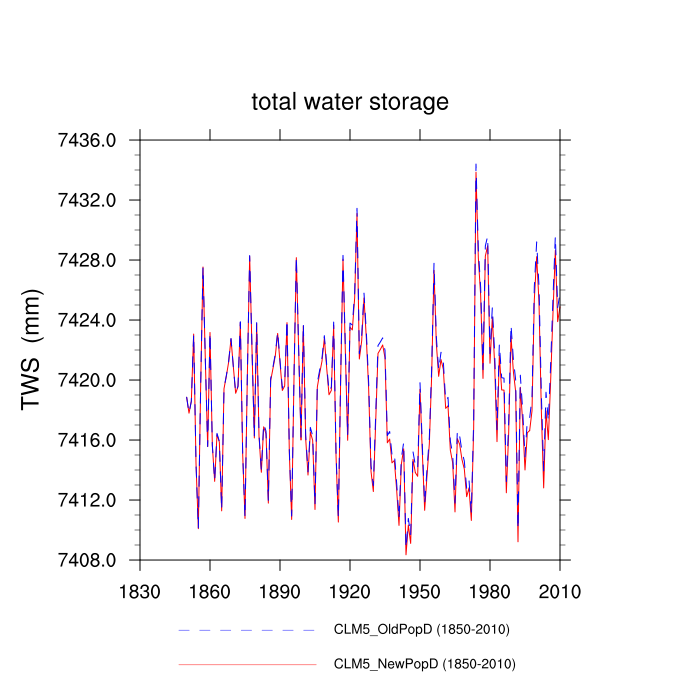
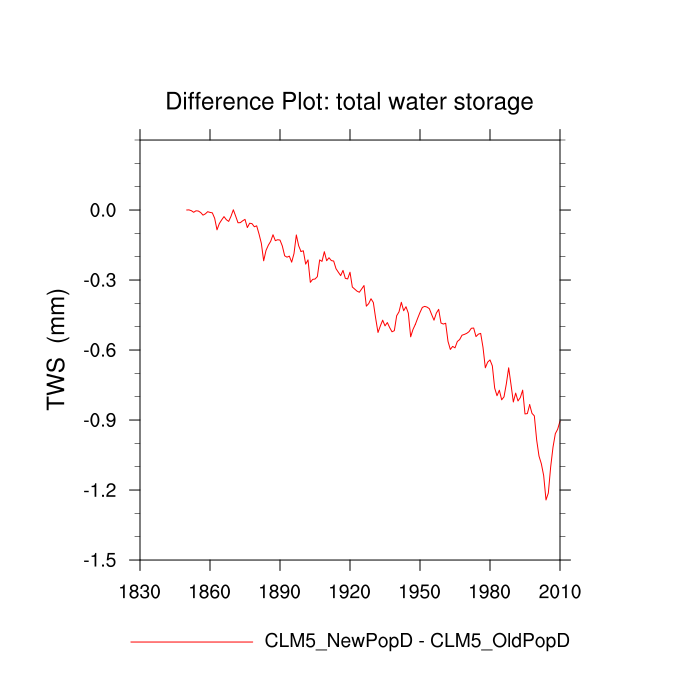
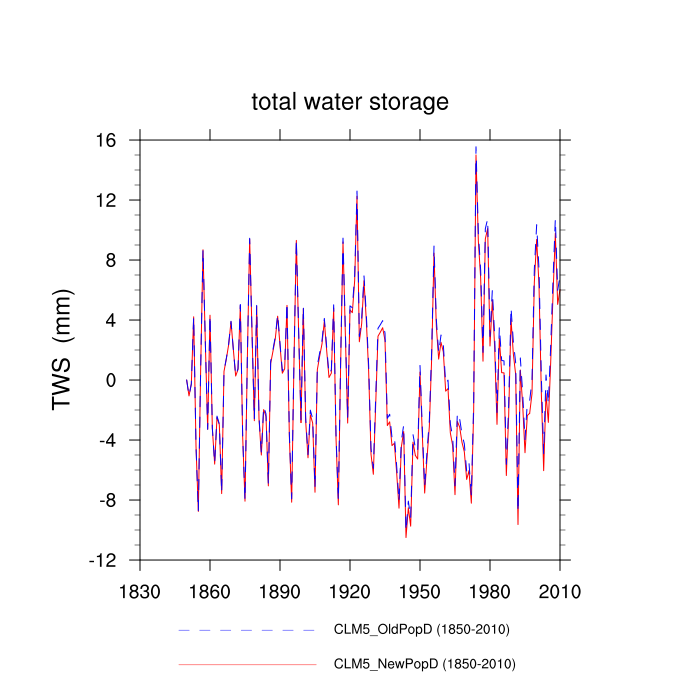
| total water storage (TWS) | TrendPlot | DifferencePlot | AnomalyPlot | ||
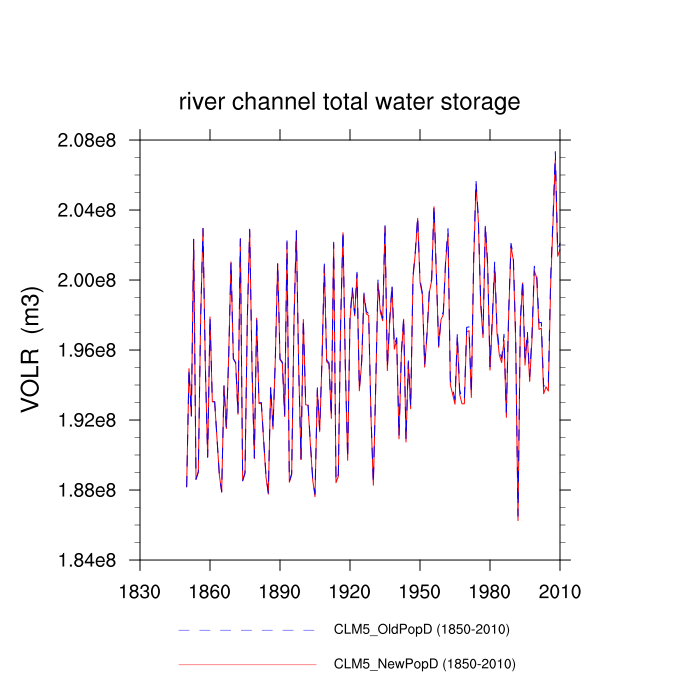
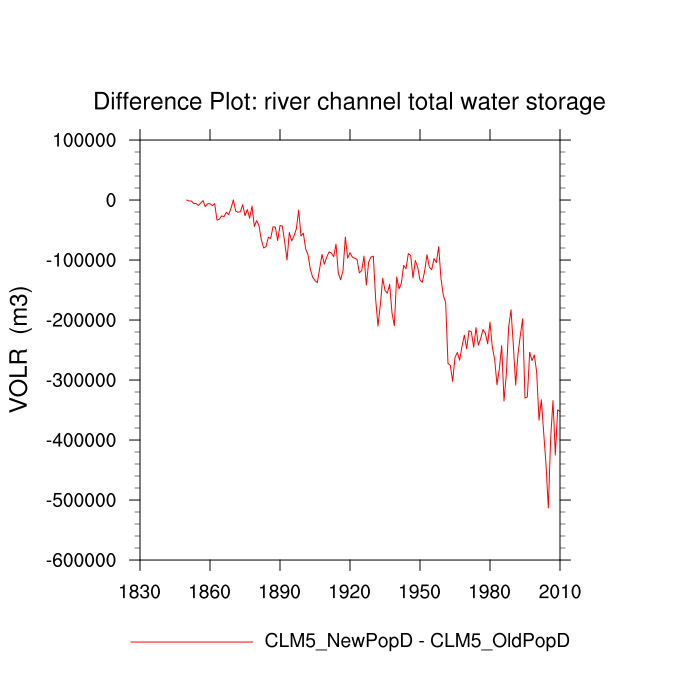
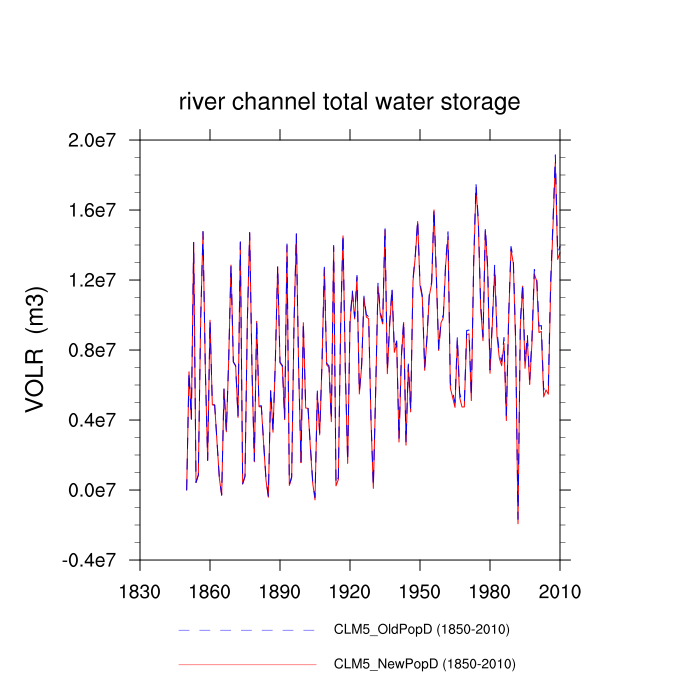
| river channel total water storage (VOLR) | TrendPlot | DifferencePlot | AnomalyPlot | ||
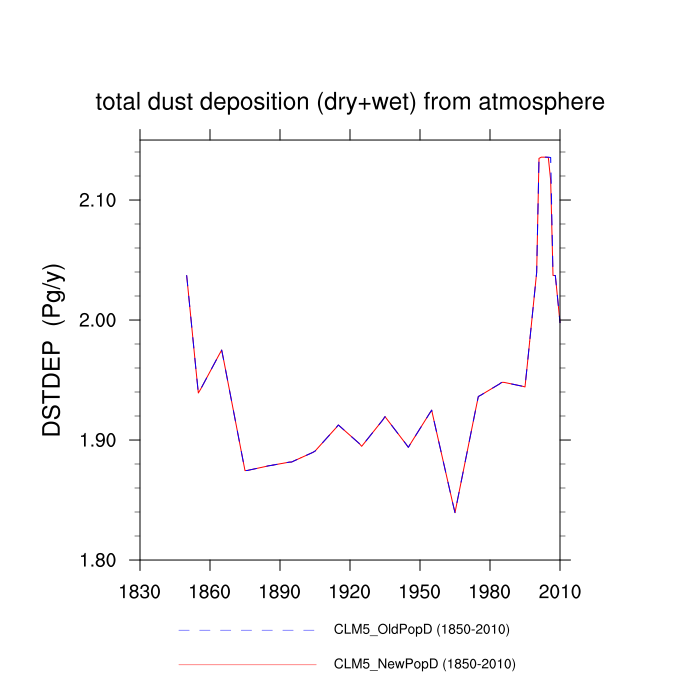
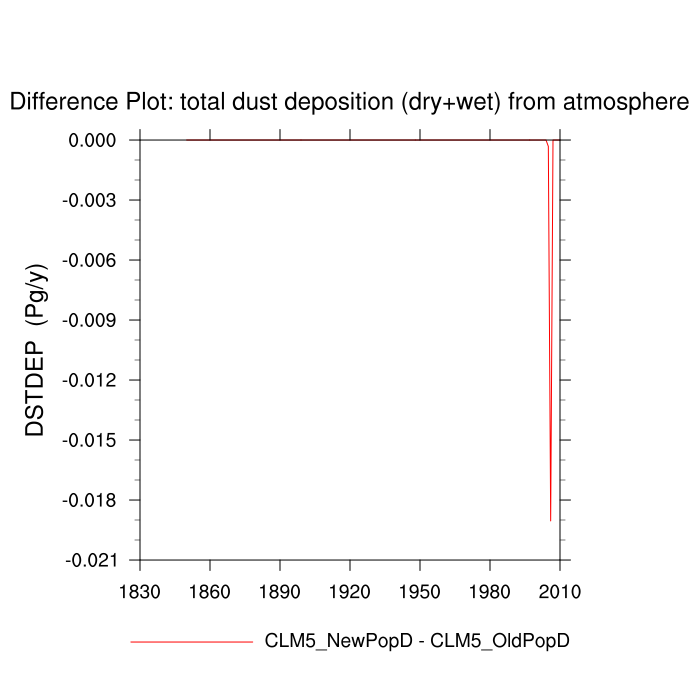
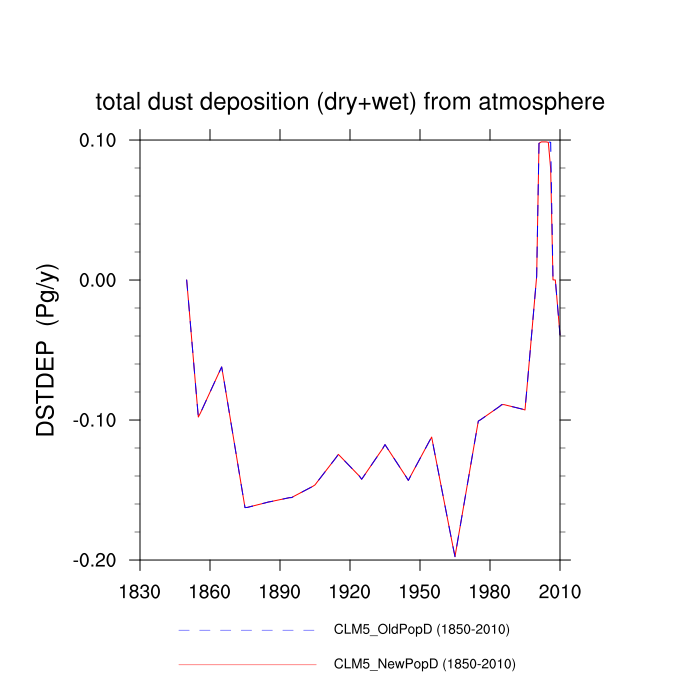
| total dust deposition (dry+wet) from atmosphere (DSTDEP) | TrendPlot | DifferencePlot | AnomalyPlot | ||
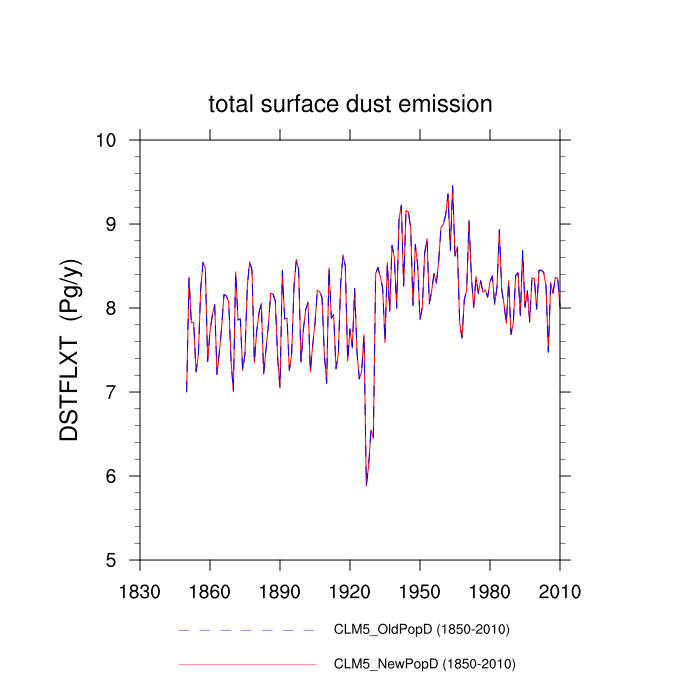
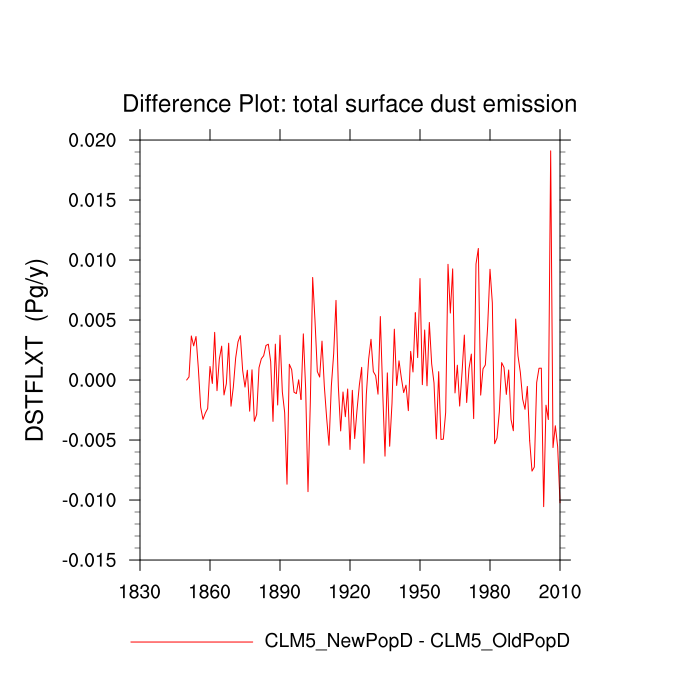
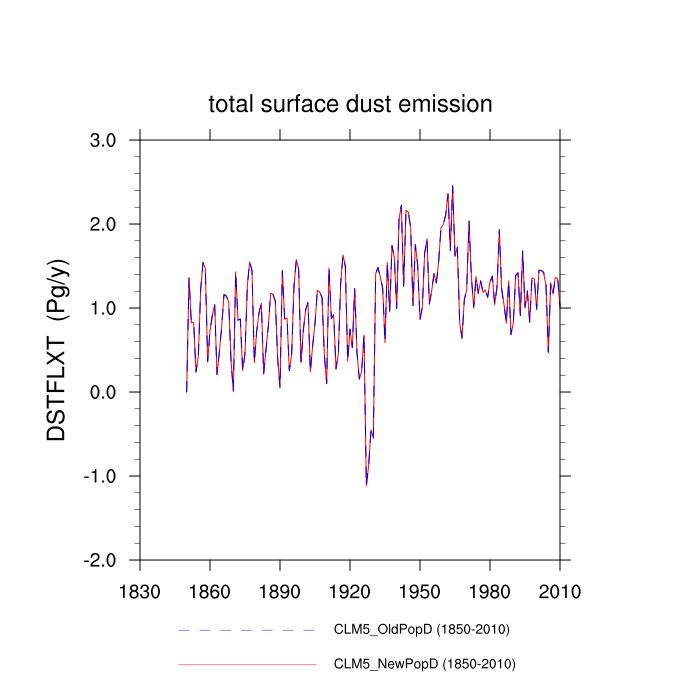
| total surface dust emission (DSTFLXT) | TrendPlot | DifferencePlot | AnomalyPlot | ||
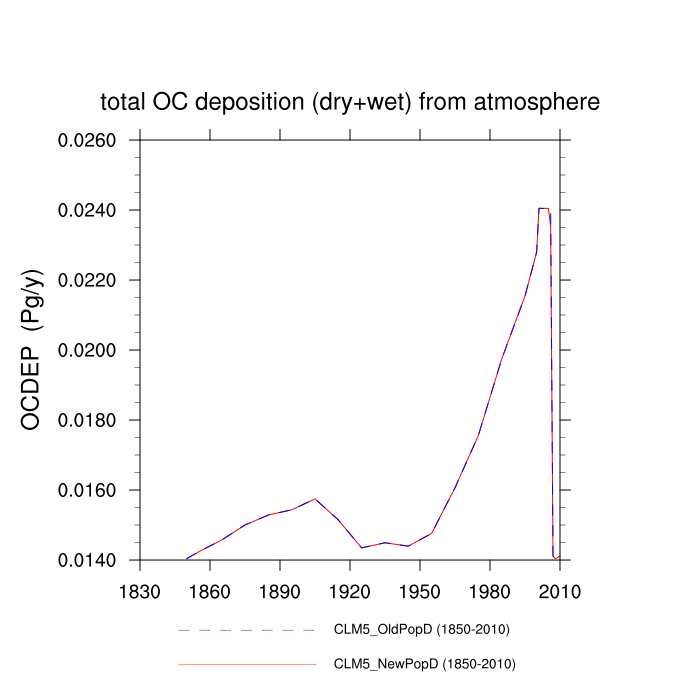
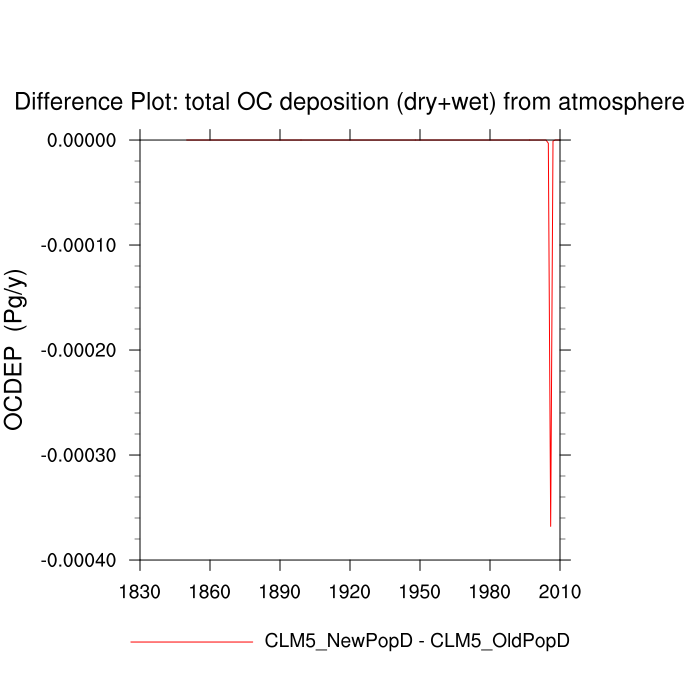
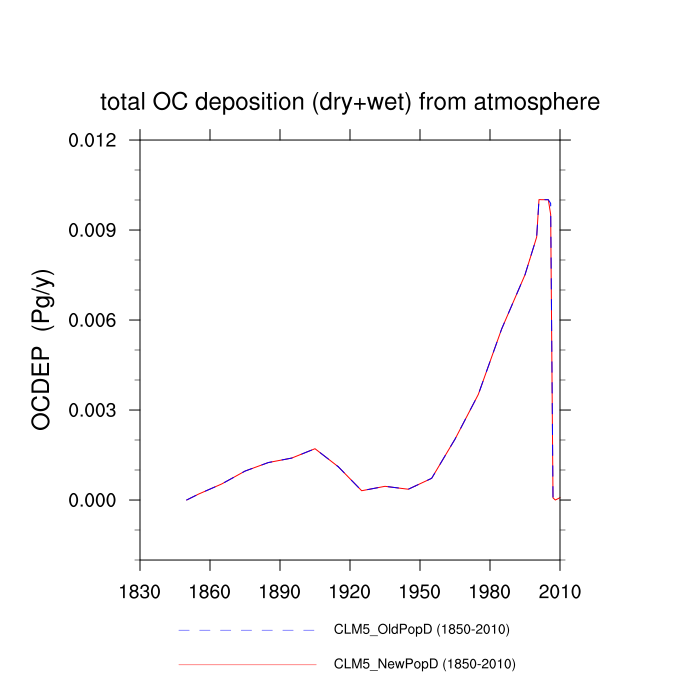
| total OC deposition (dry+wet) from atmosphere (OCDEP) | TrendPlot | DifferencePlot | AnomalyPlot | ||
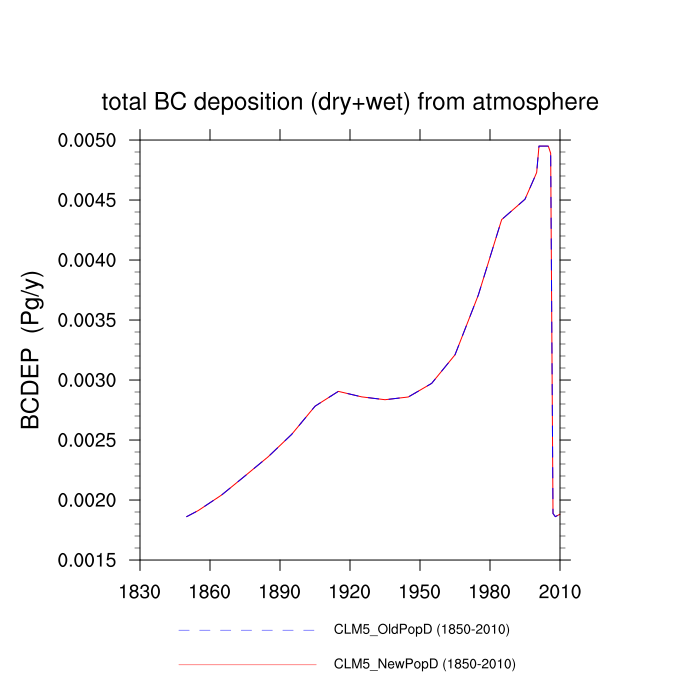
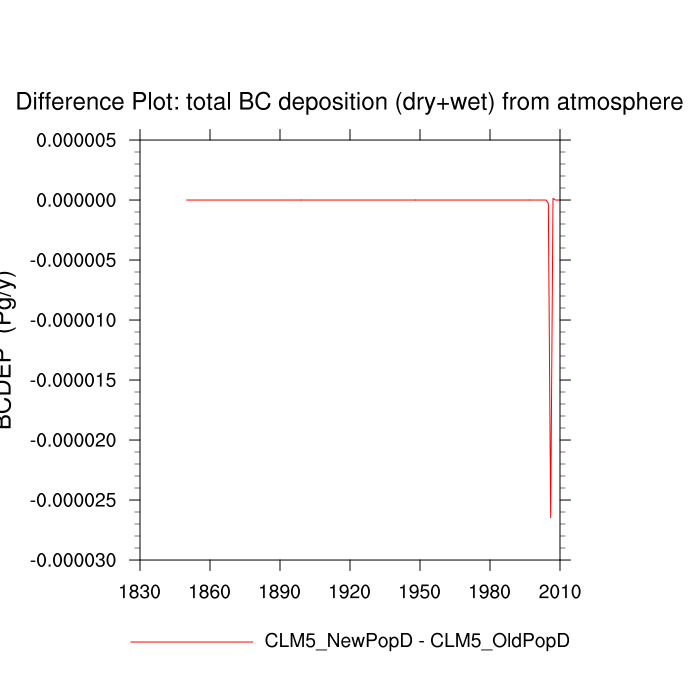
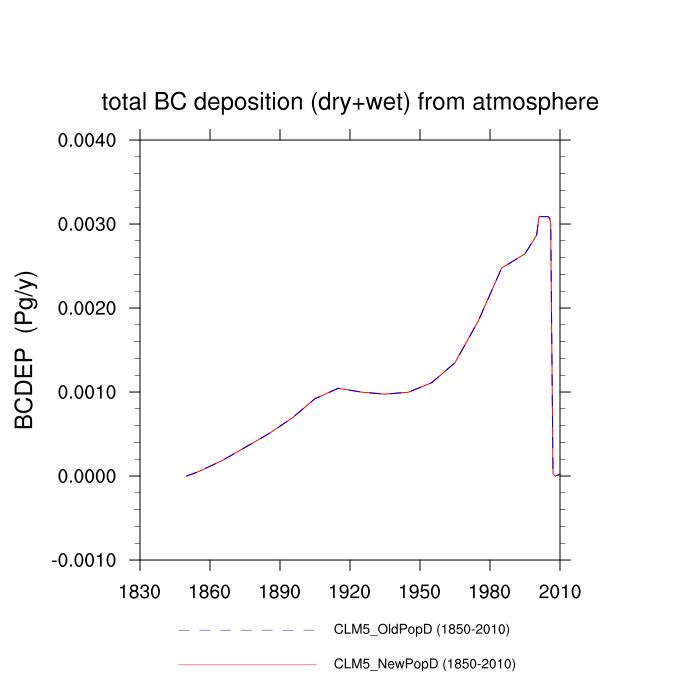
| total BC deposition (dry+wet) from atmosphere (BCDEP) | TrendPlot | DifferencePlot | AnomalyPlot | ||
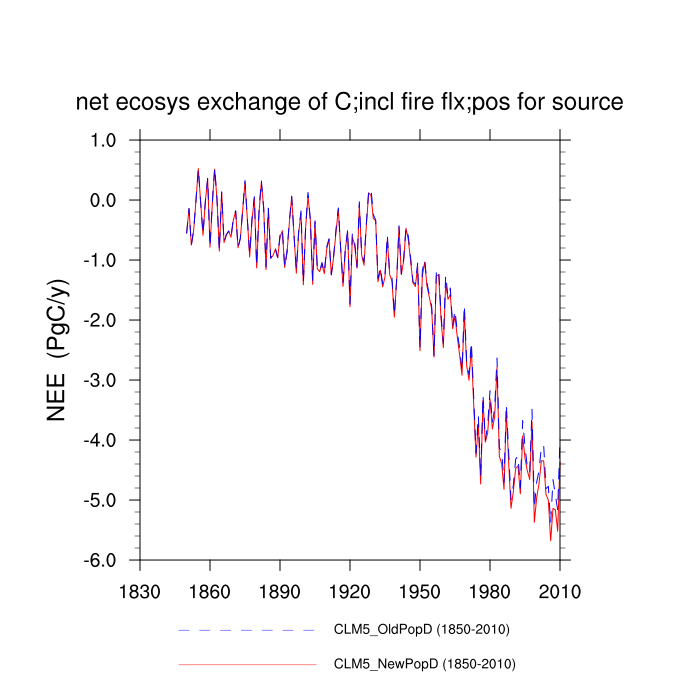
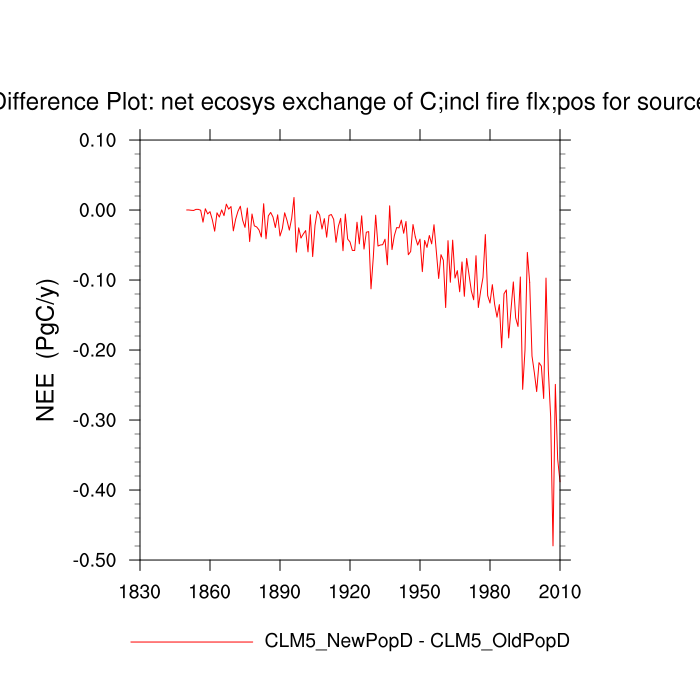
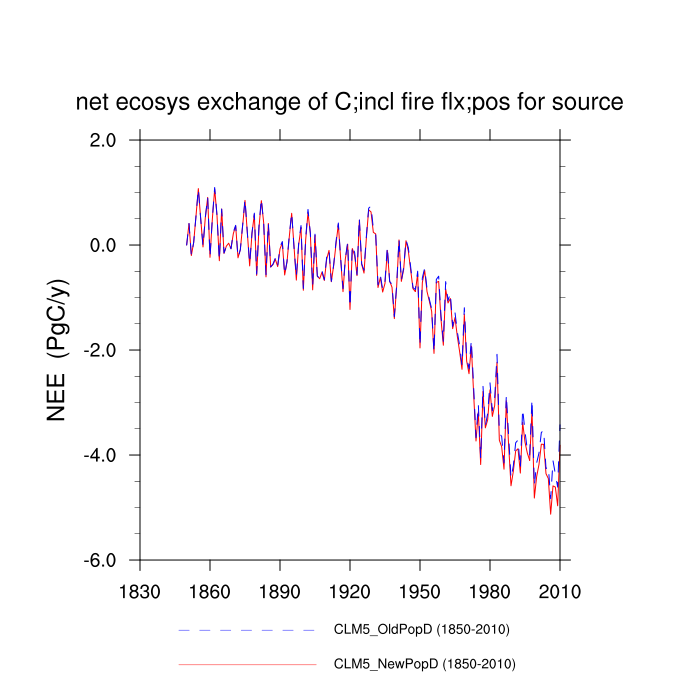
| net ecosys exchange of C;incl fire flx;pos for source (NEE) | TrendPlot | DifferencePlot | AnomalyPlot | ||
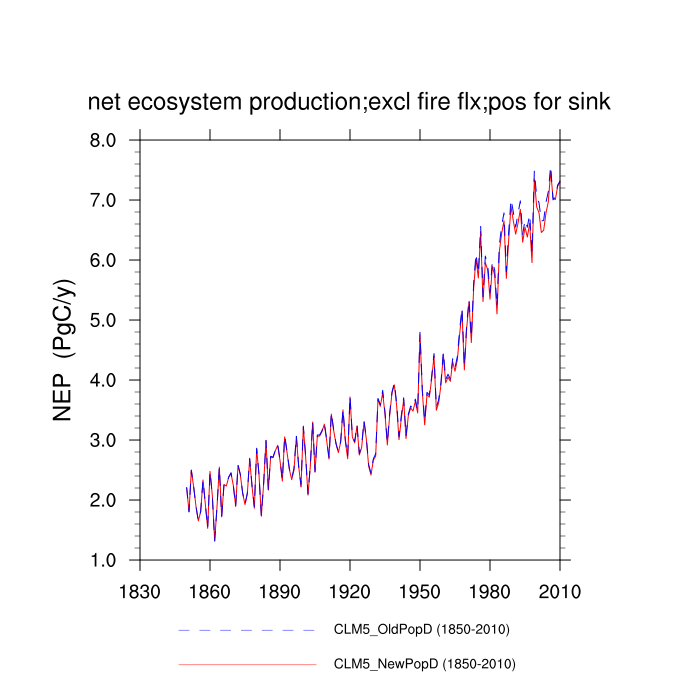
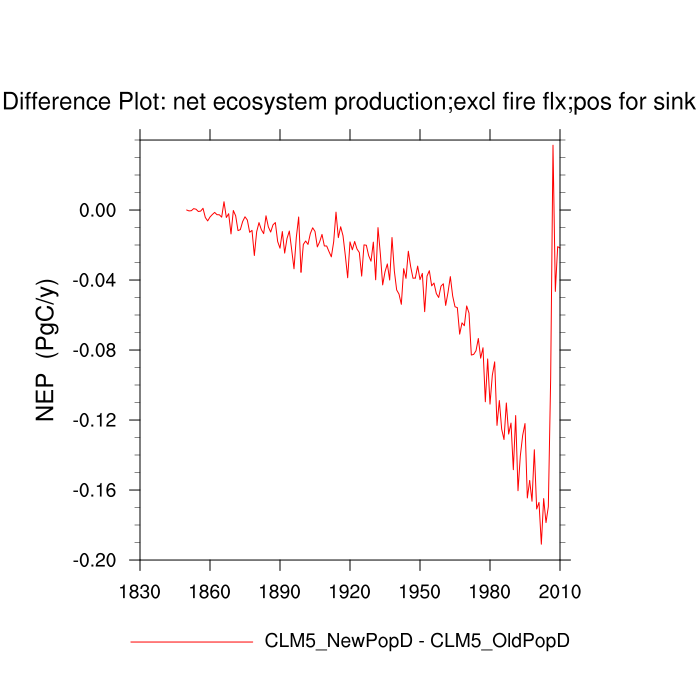
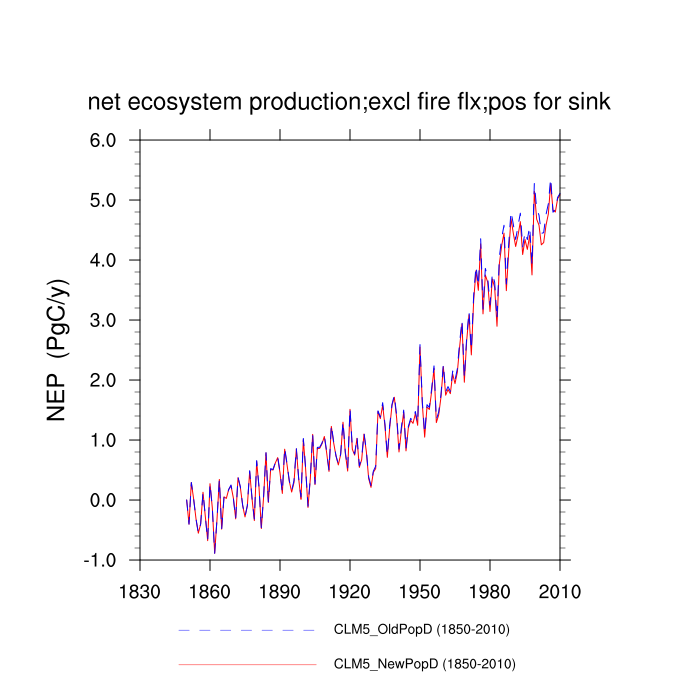
| net ecosystem production;excl fire flx;pos for sink (NEP) | TrendPlot | DifferencePlot | AnomalyPlot | ||
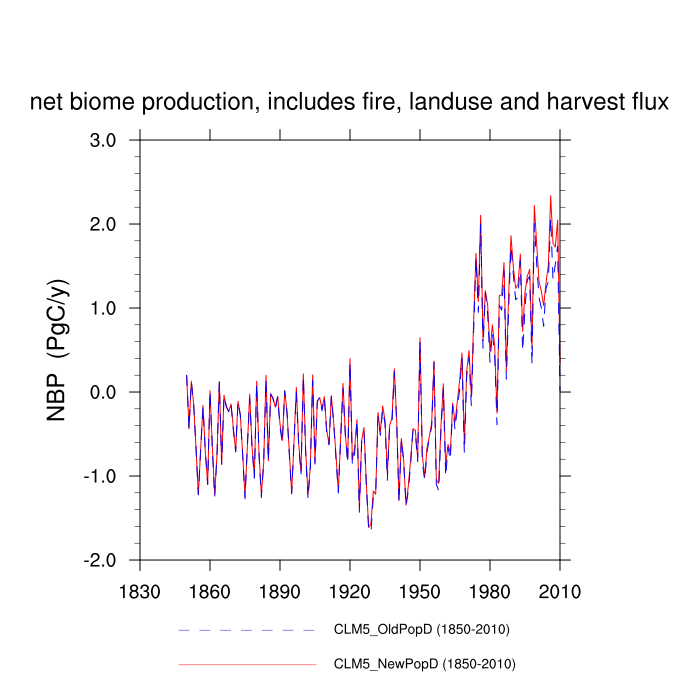
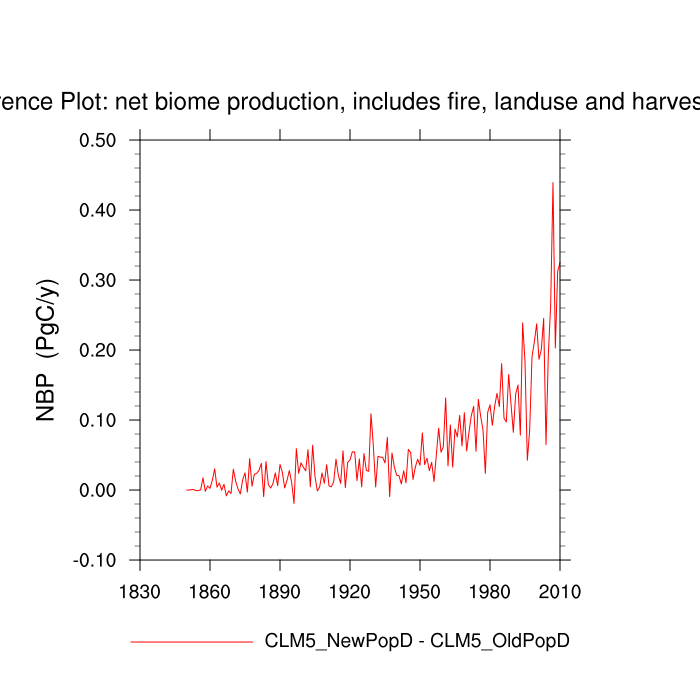
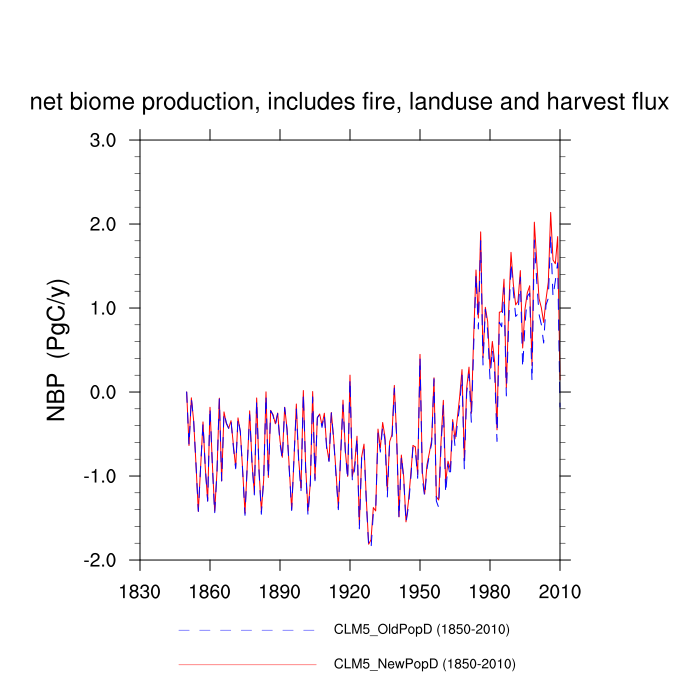
| net biome production, includes fire, landuse and harvest flux (NBP) | TrendPlot | DifferencePlot | AnomalyPlot | ||
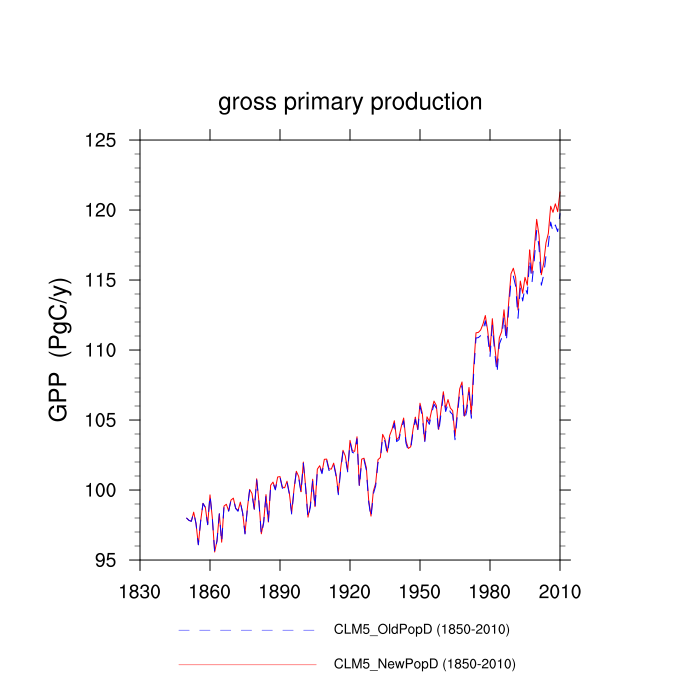
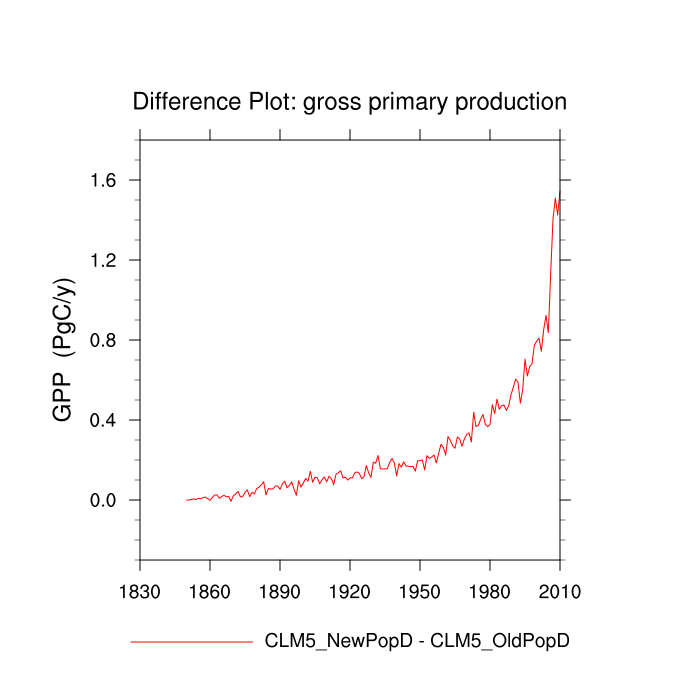
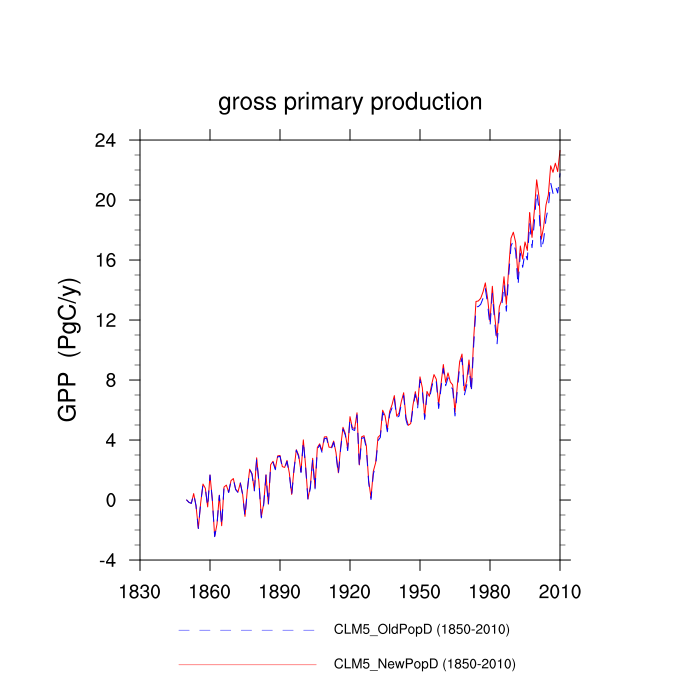
| gross primary production (GPP) | TrendPlot | DifferencePlot | AnomalyPlot | ||
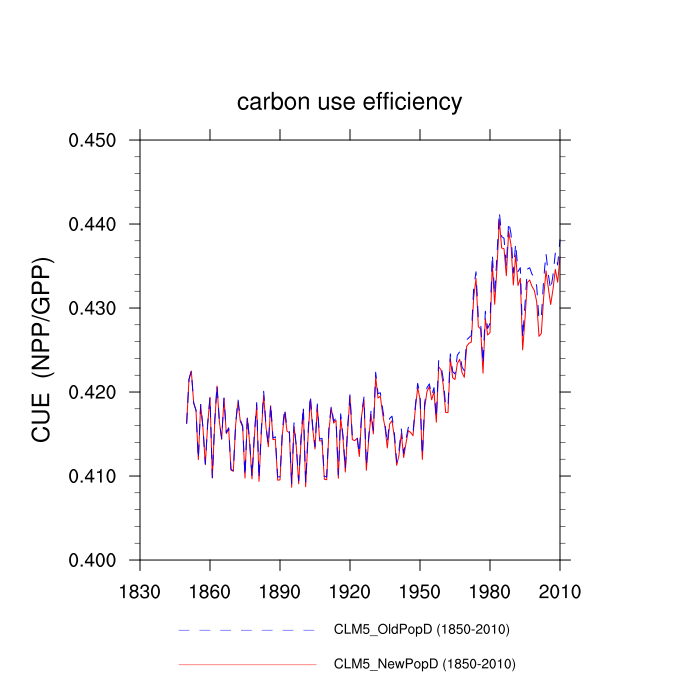
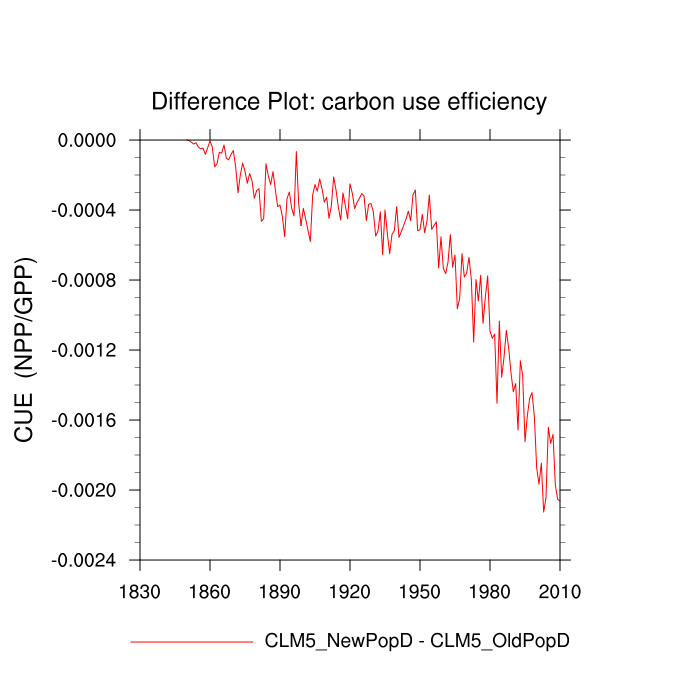
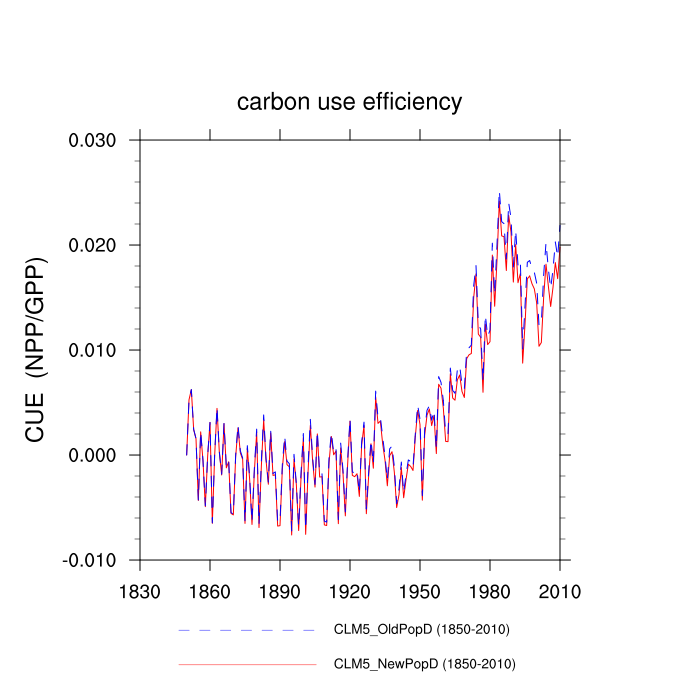
| carbon use efficiency (CUE) | TrendPlot | DifferencePlot | AnomalyPlot | ||
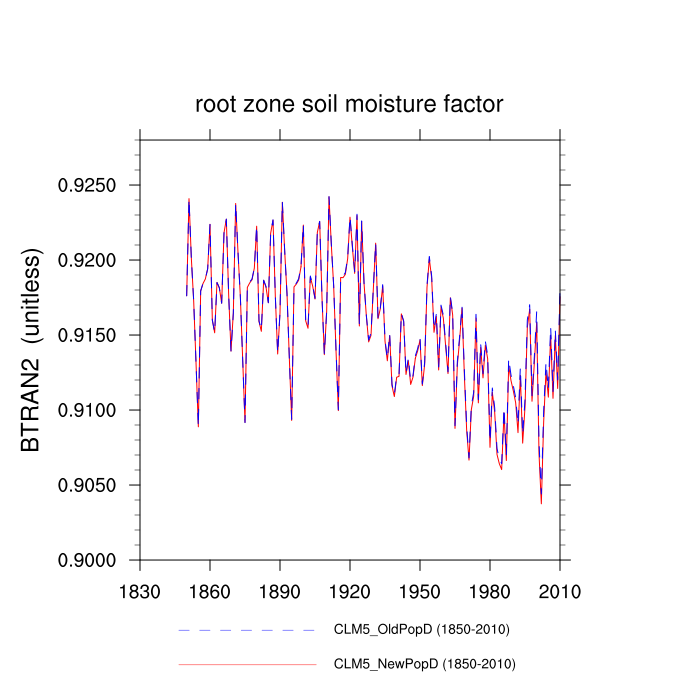
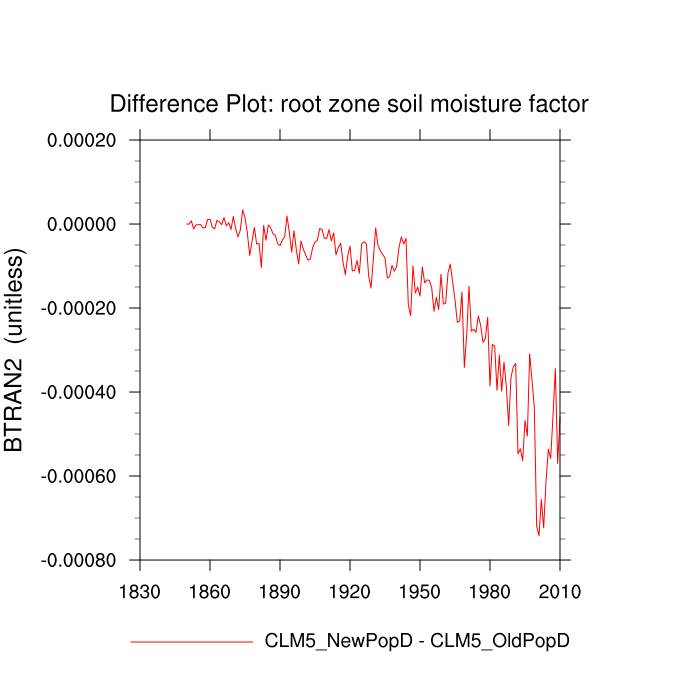
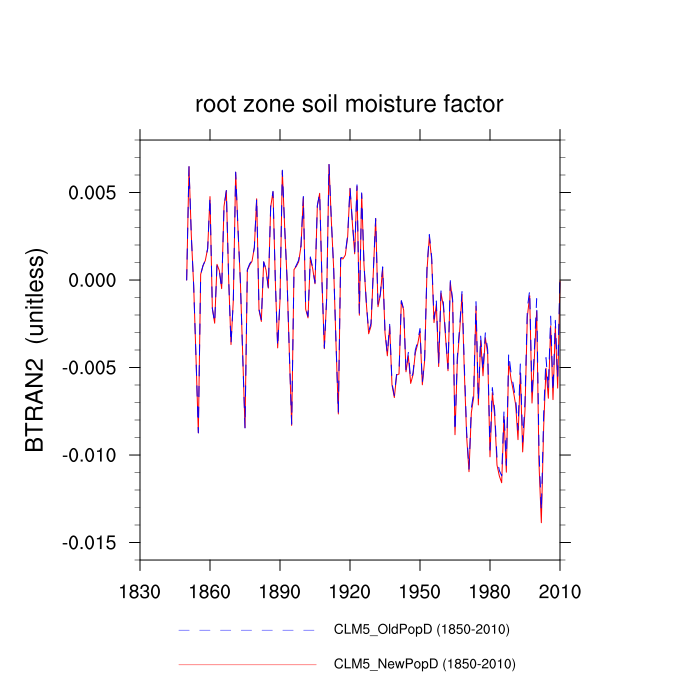
| root zone soil moisture factor (BTRAN2) | TrendPlot | DifferencePlot | AnomalyPlot | ||
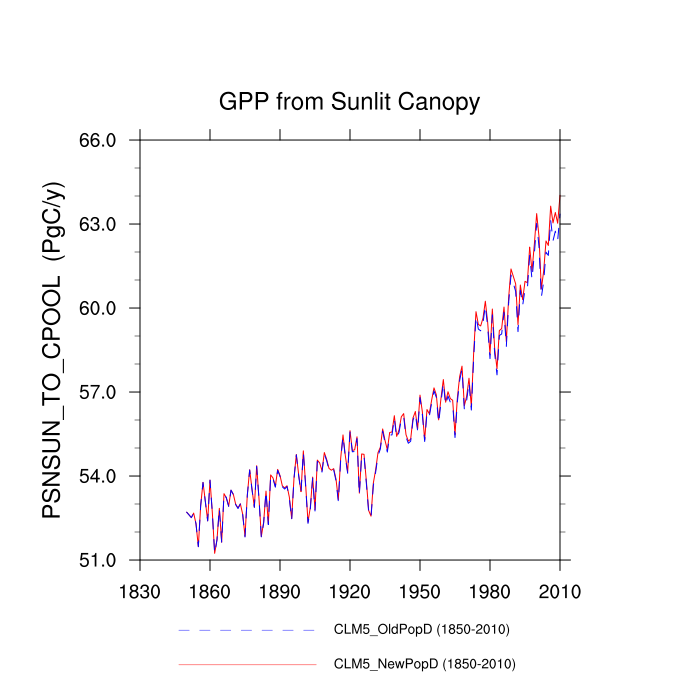
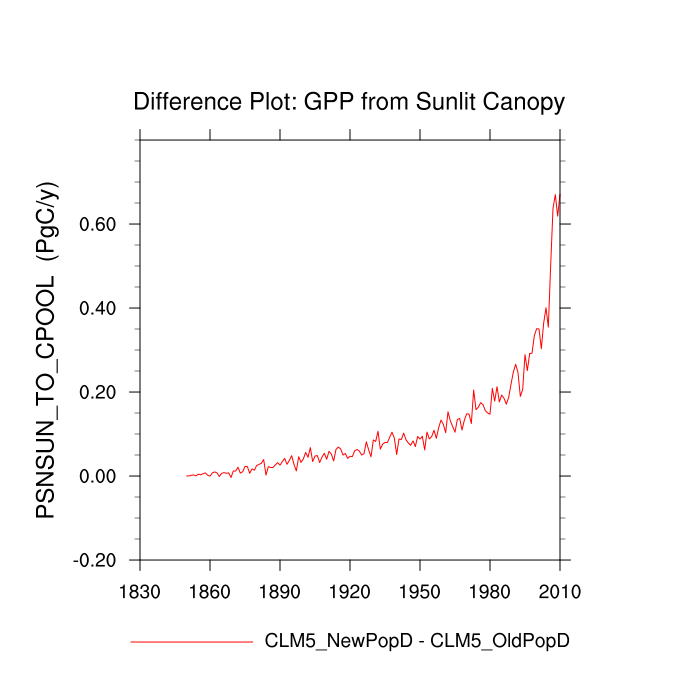
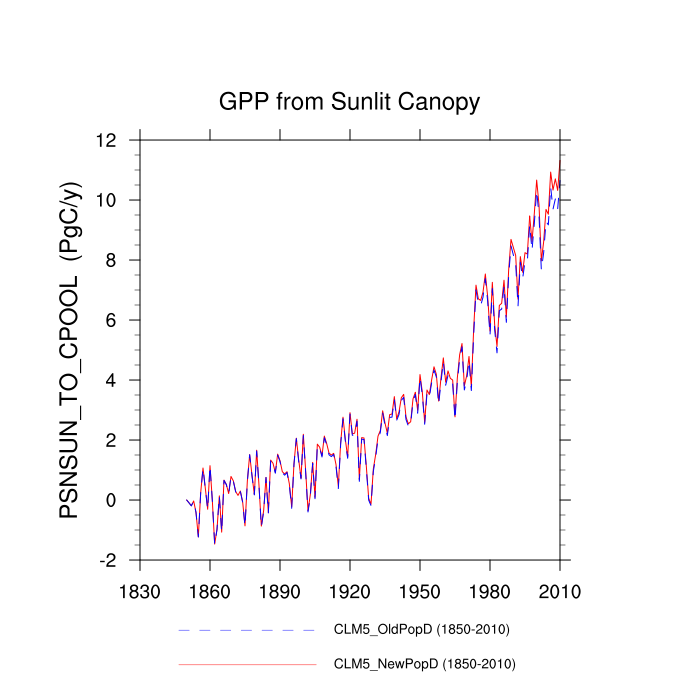
| GPP from Sunlit Canopy (PSNSUN_TO_CPOOL) | TrendPlot | DifferencePlot | AnomalyPlot | ||
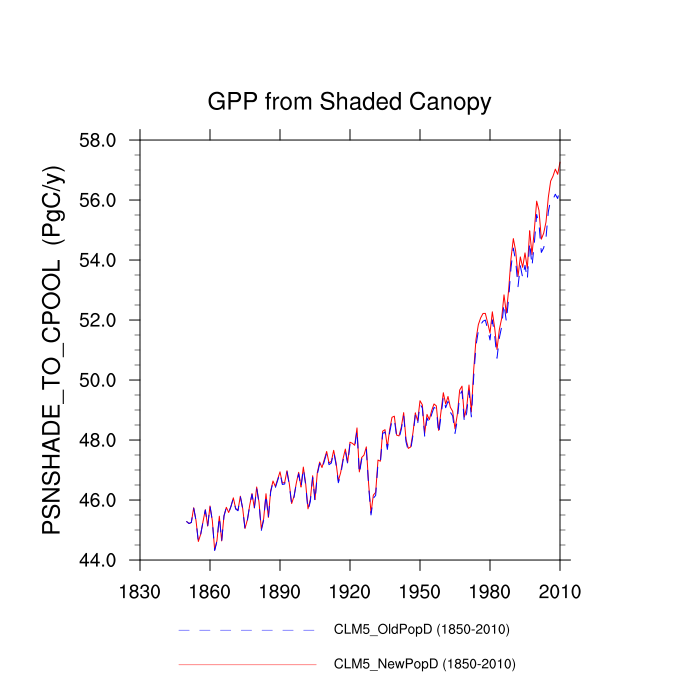
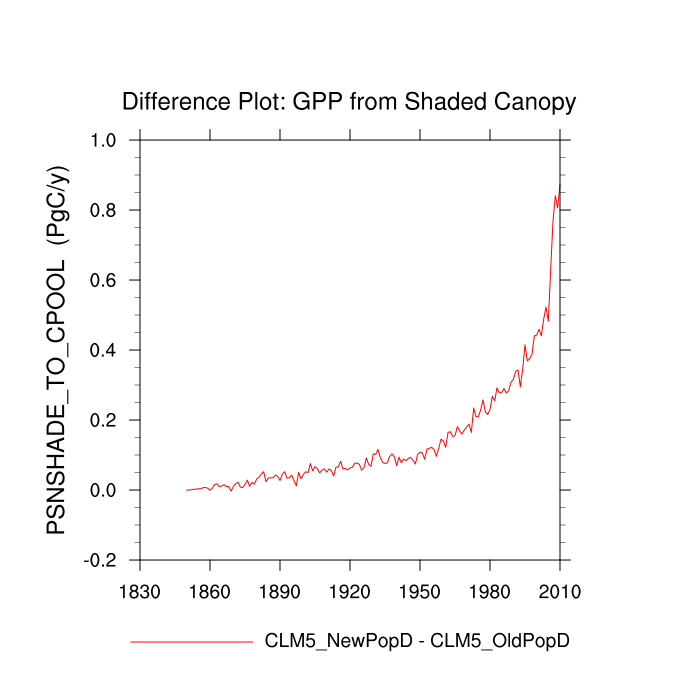
| GPP from Shaded Canopy (PSNSHADE_TO_CPOOL) | TrendPlot | DifferencePlot | AnomalyPlot | ||
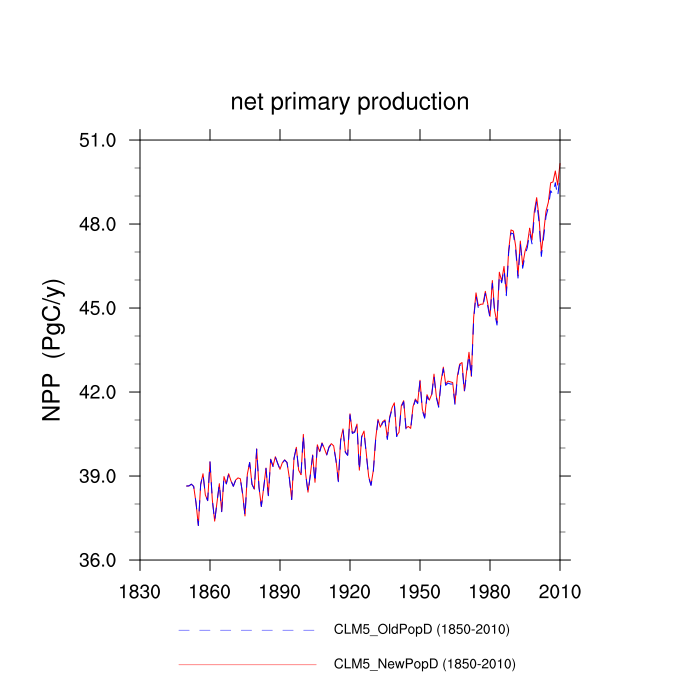
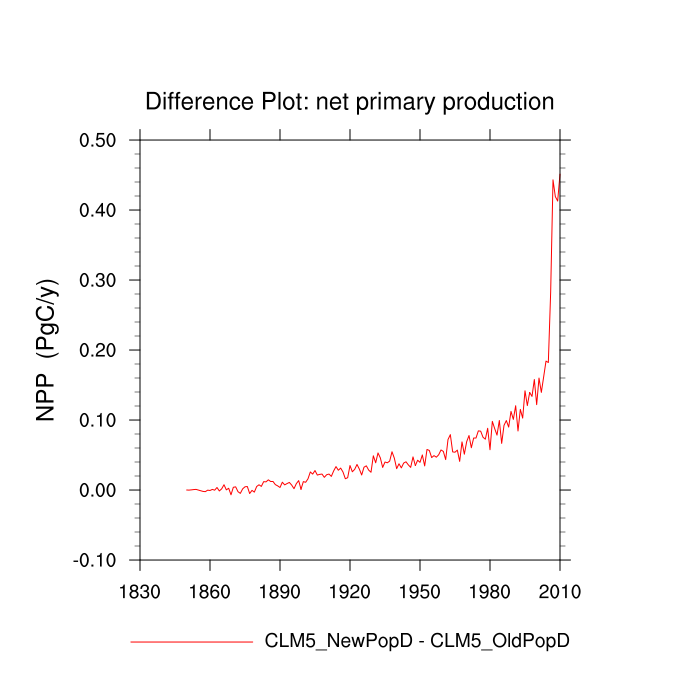
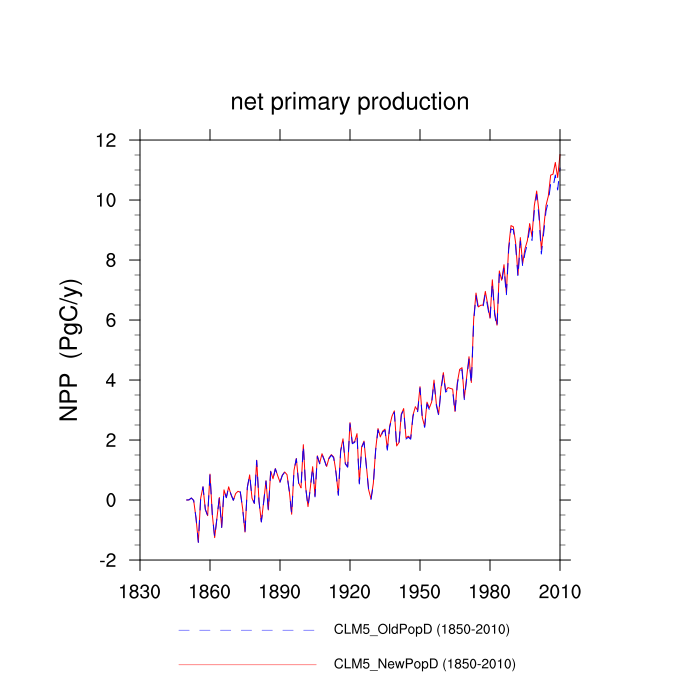
| net primary production (NPP) | TrendPlot | DifferencePlot | AnomalyPlot | ||
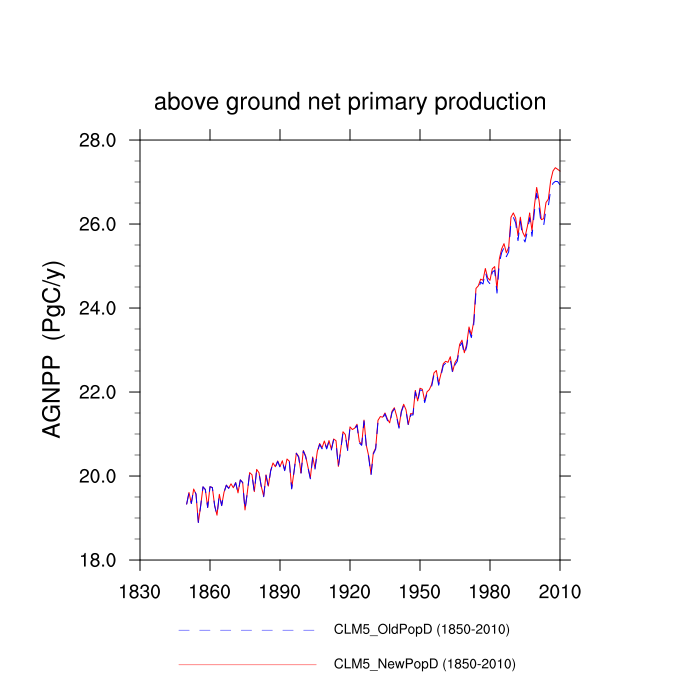
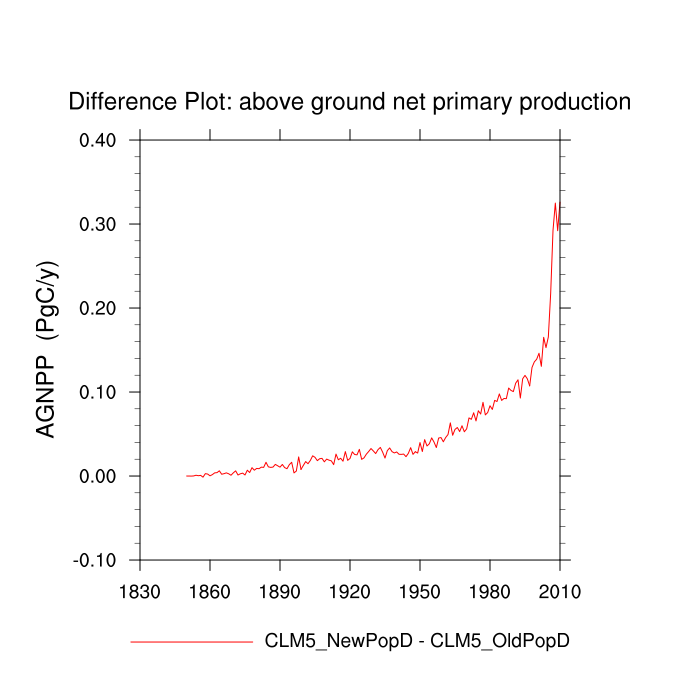
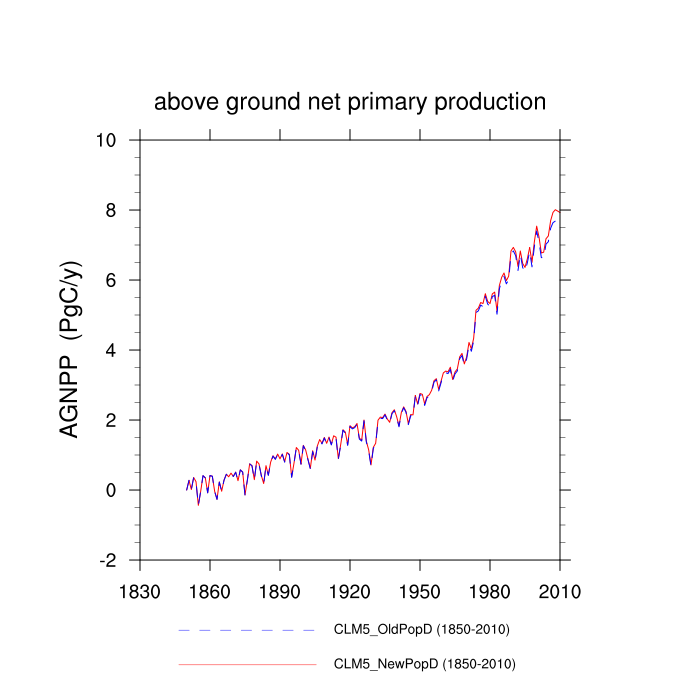
| above ground net primary production (AGNPP) | TrendPlot | DifferencePlot | AnomalyPlot | ||
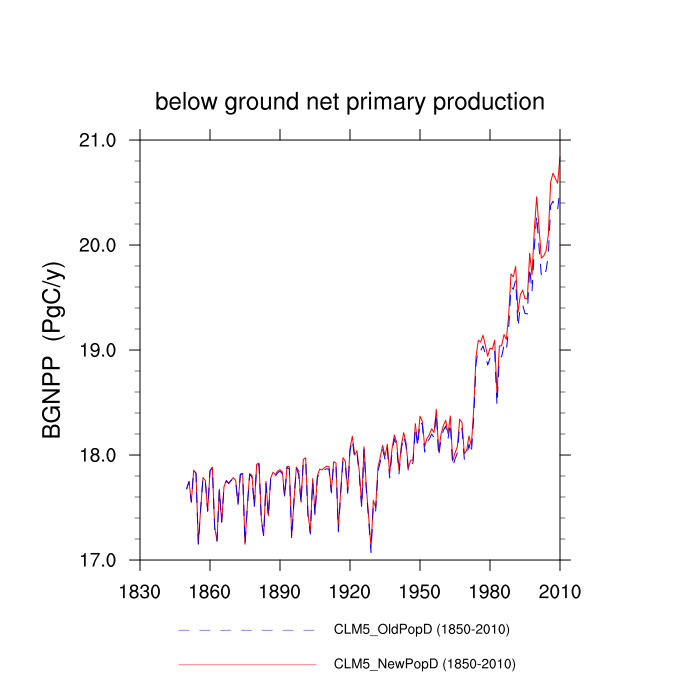
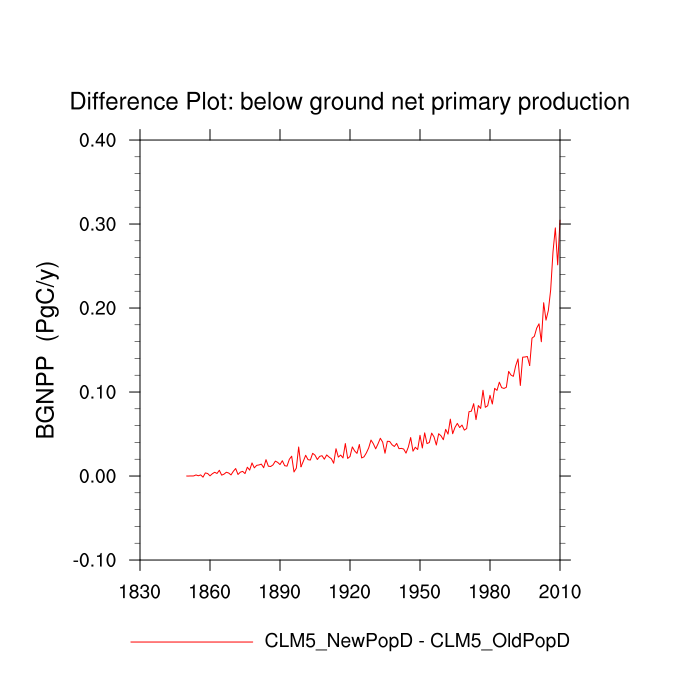
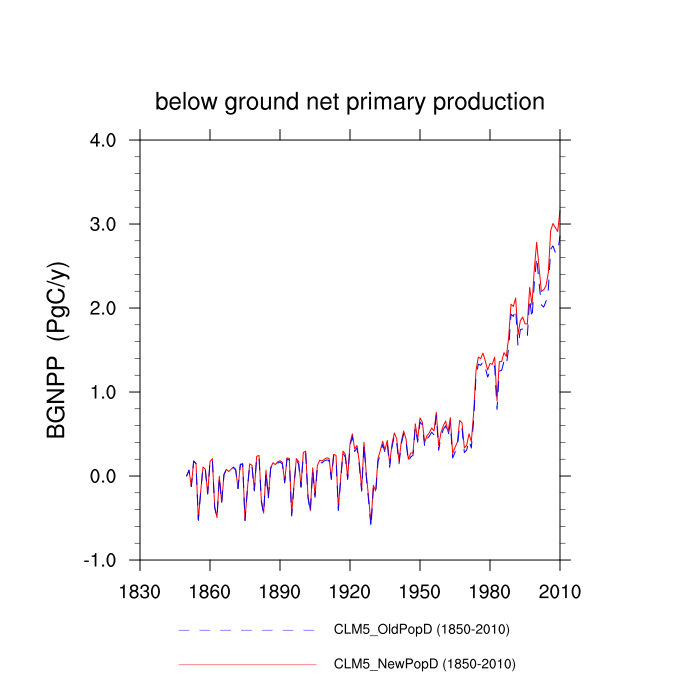
| below ground net primary production (BGNPP) | TrendPlot | DifferencePlot | AnomalyPlot | ||
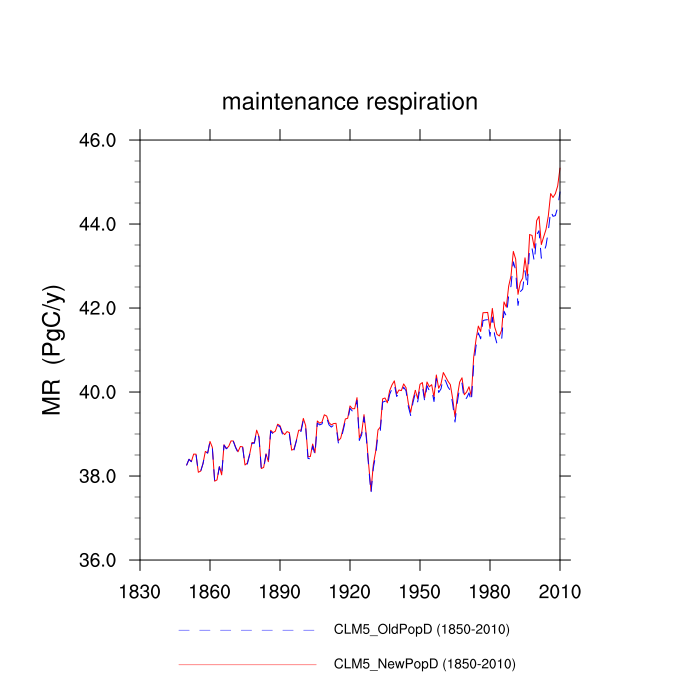
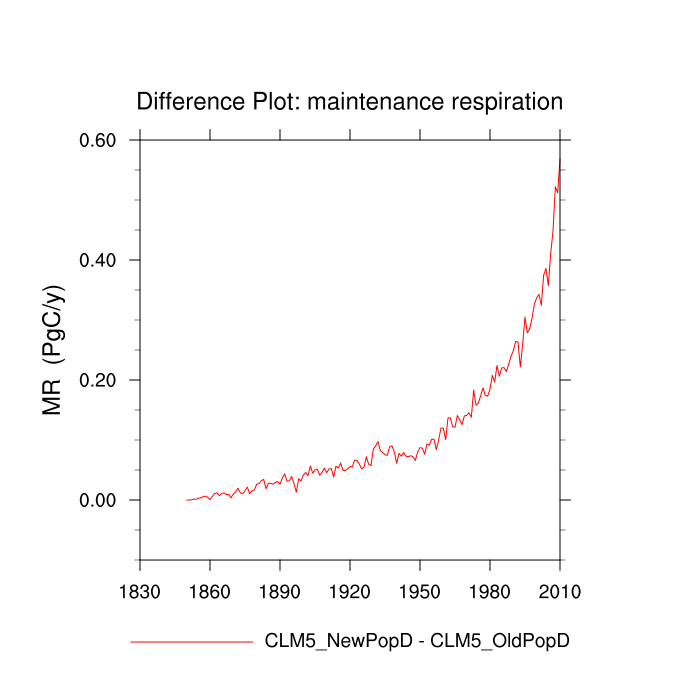
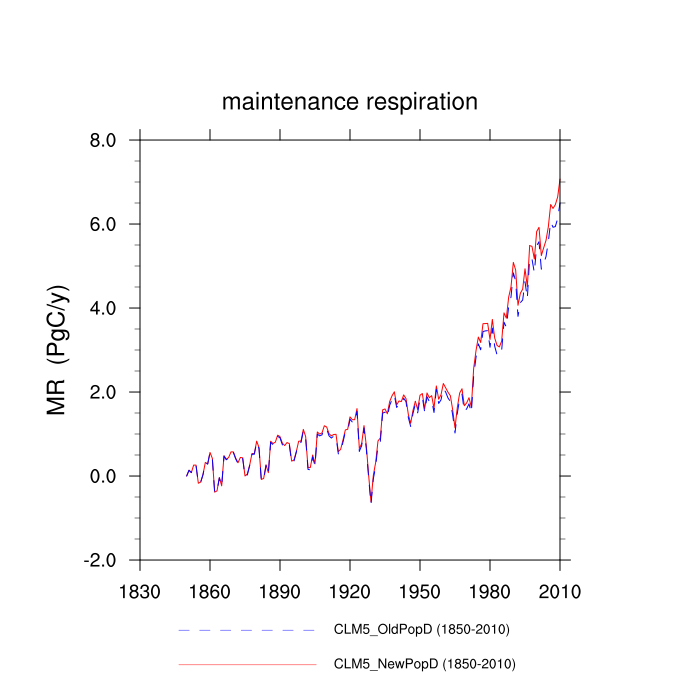
| maintenance respiration (MR) | TrendPlot | DifferencePlot | AnomalyPlot | ||
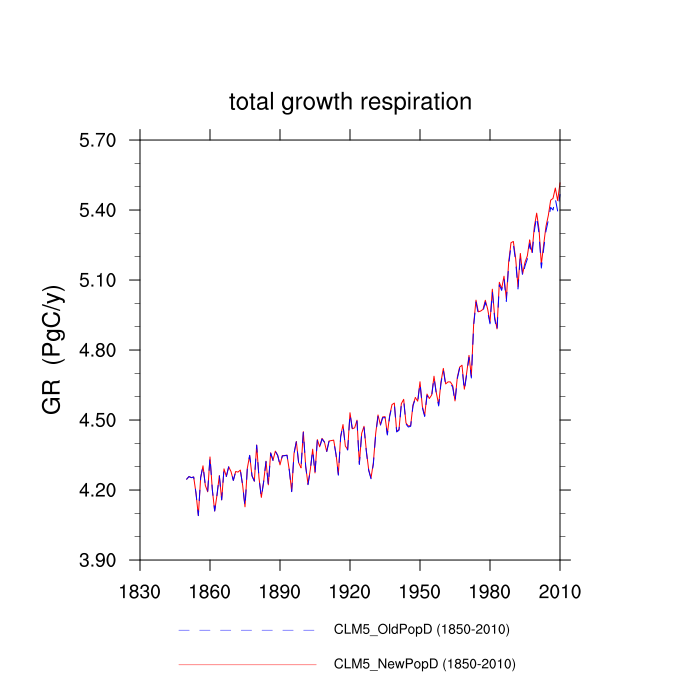
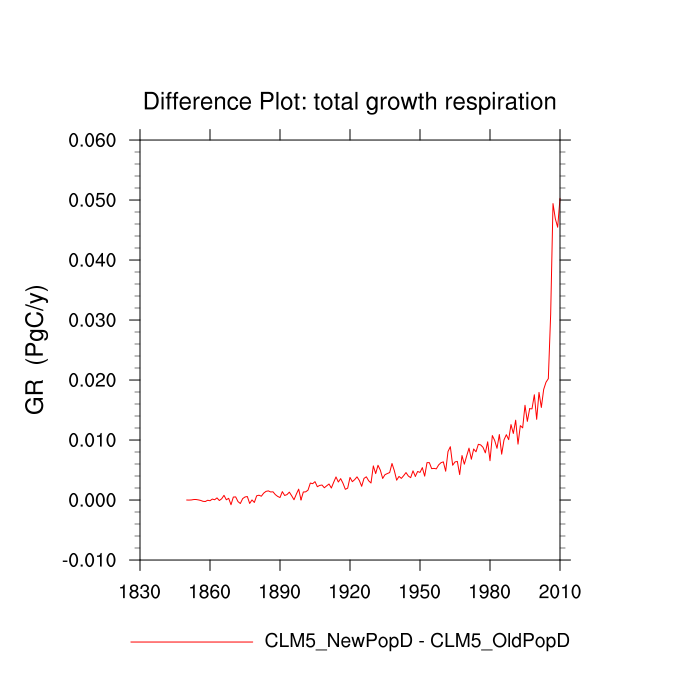
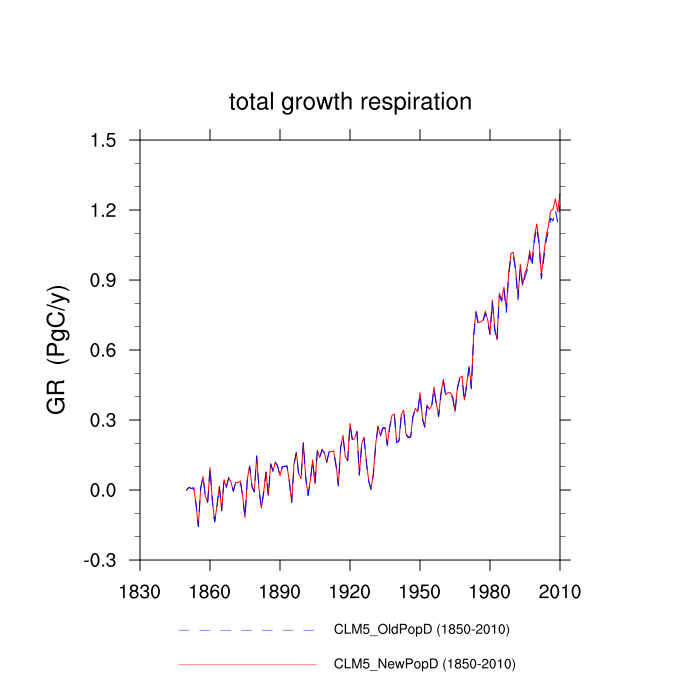
| total growth respiration (GR) | TrendPlot | DifferencePlot | AnomalyPlot | ||
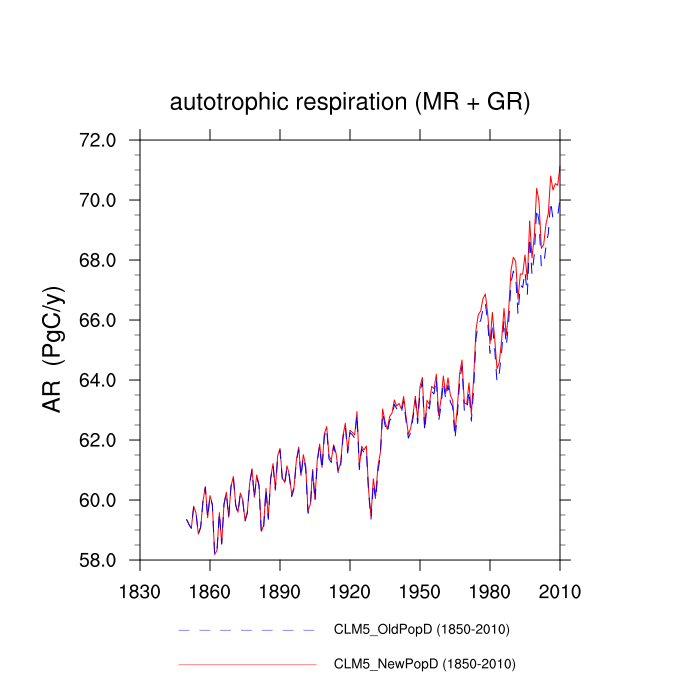
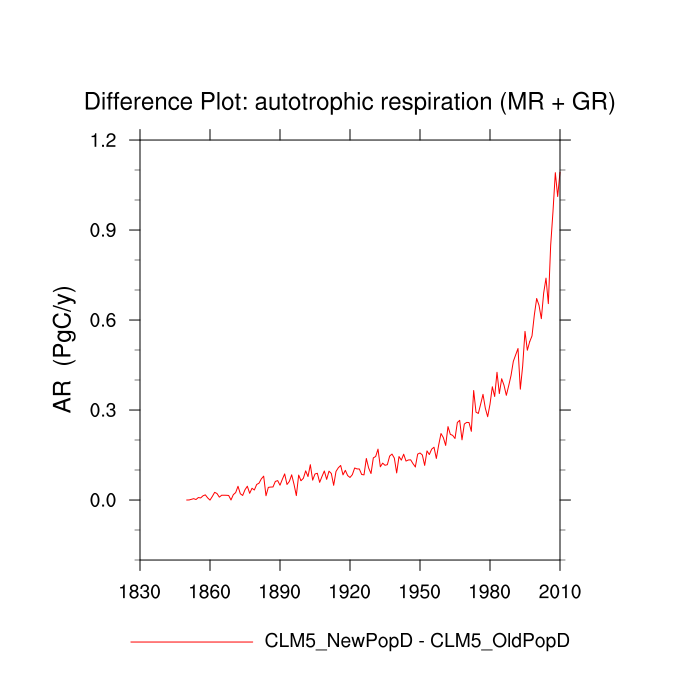
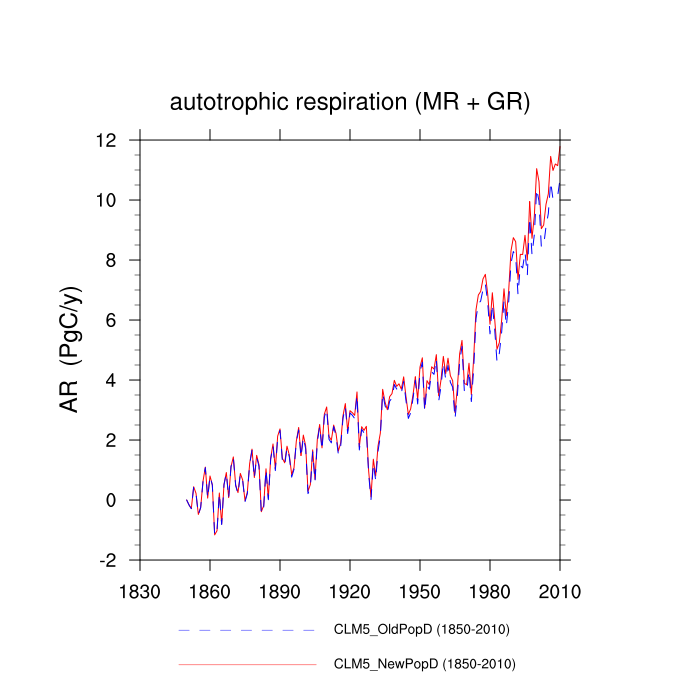
| autotrophic respiration (MR + GR) (AR) | TrendPlot | DifferencePlot | AnomalyPlot | ||
| litter hetereotrophic respiration (LITHR) | --- | --- | --- | ||
| SOM hetereotrophic respiration (SOMHR) | --- | --- | --- | ||
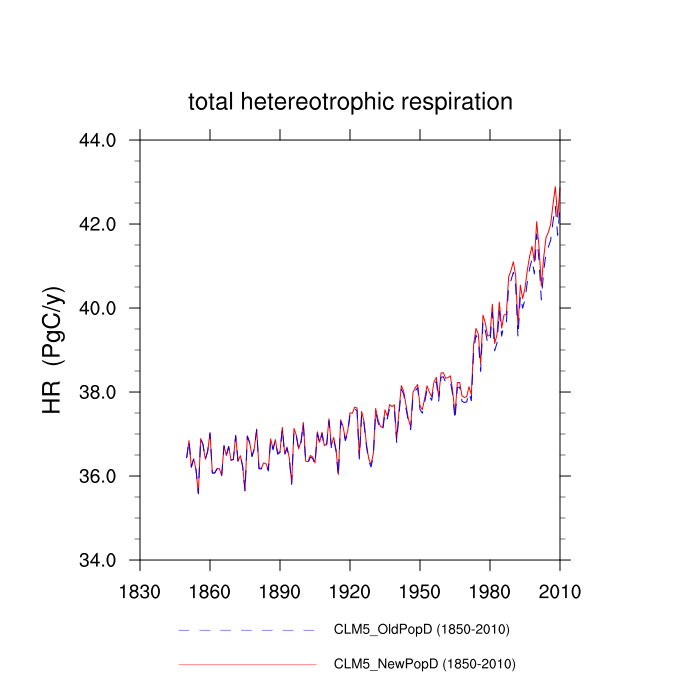
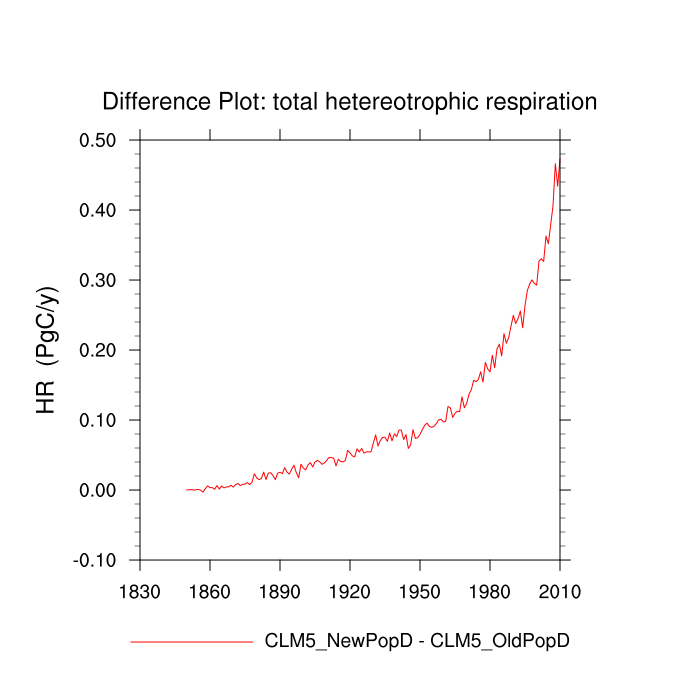
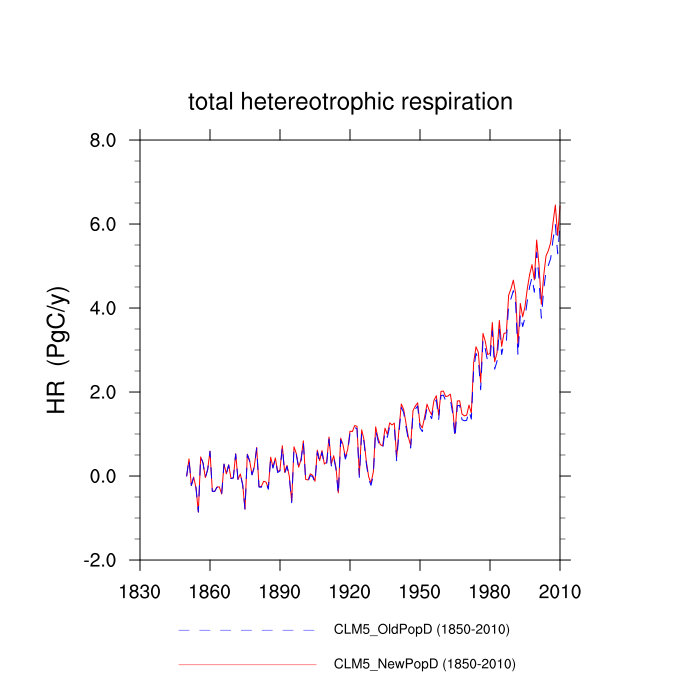
| total hetereotrophic respiration (HR) | TrendPlot | DifferencePlot | AnomalyPlot | ||
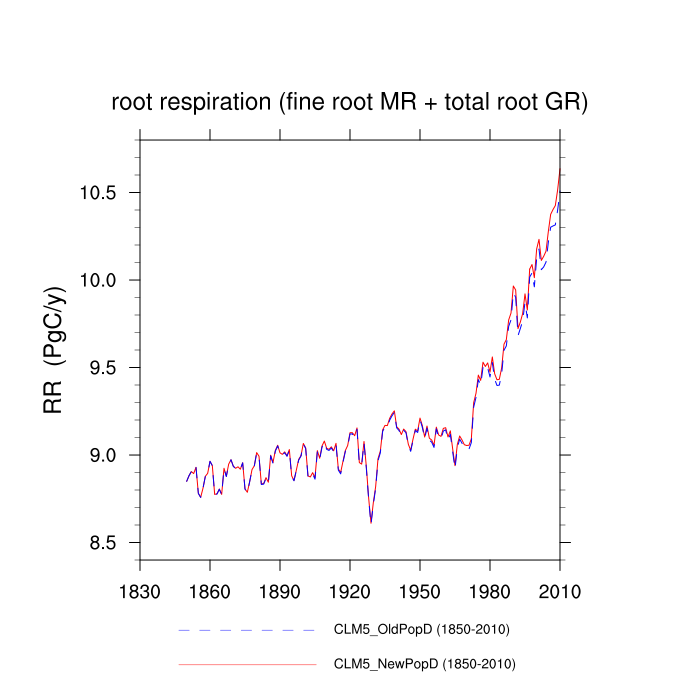
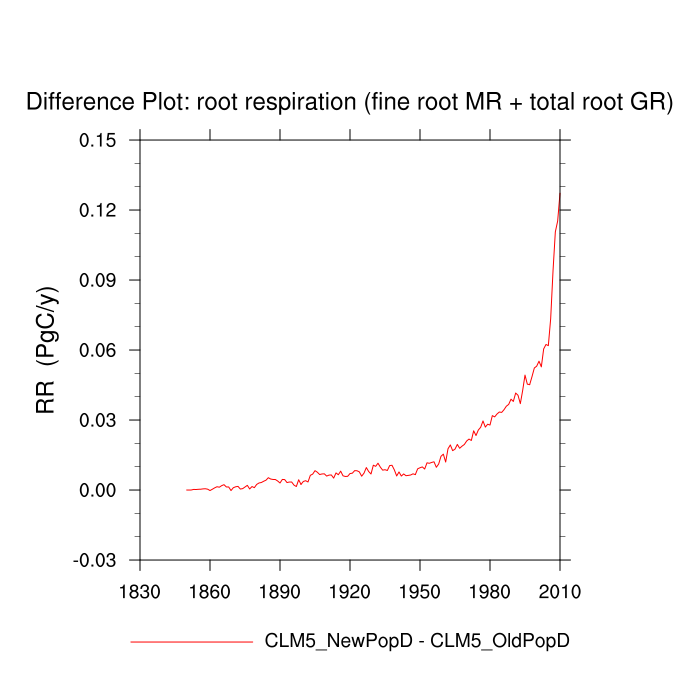
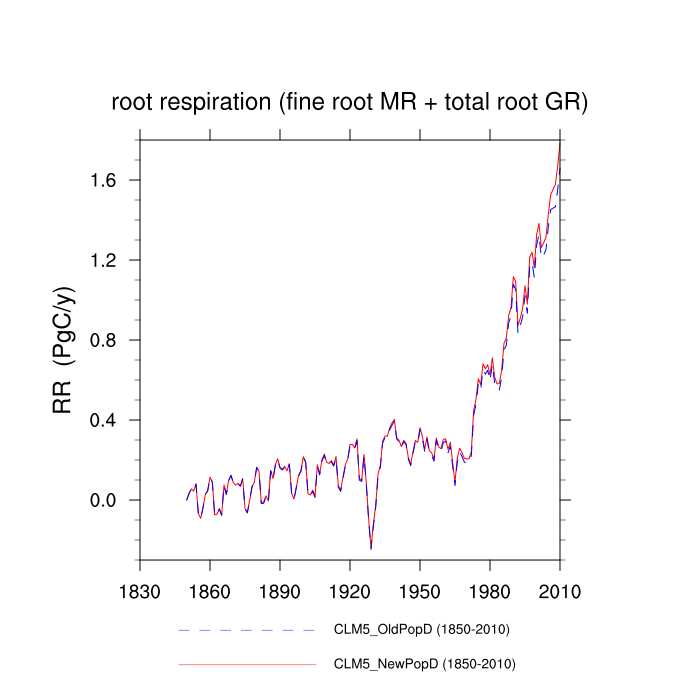
| root respiration (fine root MR + total root GR) (RR) | TrendPlot | DifferencePlot | AnomalyPlot | ||
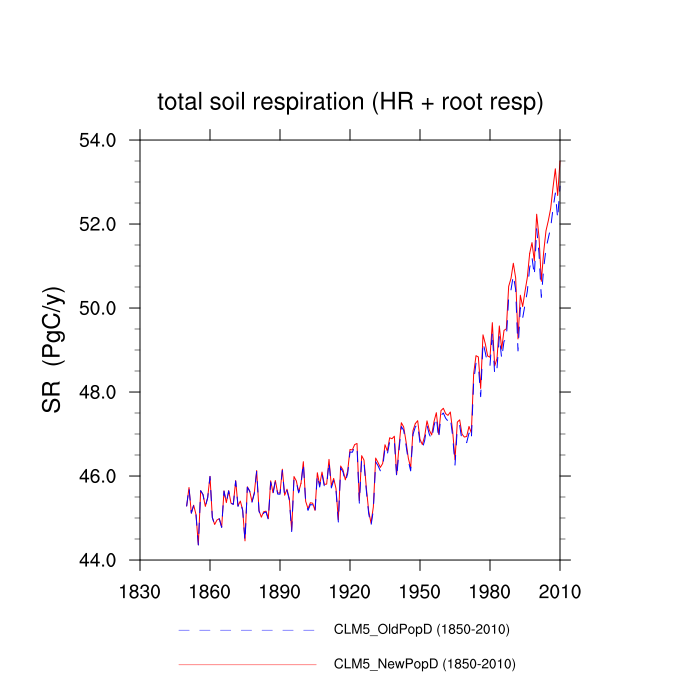
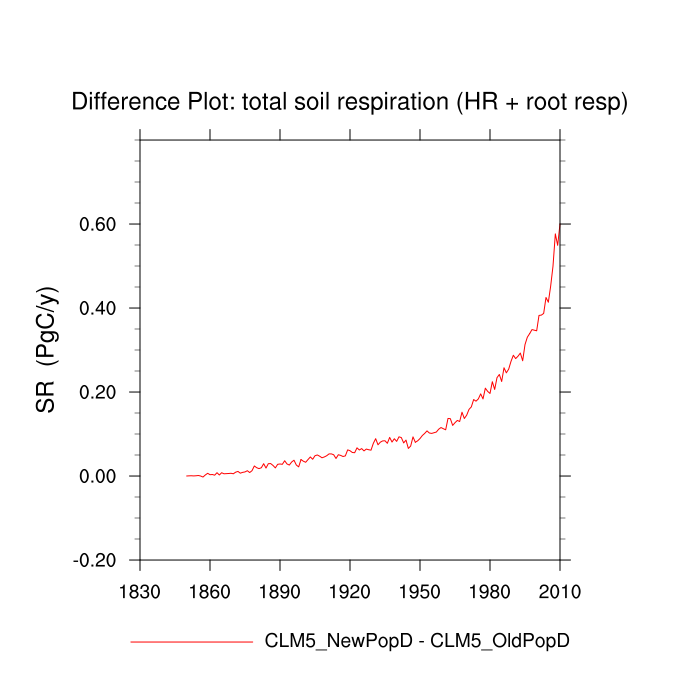
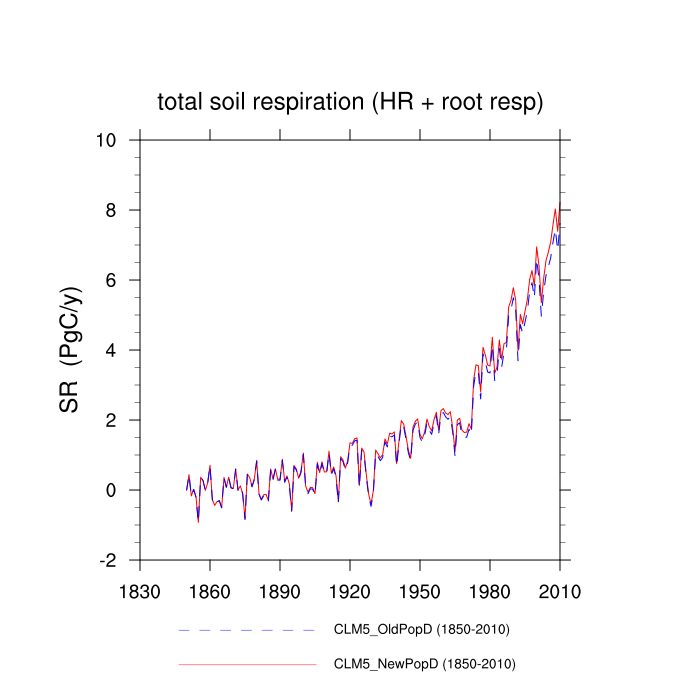
| total soil respiration (HR + root resp) (SR) | TrendPlot | DifferencePlot | AnomalyPlot | ||
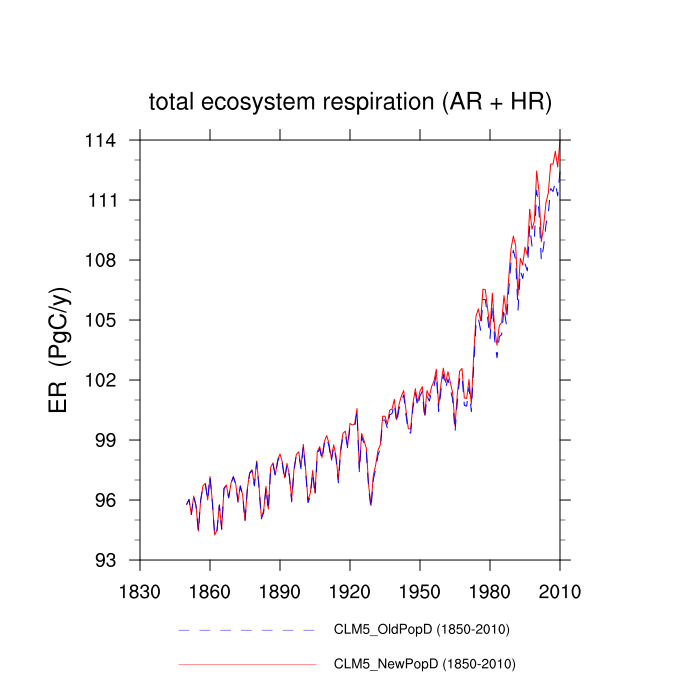
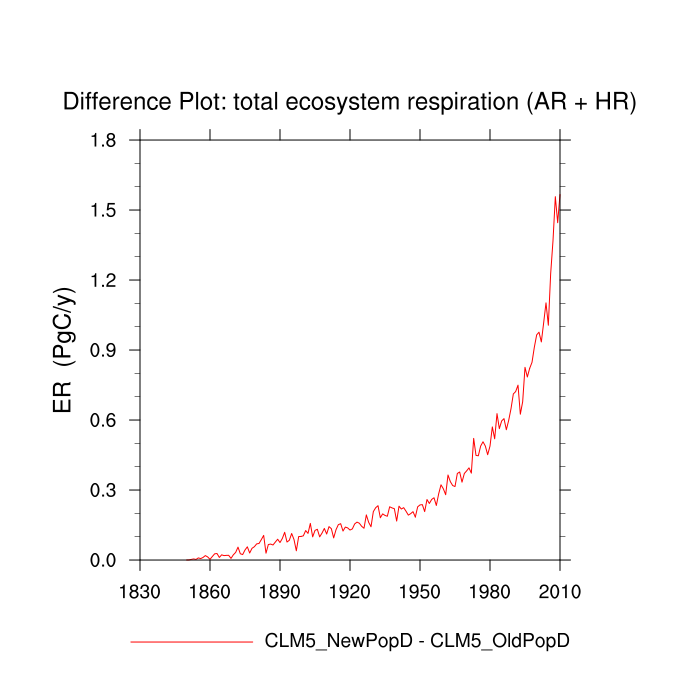
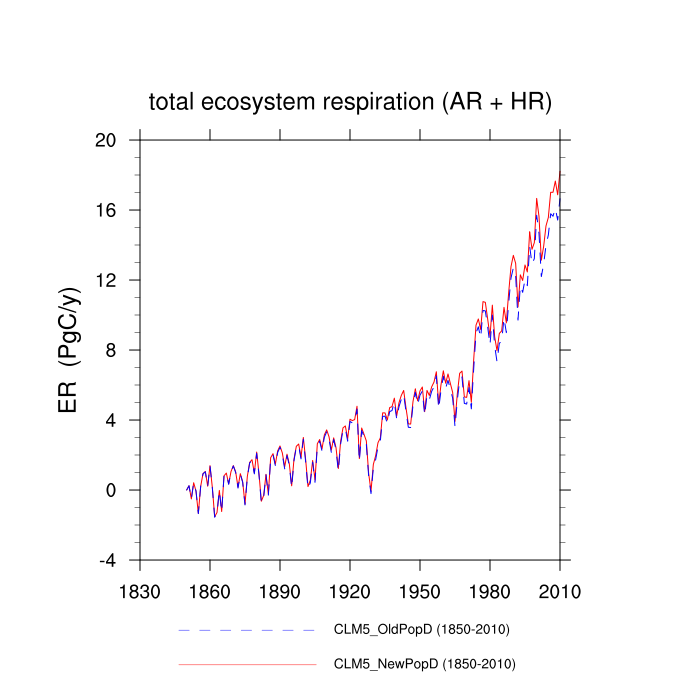
| total ecosystem respiration (AR + HR) (ER) | TrendPlot | DifferencePlot | AnomalyPlot | ||
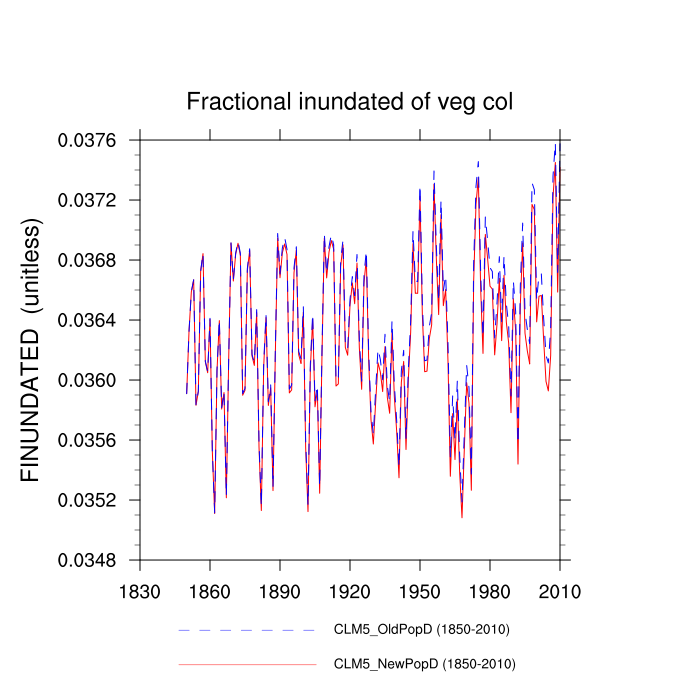
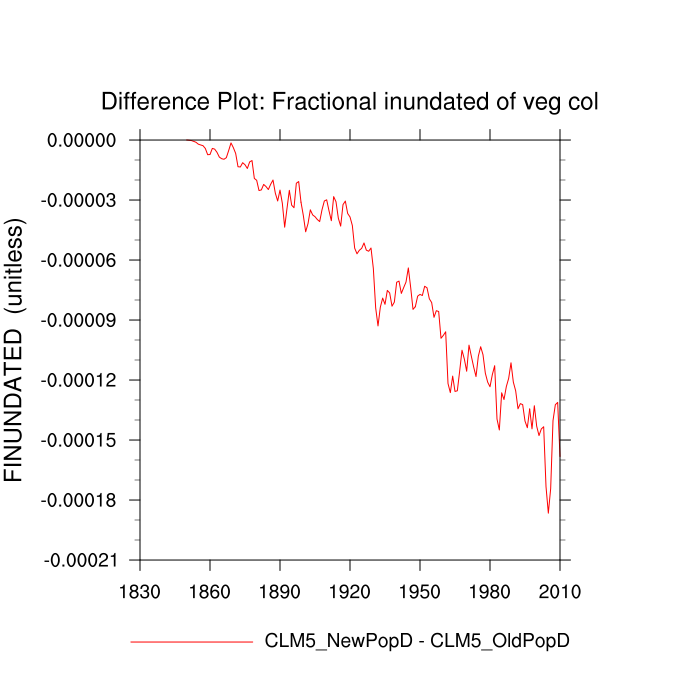
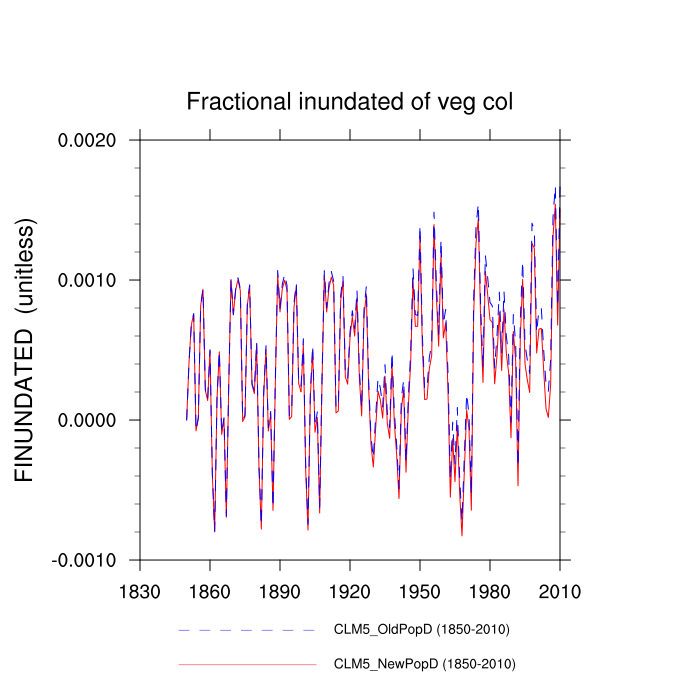
| Fractional inundated of veg col (FINUNDATED) | TrendPlot | DifferencePlot | AnomalyPlot | ||
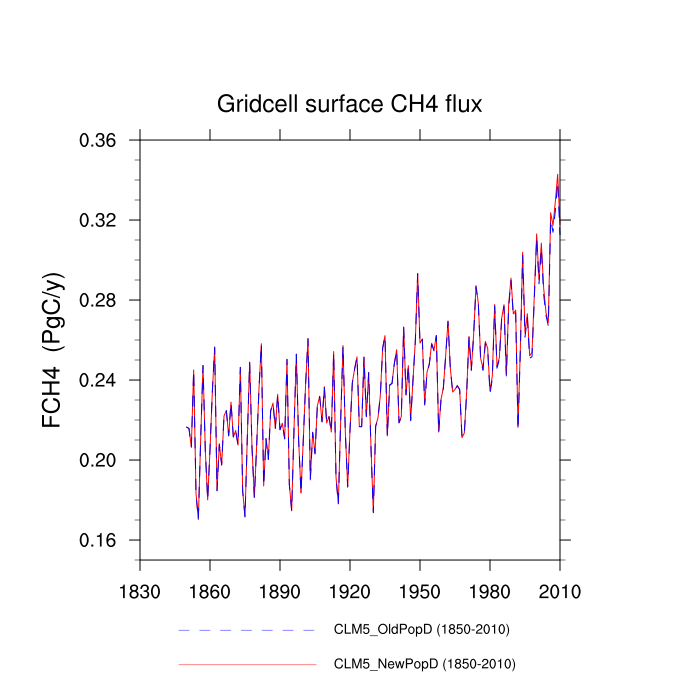
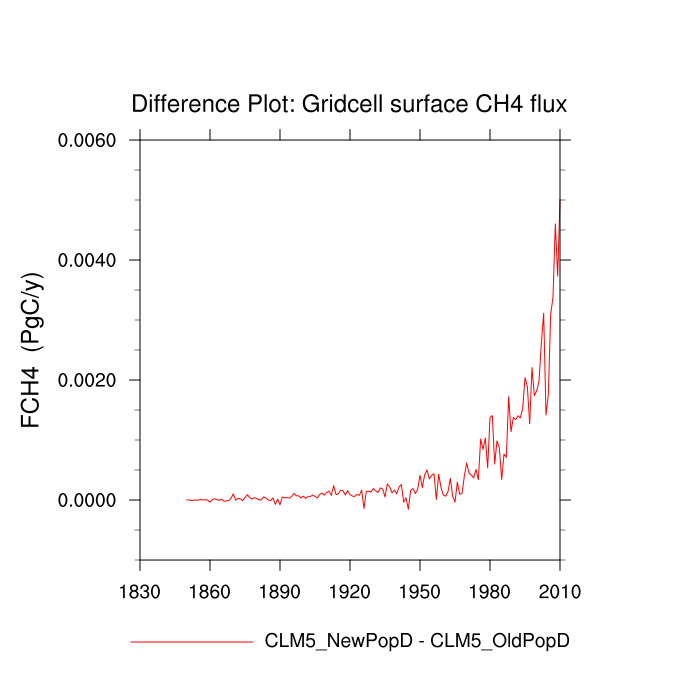
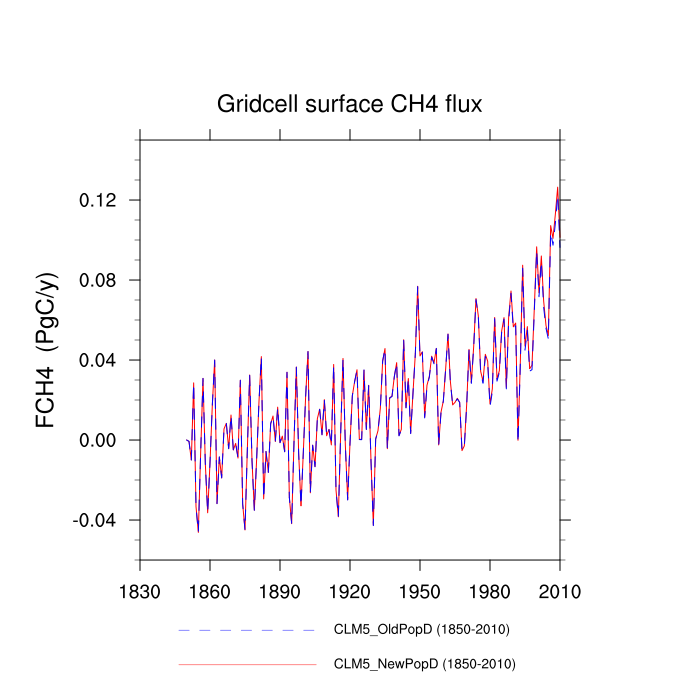
| Gridcell surface CH4 flux (FCH4) | TrendPlot | DifferencePlot | AnomalyPlot | ||
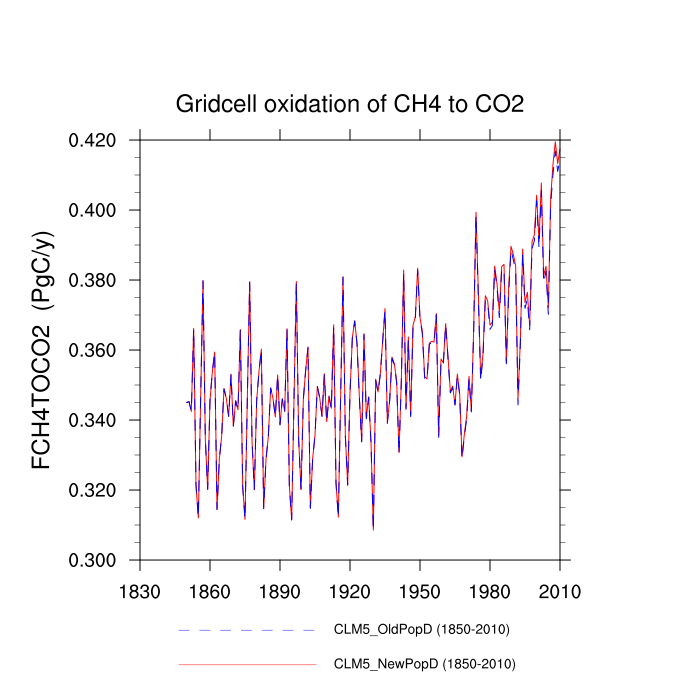
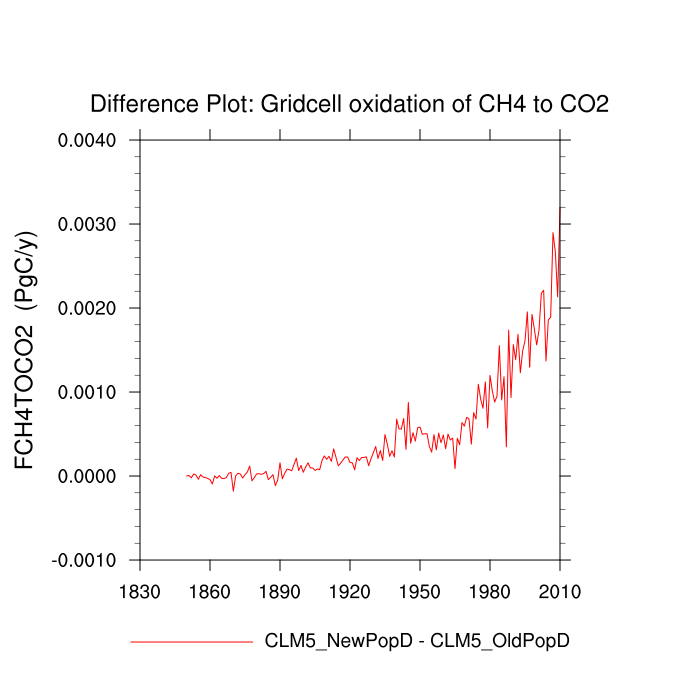
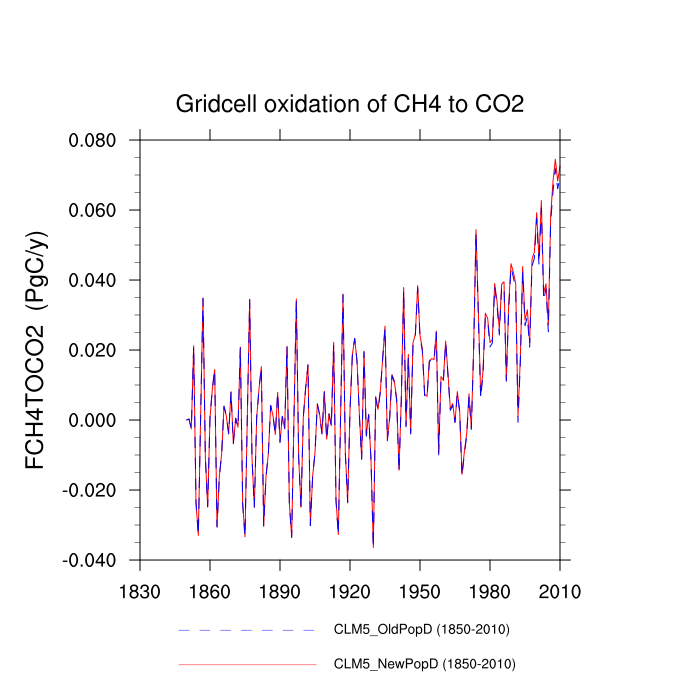
| Gridcell oxidation of CH4 to CO2 (FCH4TOCO2) | TrendPlot | DifferencePlot | AnomalyPlot | ||
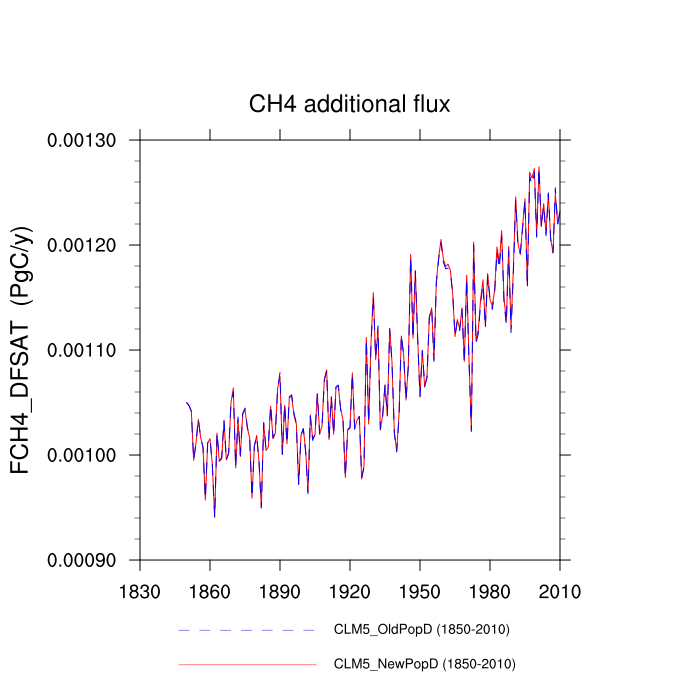
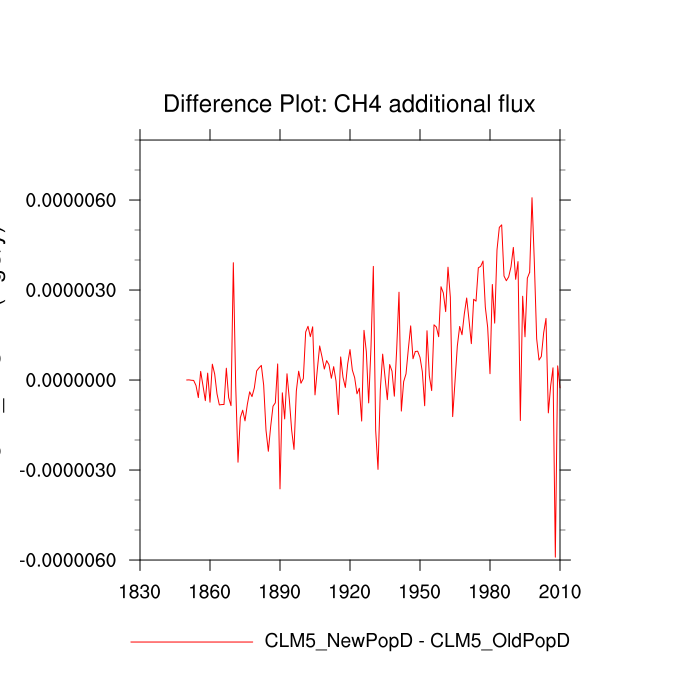
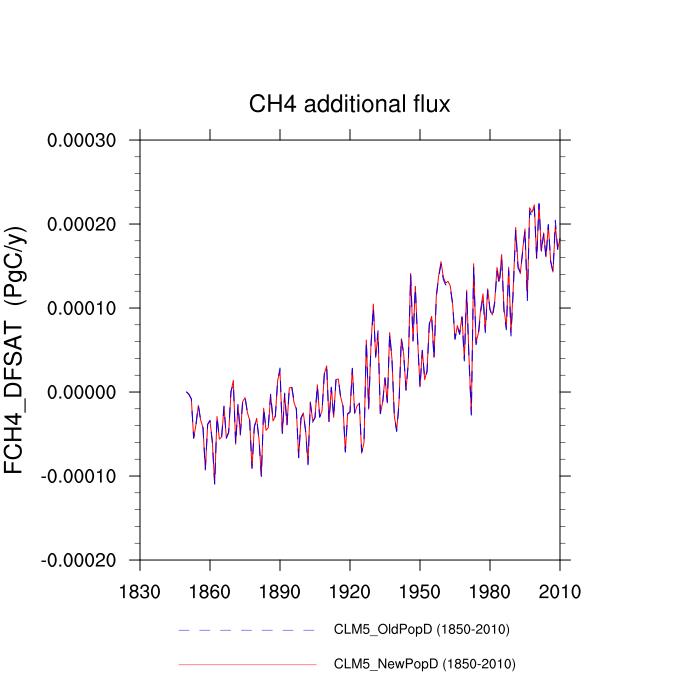
| CH4 additional flux (FCH4_DFSAT) | TrendPlot | DifferencePlot | AnomalyPlot | ||
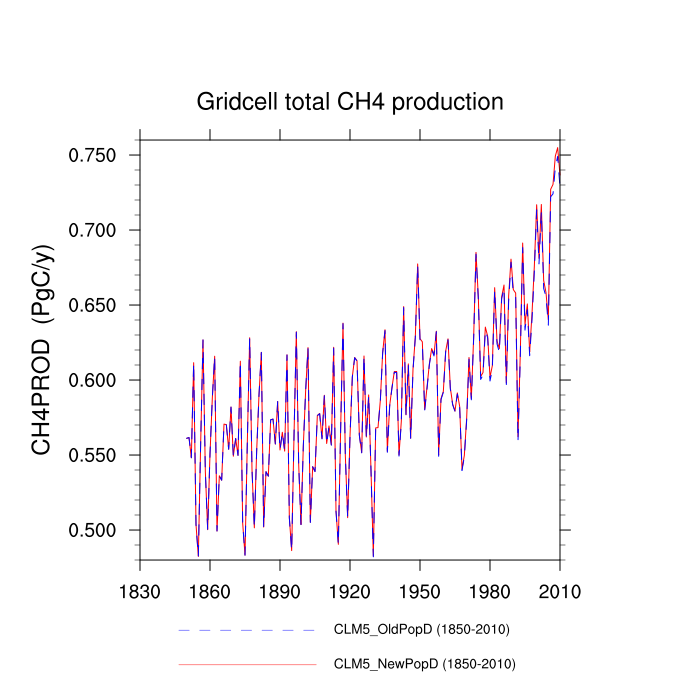
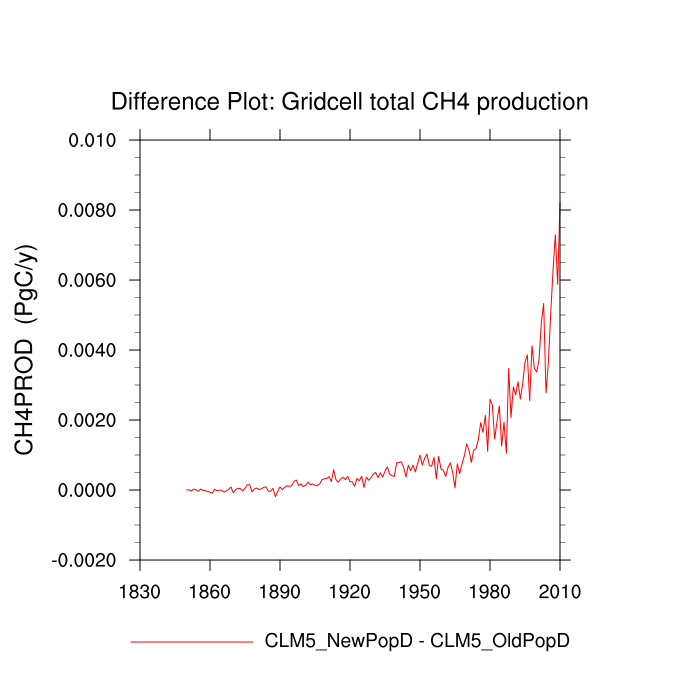
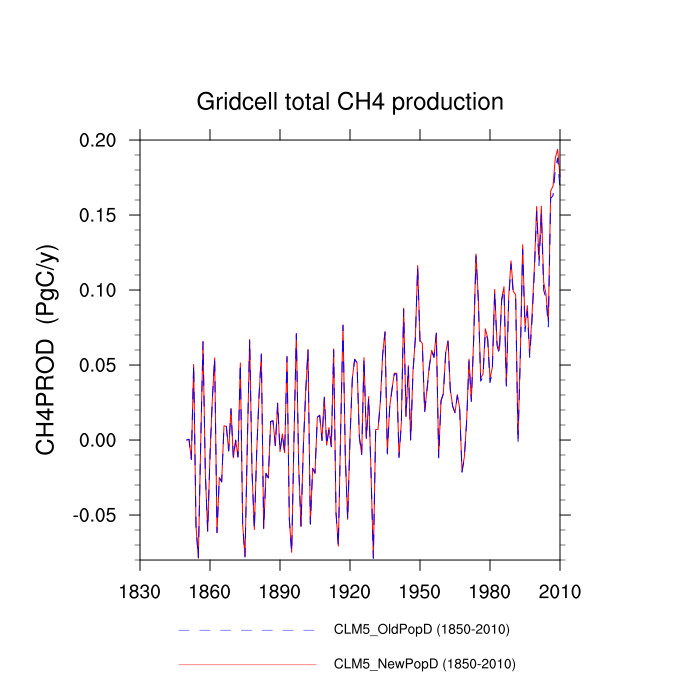
| Gridcell total CH4 production (CH4PROD) | TrendPlot | DifferencePlot | AnomalyPlot | ||
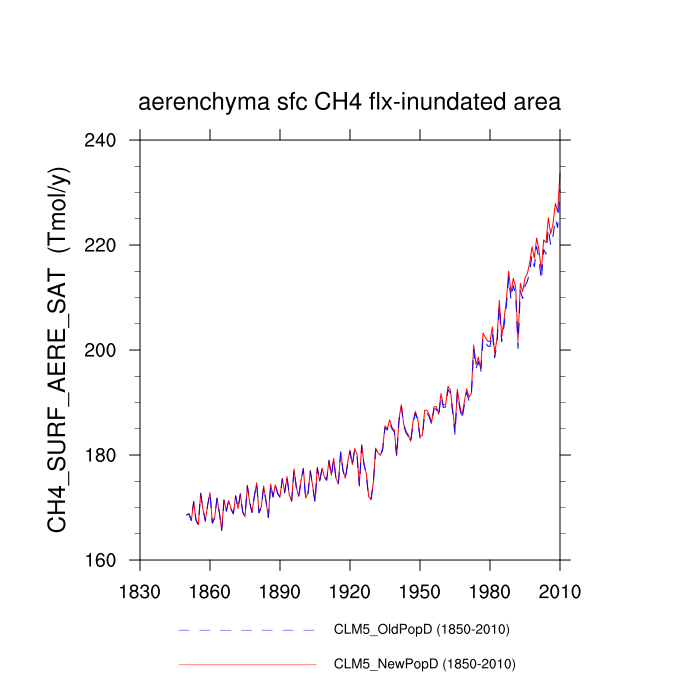
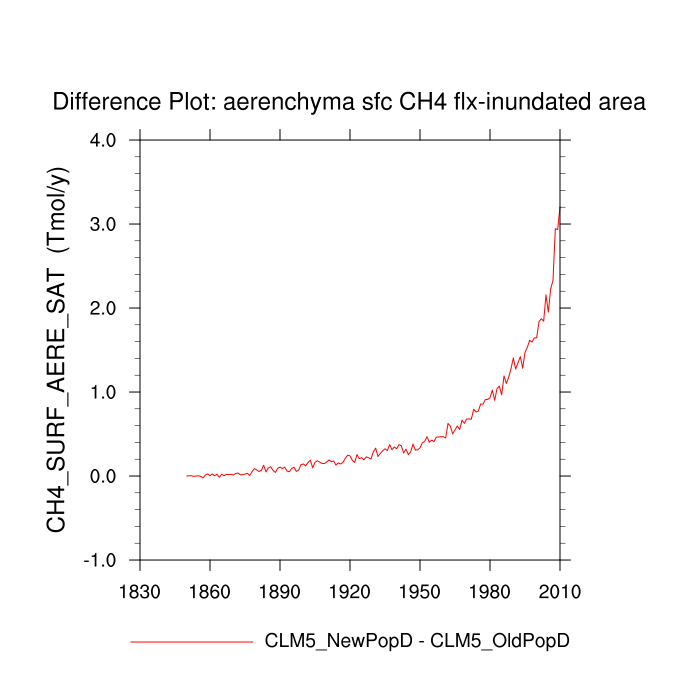
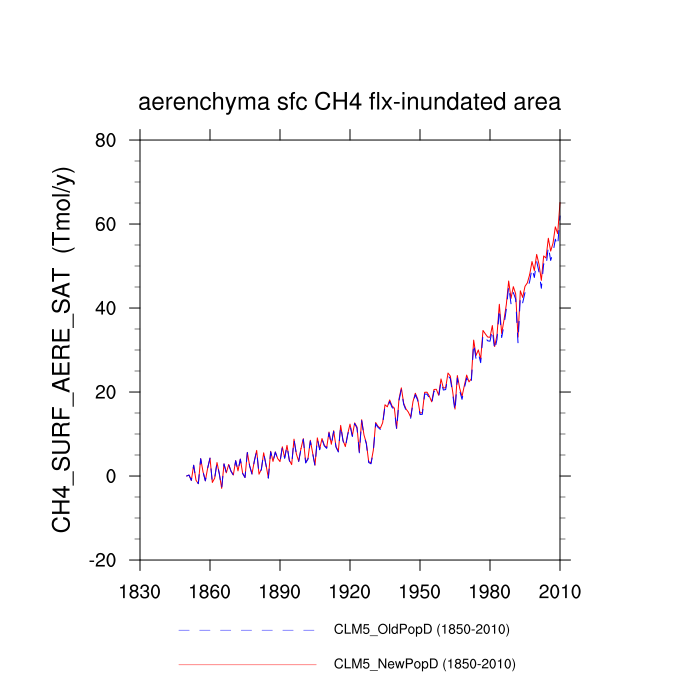
| aerenchyma sfc CH4 flx-inundated area (CH4_SURF_AERE_SAT) | TrendPlot | DifferencePlot | AnomalyPlot | ||
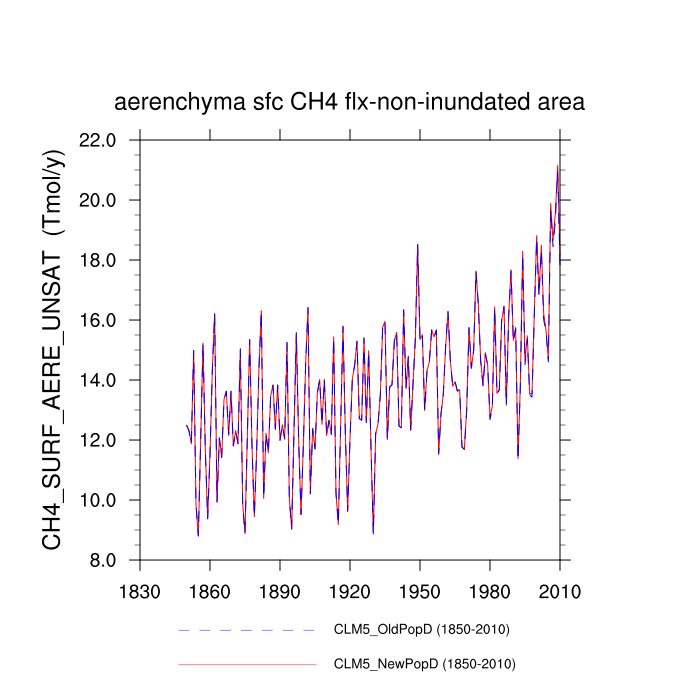
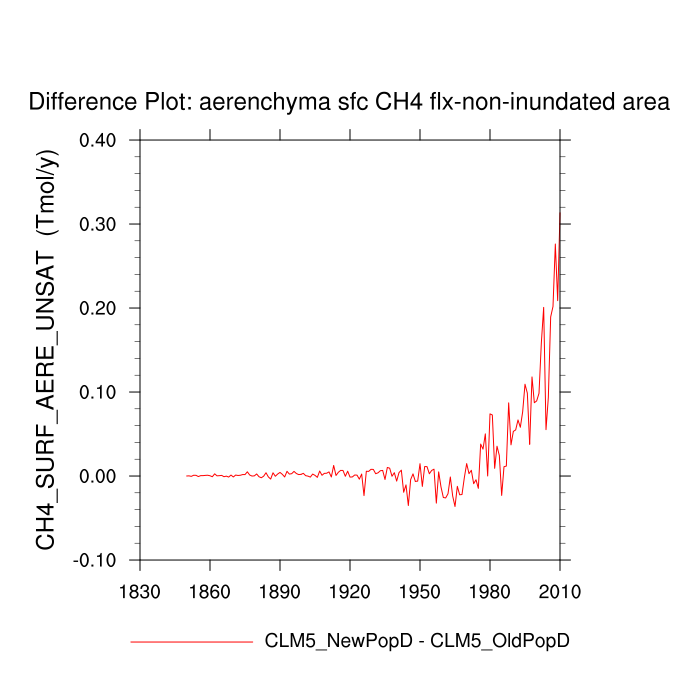
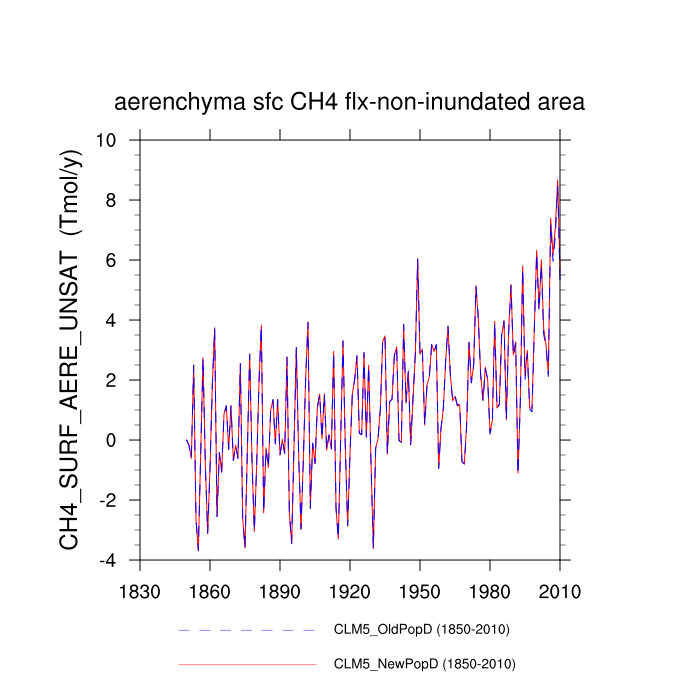
| aerenchyma sfc CH4 flx-non-inundated area (CH4_SURF_AERE_UNSAT) | TrendPlot | DifferencePlot | AnomalyPlot | ||
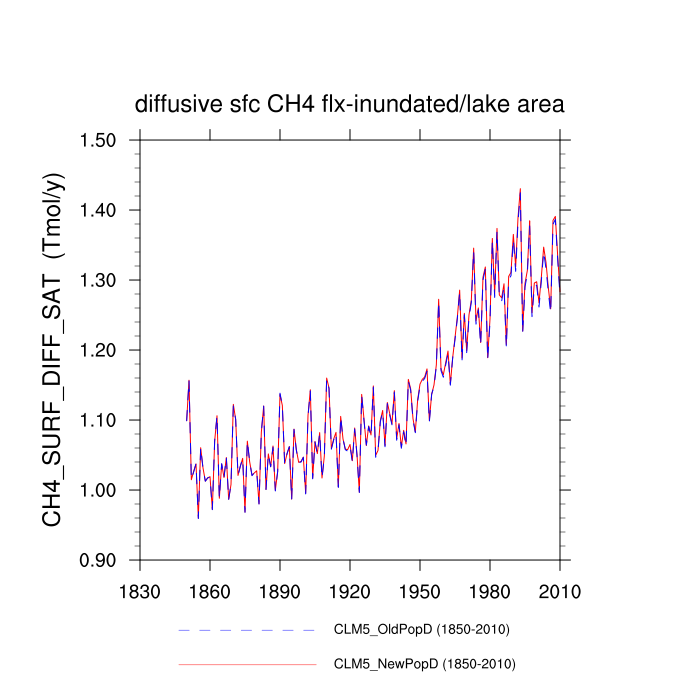
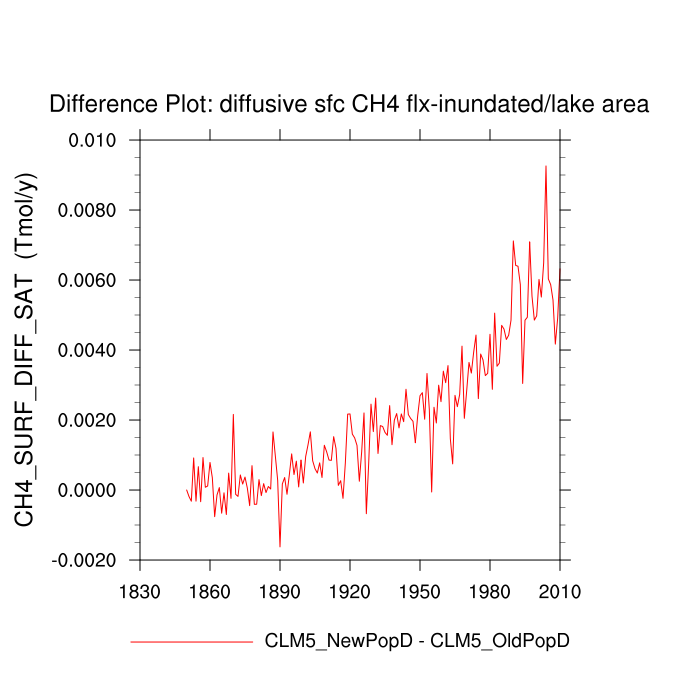
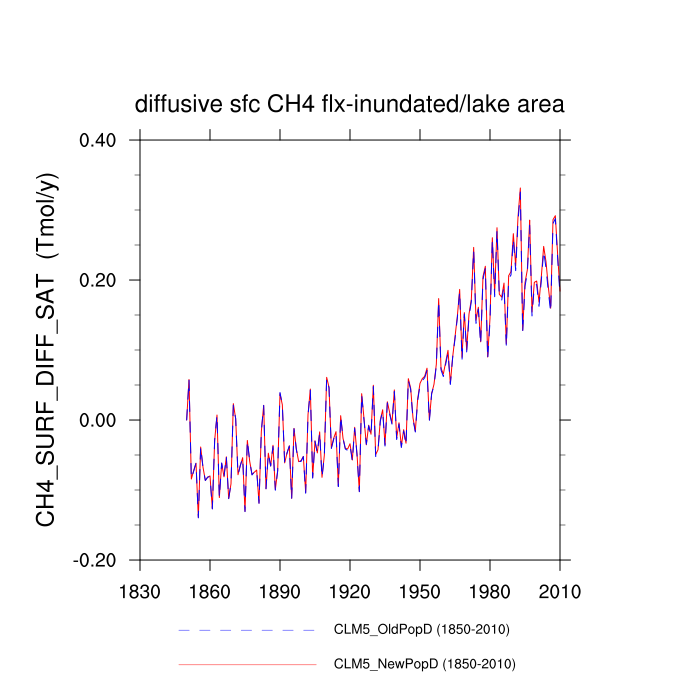
| diffusive sfc CH4 flx-inundated/lake area (CH4_SURF_DIFF_SAT) | TrendPlot | DifferencePlot | AnomalyPlot | ||
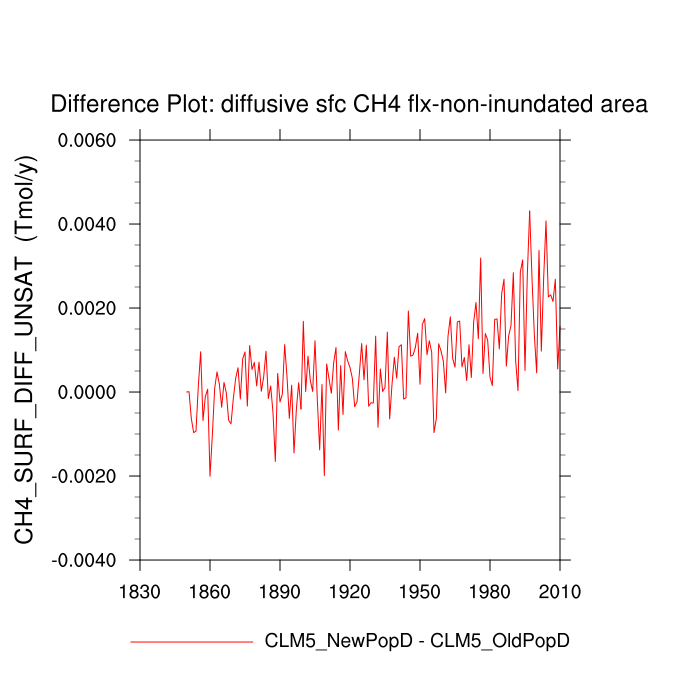
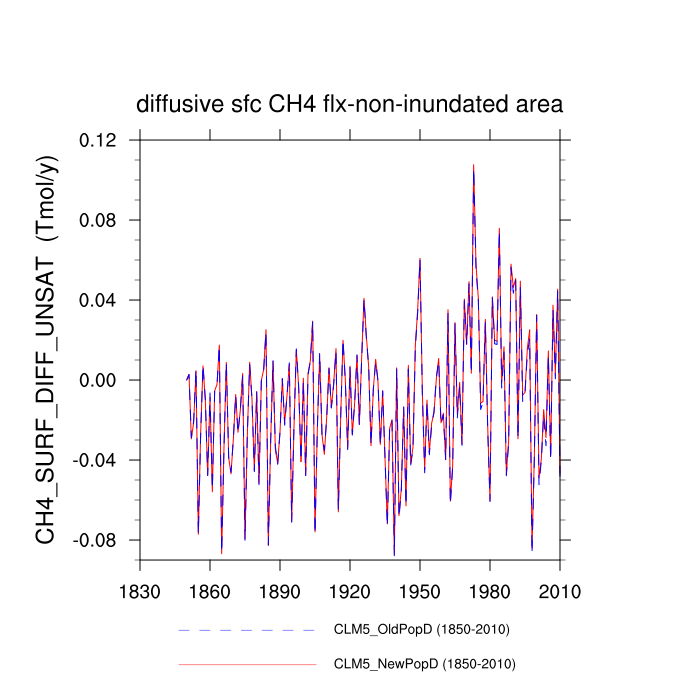
| diffusive sfc CH4 flx-non-inundated area (CH4_SURF_DIFF_UNSAT) | TrendPlot | DifferencePlot | AnomalyPlot | ||
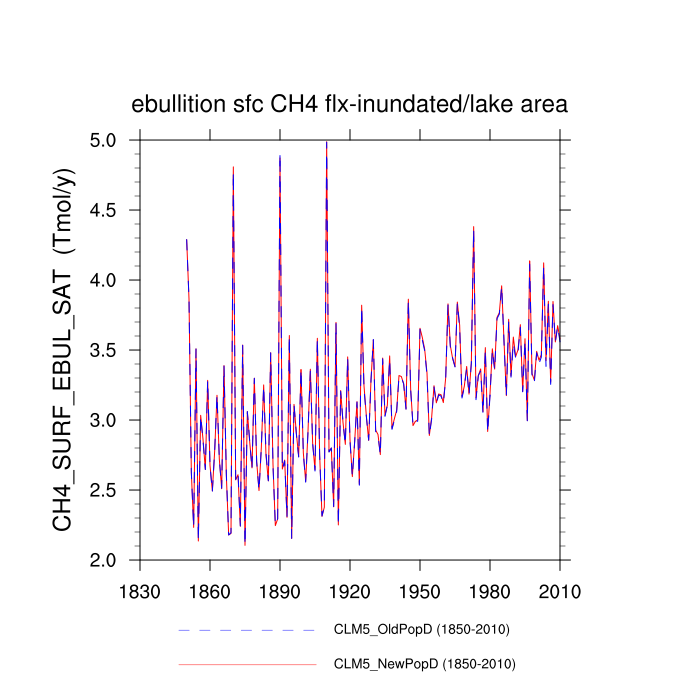
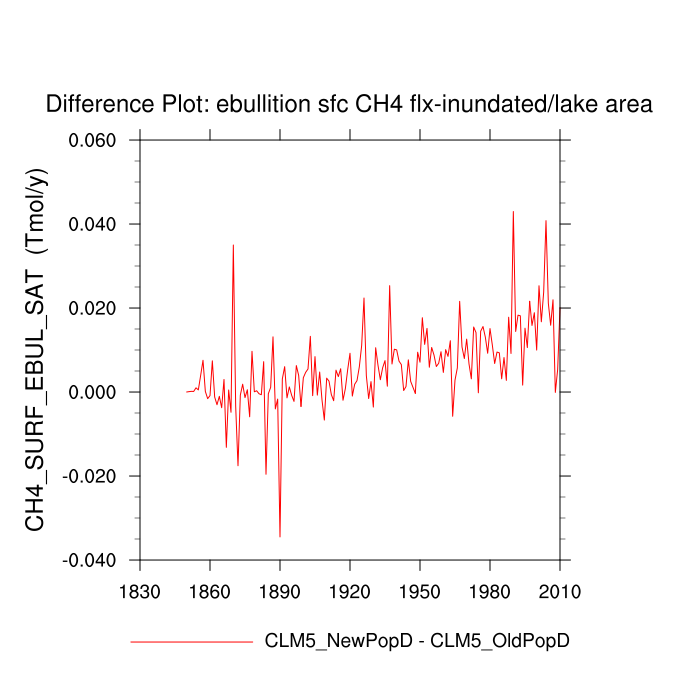
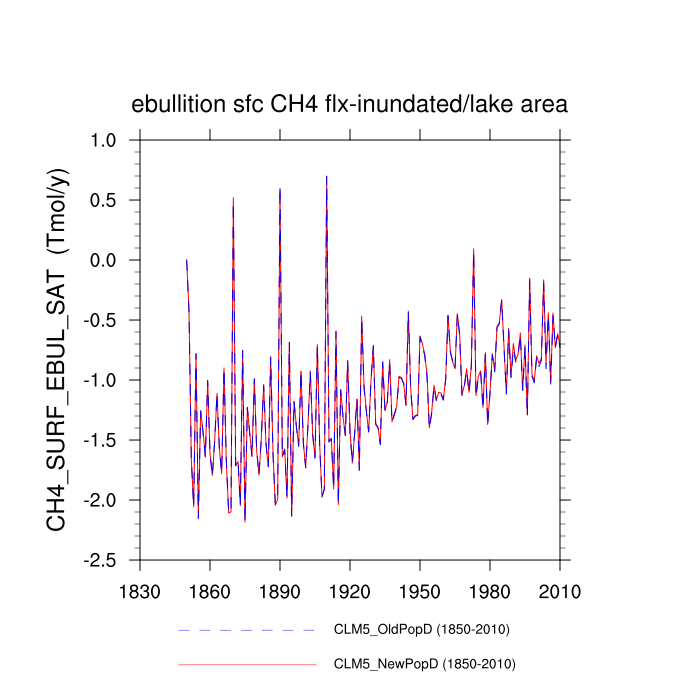
| ebullition sfc CH4 flx-inundated/lake area (CH4_SURF_EBUL_SAT) | TrendPlot | DifferencePlot | AnomalyPlot | ||
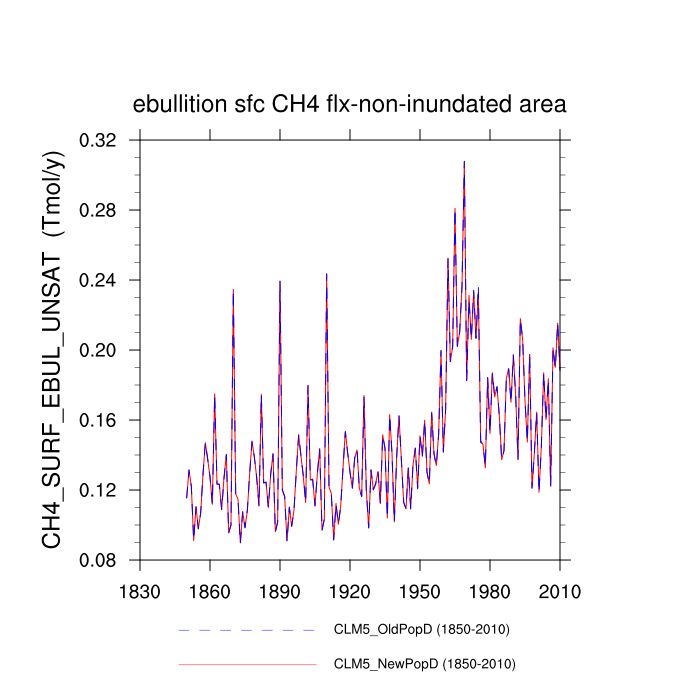
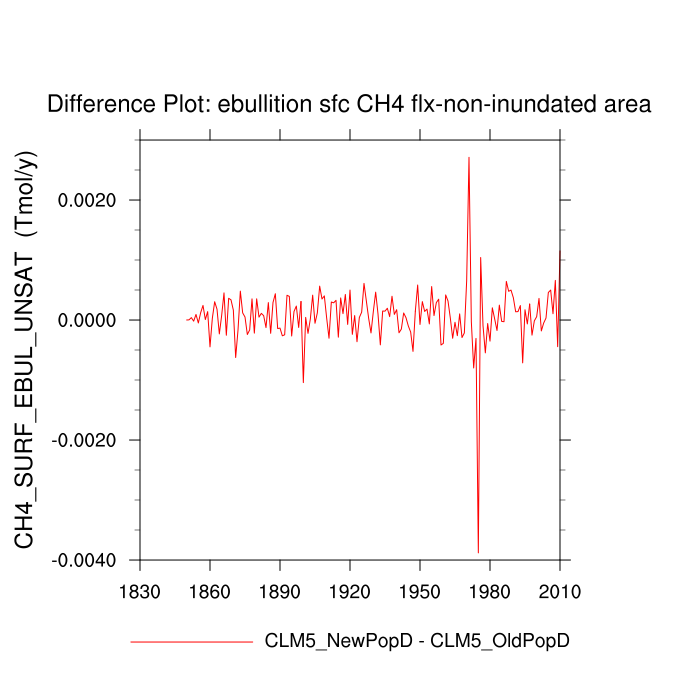
| ebullition sfc CH4 flx-non-inundated area (CH4_SURF_EBUL_UNSAT) | TrendPlot | DifferencePlot | AnomalyPlot | ||
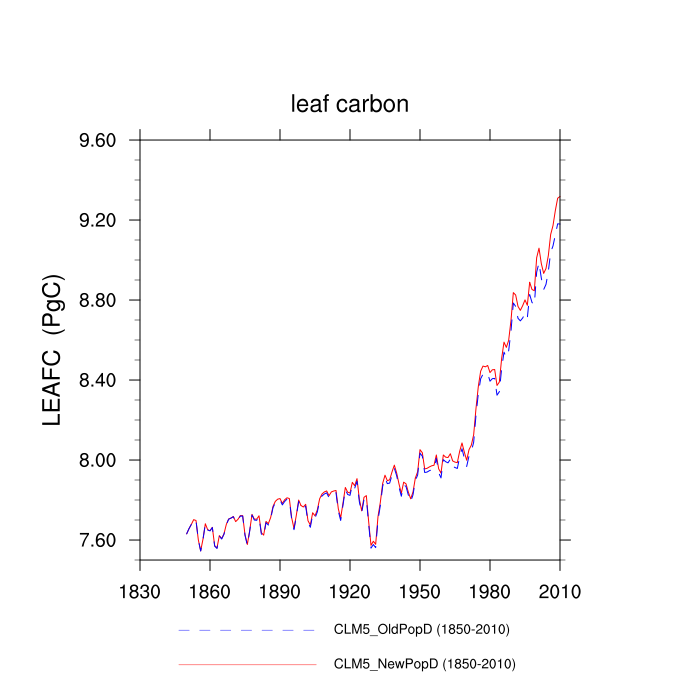
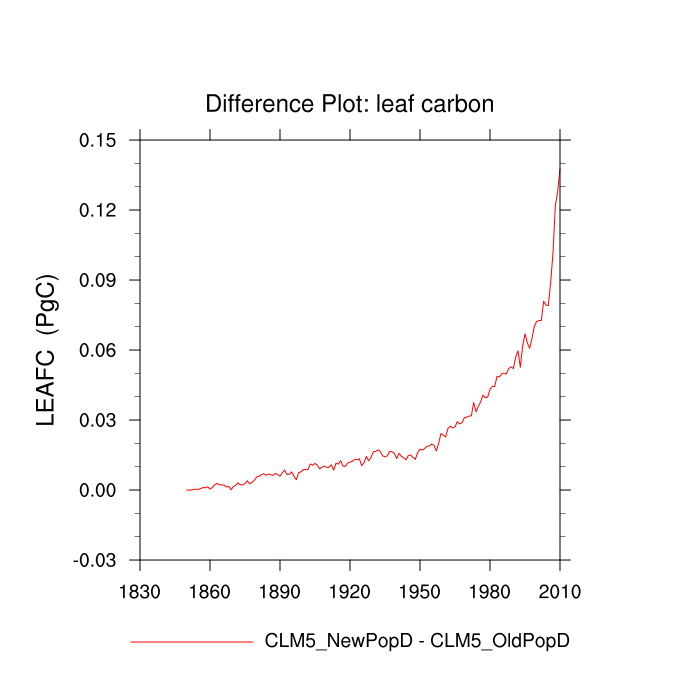
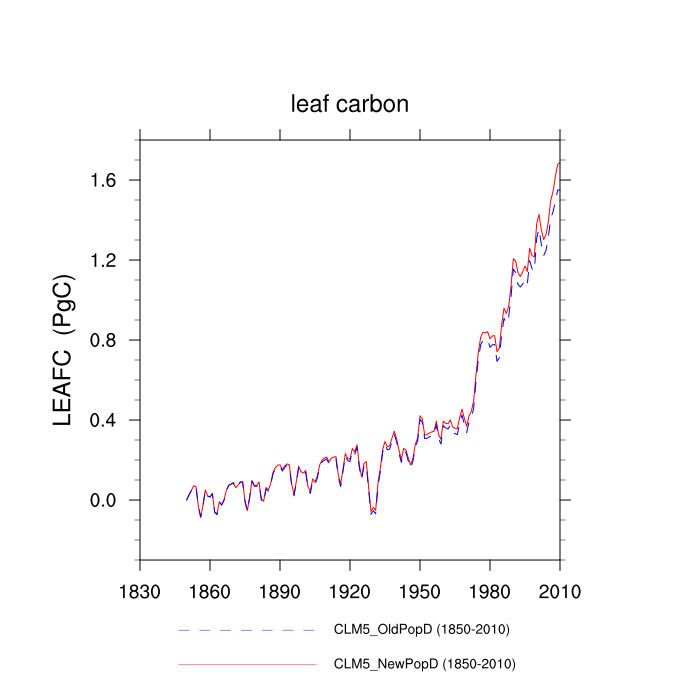
| leaf carbon (LEAFC) | TrendPlot | DifferencePlot | AnomalyPlot | ||
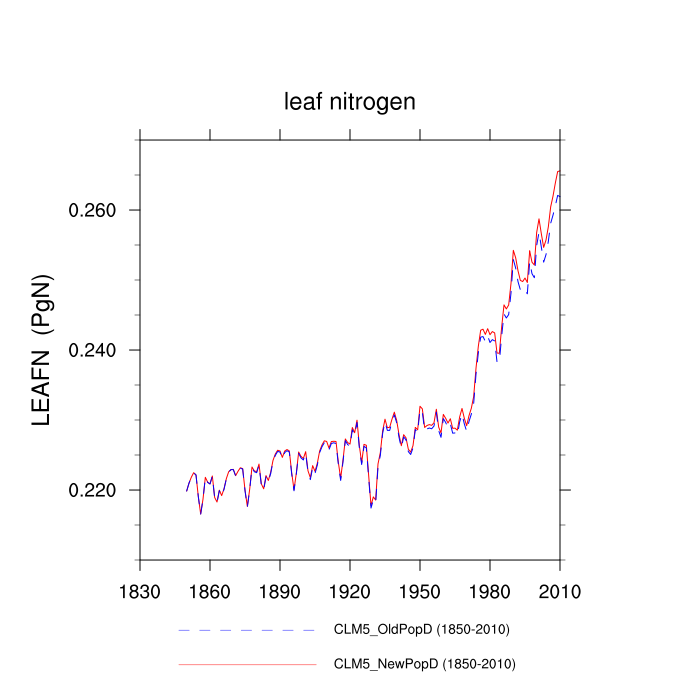
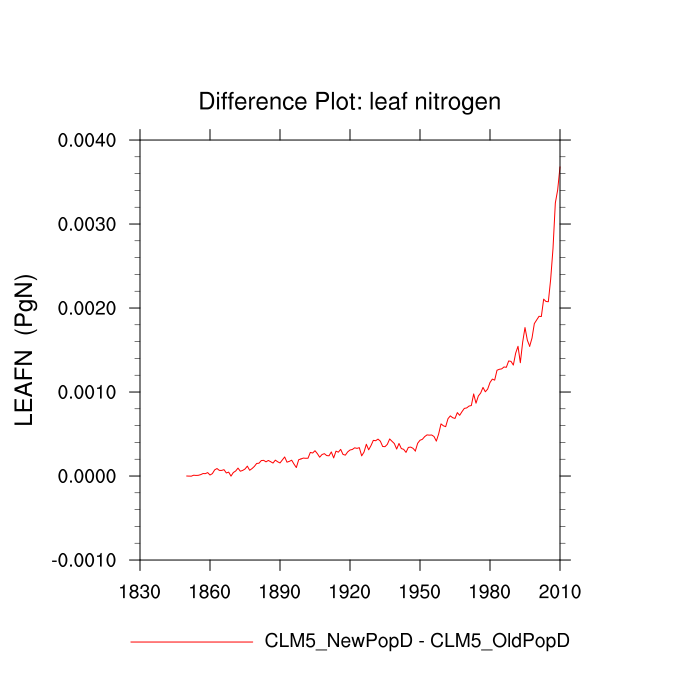
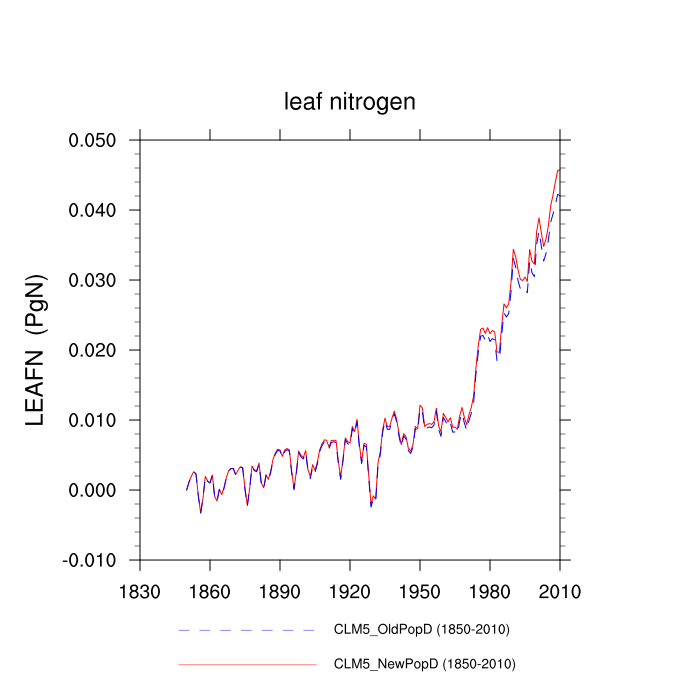
| leaf nitrogen (LEAFN) | TrendPlot | DifferencePlot | AnomalyPlot | ||
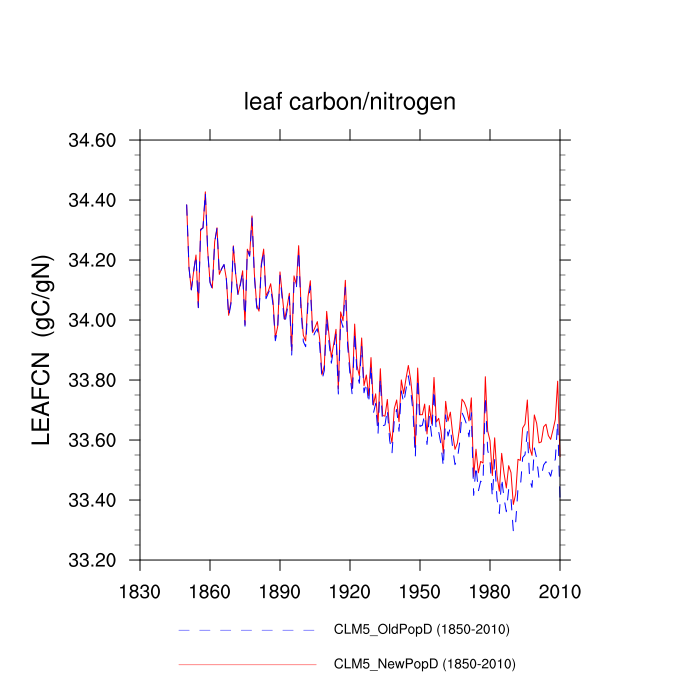
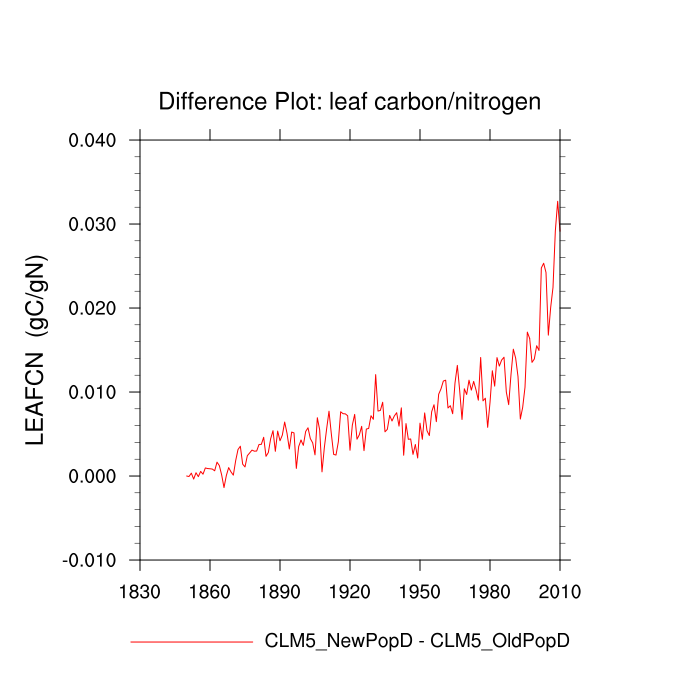
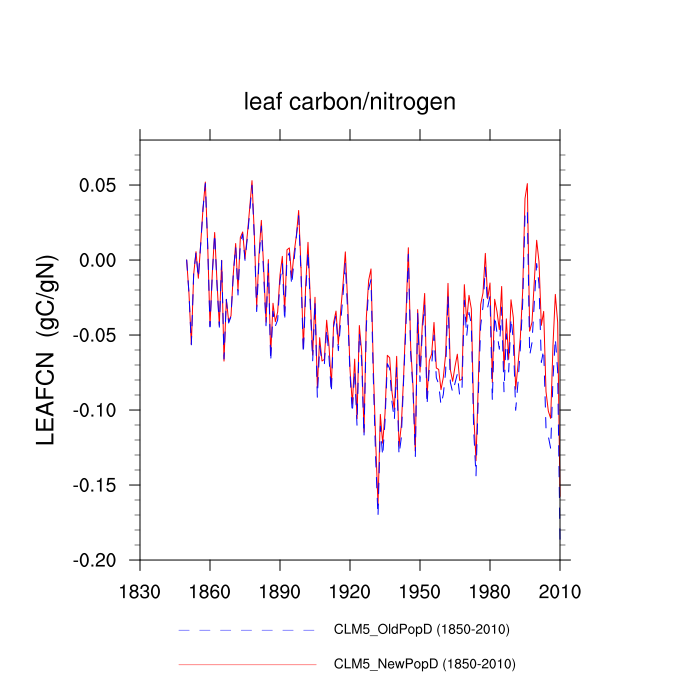
| leaf carbon/nitrogen (LEAFCN) | TrendPlot | DifferencePlot | AnomalyPlot | ||
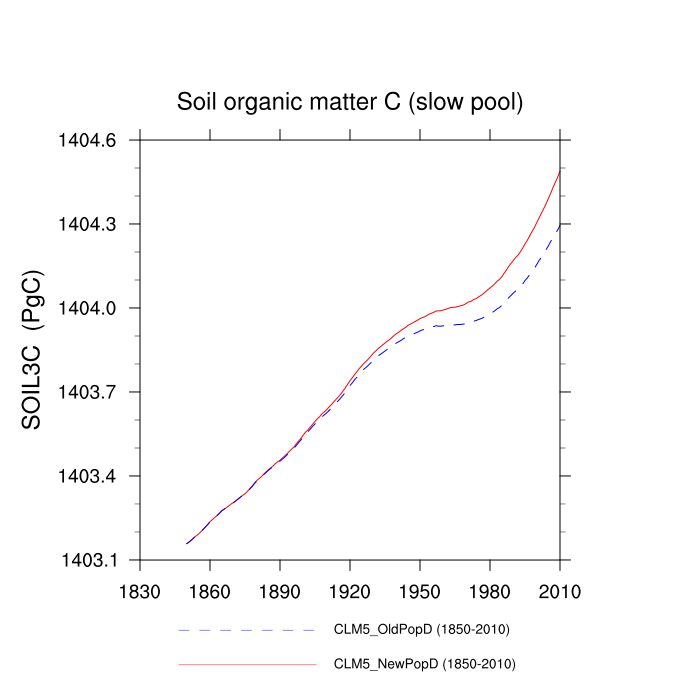
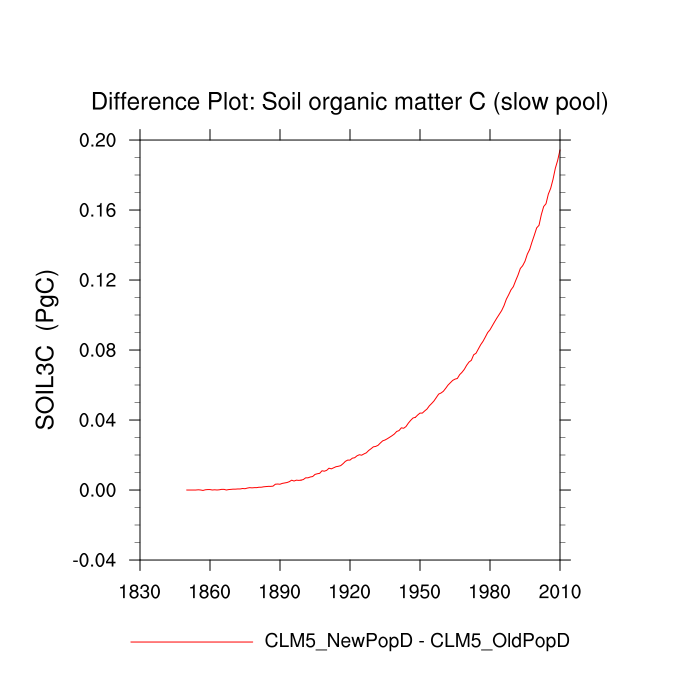
| Soil organic matter C (slow pool) (SOIL3C) | TrendPlot | DifferencePlot | AnomalyPlot | ||
| Soil organic matter C (slowest pool) (SOIL4C) | --- | --- | --- | ||
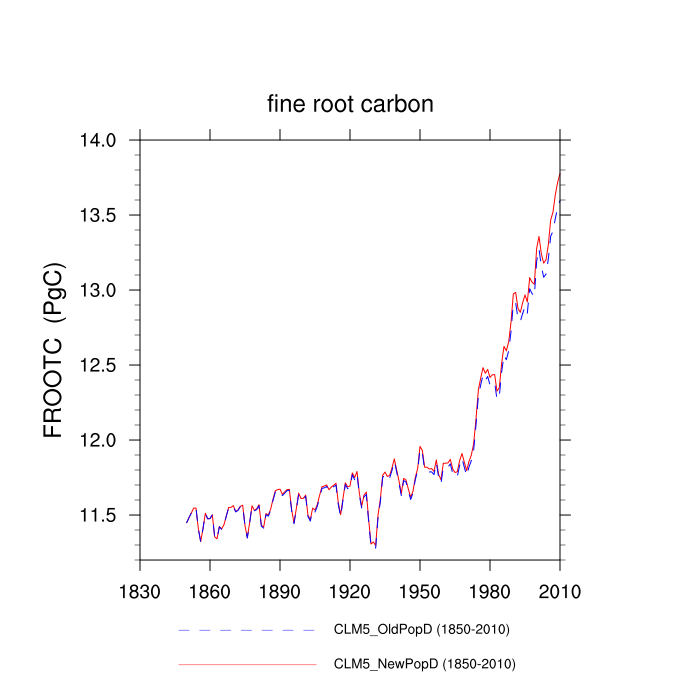
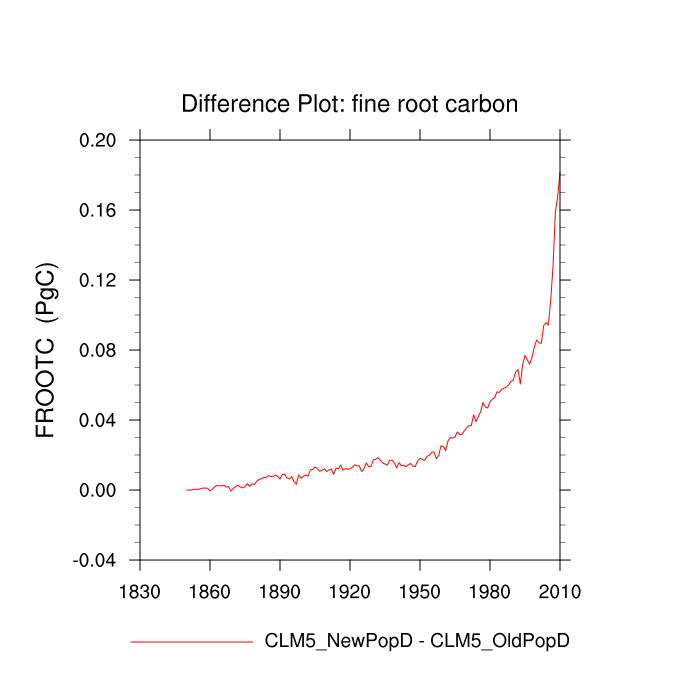
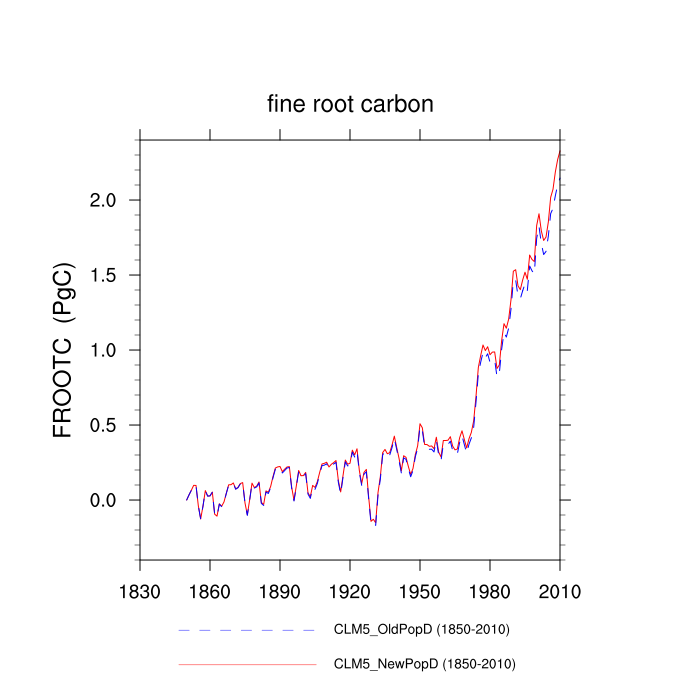
| fine root carbon (FROOTC) | TrendPlot | DifferencePlot | AnomalyPlot | ||
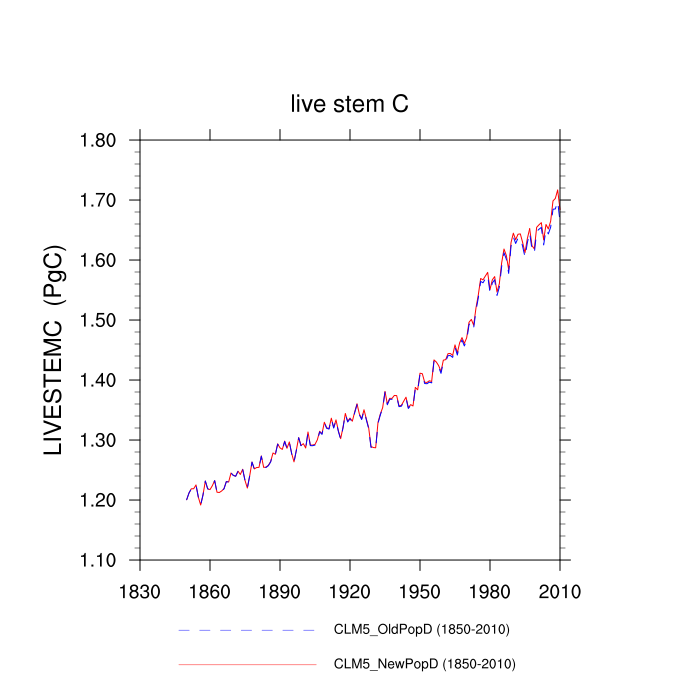
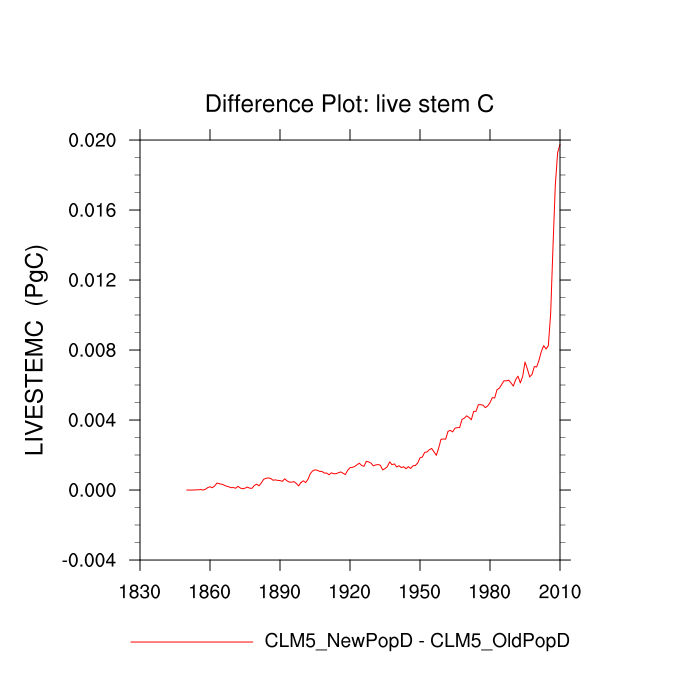
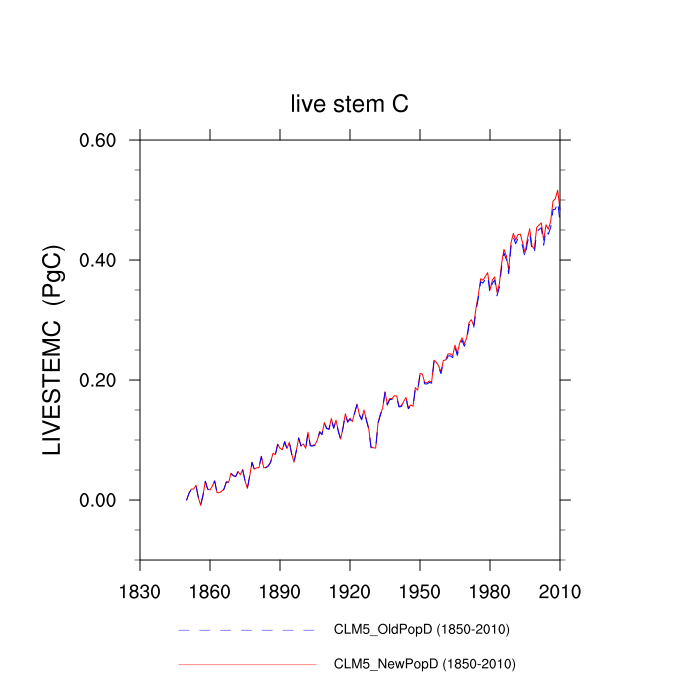
| live stem C (LIVESTEMC) | TrendPlot | DifferencePlot | AnomalyPlot | ||
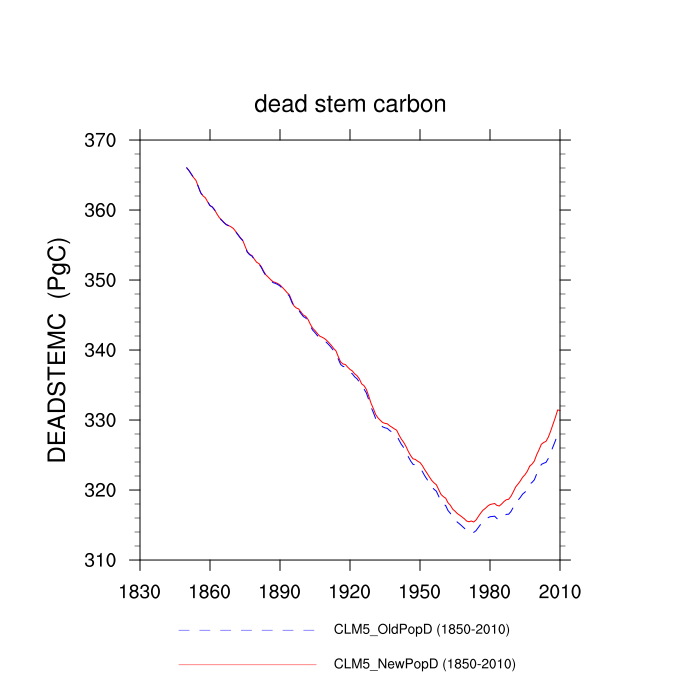
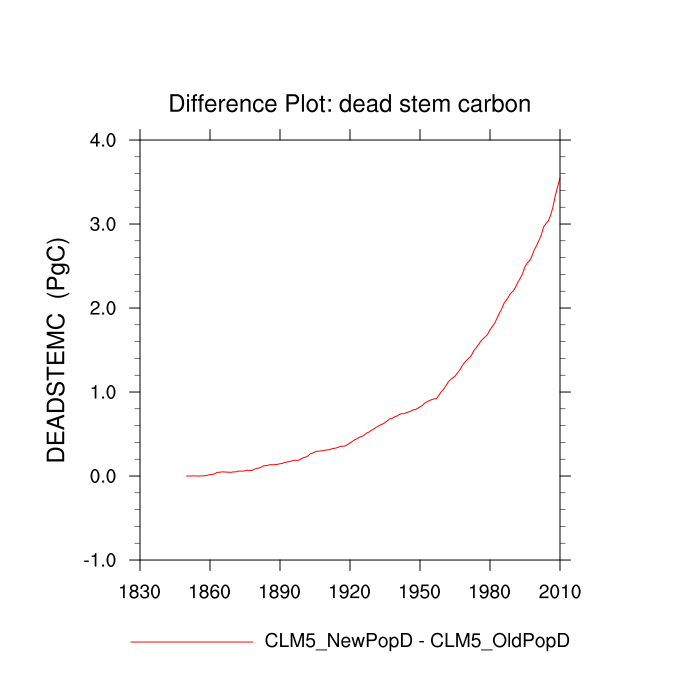
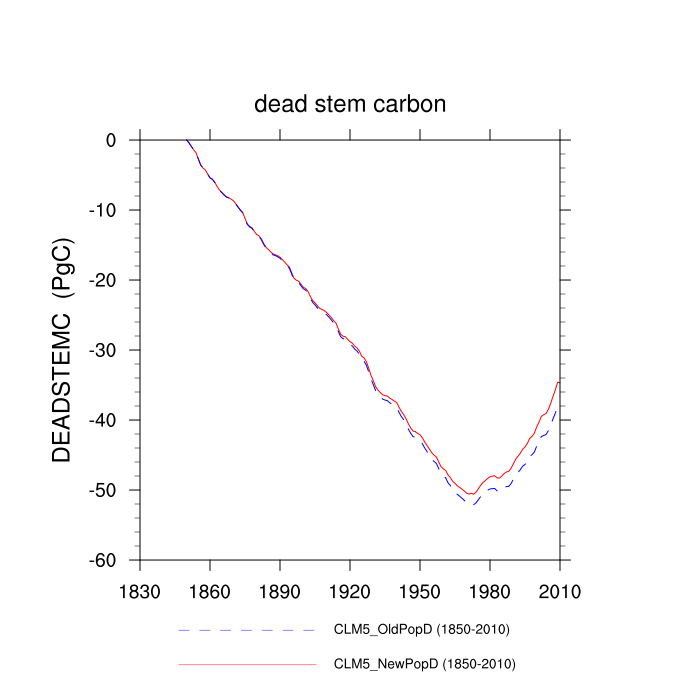
| dead stem carbon (DEADSTEMC) | TrendPlot | DifferencePlot | AnomalyPlot | ||
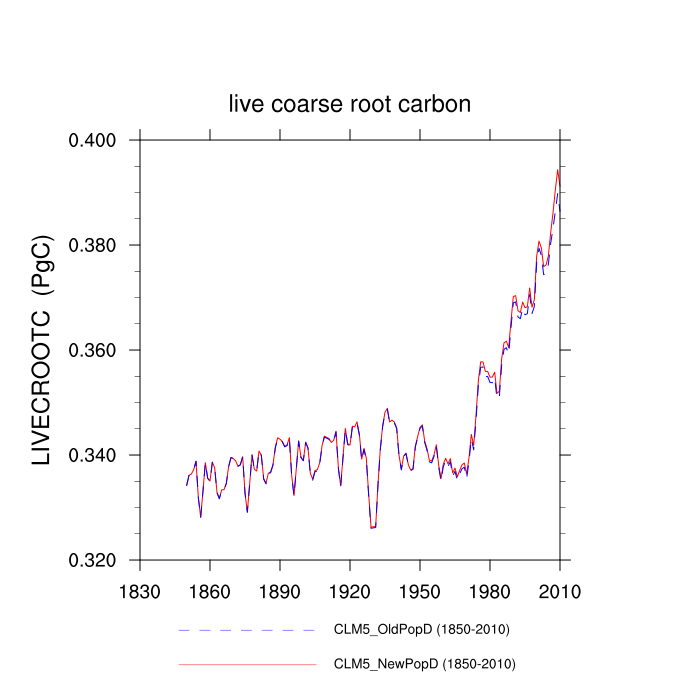
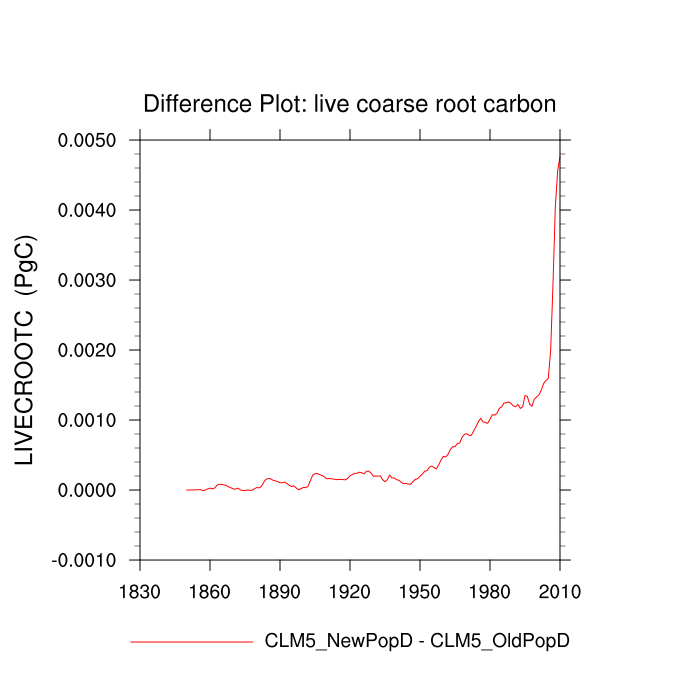
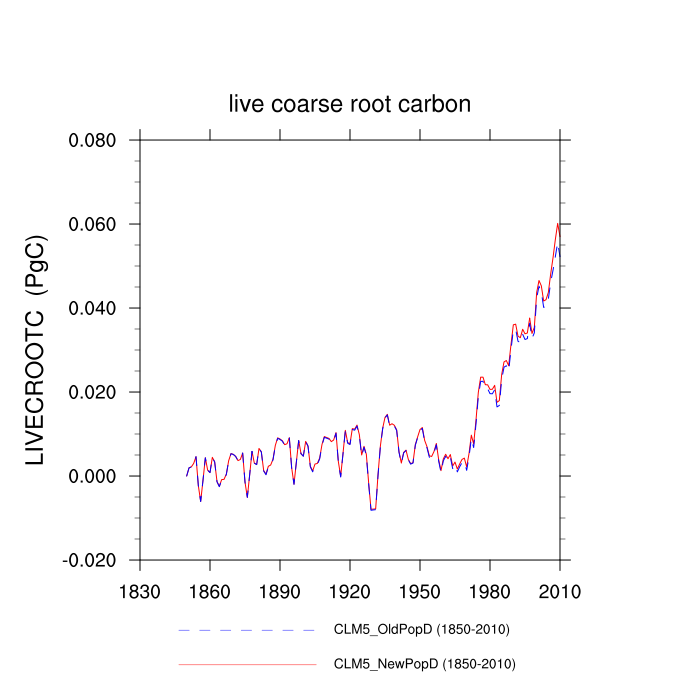
| live coarse root carbon (LIVECROOTC) | TrendPlot | DifferencePlot | AnomalyPlot | ||
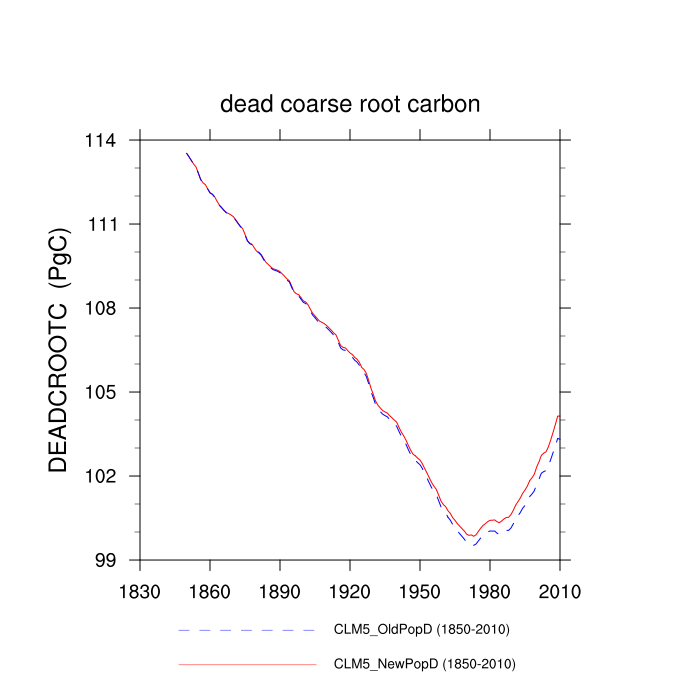
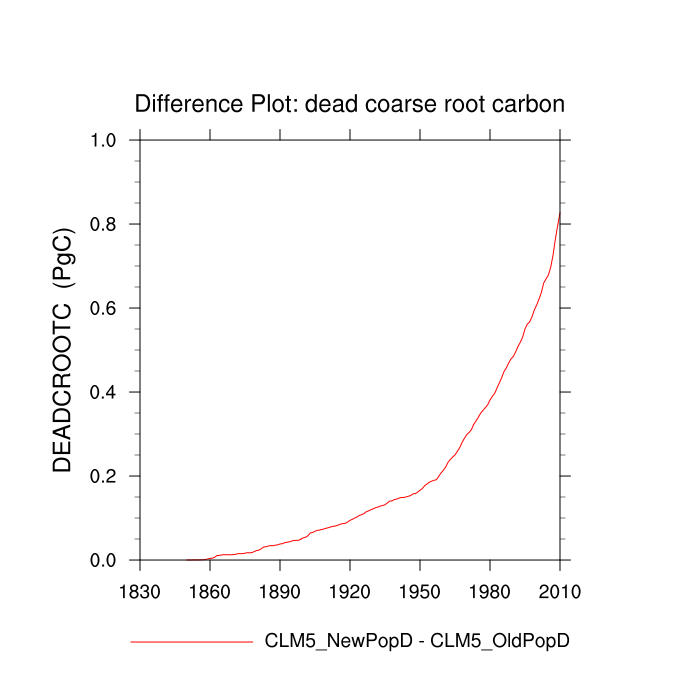
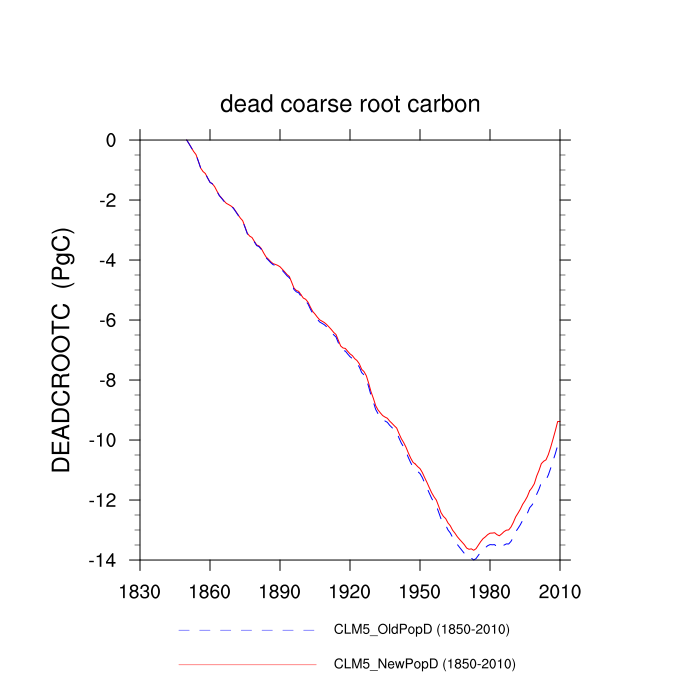
| dead coarse root carbon (DEADCROOTC) | TrendPlot | DifferencePlot | AnomalyPlot | ||
| temporary photosynthate C pool (CPOOL) | TrendPlot | DifferencePlot | AnomalyPlot | ||
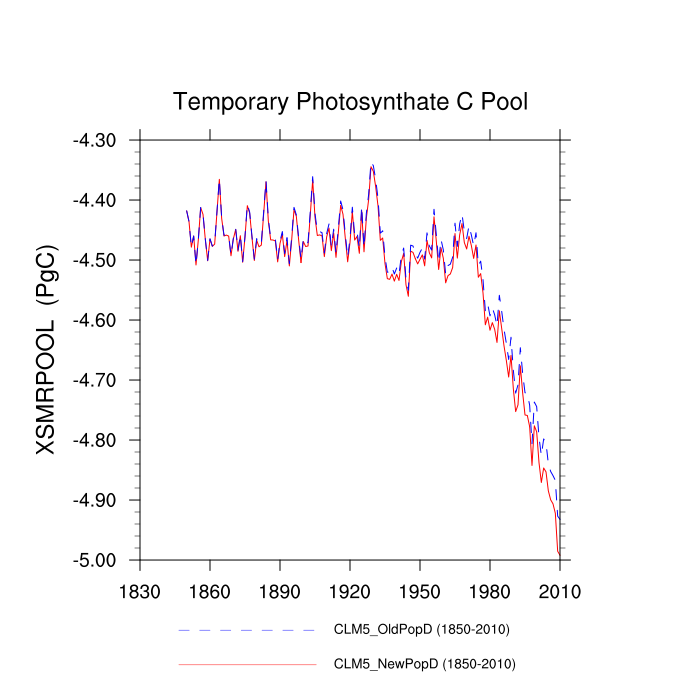
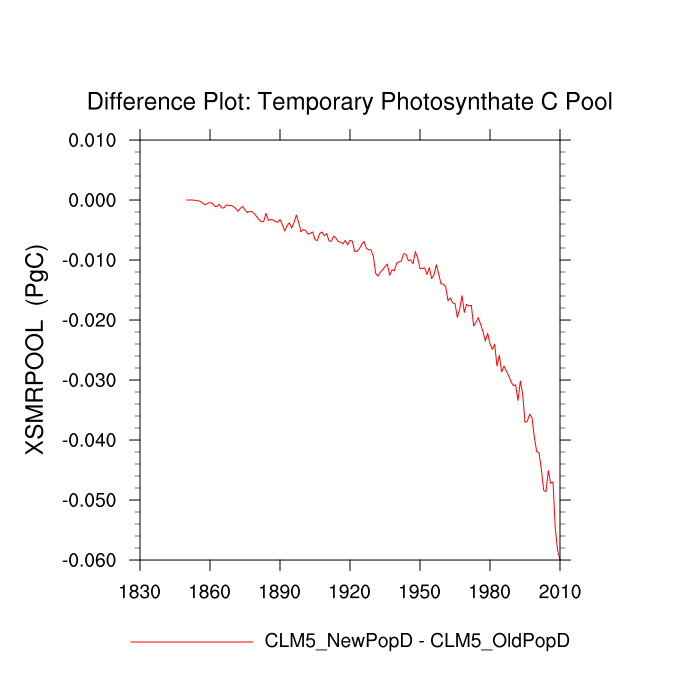
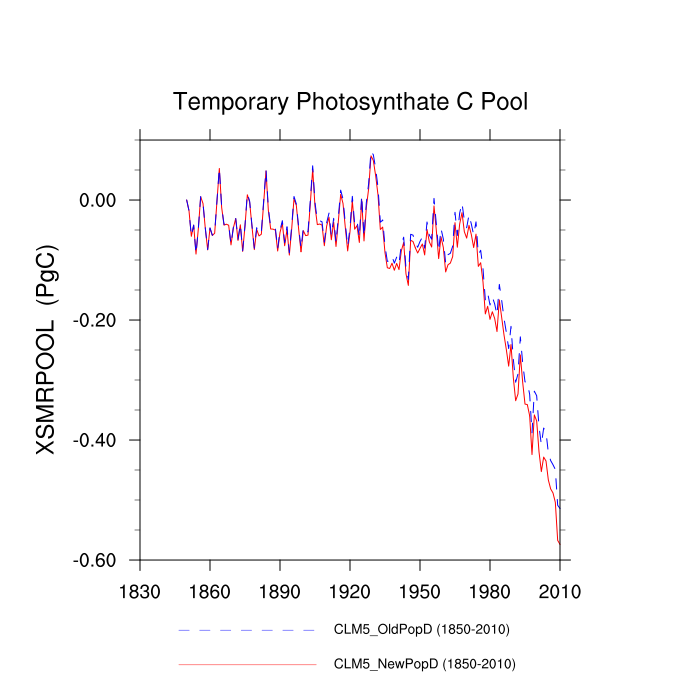
| Temporary Photosynthate C Pool (XSMRPOOL) | TrendPlot | DifferencePlot | AnomalyPlot | ||
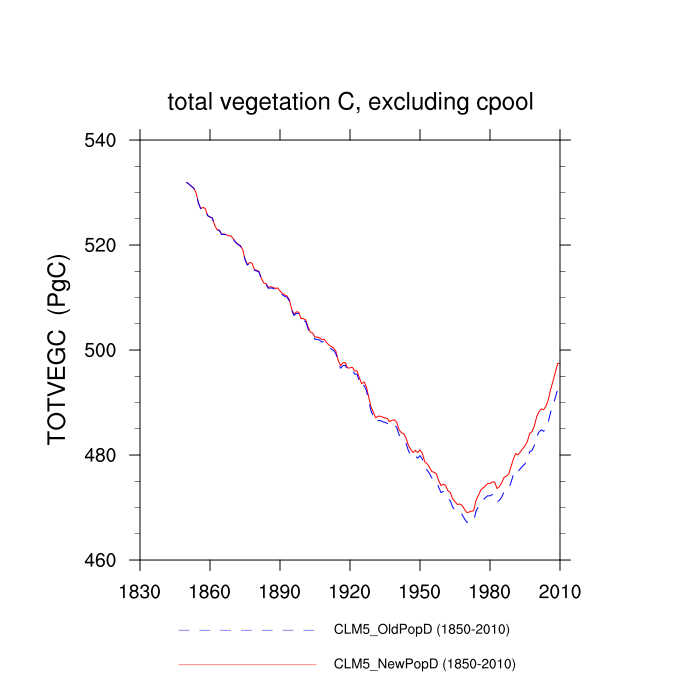
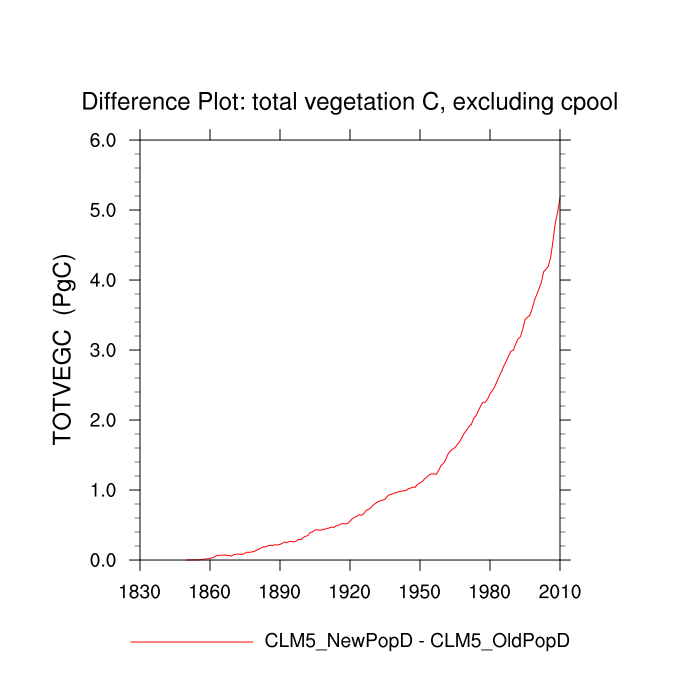
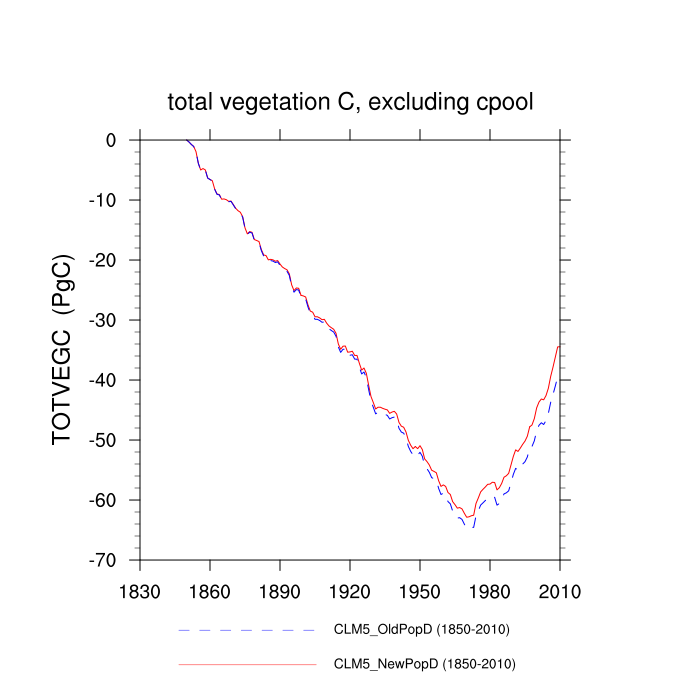
| total vegetation C, excluding cpool (TOTVEGC) | TrendPlot | DifferencePlot | AnomalyPlot | ||
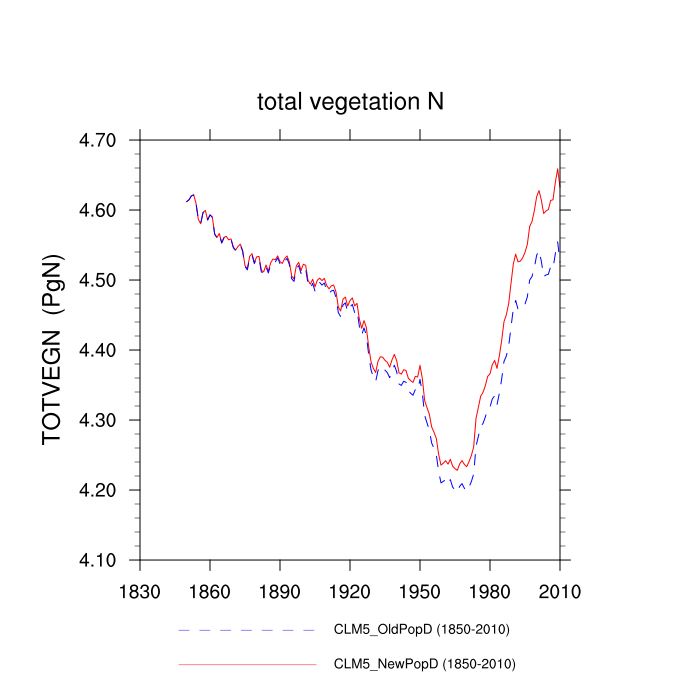
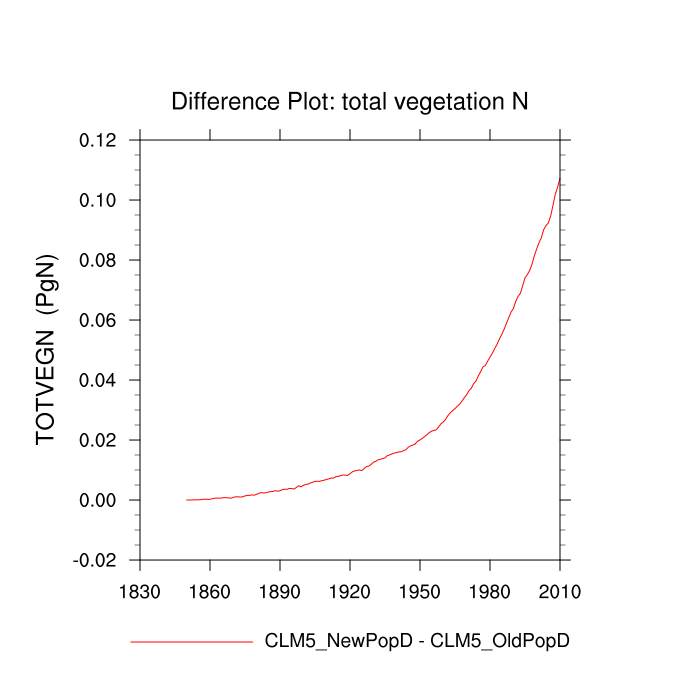
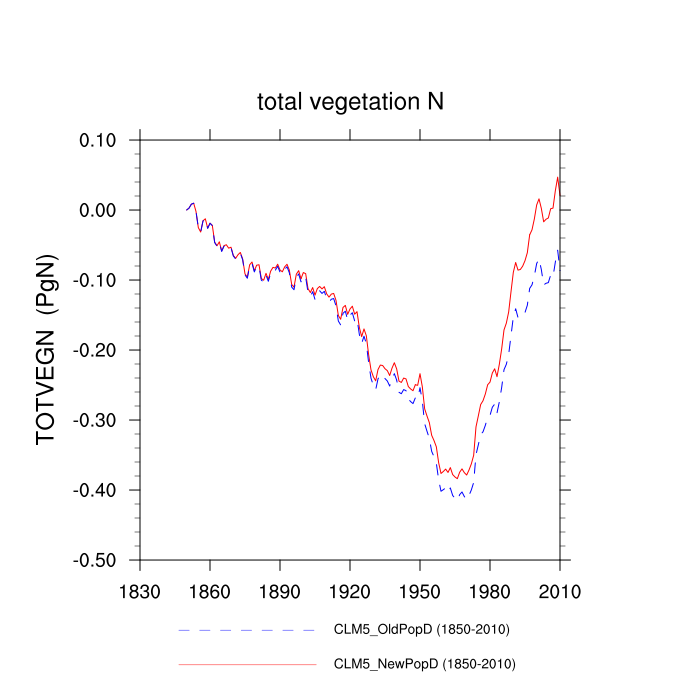
| total vegetation N (TOTVEGN) | TrendPlot | DifferencePlot | AnomalyPlot | ||
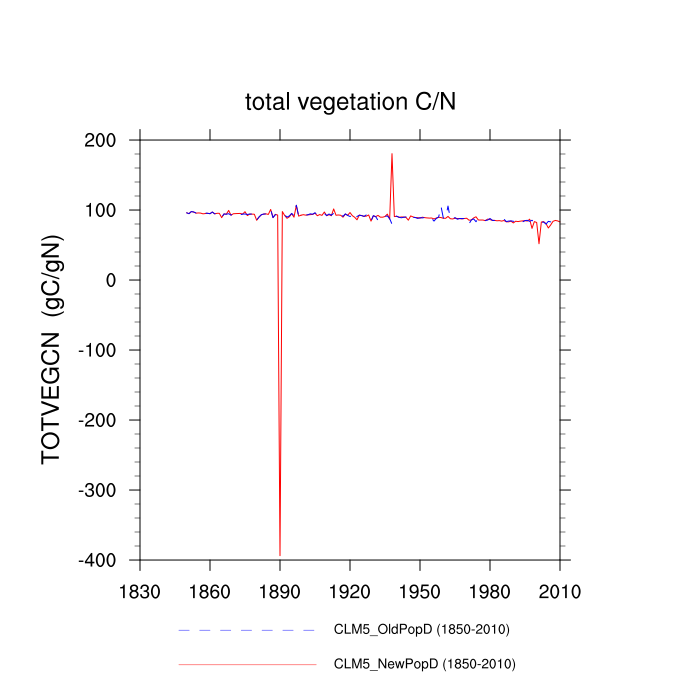
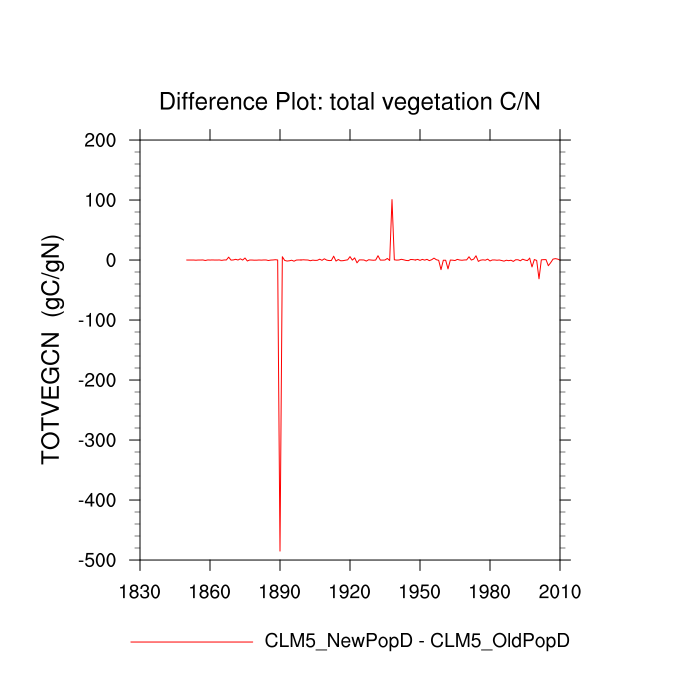
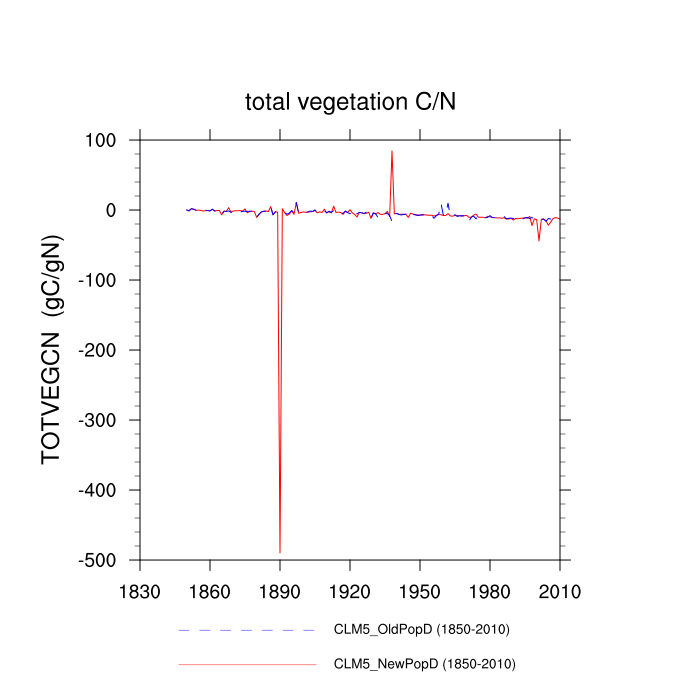
| total vegetation C/N (TOTVEGCN) | TrendPlot | DifferencePlot | AnomalyPlot | ||
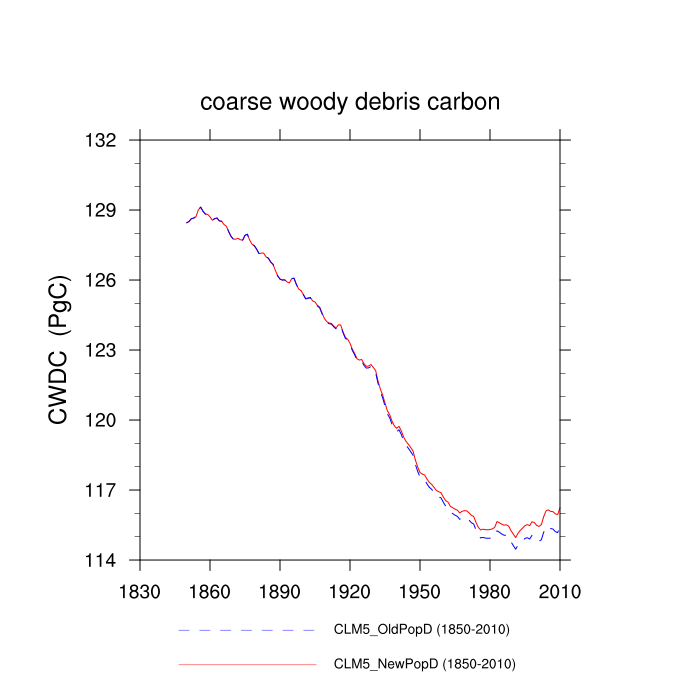
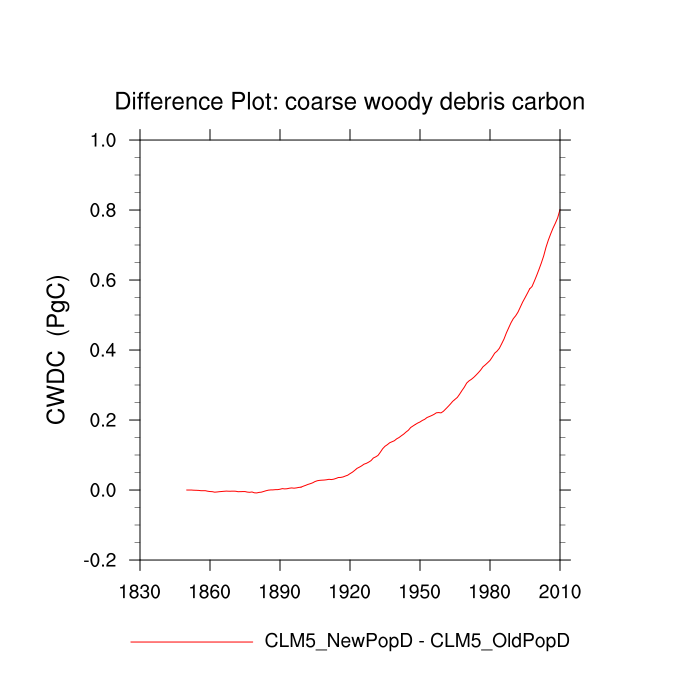
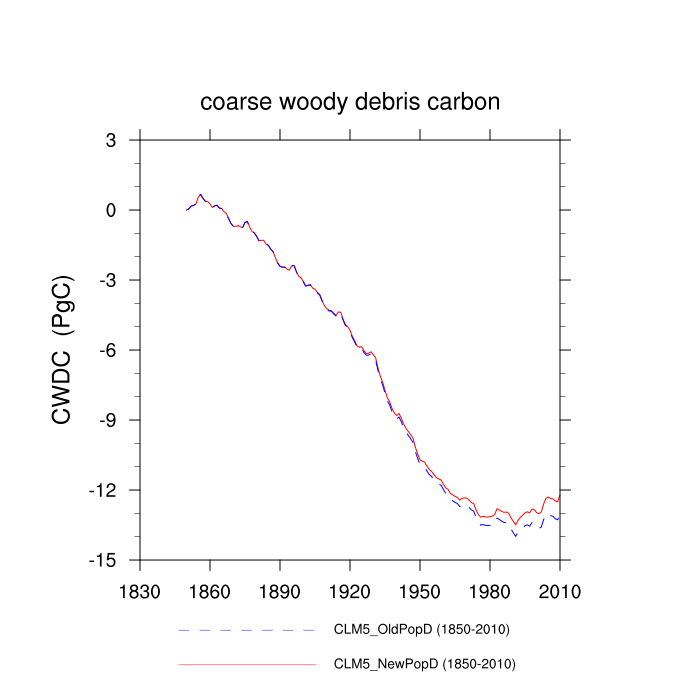
| coarse woody debris carbon (CWDC) | TrendPlot | DifferencePlot | AnomalyPlot | ||
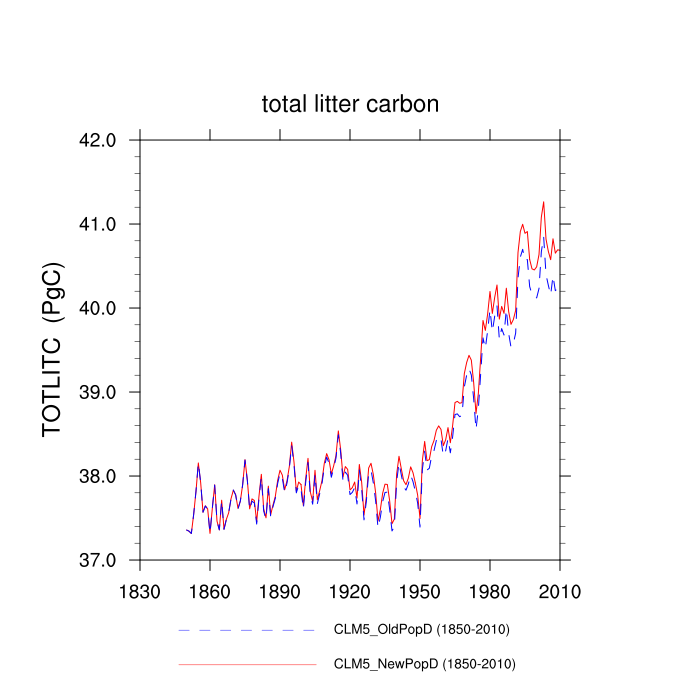
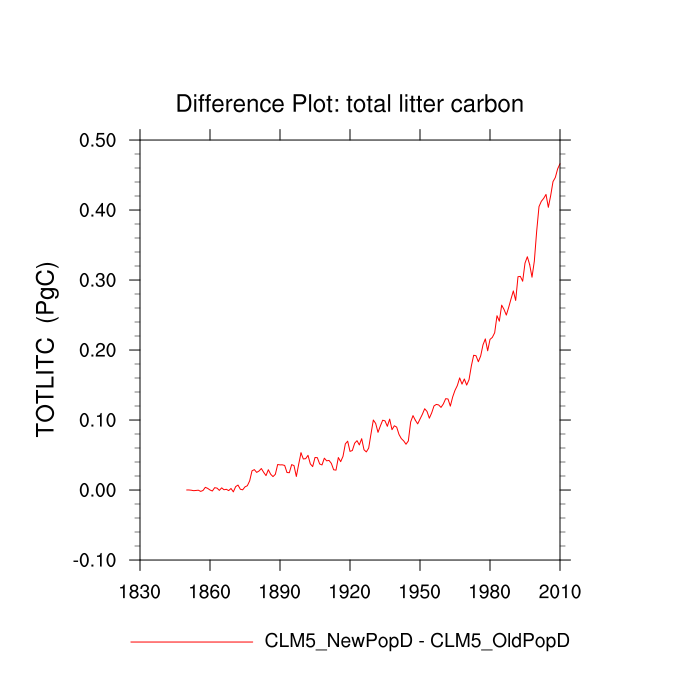
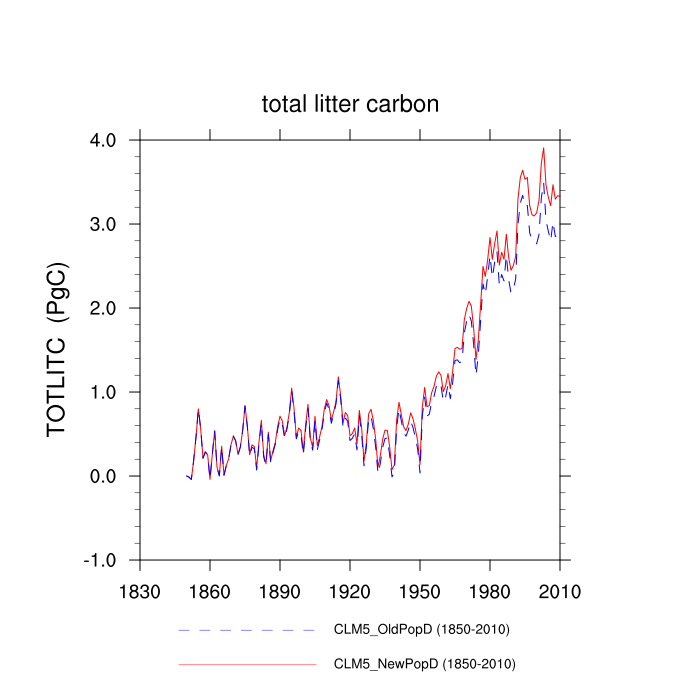
| total litter carbon (TOTLITC) | TrendPlot | DifferencePlot | AnomalyPlot | ||
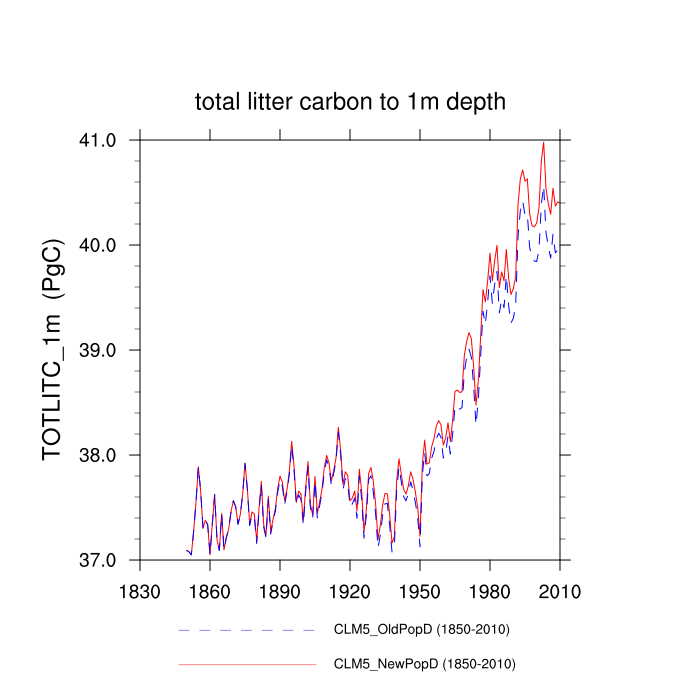
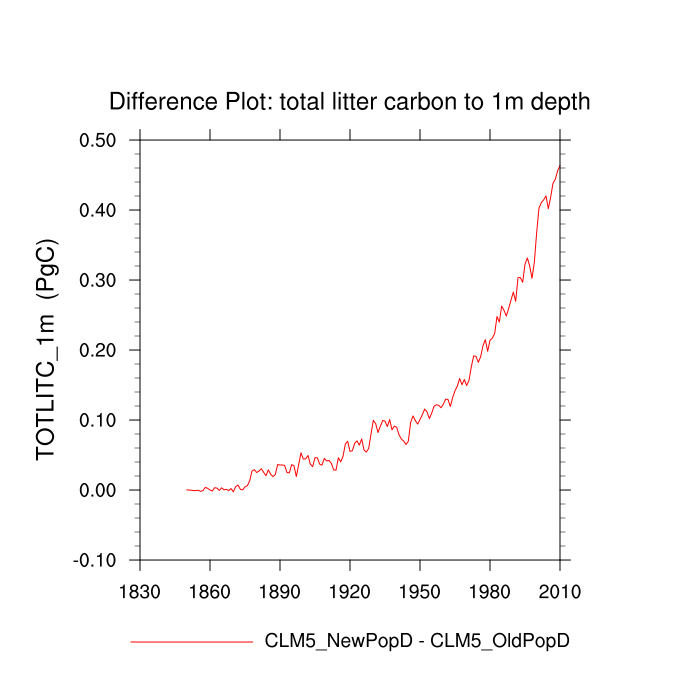
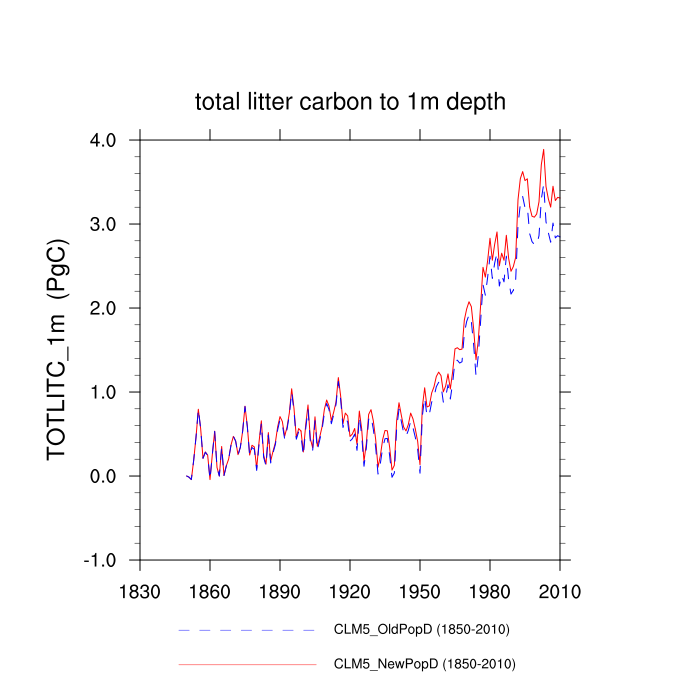
| total litter carbon to 1m depth (TOTLITC_1m) | TrendPlot | DifferencePlot | AnomalyPlot | ||
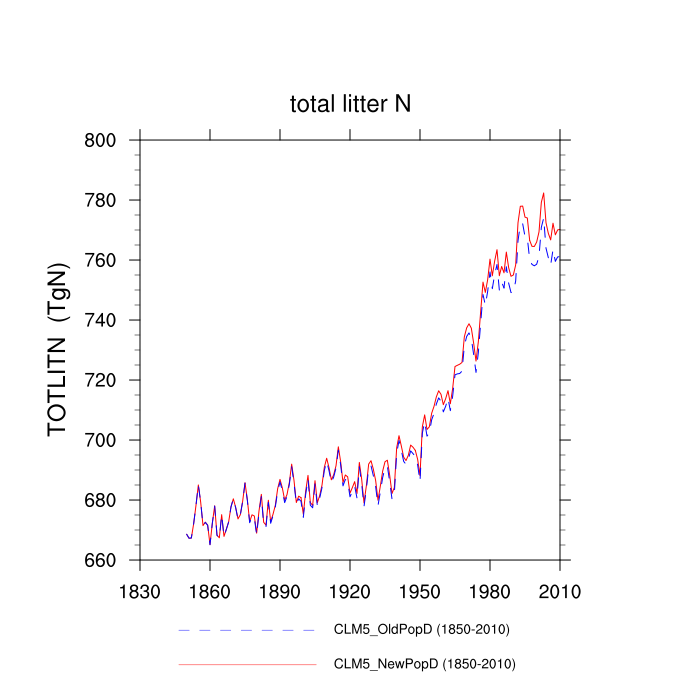
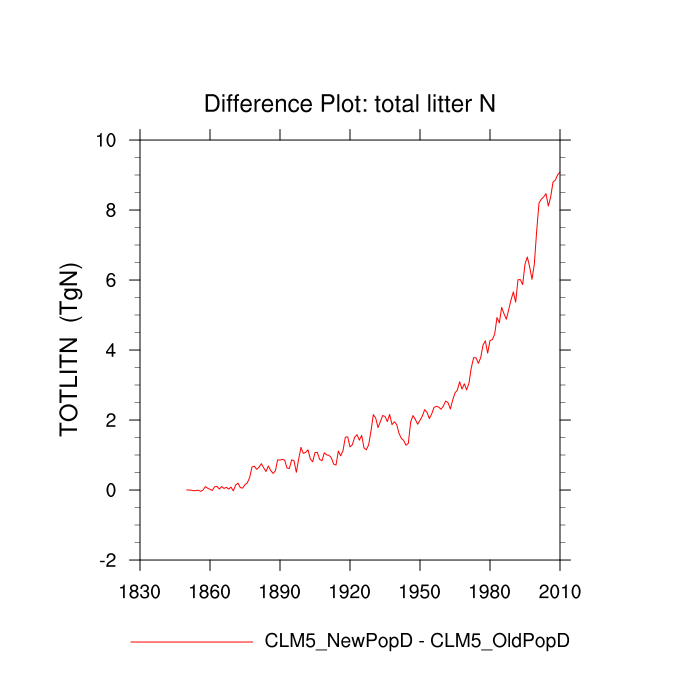
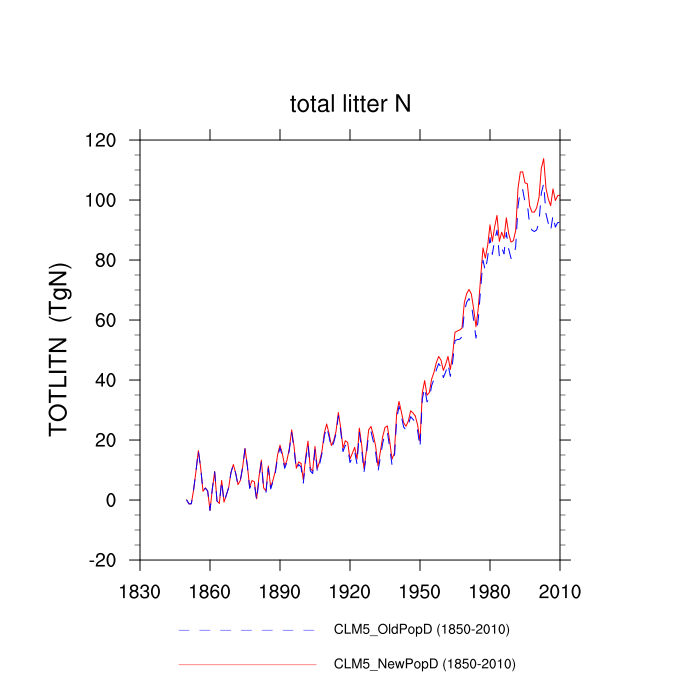
| total litter N (TOTLITN) | TrendPlot | DifferencePlot | AnomalyPlot | ||
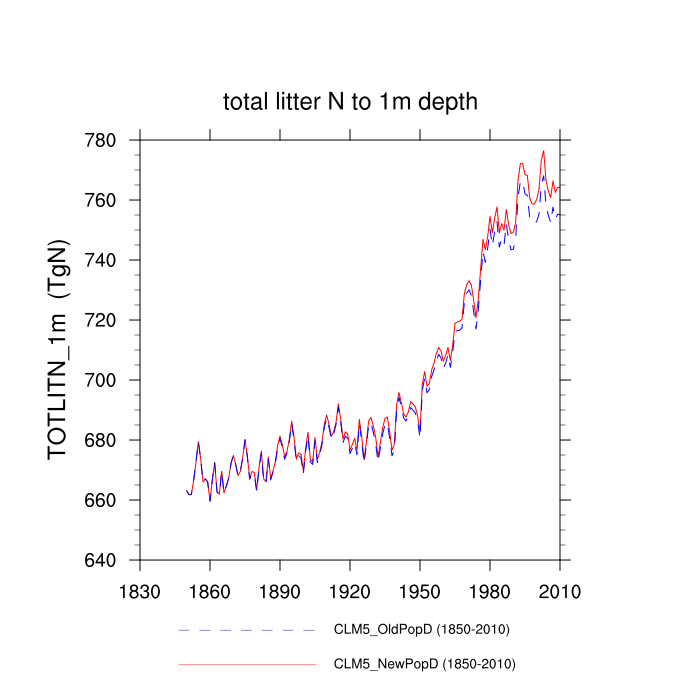
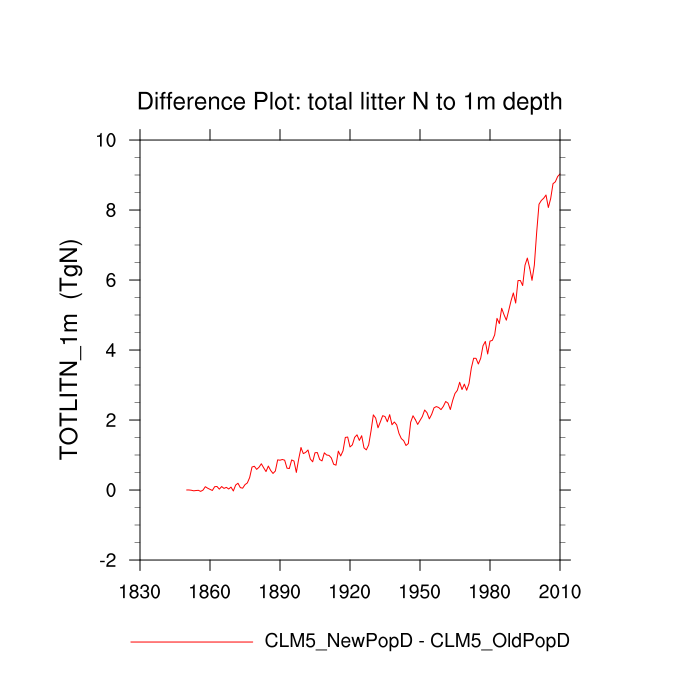
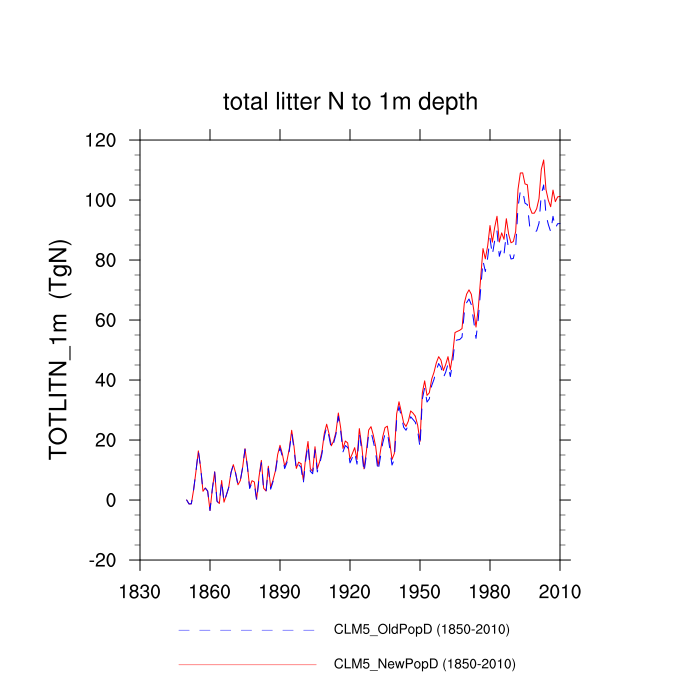
| total litter N to 1m depth (TOTLITN_1m) | TrendPlot | DifferencePlot | AnomalyPlot | ||
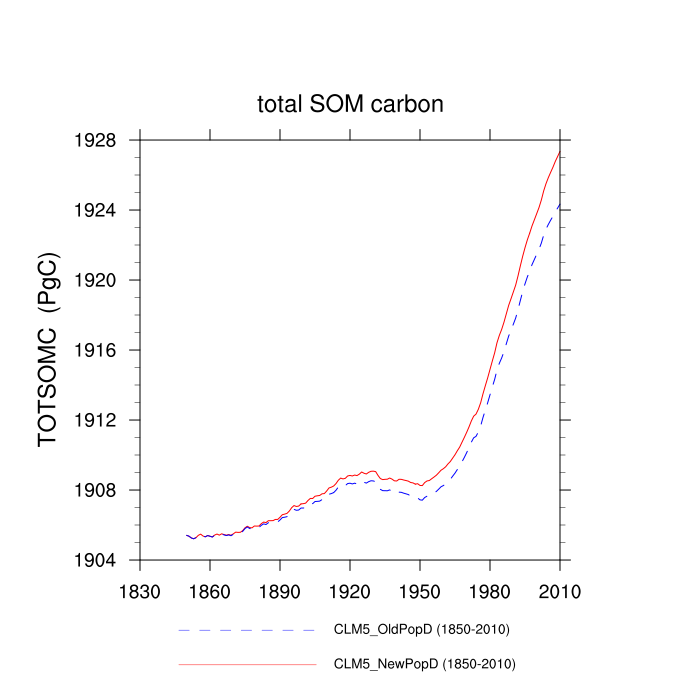
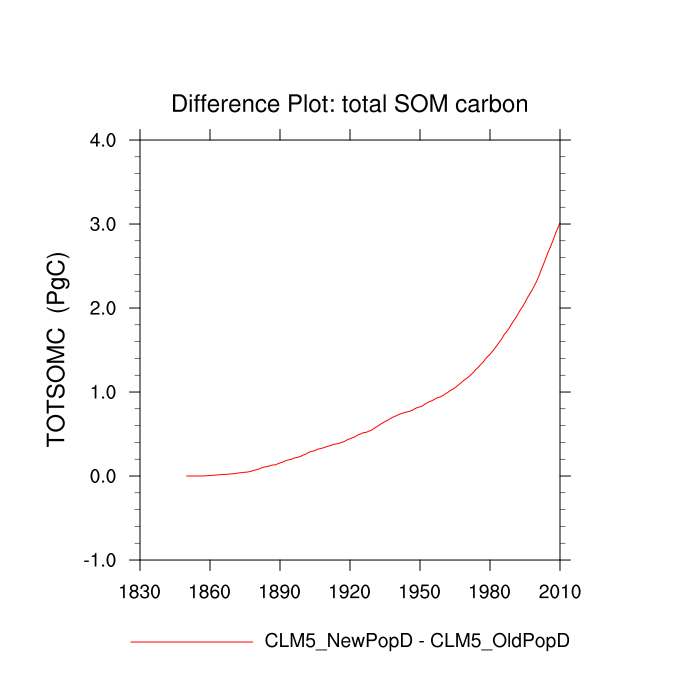
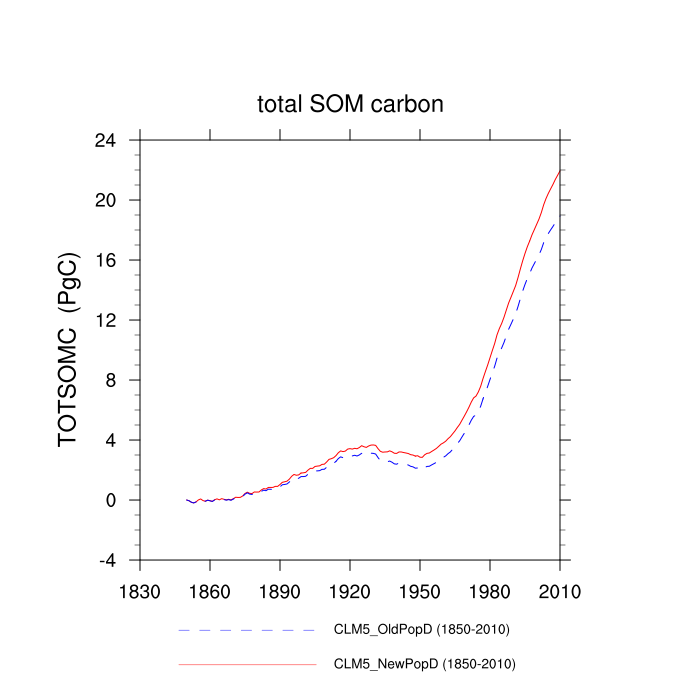
| total SOM carbon (TOTSOMC) | TrendPlot | DifferencePlot | AnomalyPlot | ||
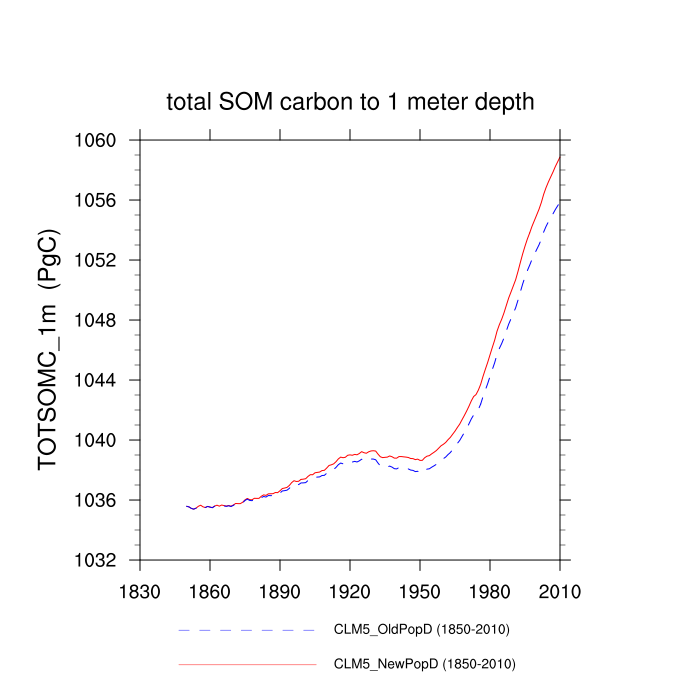
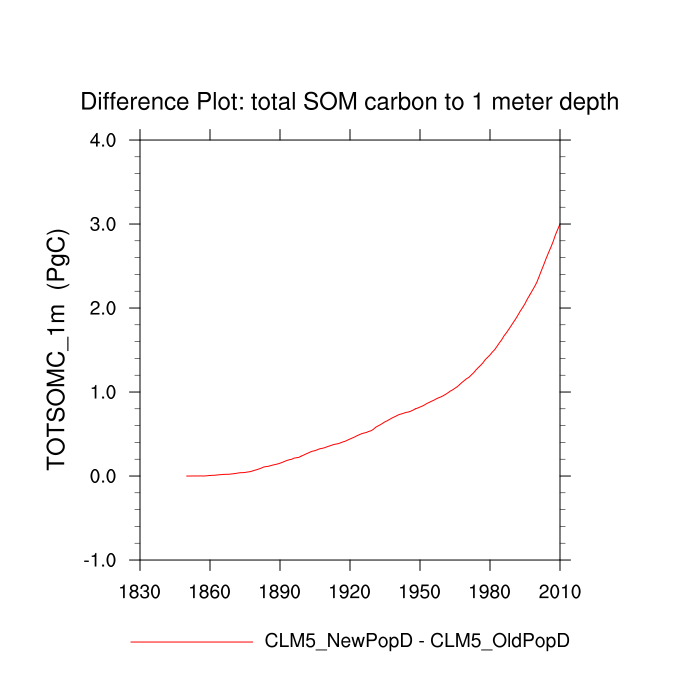
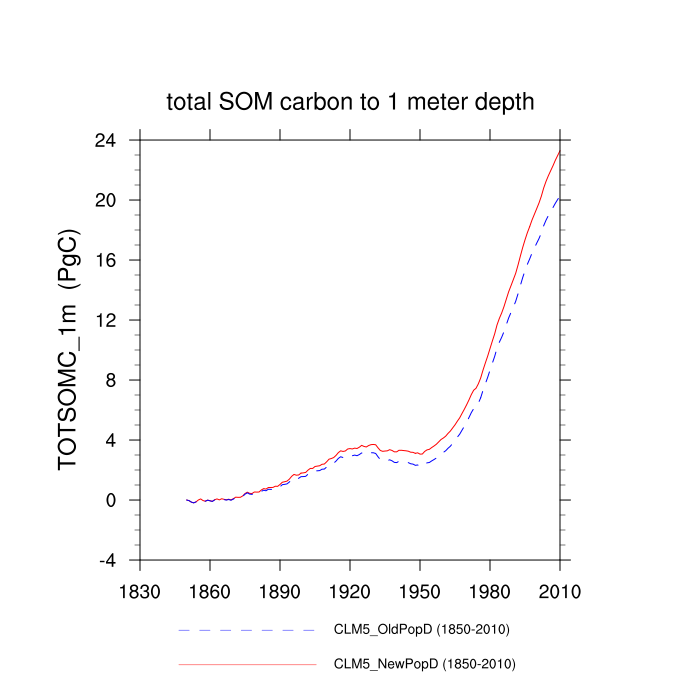
| total SOM carbon to 1 meter depth (TOTSOMC_1m) | TrendPlot | DifferencePlot | AnomalyPlot | ||
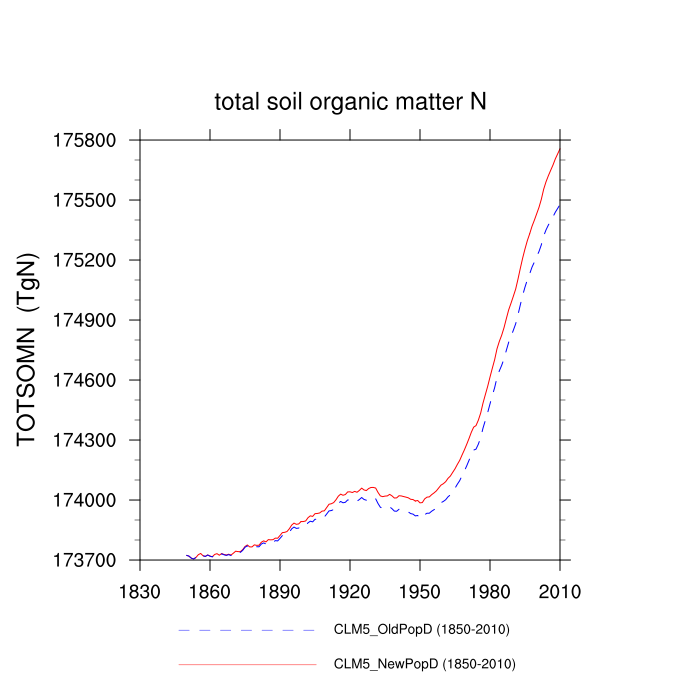
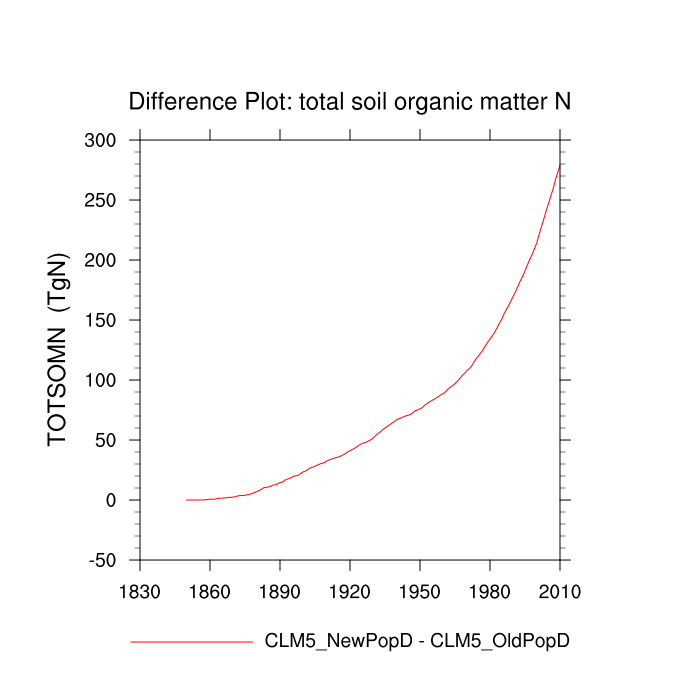
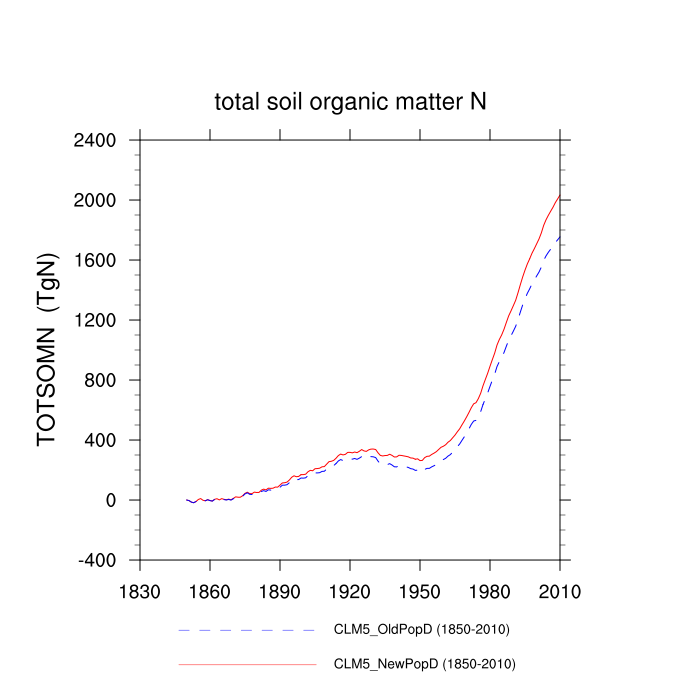
| total soil organic matter N (TOTSOMN) | TrendPlot | DifferencePlot | AnomalyPlot | ||
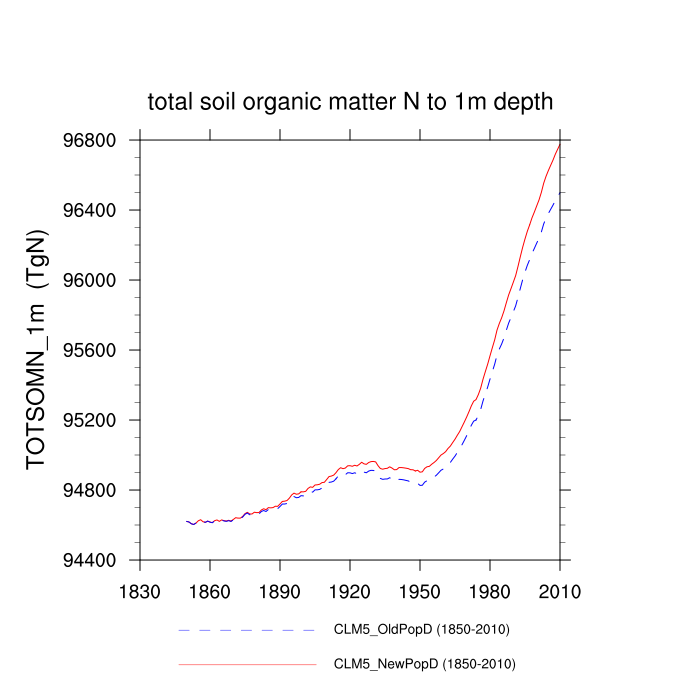
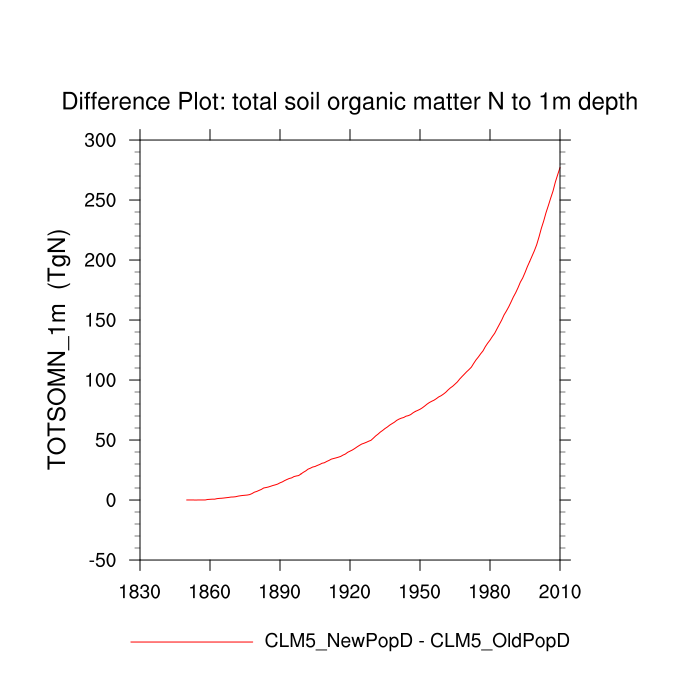
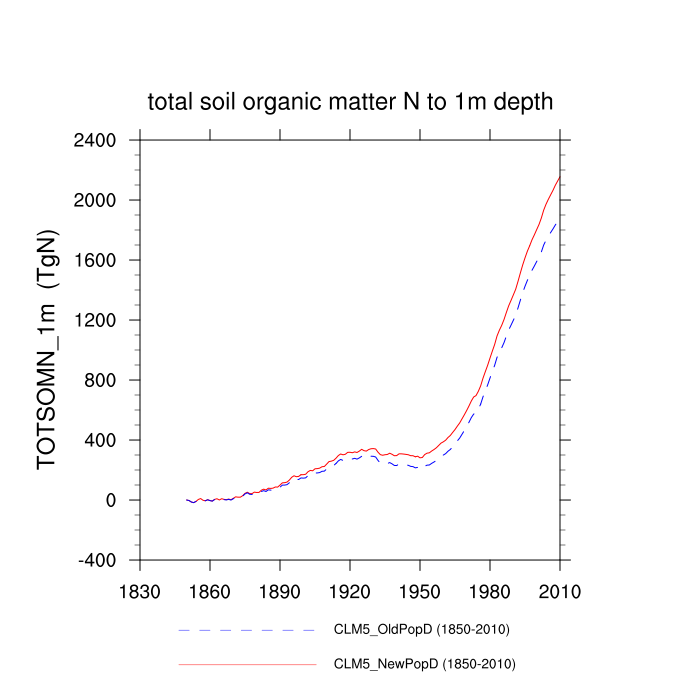
| total soil organic matter N to 1m depth (TOTSOMN_1m) | TrendPlot | DifferencePlot | AnomalyPlot | ||
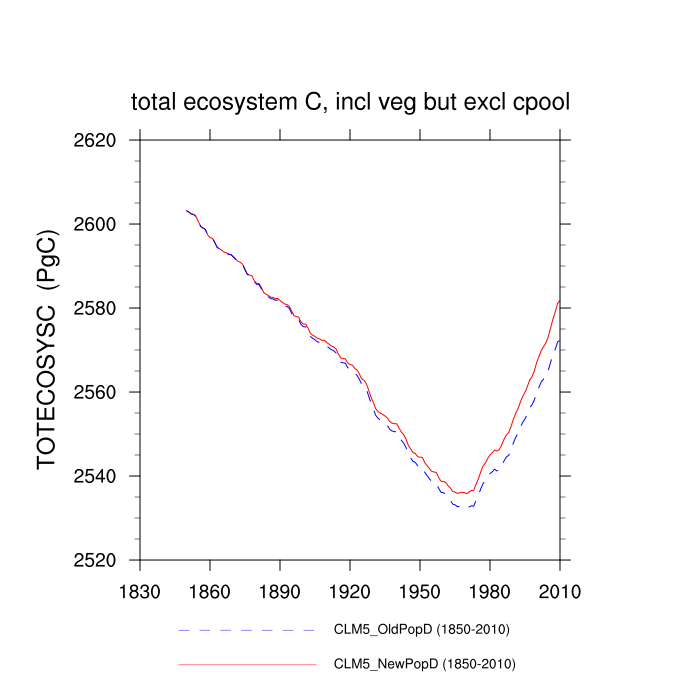
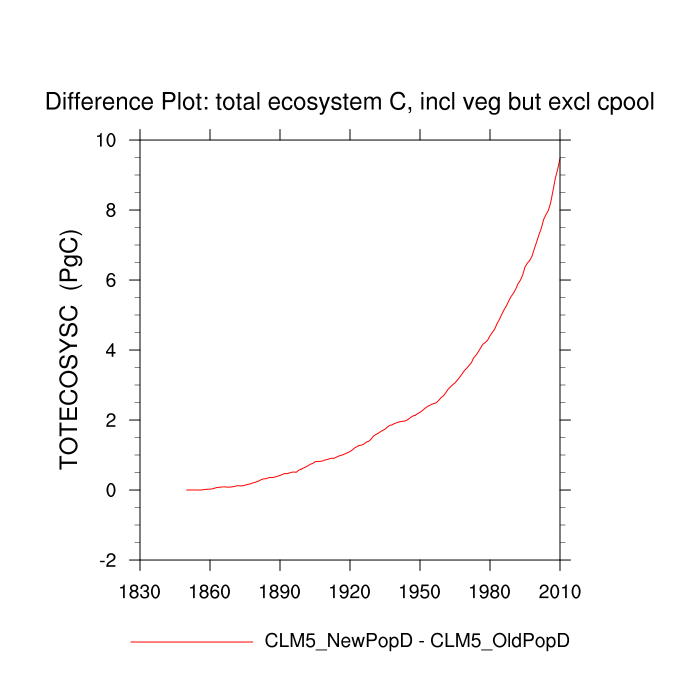
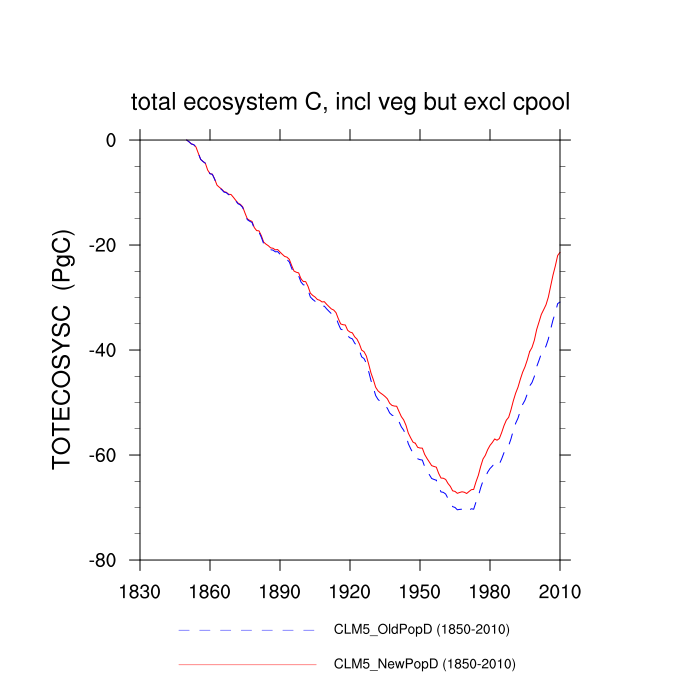
| total ecosystem C, incl veg but excl cpool (TOTECOSYSC) | TrendPlot | DifferencePlot | AnomalyPlot | ||
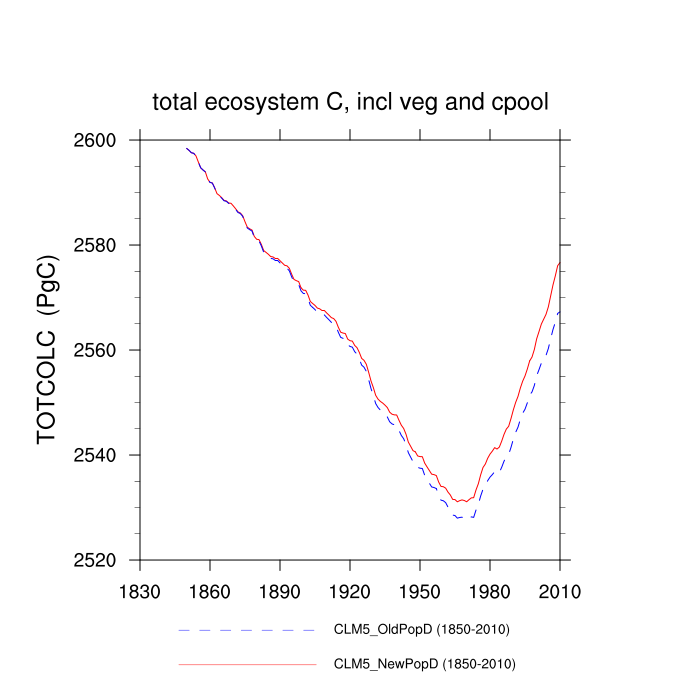
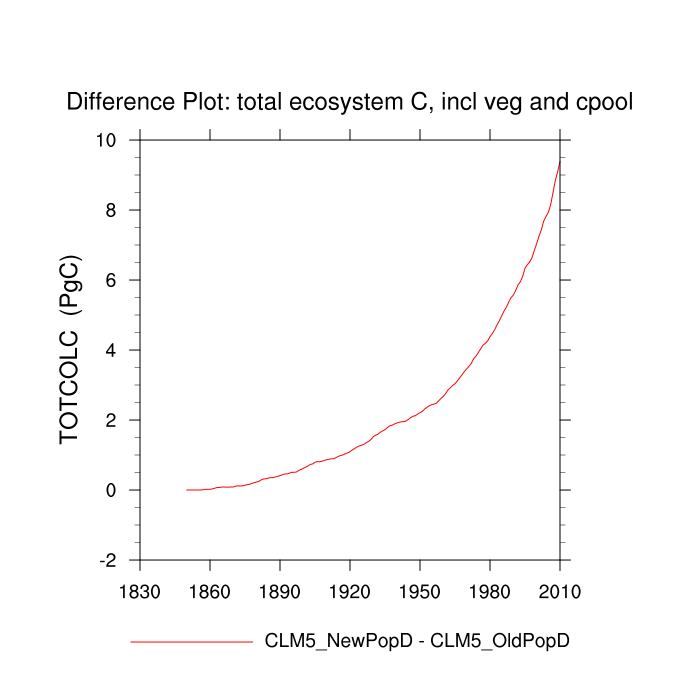
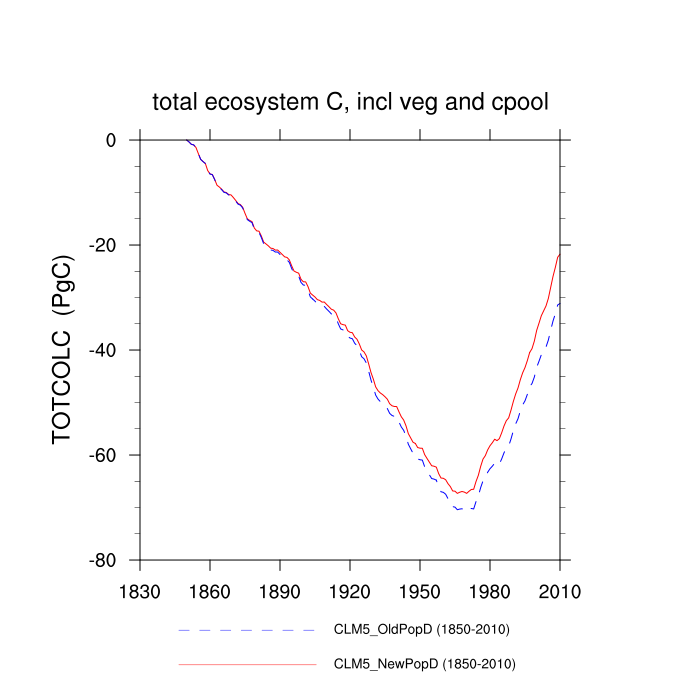
| total ecosystem C, incl veg and cpool (TOTCOLC) | TrendPlot | DifferencePlot | AnomalyPlot | ||
| column-level sink for C truncation (COL_CTRUNC) | --- | --- | --- | ||
| pft-level sink for C truncation (PFT_CTRUNC) | --- | --- | --- | ||
| fraction of potential GPP (FPG) | --- | --- | --- | ||
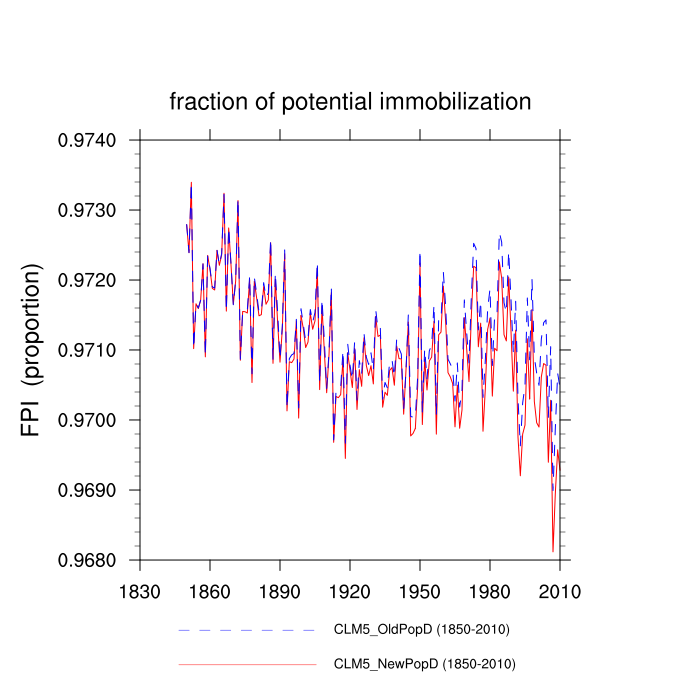
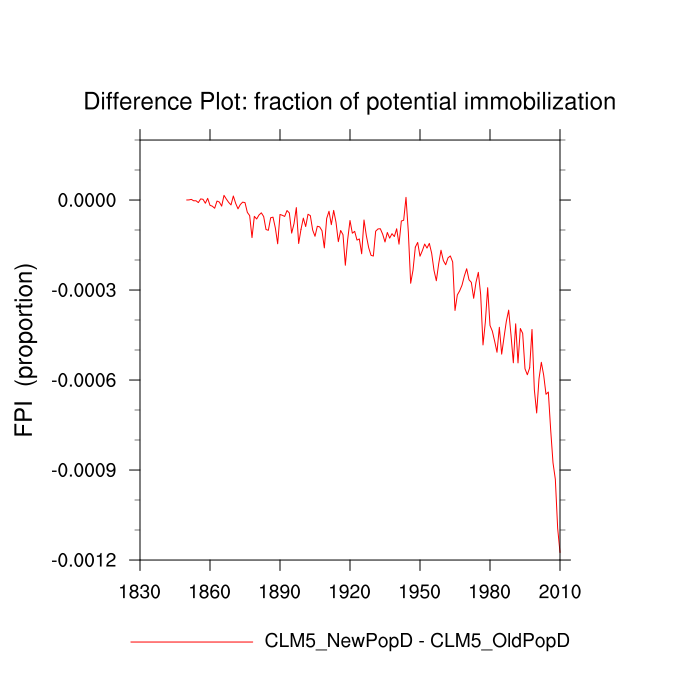
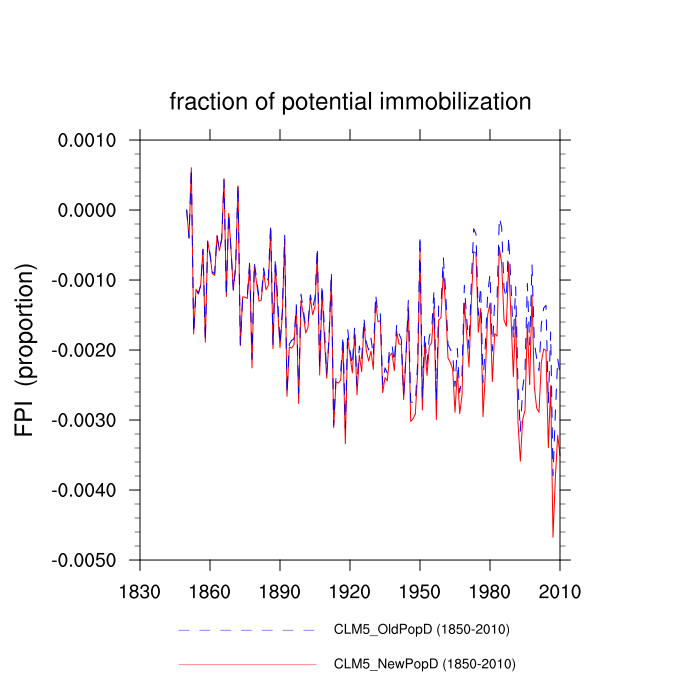
| fraction of potential immobilization (FPI) | TrendPlot | DifferencePlot | AnomalyPlot | ||
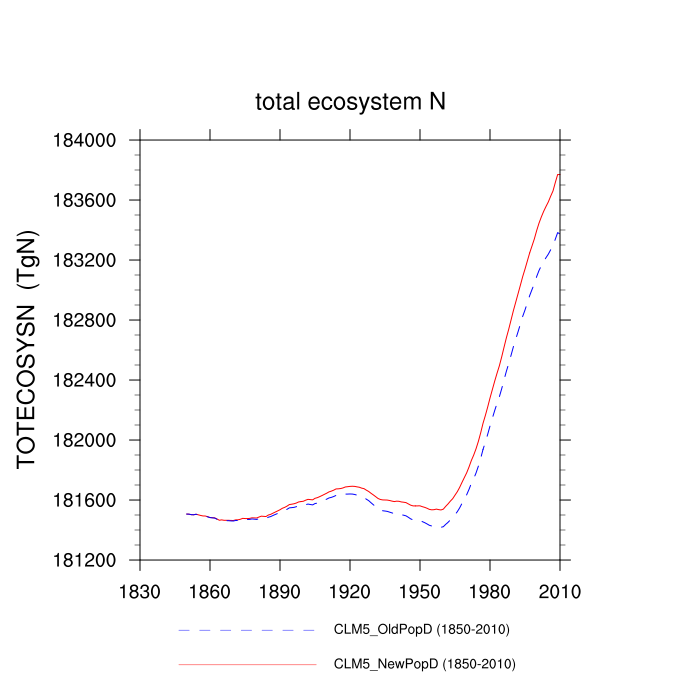
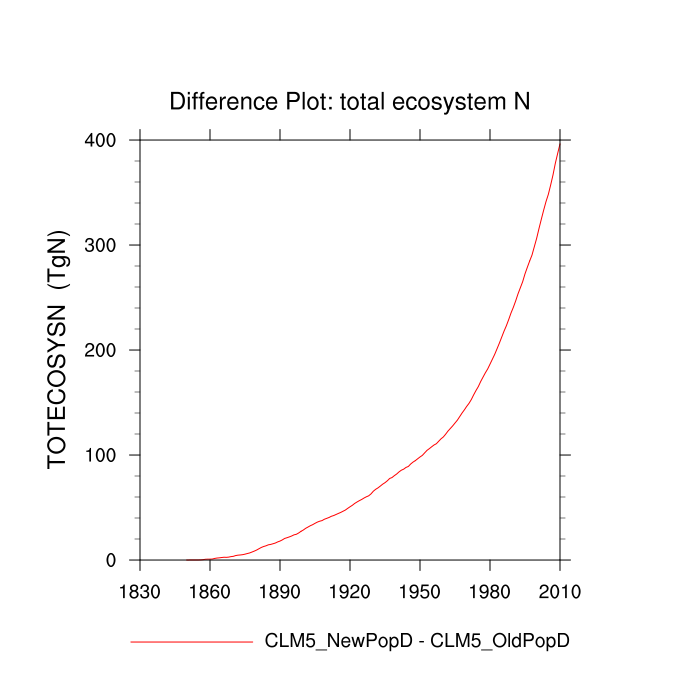
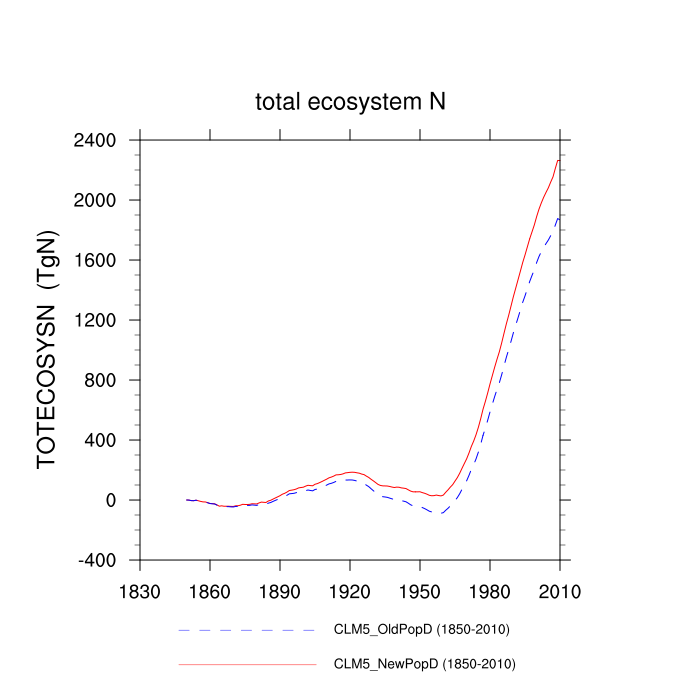
| total ecosystem N (TOTECOSYSN) | TrendPlot | DifferencePlot | AnomalyPlot | ||
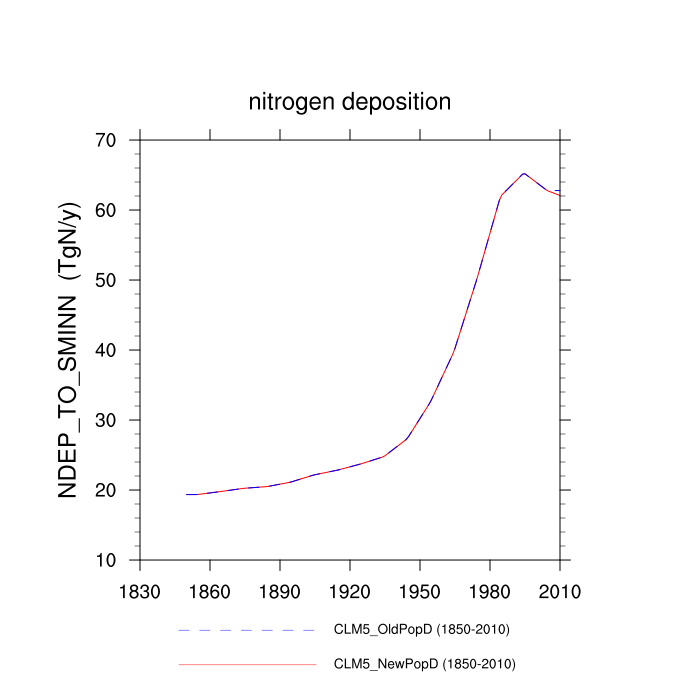
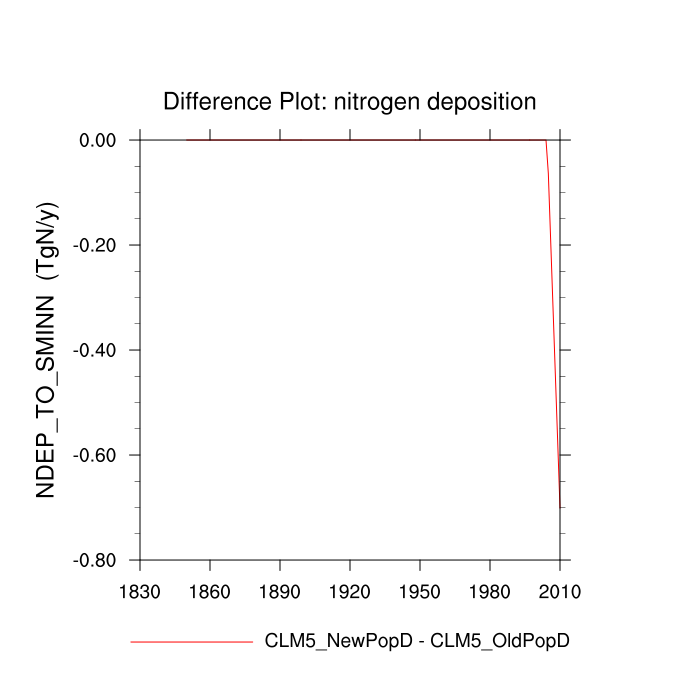
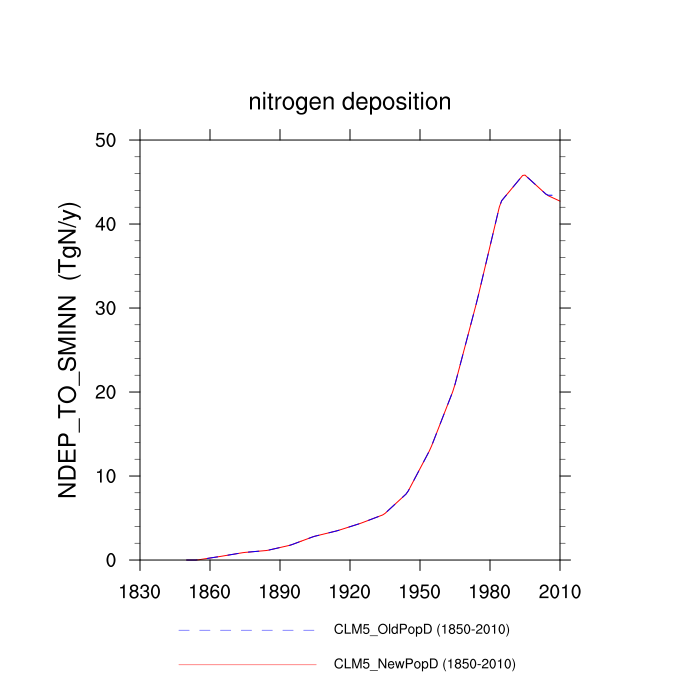
| nitrogen deposition (NDEP_TO_SMINN) | TrendPlot | DifferencePlot | AnomalyPlot | ||
| fertilizer added (FERT) | --- | --- | --- | ||
| fertilizer to soil mineral N (FERT_TO_SMINN) | --- | --- | --- | ||
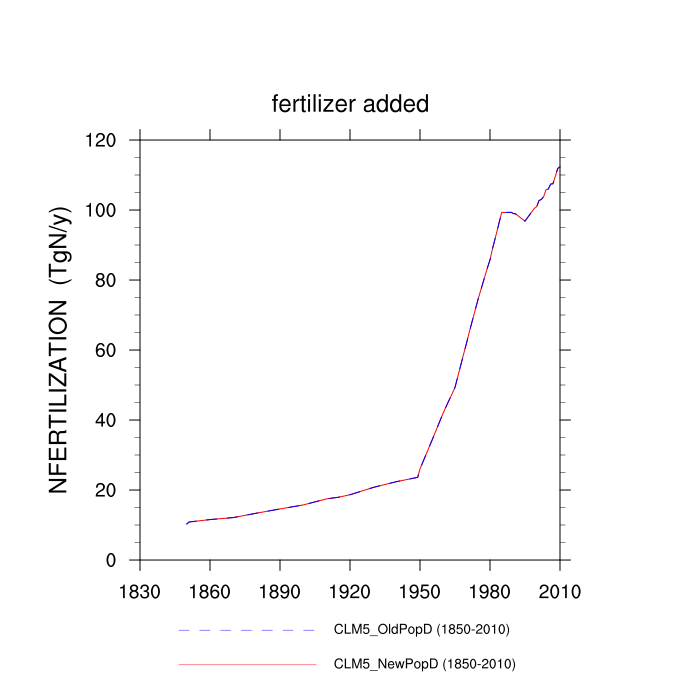
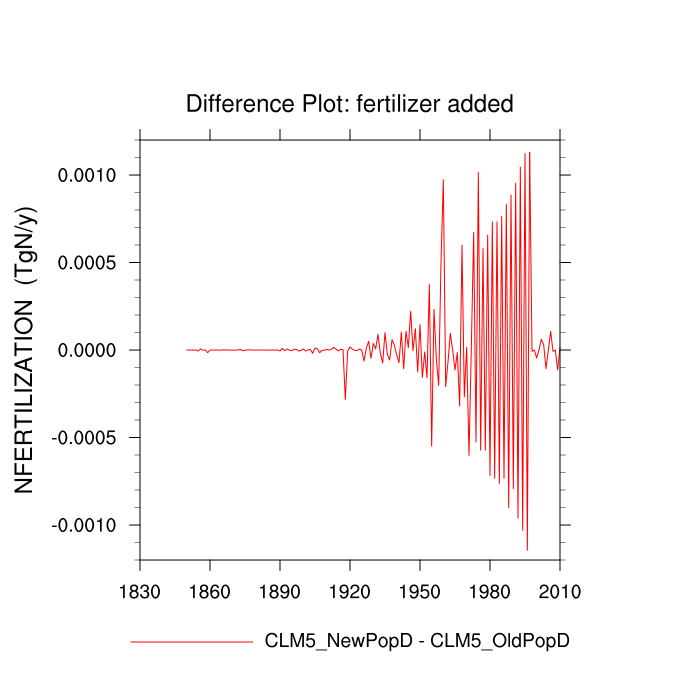
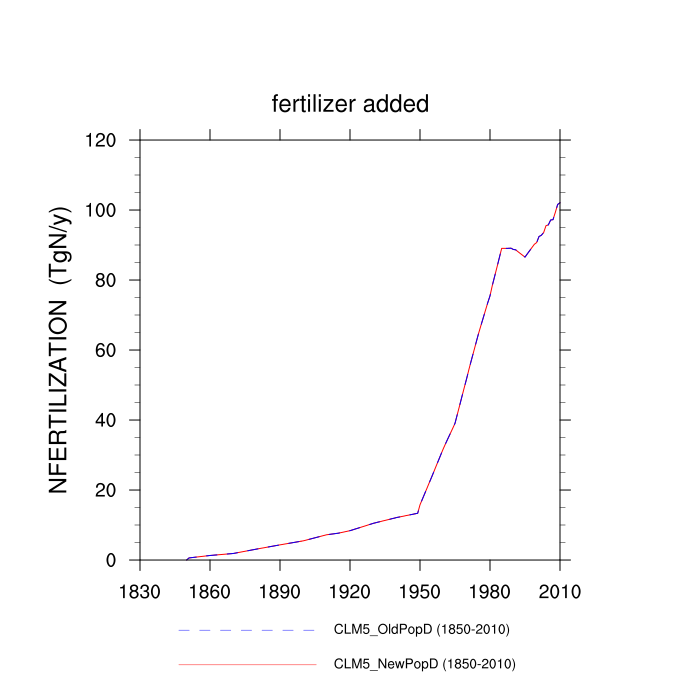
| fertilizer added (NFERTILIZATION) | TrendPlot | DifferencePlot | AnomalyPlot | ||
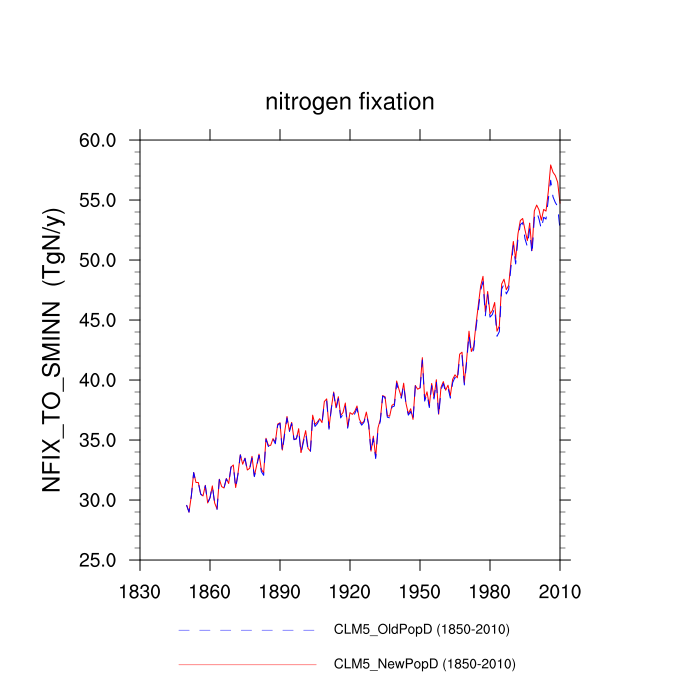
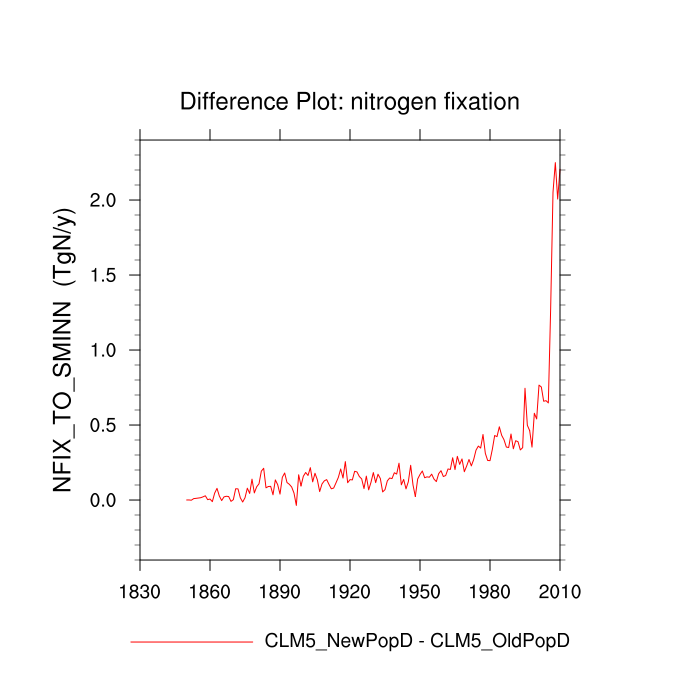
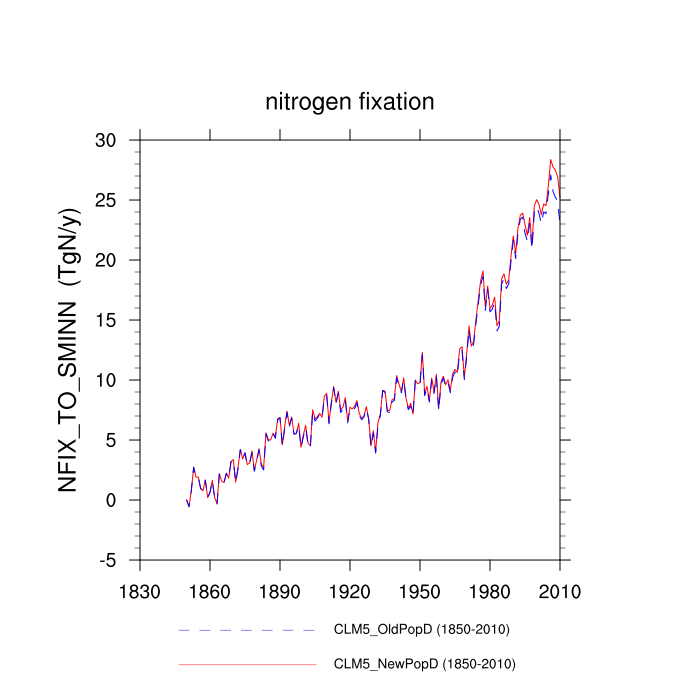
| nitrogen fixation (NFIX_TO_SMINN) | TrendPlot | DifferencePlot | AnomalyPlot | ||
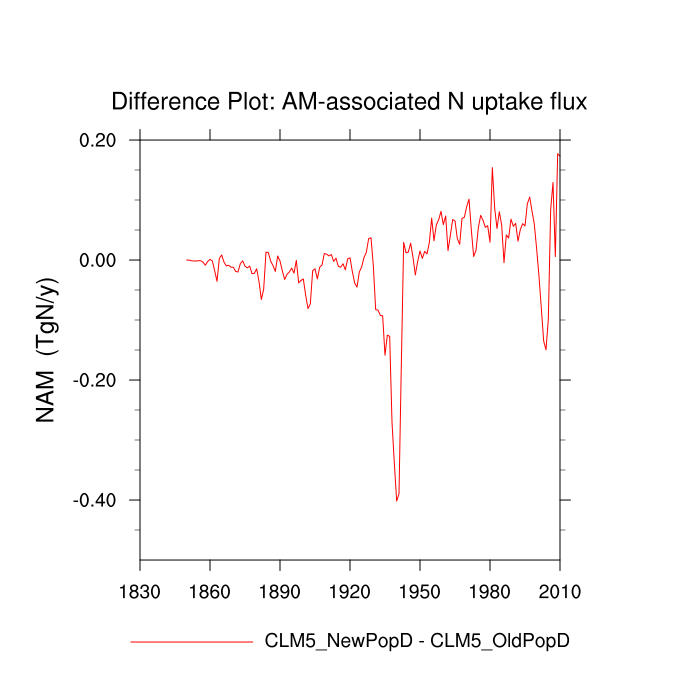
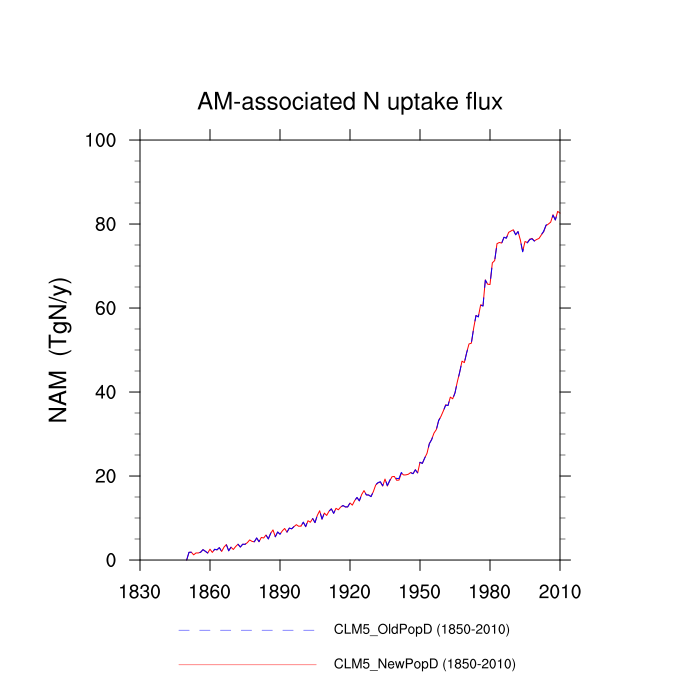
| AM-associated N uptake flux (NAM) | TrendPlot | DifferencePlot | AnomalyPlot | ||
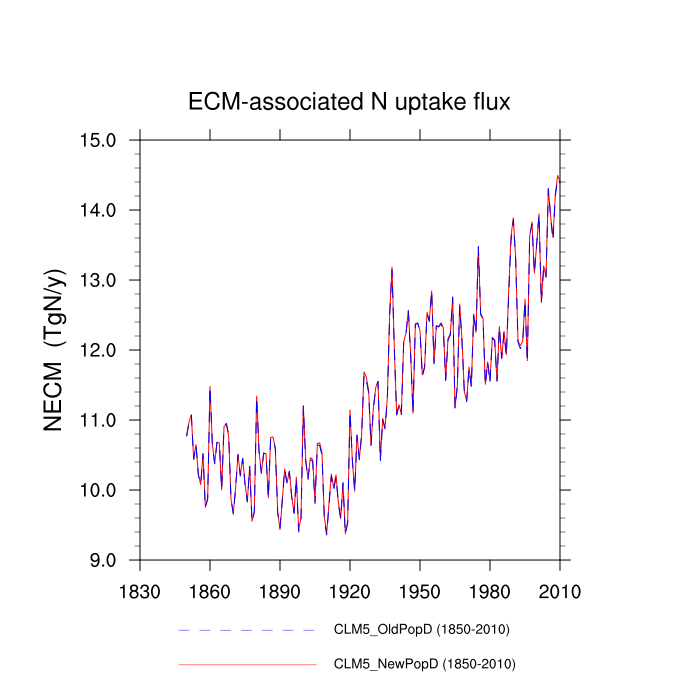
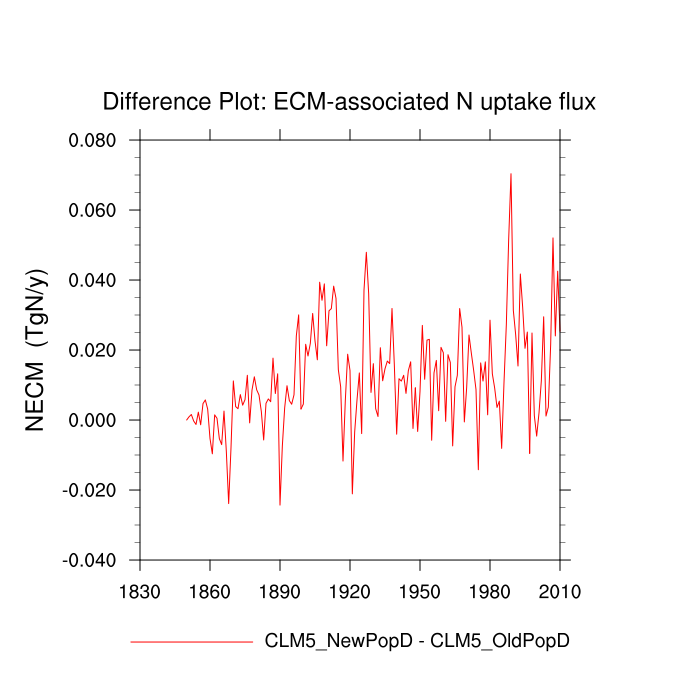
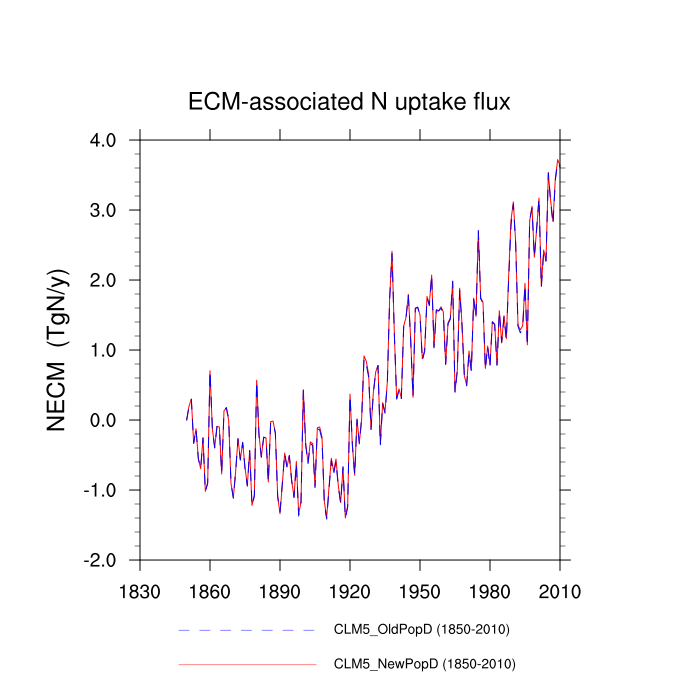
| ECM-associated N uptake flux (NECM) | TrendPlot | DifferencePlot | AnomalyPlot | ||
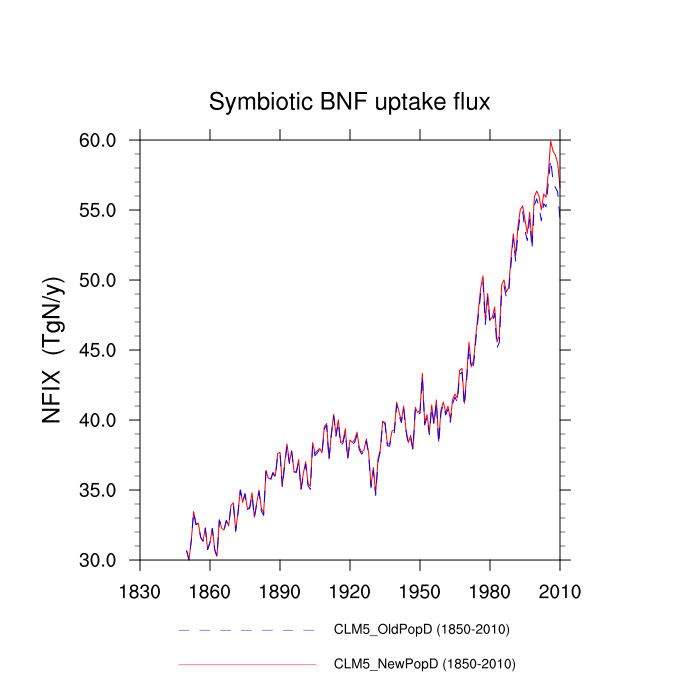
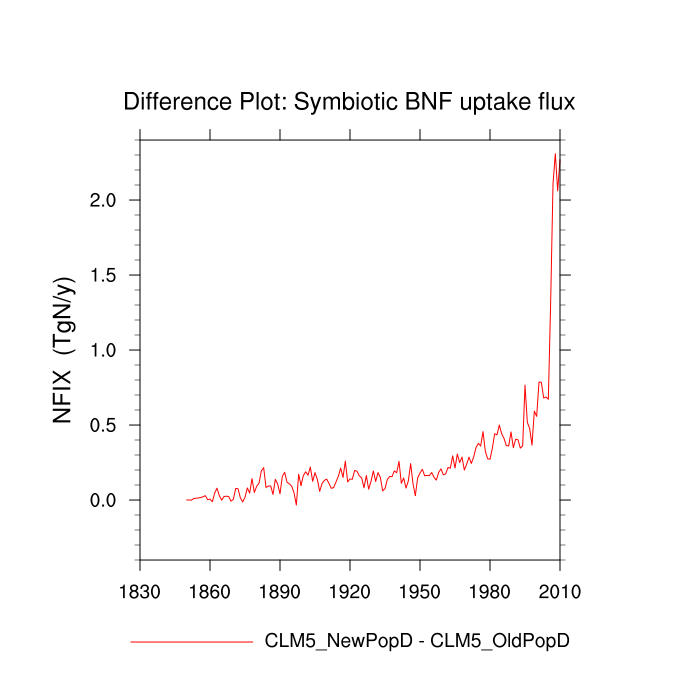
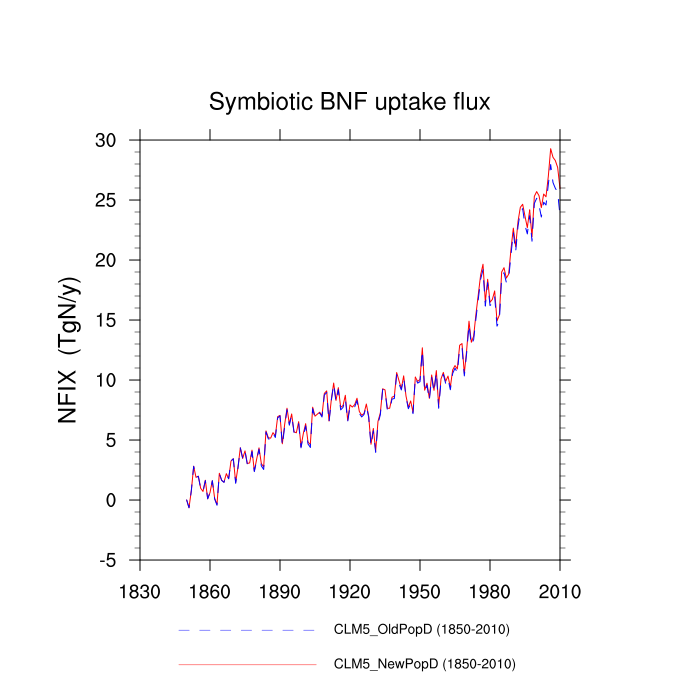
| Symbiotic BNF uptake flux (NFIX) | TrendPlot | DifferencePlot | AnomalyPlot | ||
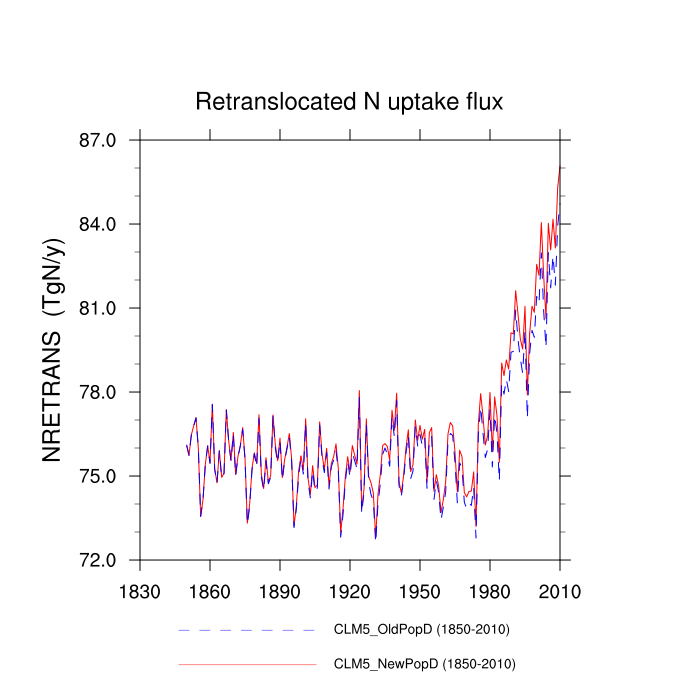
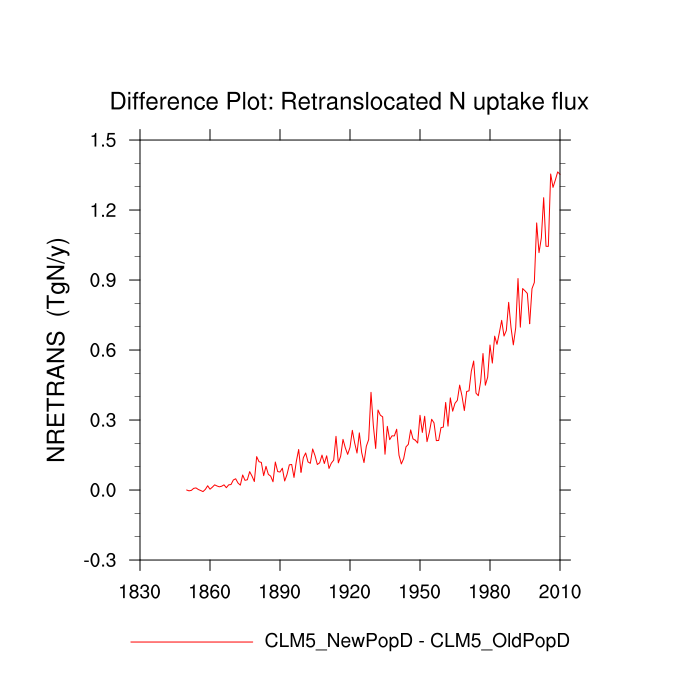
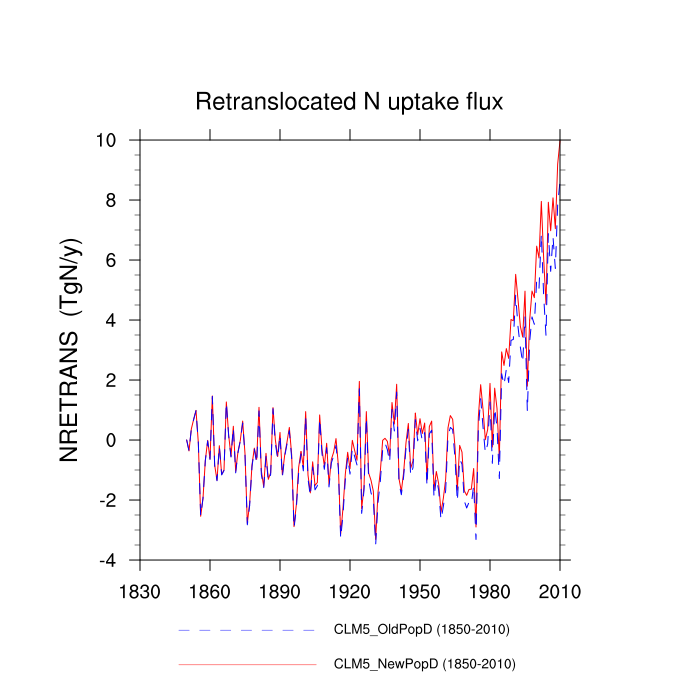
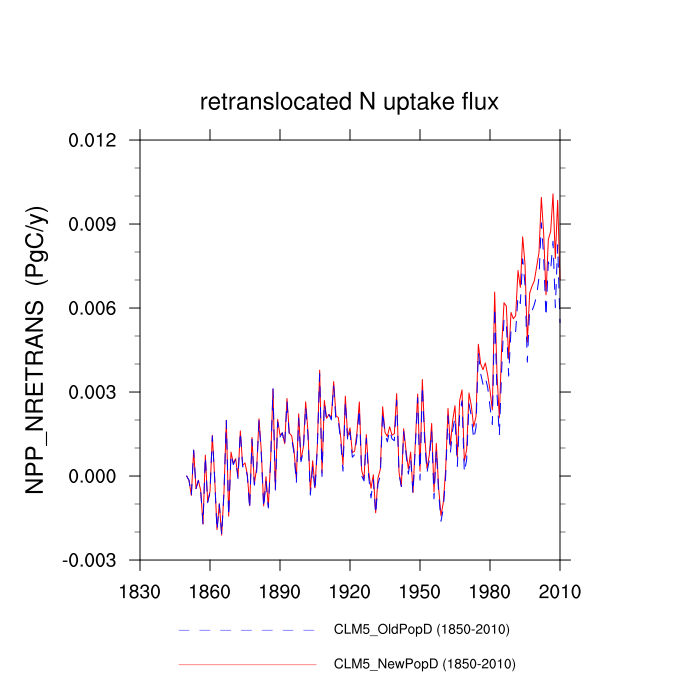
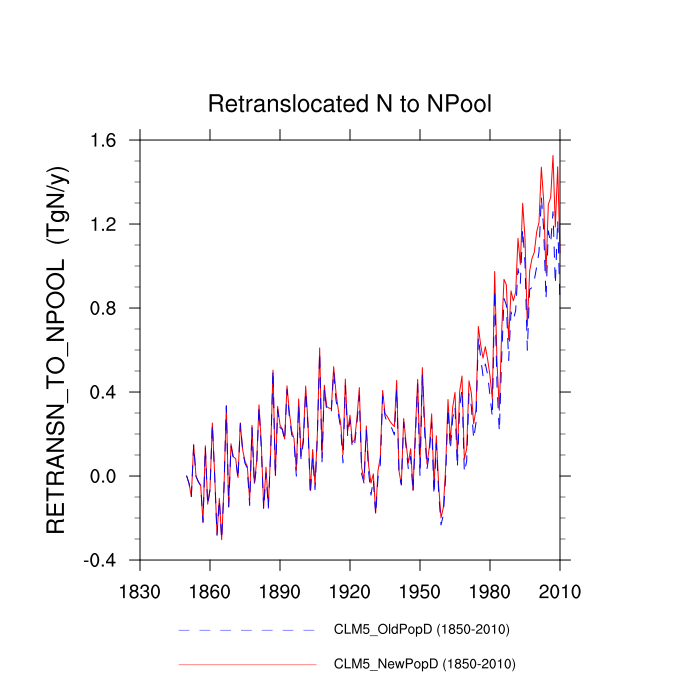
| Retranslocated N uptake flux (NRETRANS) | TrendPlot | DifferencePlot | AnomalyPlot | ||
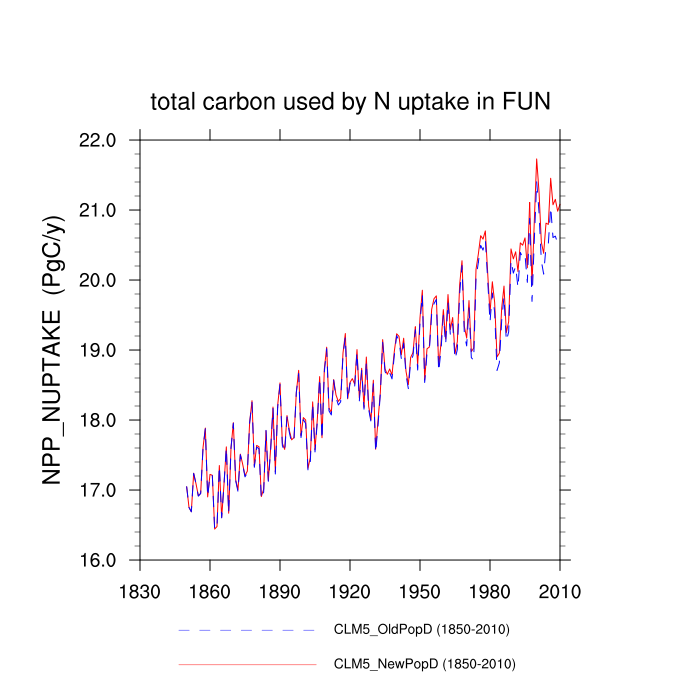
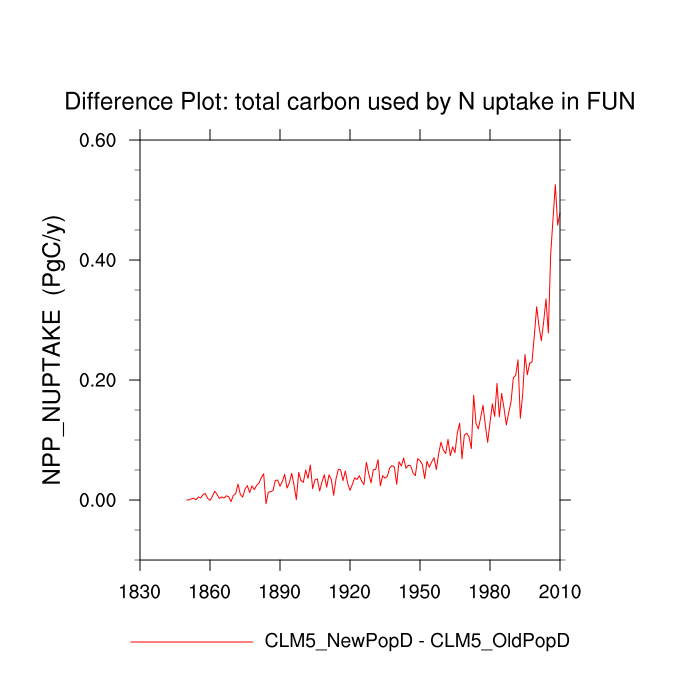
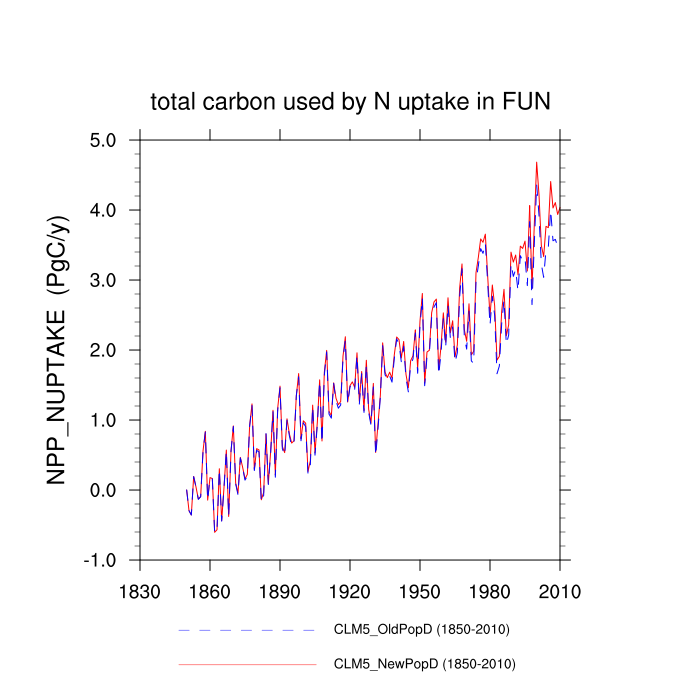
| total carbon used by N uptake in FUN (NPP_NUPTAKE) | TrendPlot | DifferencePlot | AnomalyPlot | ||
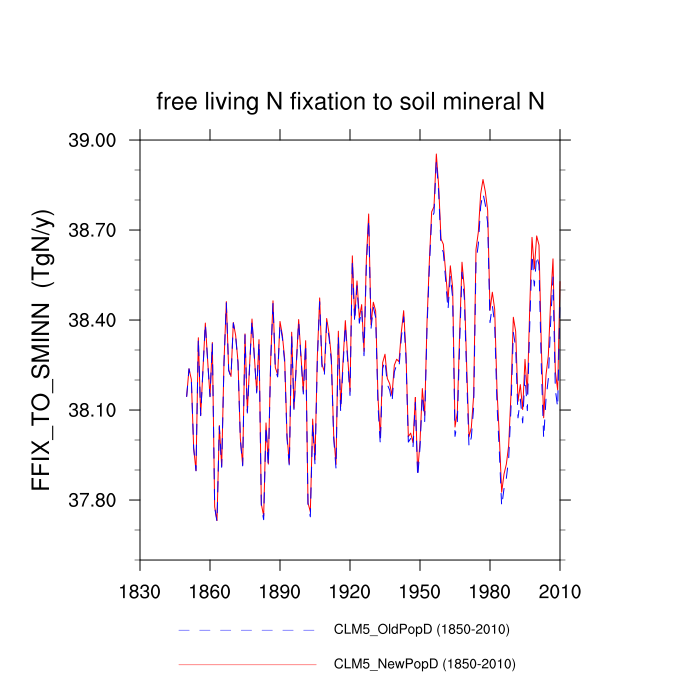
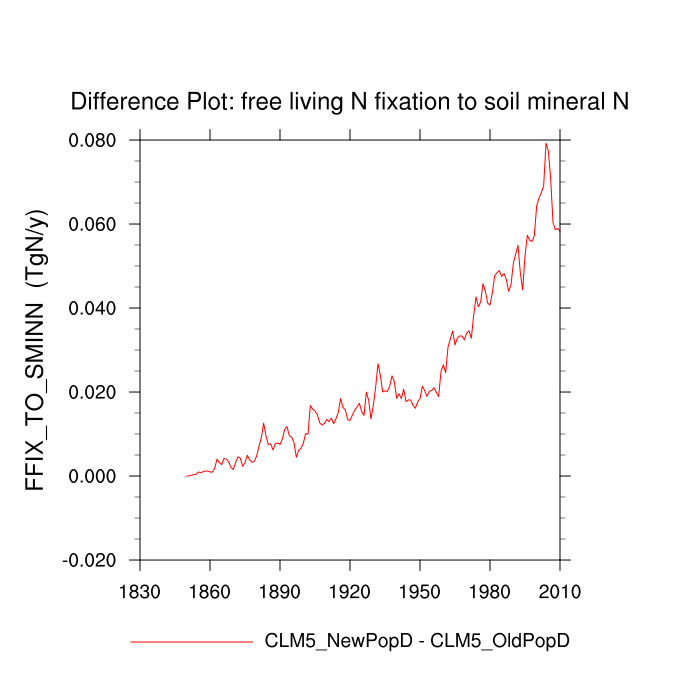
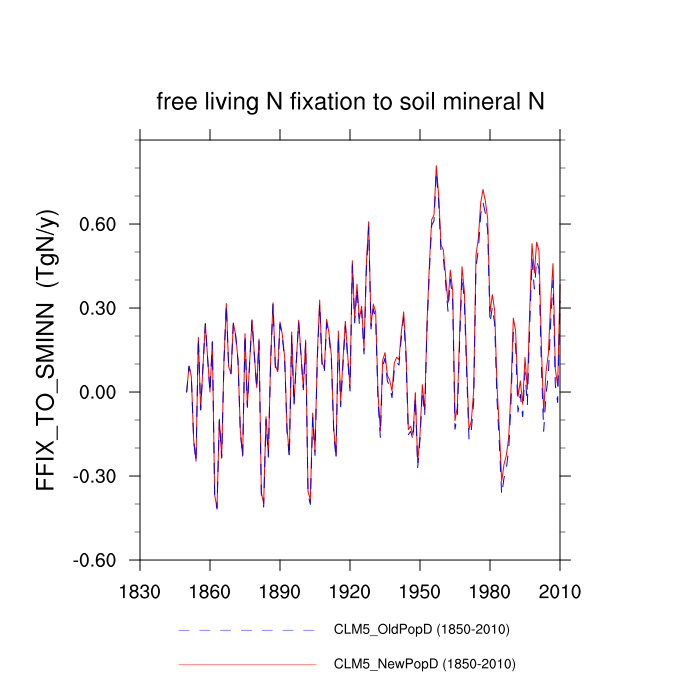
| free living N fixation to soil mineral N (FFIX_TO_SMINN) | TrendPlot | DifferencePlot | AnomalyPlot | ||
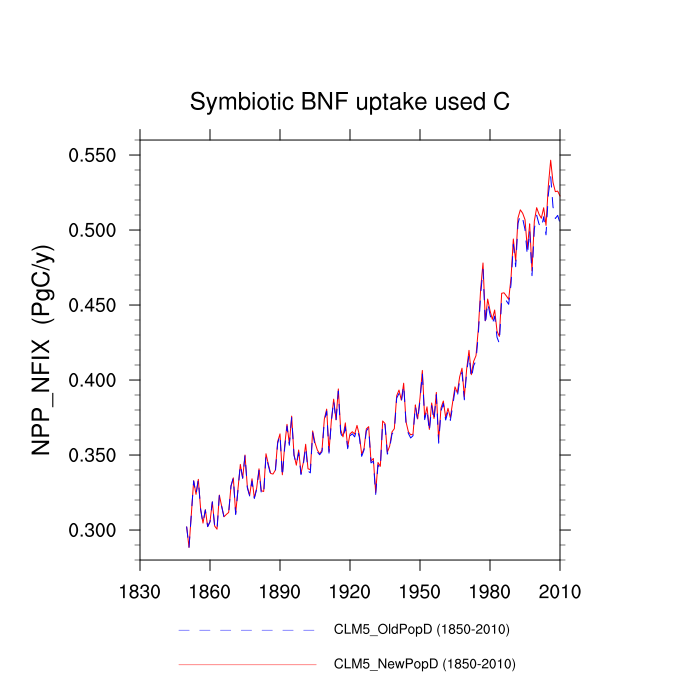
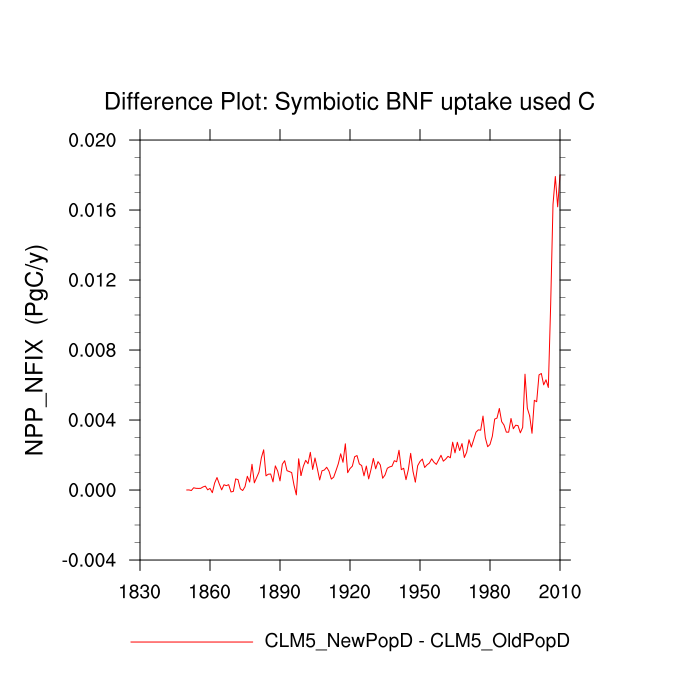
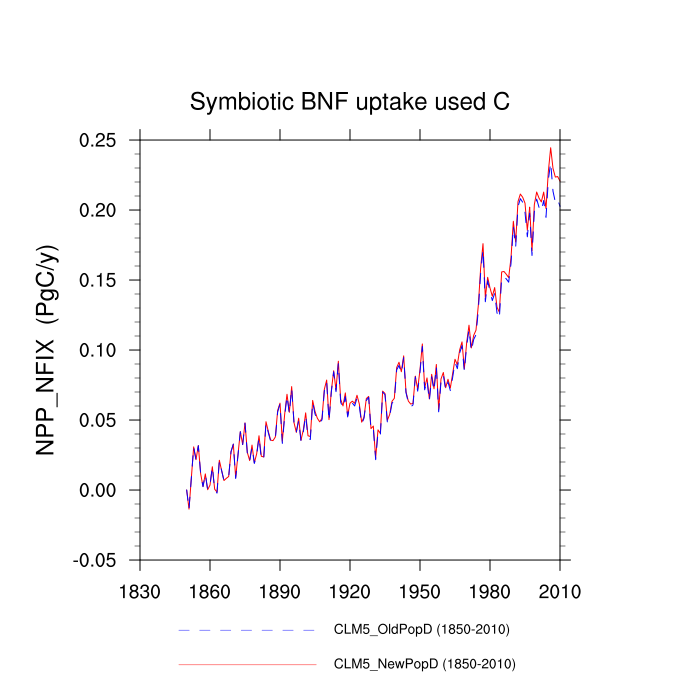
| Symbiotic BNF uptake used C (NPP_NFIX) | TrendPlot | DifferencePlot | AnomalyPlot | ||
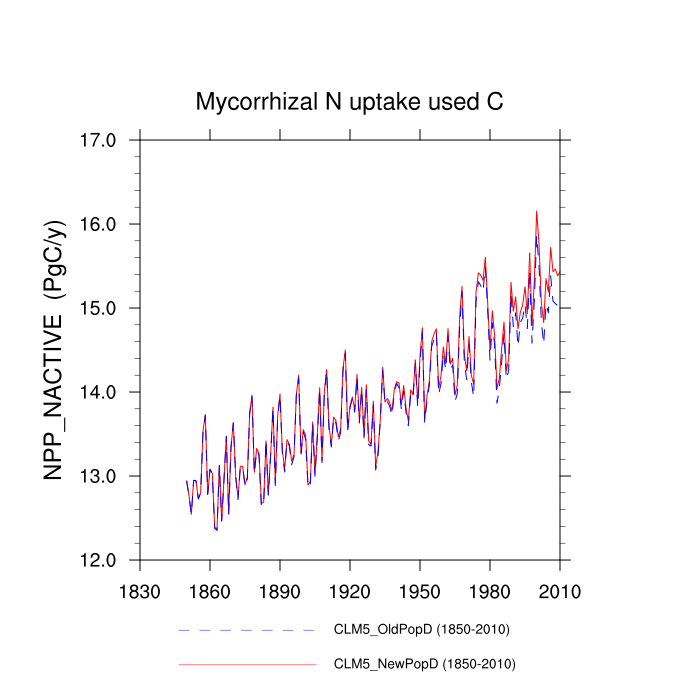
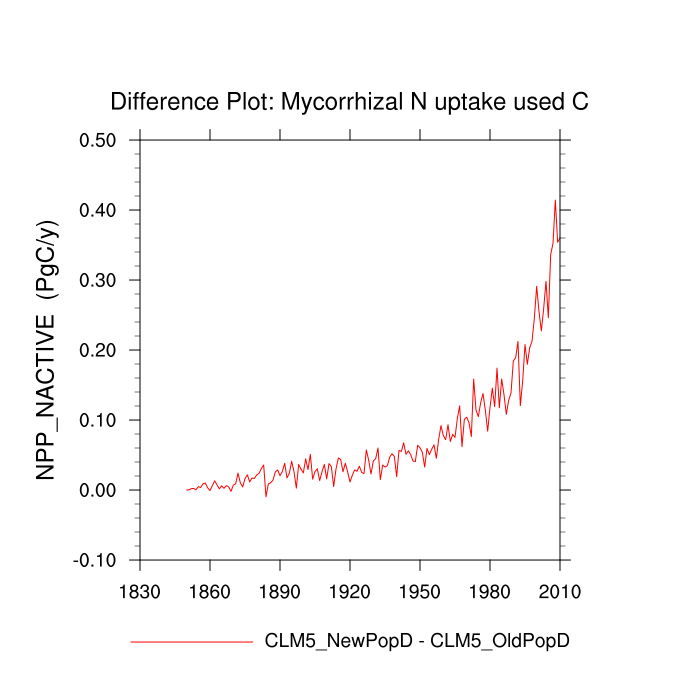
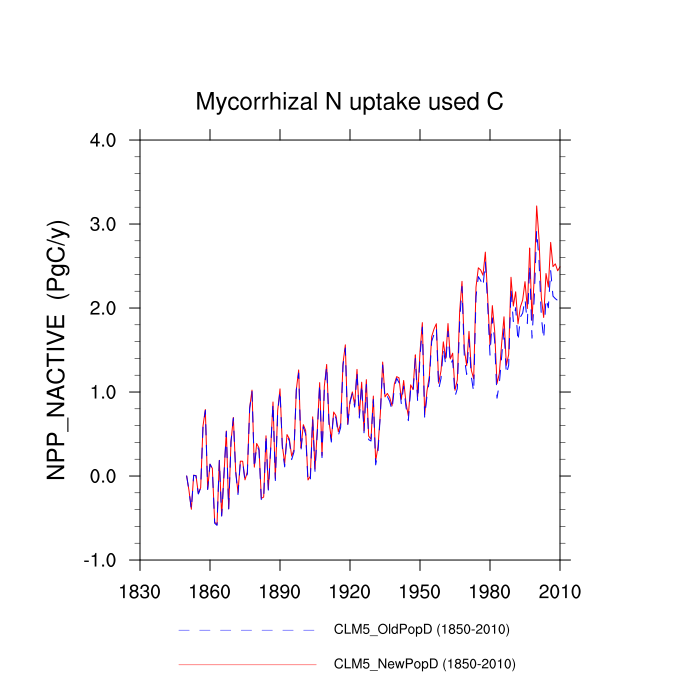
| Mycorrhizal N uptake used C (NPP_NACTIVE) | TrendPlot | DifferencePlot | AnomalyPlot | ||
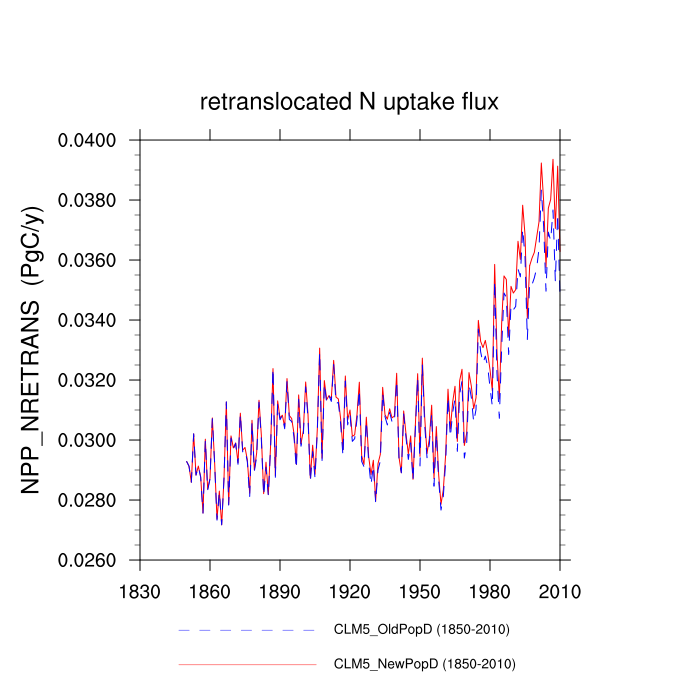
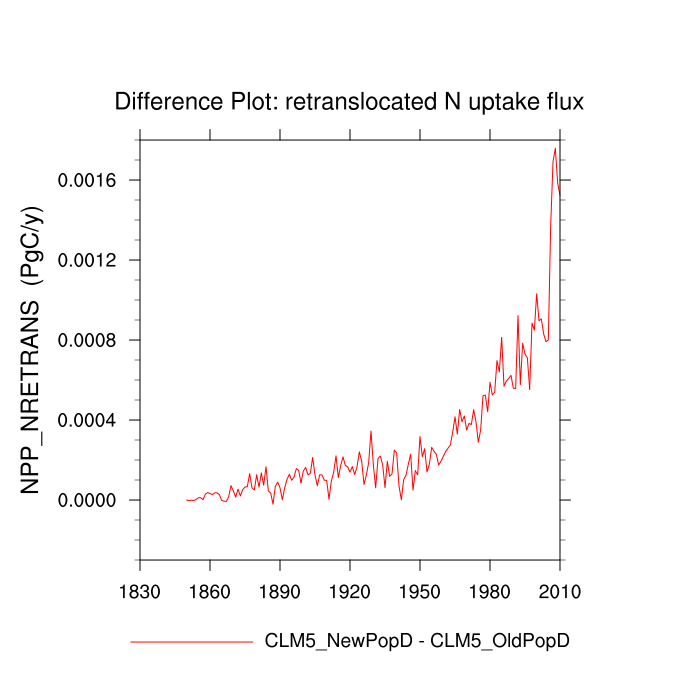
| retranslocated N uptake flux (NPP_NRETRANS) | TrendPlot | DifferencePlot | AnomalyPlot | ||
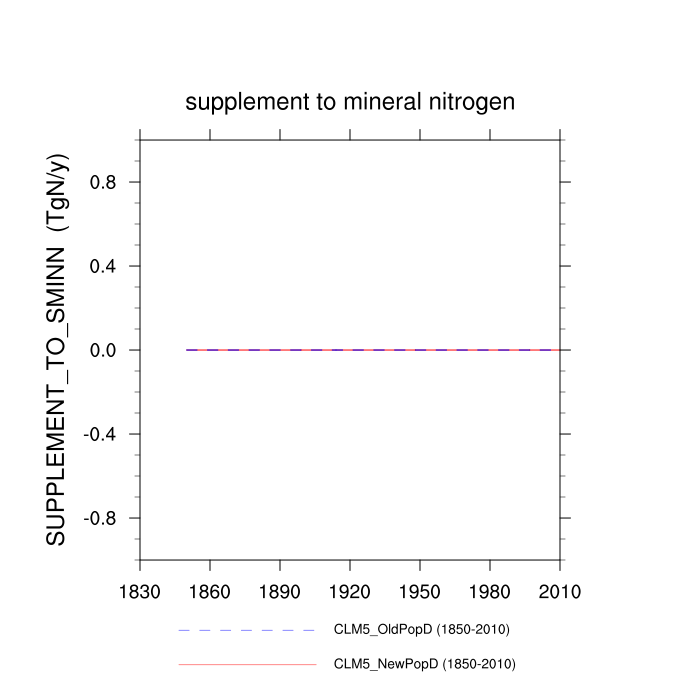
| supplement to mineral nitrogen (SUPPLEMENT_TO_SMINN) | TrendPlot | DifferencePlot | AnomalyPlot | ||
| Nitrogen Leached (SMINN_LEACHED) | --- | --- | --- | ||
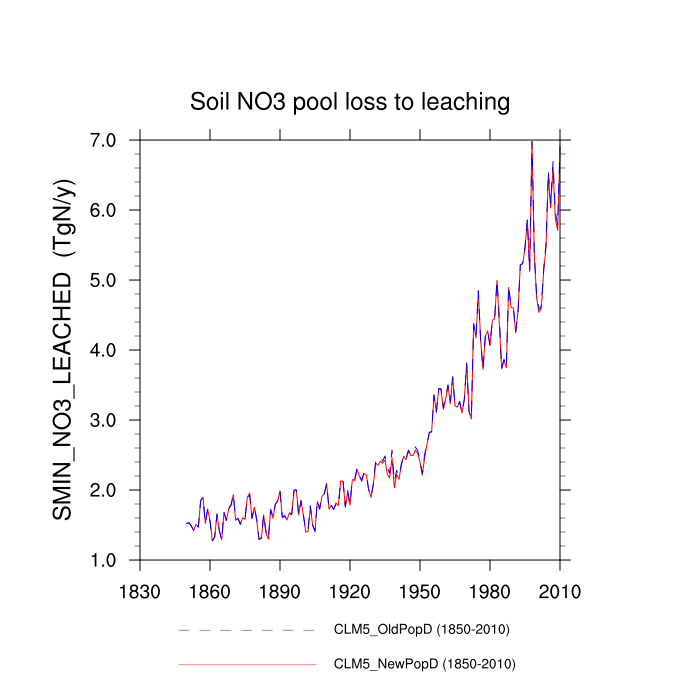
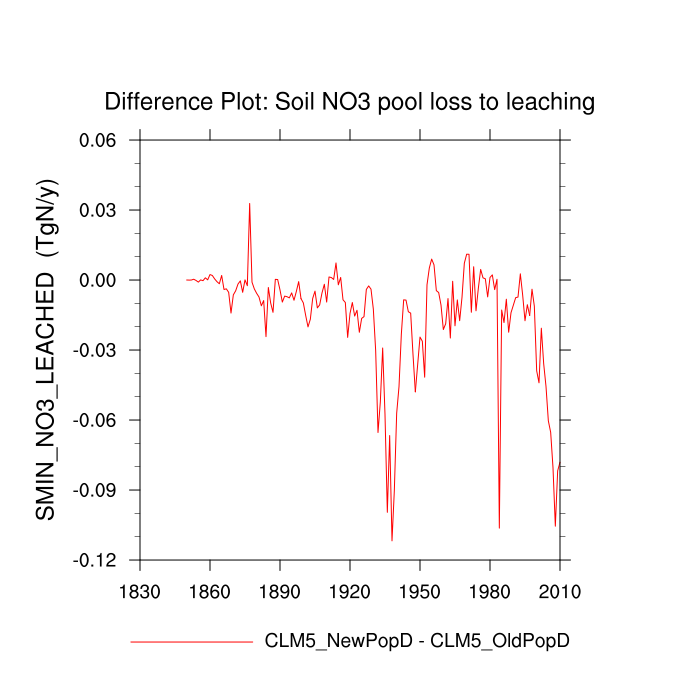
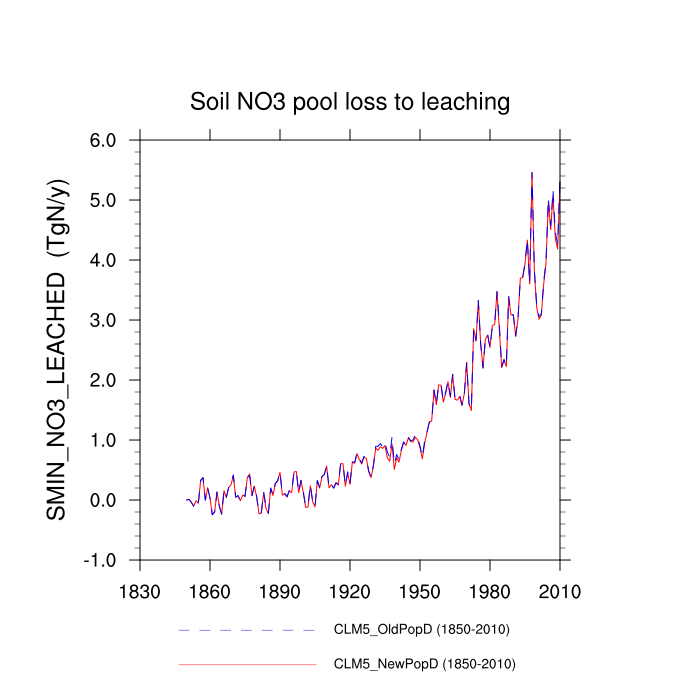
| Soil NO3 pool loss to leaching (SMIN_NO3_LEACHED) | TrendPlot | DifferencePlot | AnomalyPlot | ||
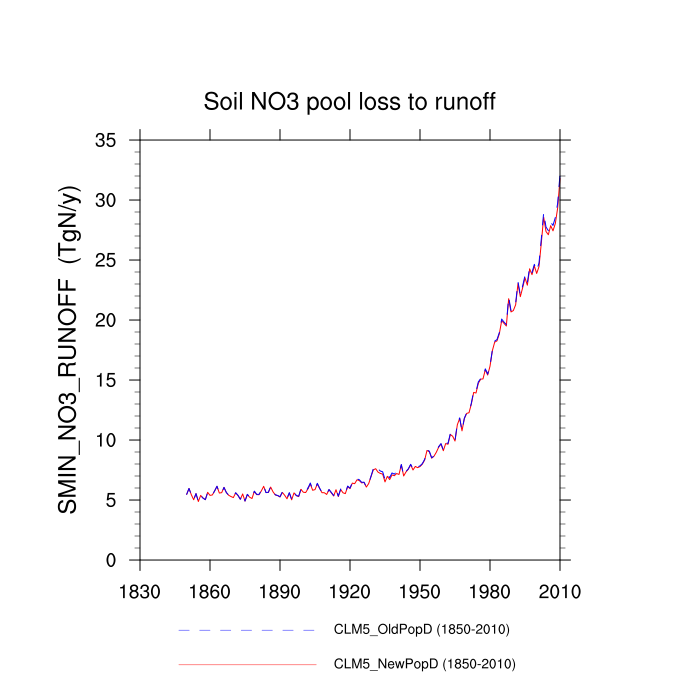
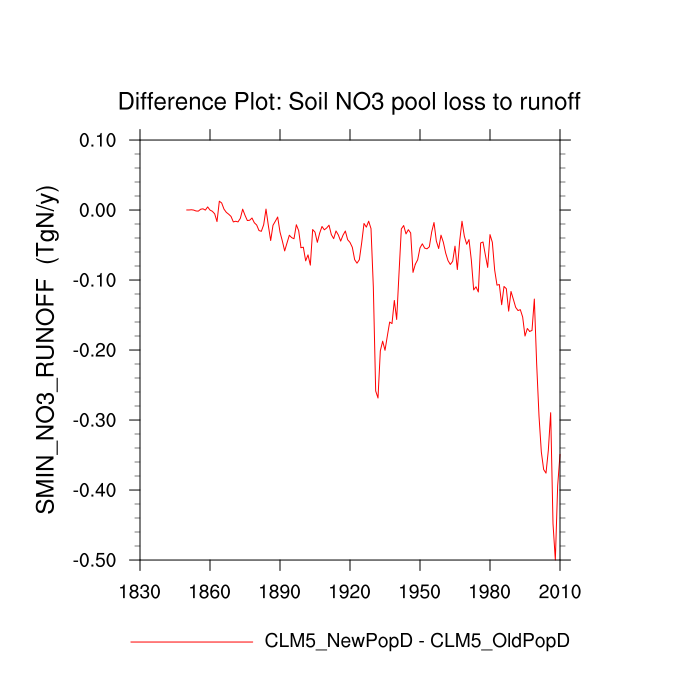
| Soil NO3 pool loss to runoff (SMIN_NO3_RUNOFF) | TrendPlot | DifferencePlot | AnomalyPlot | ||
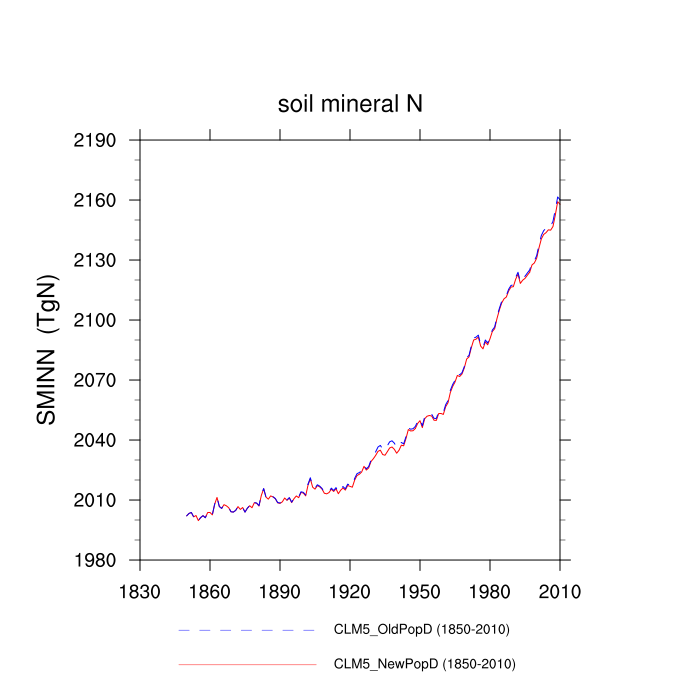
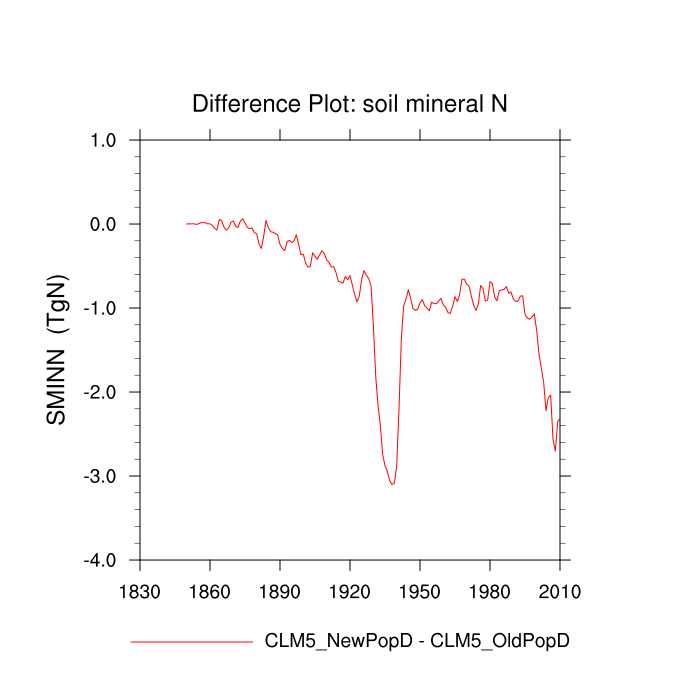
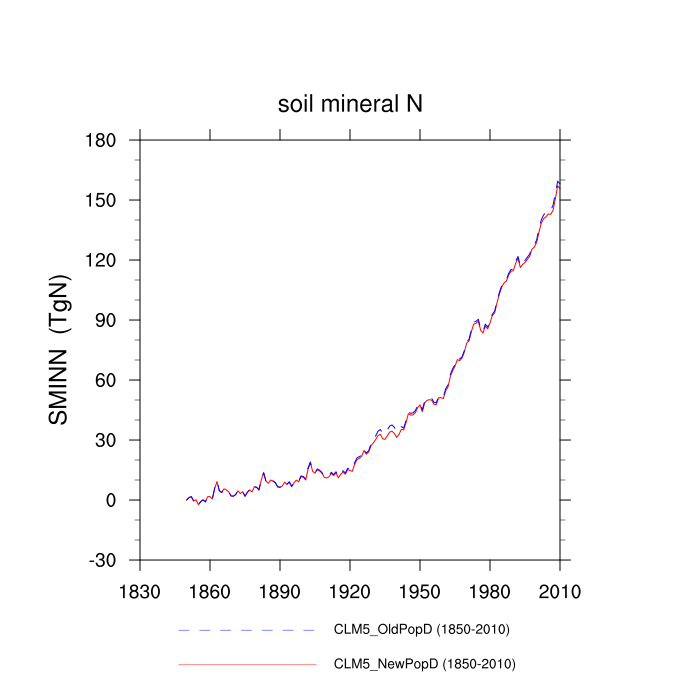
| soil mineral N (SMINN) | TrendPlot | DifferencePlot | AnomalyPlot | ||
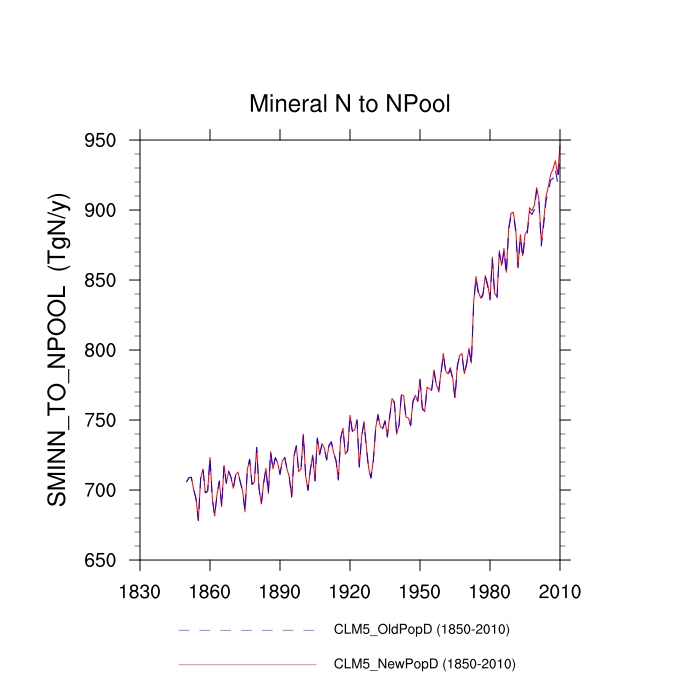
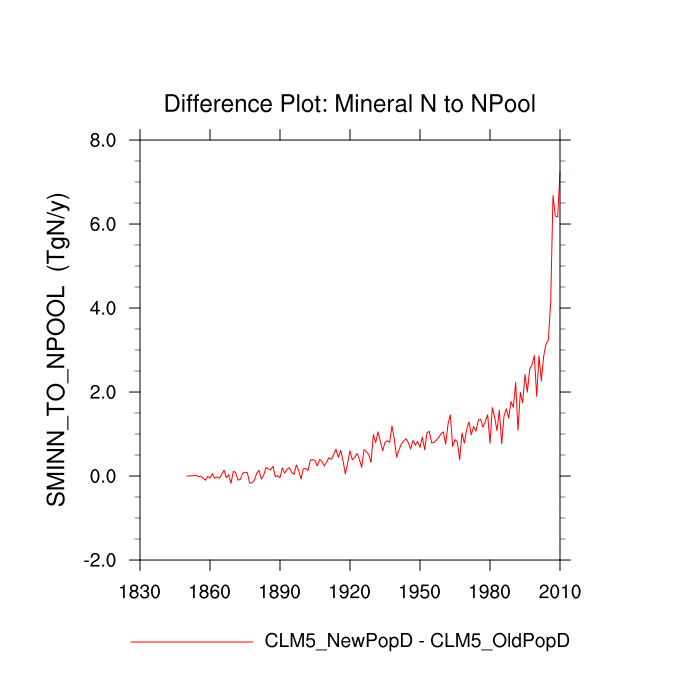
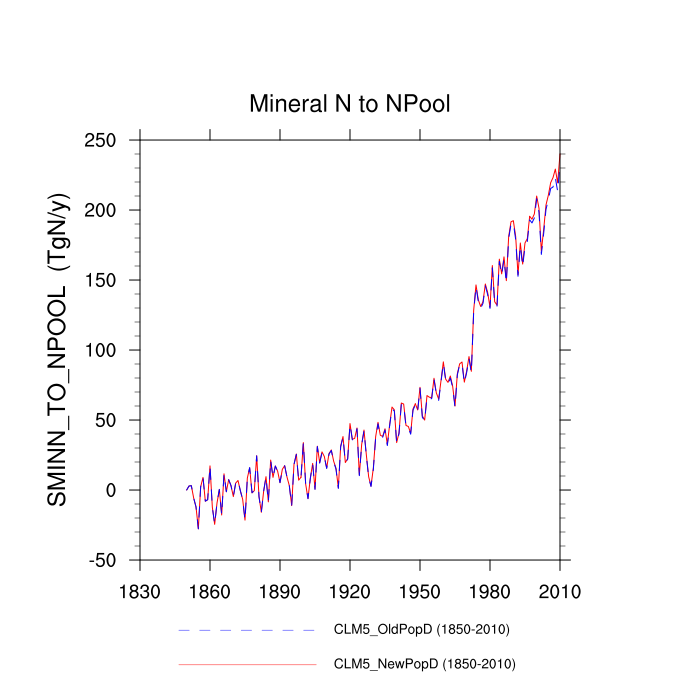
| Mineral N to NPool (SMINN_TO_NPOOL) | TrendPlot | DifferencePlot | AnomalyPlot | ||
| column-level sink for N truncation (COL_NTRUNC) | --- | --- | --- | ||
| pft-level sink for N truncation (PFT_NTRUNC) | --- | --- | --- | ||
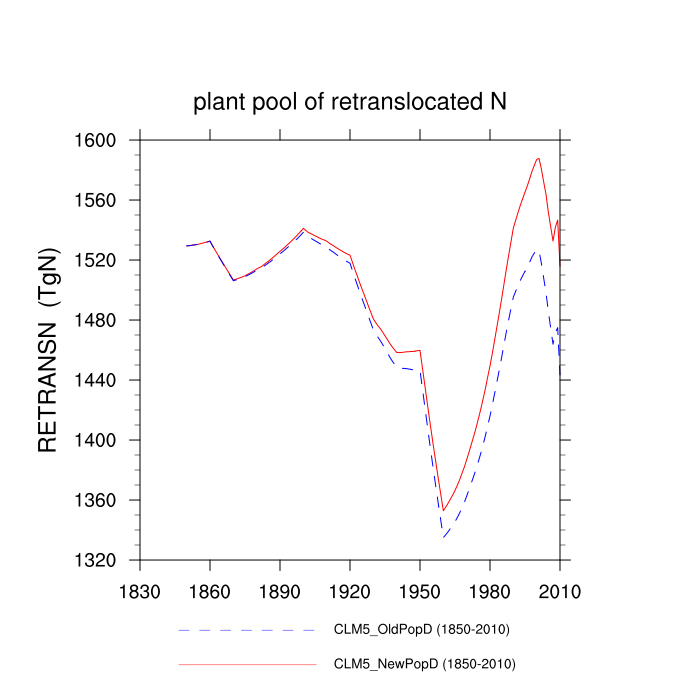
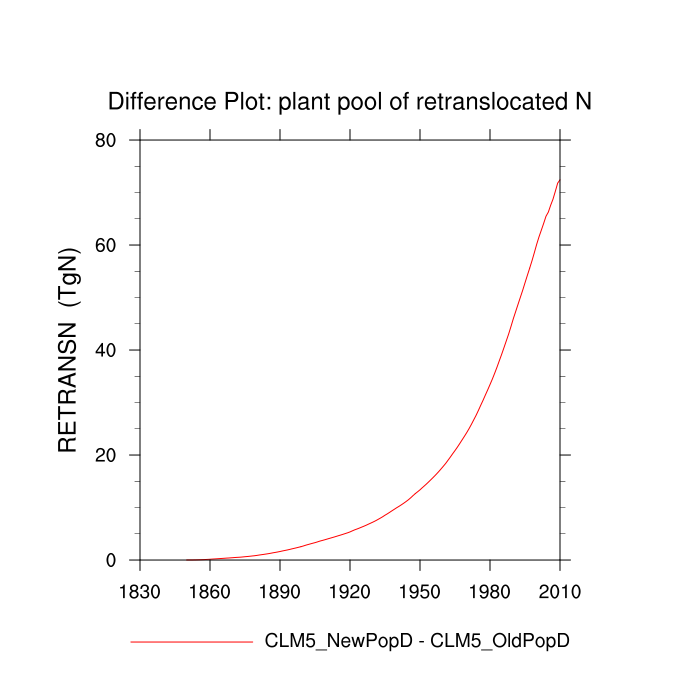
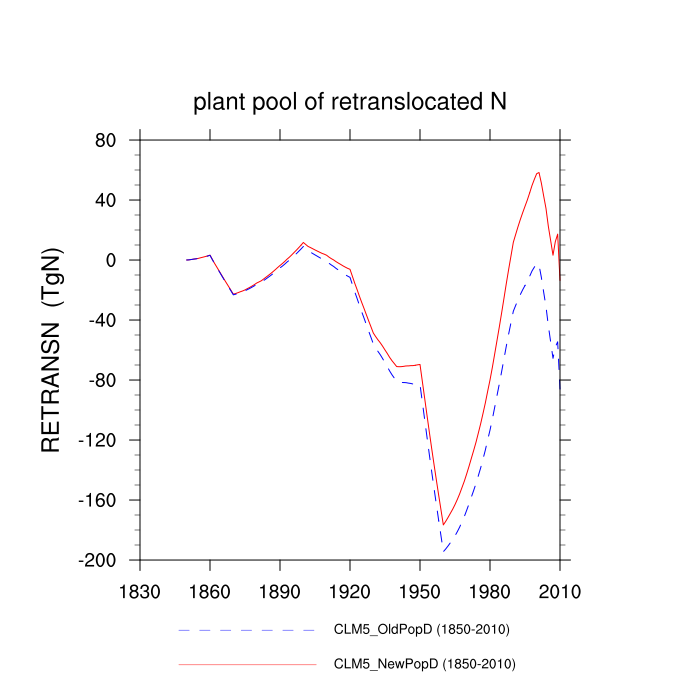
| plant pool of retranslocated N (RETRANSN) | TrendPlot | DifferencePlot | AnomalyPlot | ||
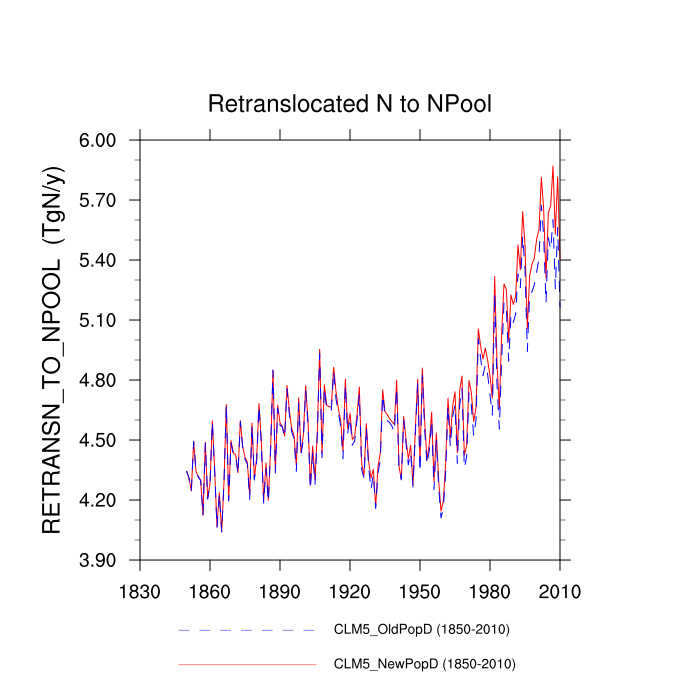
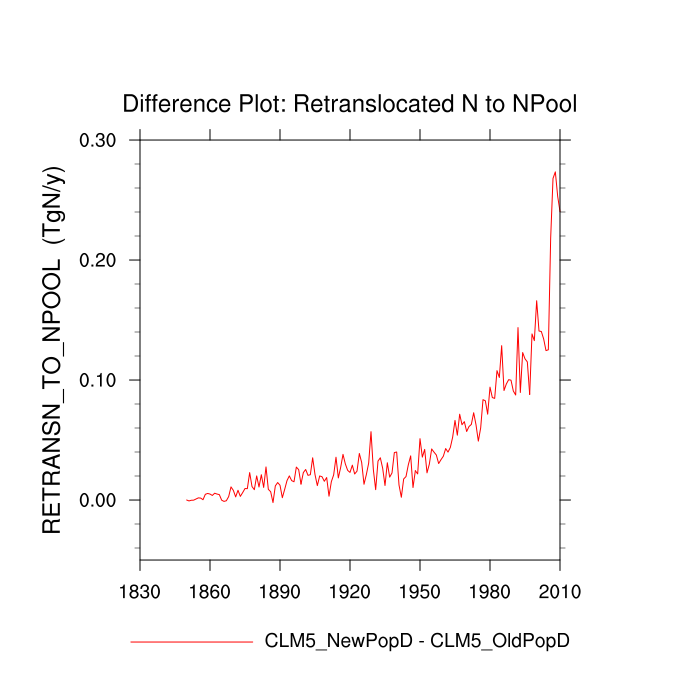
| Retranslocated N to NPool (RETRANSN_TO_NPOOL) | TrendPlot | DifferencePlot | AnomalyPlot | ||
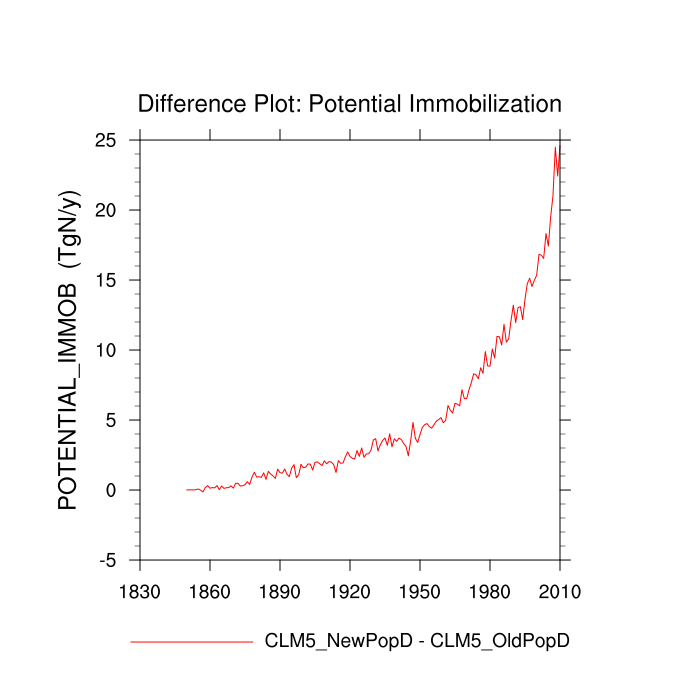
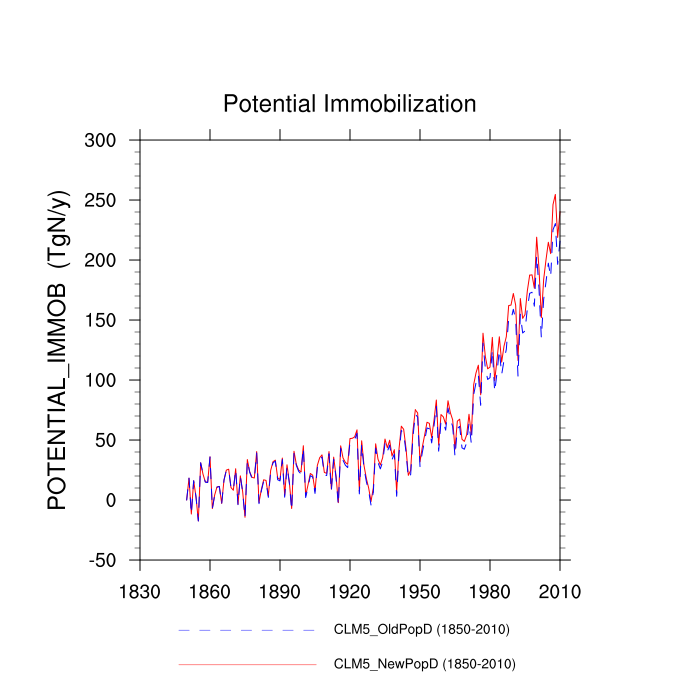
| Potential Immobilization (POTENTIAL_IMMOB) | TrendPlot | DifferencePlot | AnomalyPlot | ||
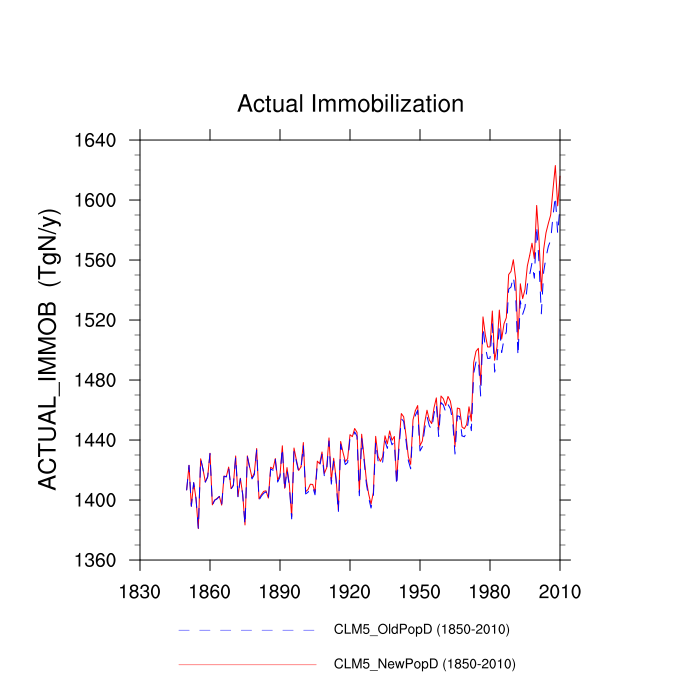
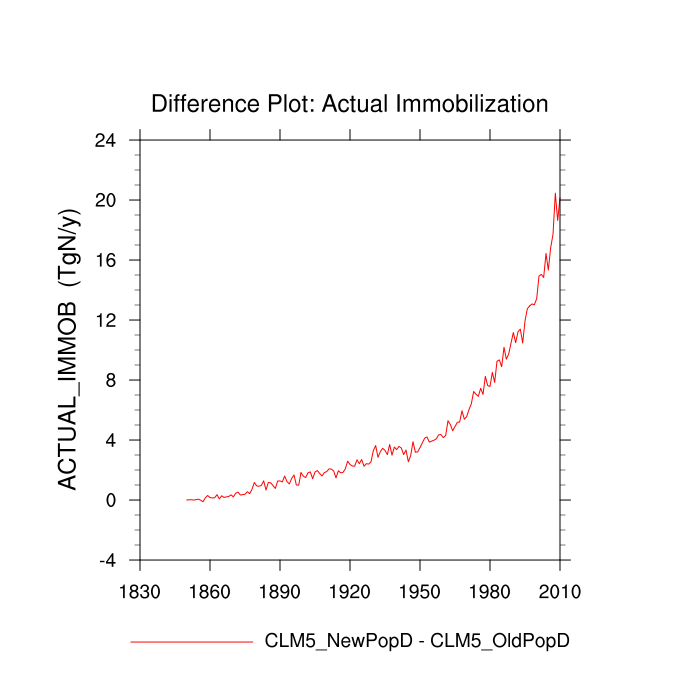
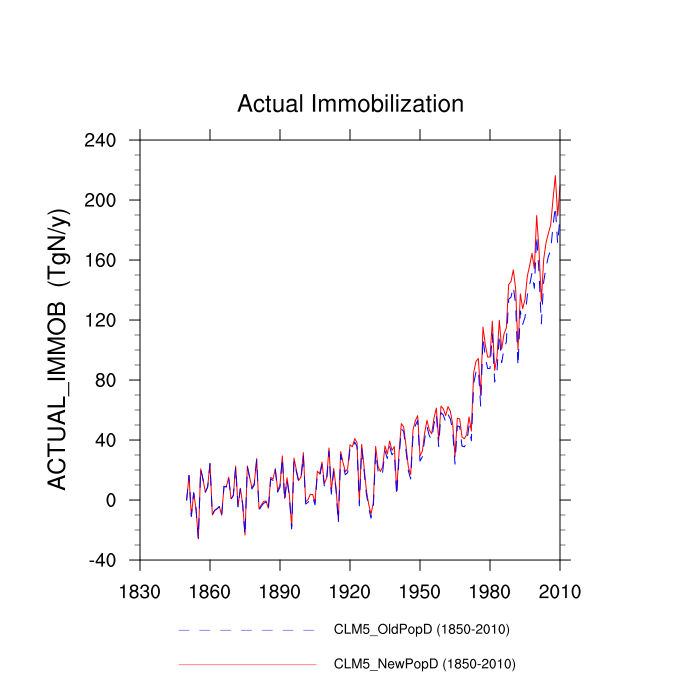
| Actual Immobilization (ACTUAL_IMMOB) | TrendPlot | DifferencePlot | AnomalyPlot | ||
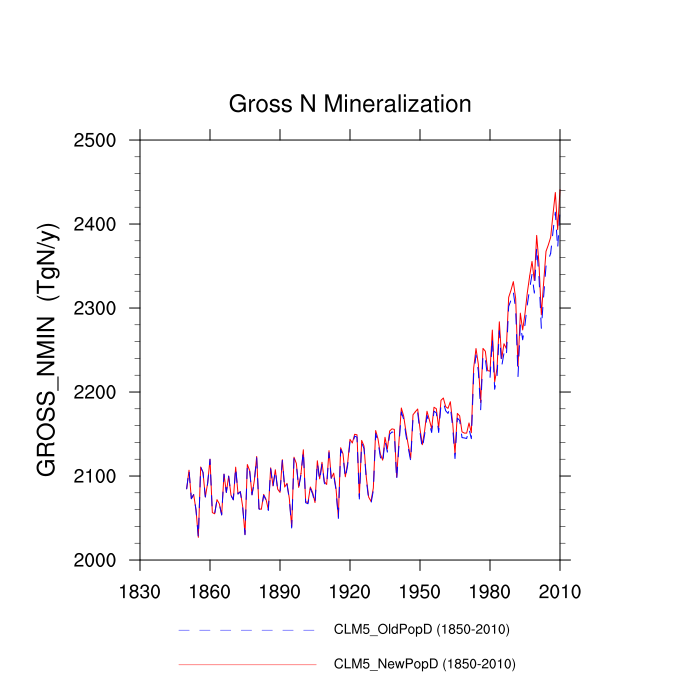
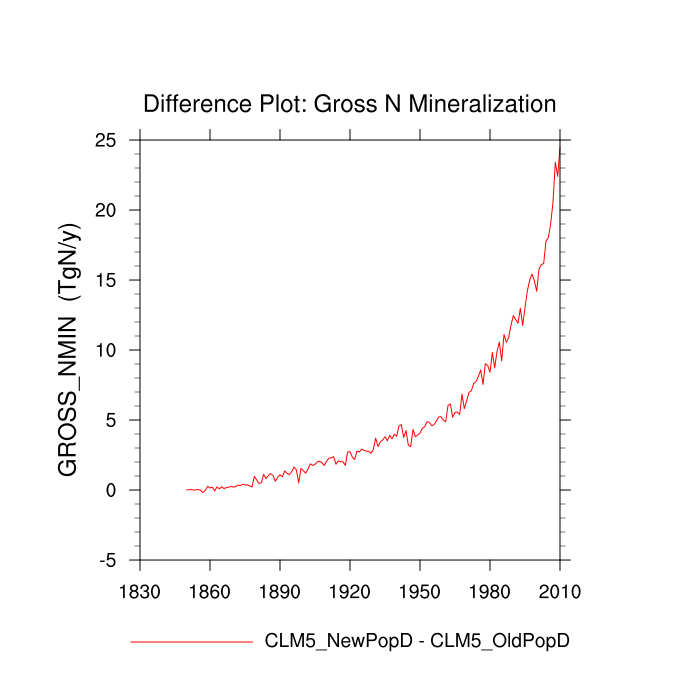
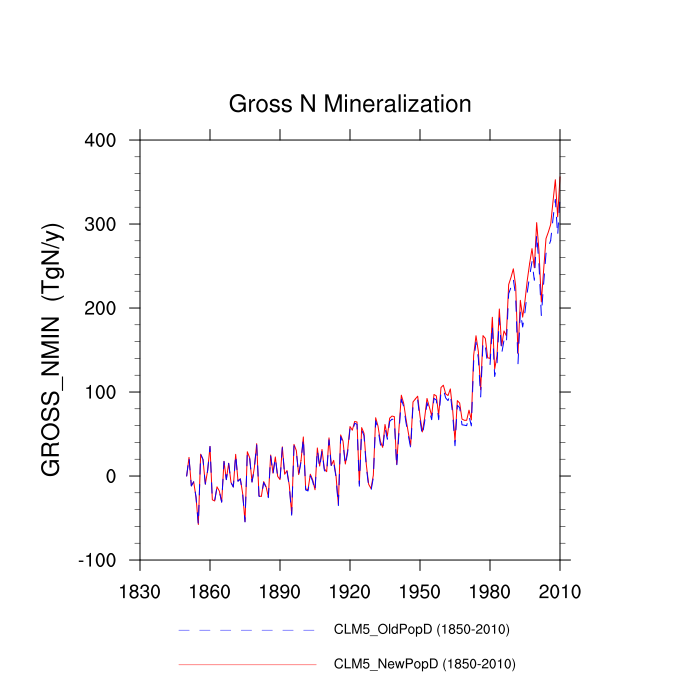
| Gross N Mineralization (GROSS_NMIN) | TrendPlot | DifferencePlot | AnomalyPlot | ||
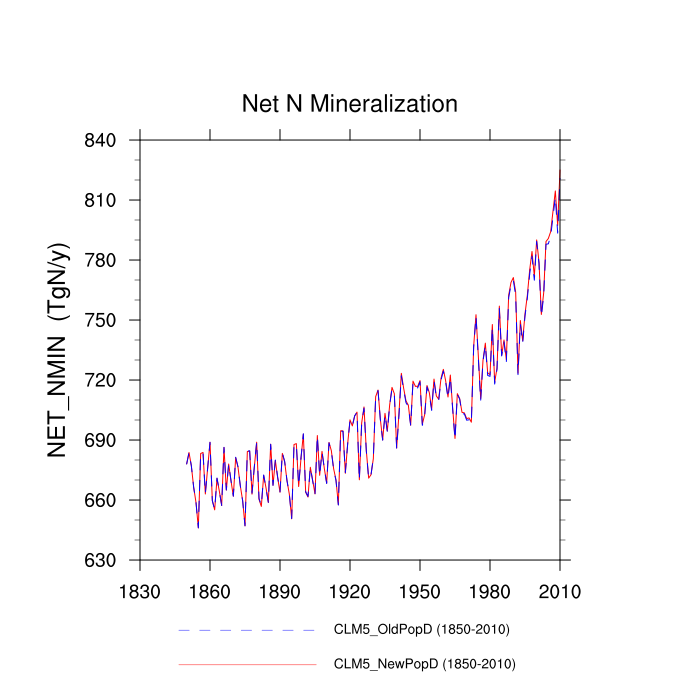
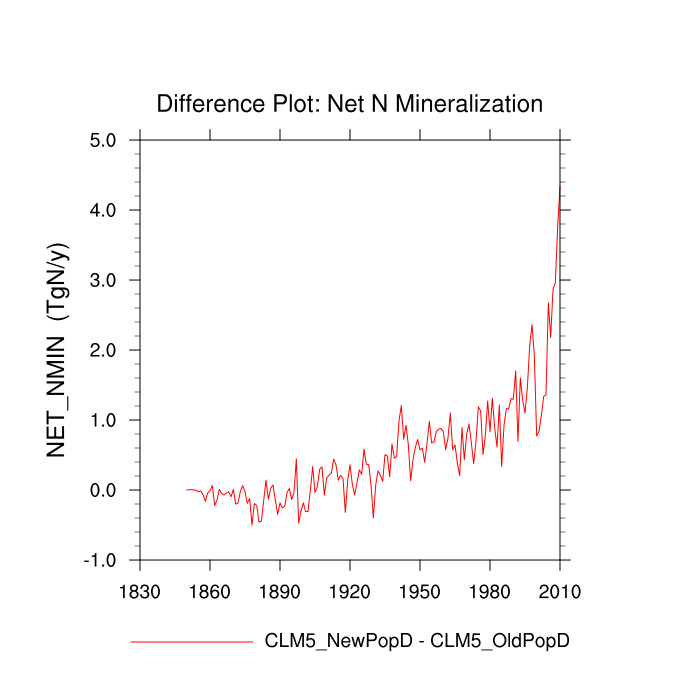
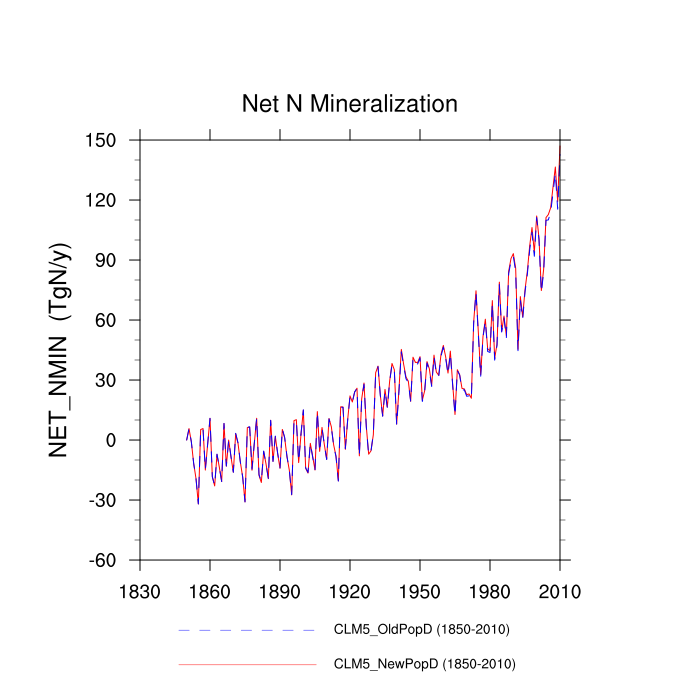
| Net N Mineralization (NET_NMIN) | TrendPlot | DifferencePlot | AnomalyPlot | ||
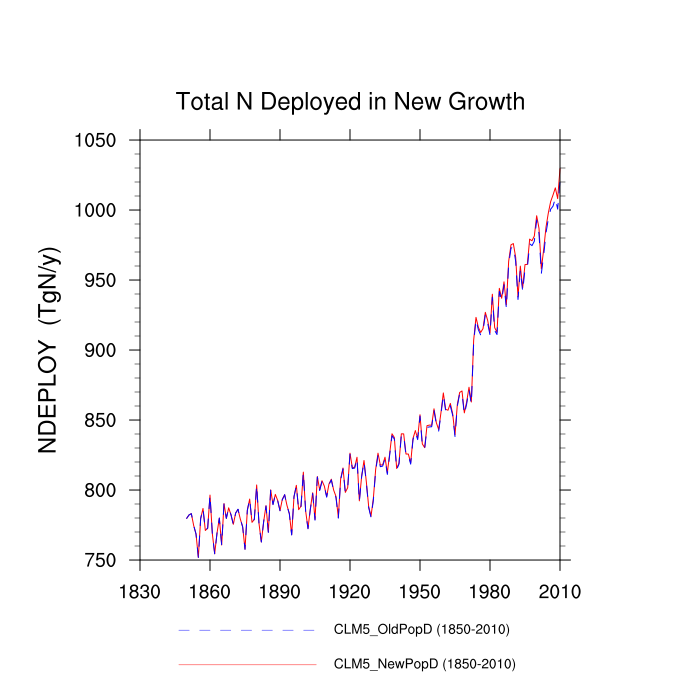
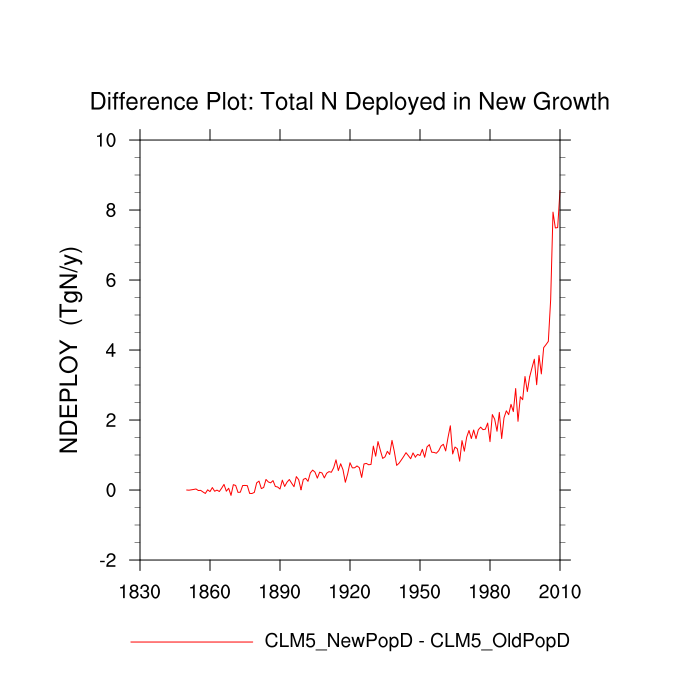
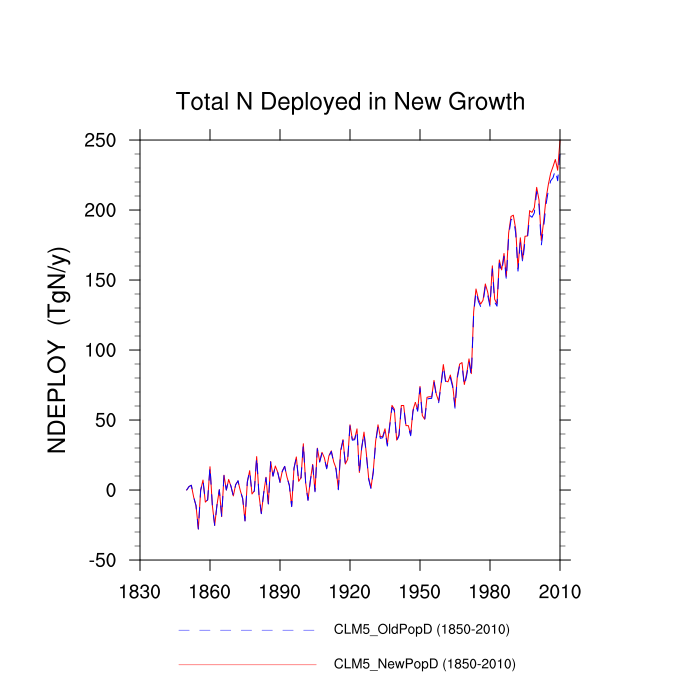
| Total N Deployed in New Growth (NDEPLOY) | TrendPlot | DifferencePlot | AnomalyPlot | ||
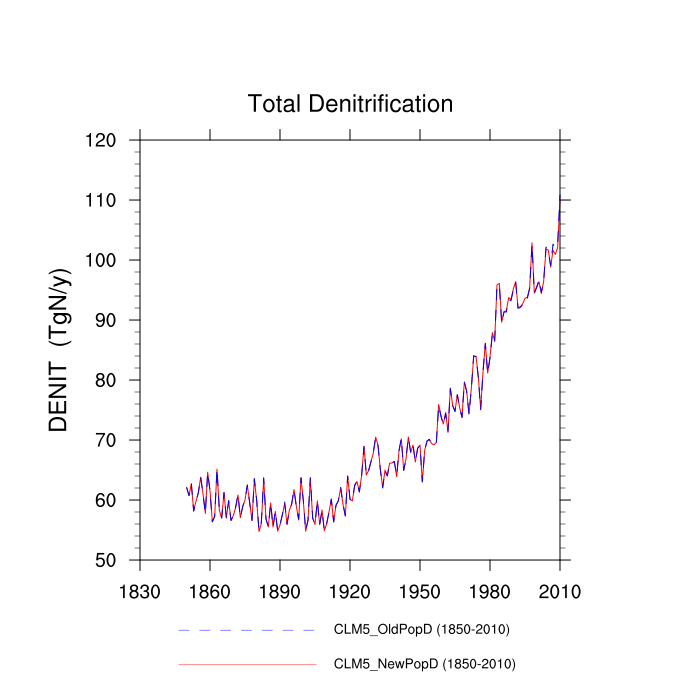
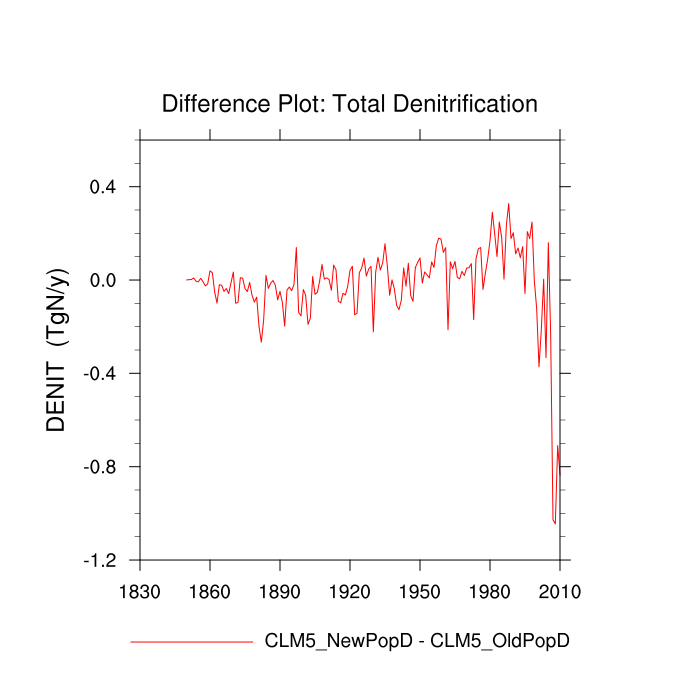
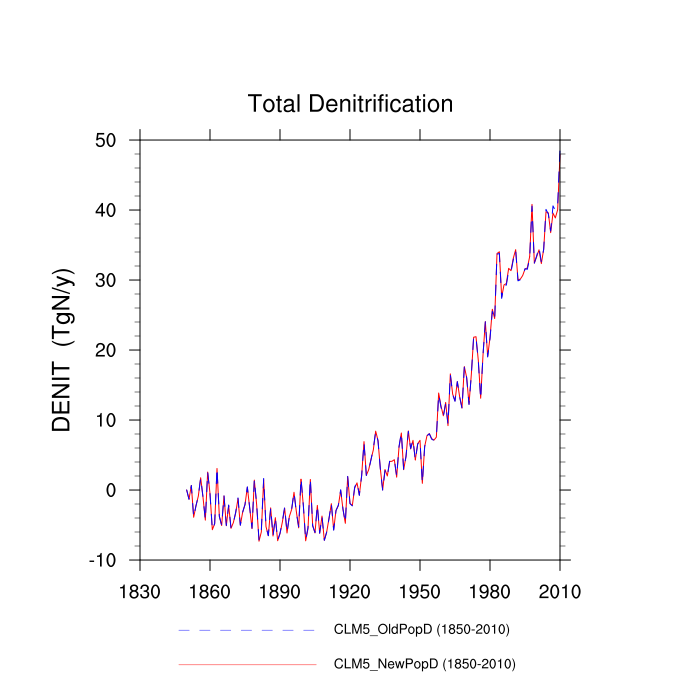
| Total Denitrification (DENIT) | TrendPlot | DifferencePlot | AnomalyPlot | ||
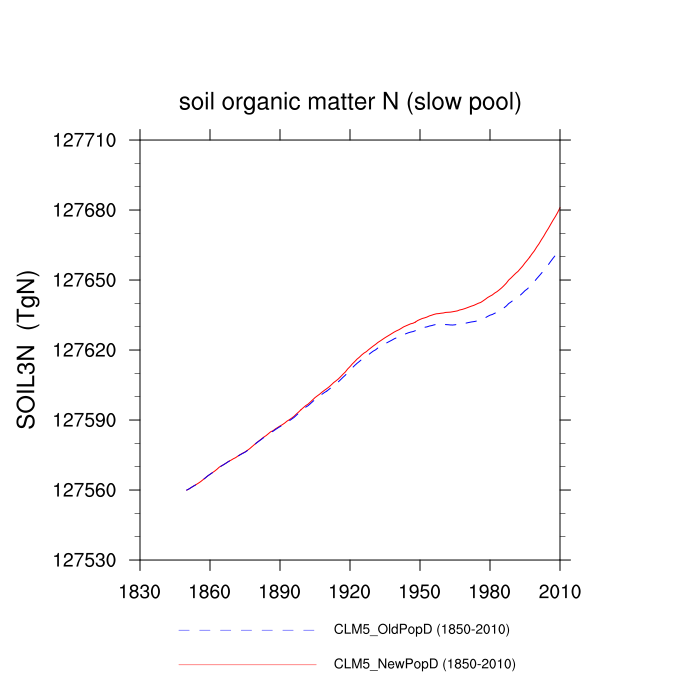
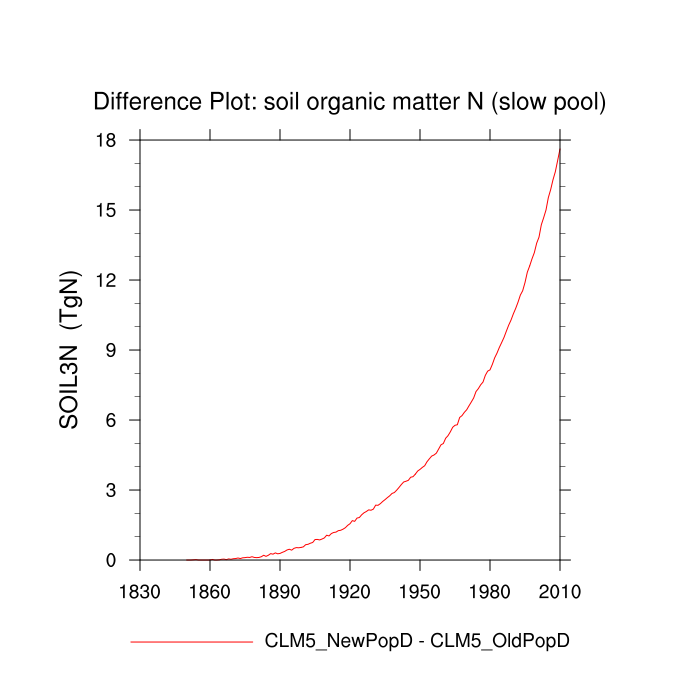
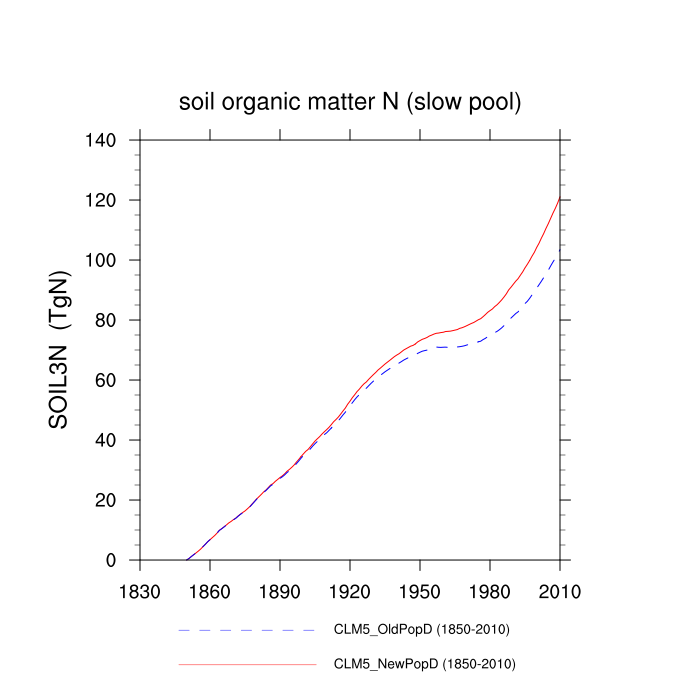
| soil organic matter N (slow pool) (SOIL3N) | TrendPlot | DifferencePlot | AnomalyPlot | ||
| Soil organic matter N (slowest pool) (SOIL4N) | --- | --- | --- | ||
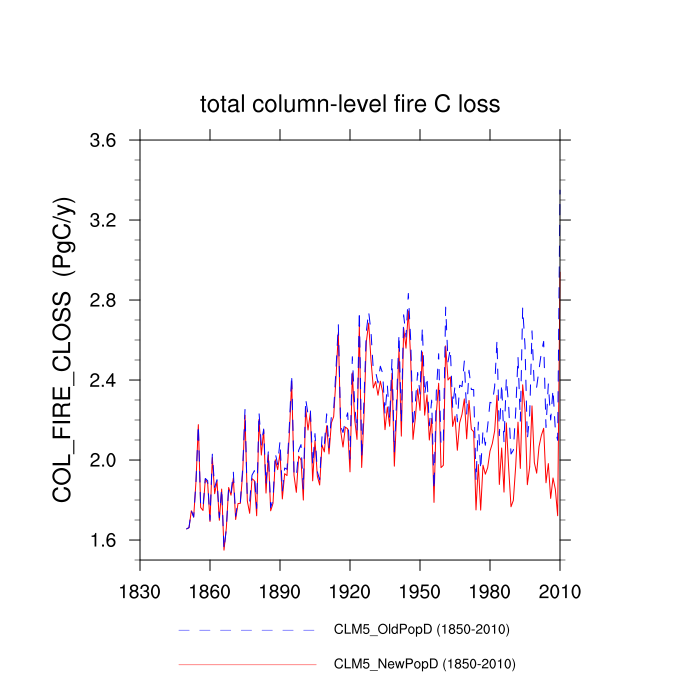
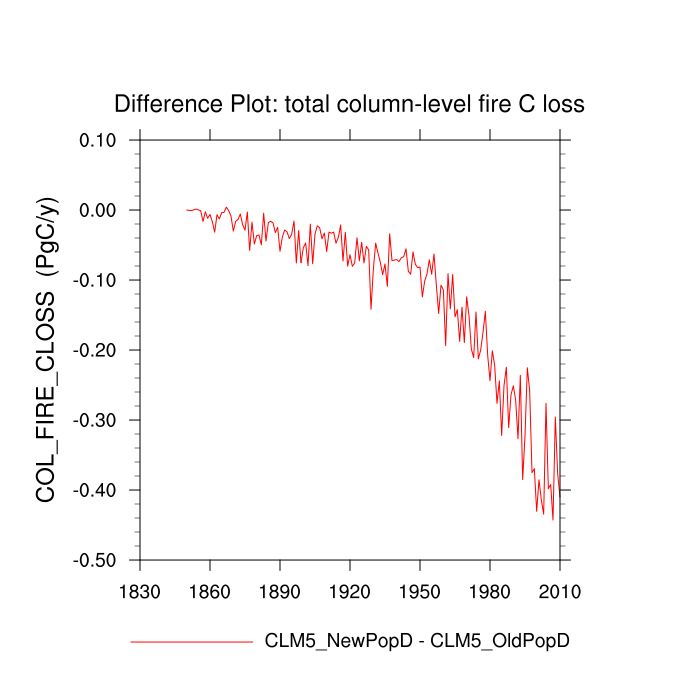
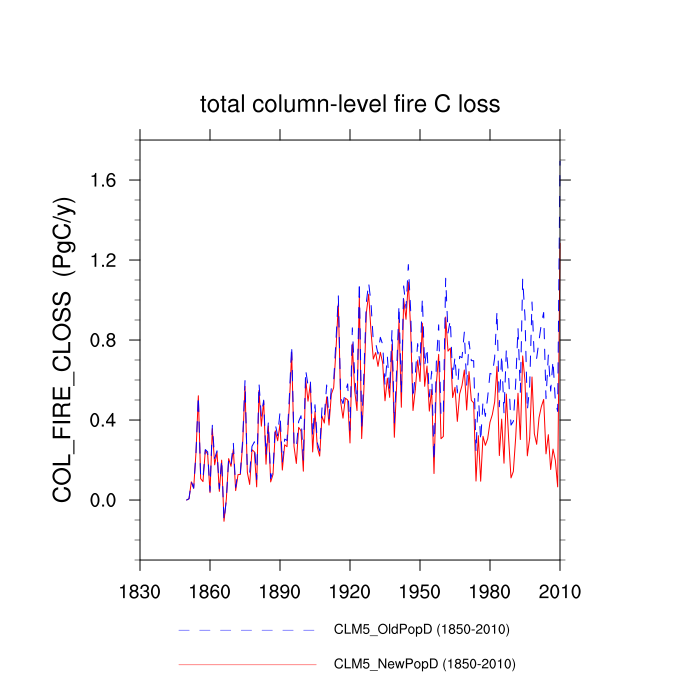
| total column-level fire C loss (COL_FIRE_CLOSS) | TrendPlot | DifferencePlot | AnomalyPlot | ||
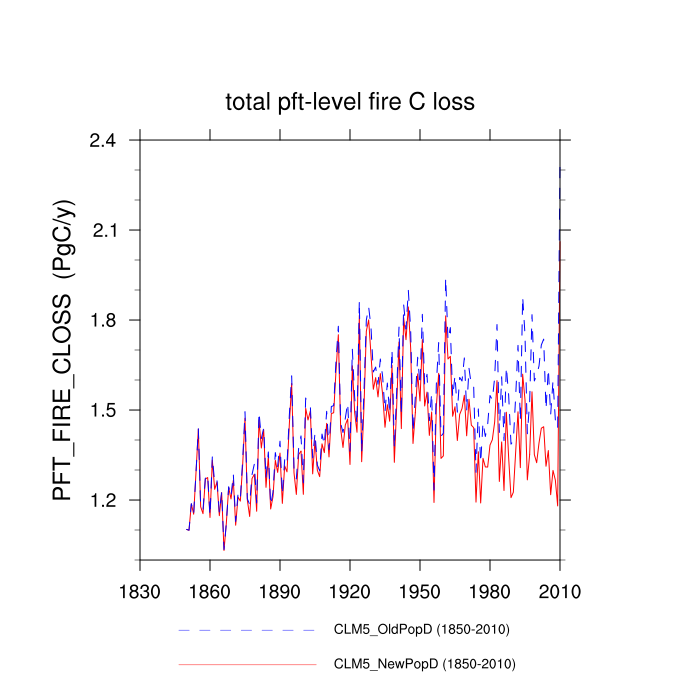
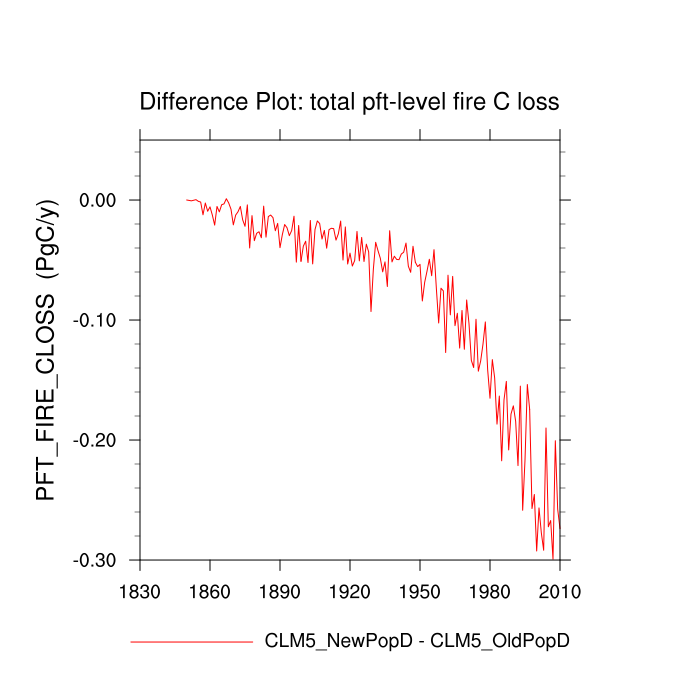
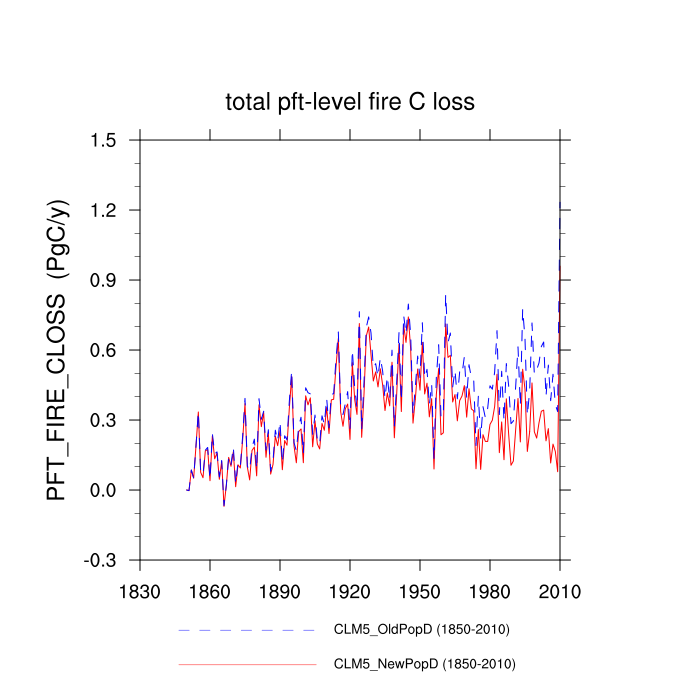
| total pft-level fire C loss (PFT_FIRE_CLOSS) | TrendPlot | DifferencePlot | AnomalyPlot | ||
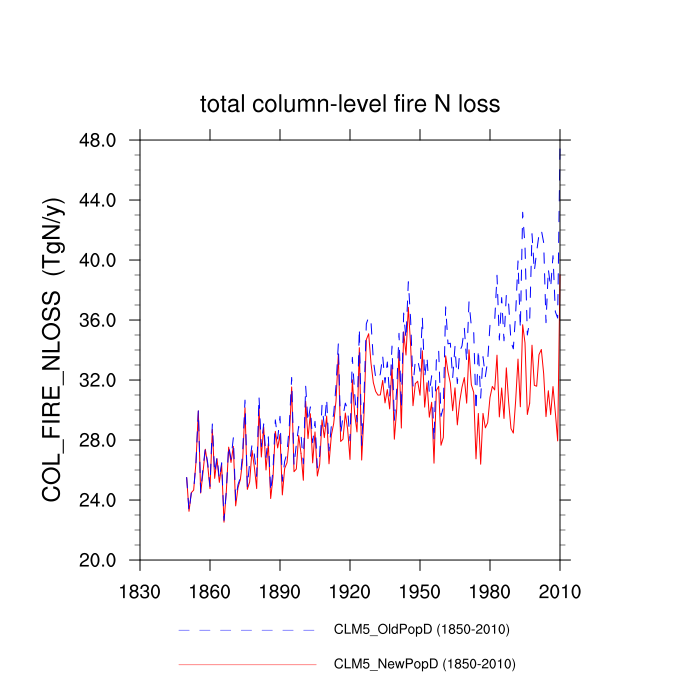
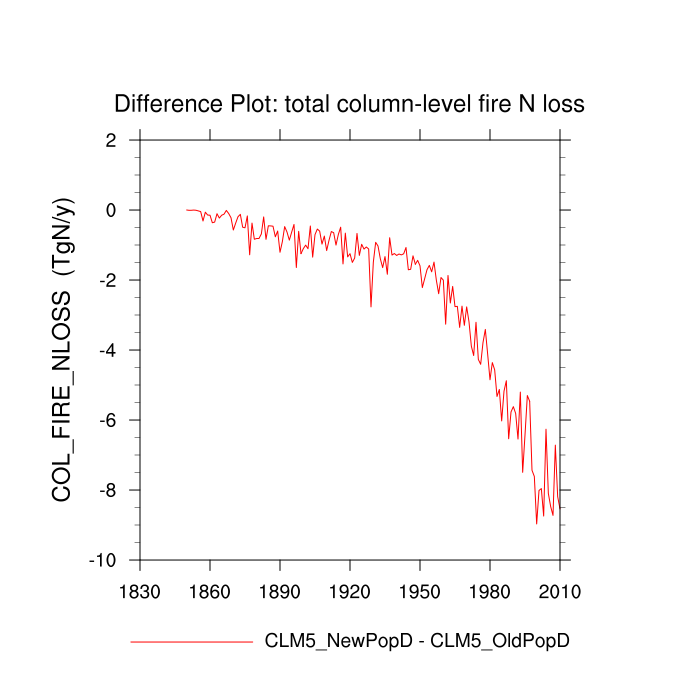
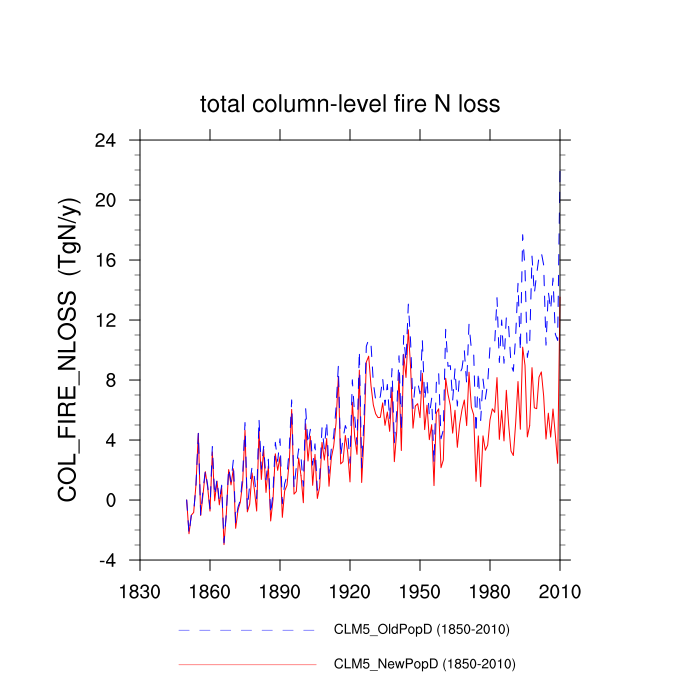
| total column-level fire N loss (COL_FIRE_NLOSS) | TrendPlot | DifferencePlot | AnomalyPlot | ||
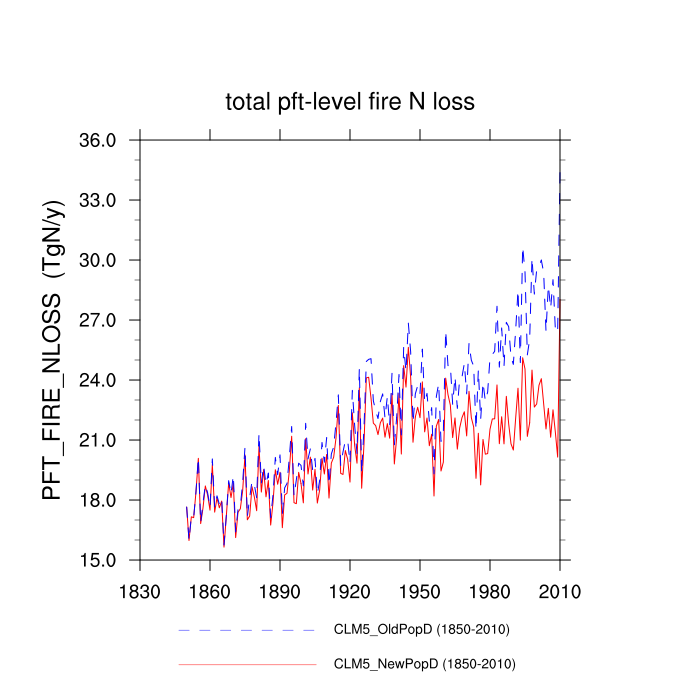
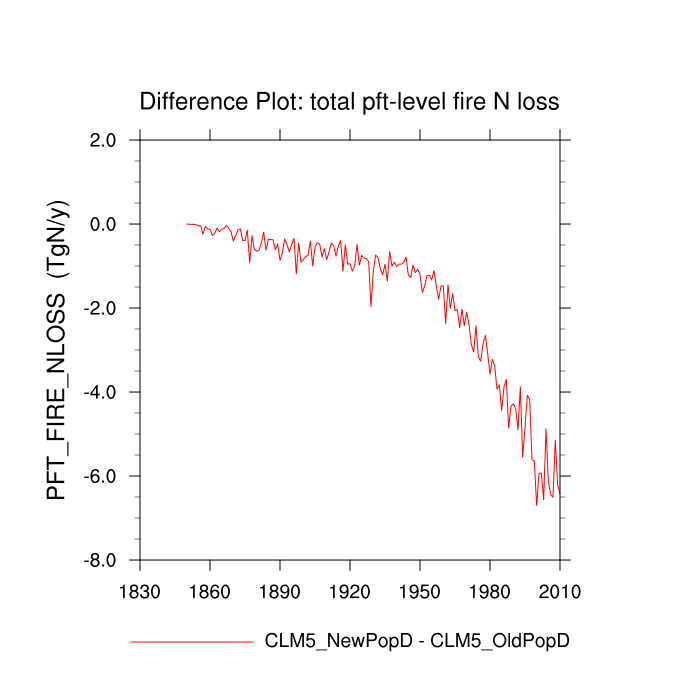
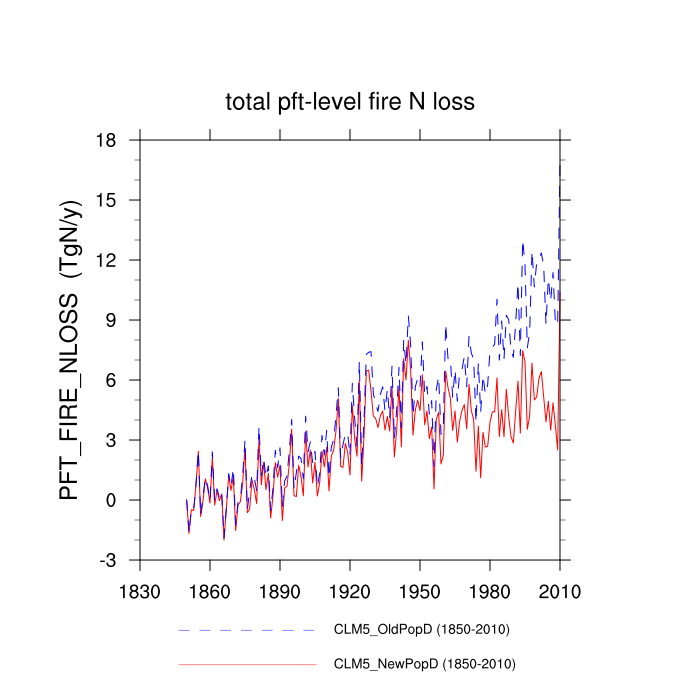
| total pft-level fire N loss (PFT_FIRE_NLOSS) | TrendPlot | DifferencePlot | AnomalyPlot | ||
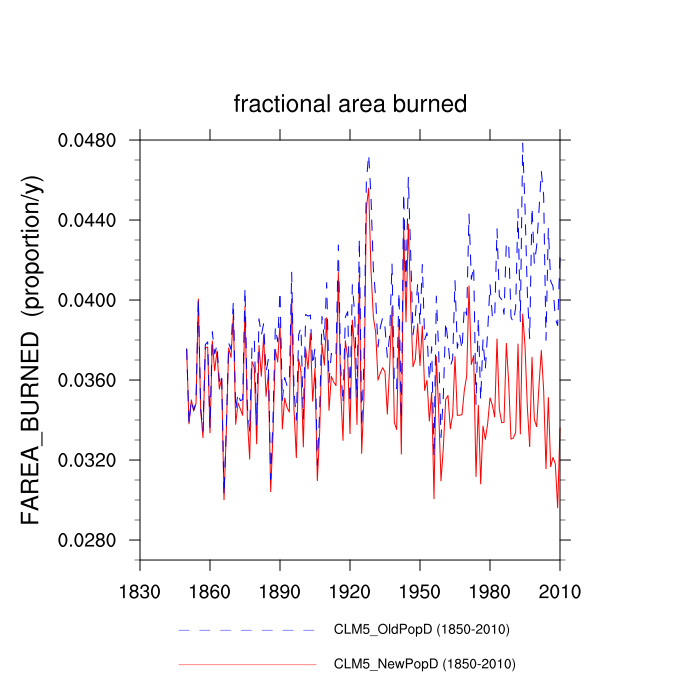
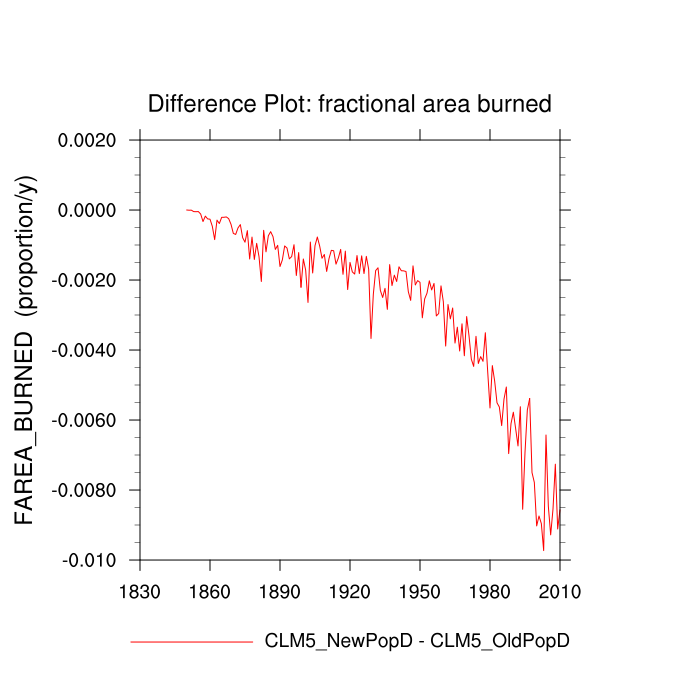
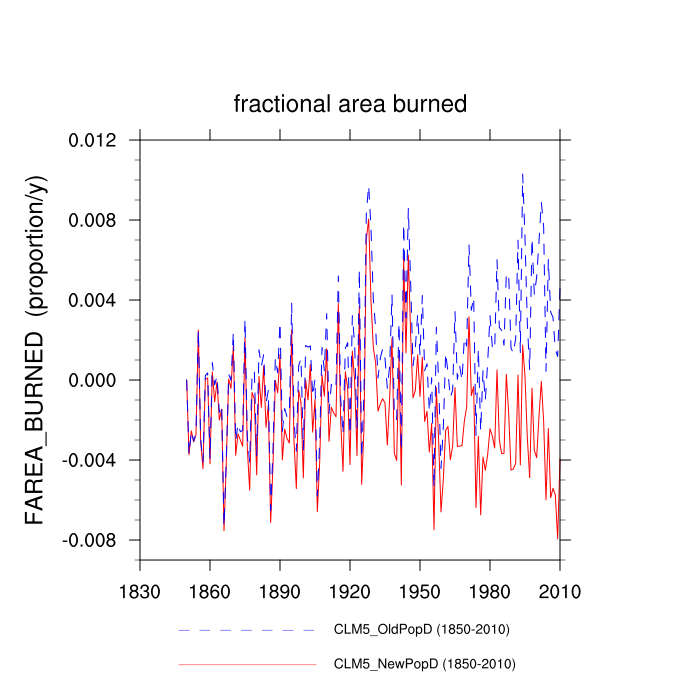
| fractional area burned (FAREA_BURNED) | TrendPlot | DifferencePlot | AnomalyPlot | ||
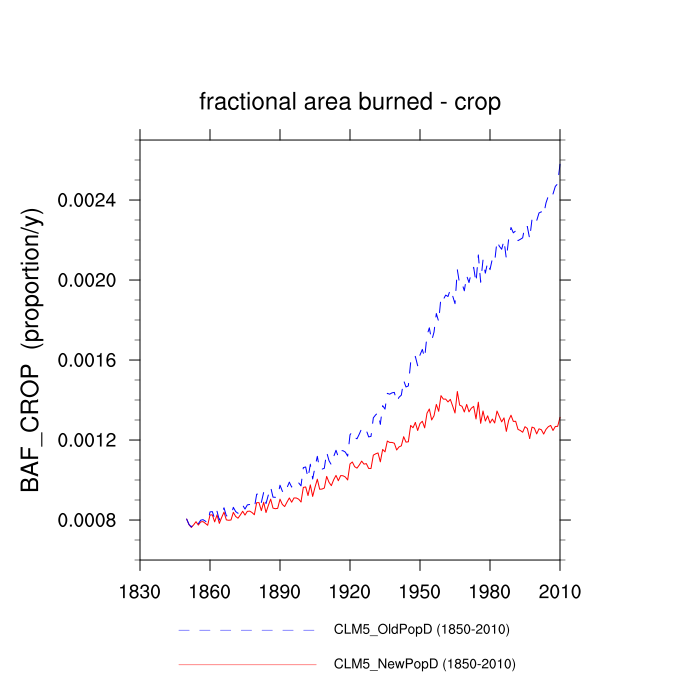
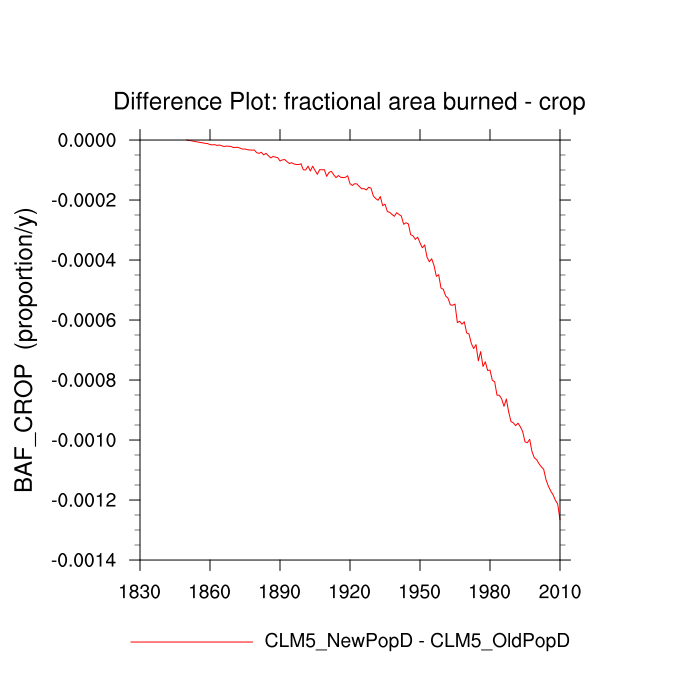
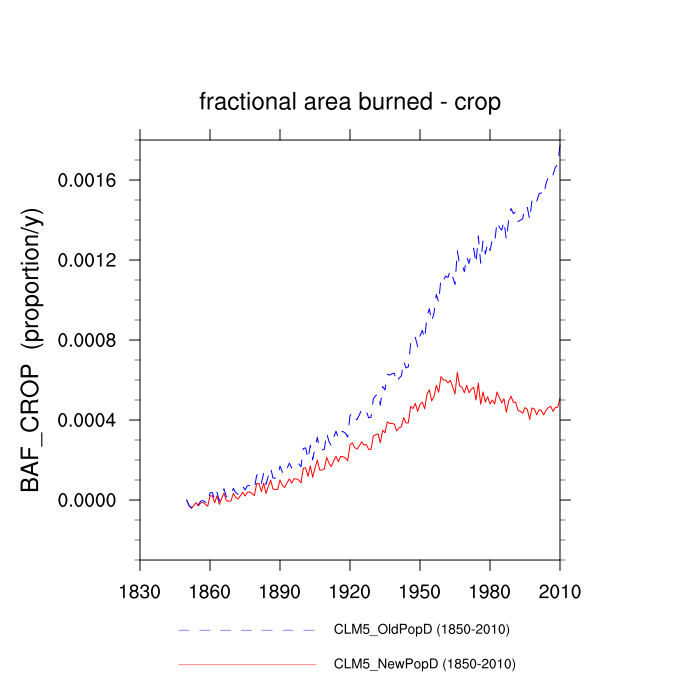
| fractional area burned - crop (BAF_CROP) | TrendPlot | DifferencePlot | AnomalyPlot | ||
| Coarse Woody Debris C Hetereotrophic respiration (CWDC_HR) | --- | --- | --- | ||
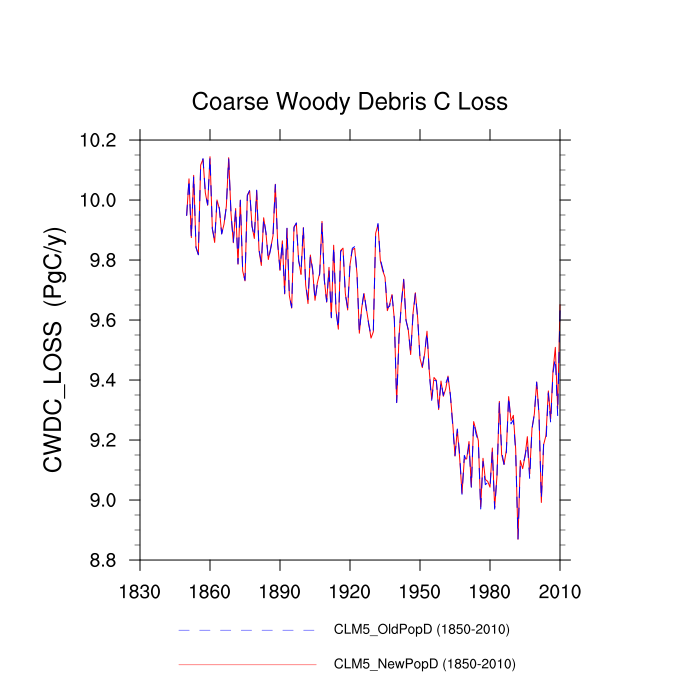
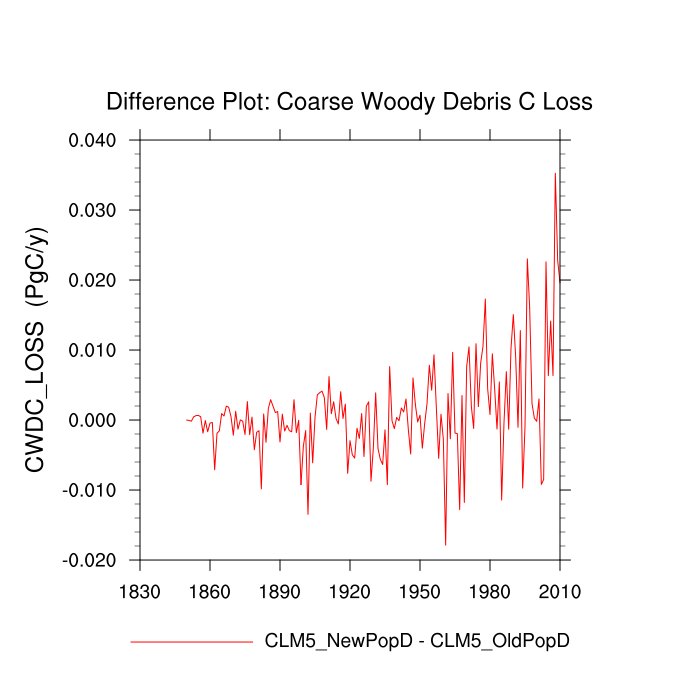
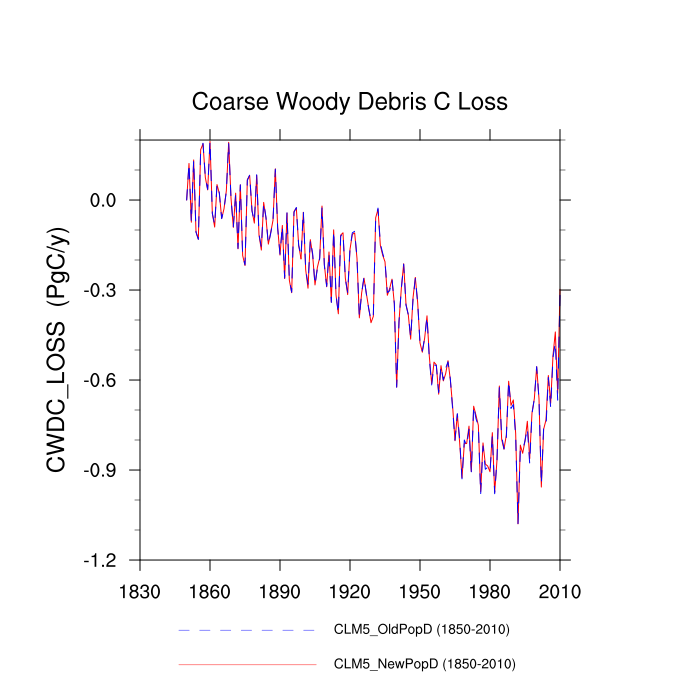
| Coarse Woody Debris C Loss (CWDC_LOSS) | TrendPlot | DifferencePlot | AnomalyPlot | ||
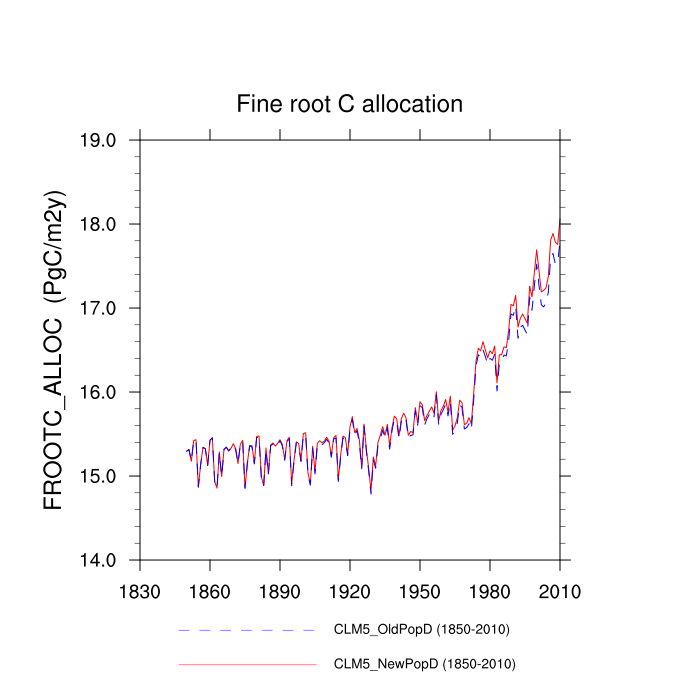
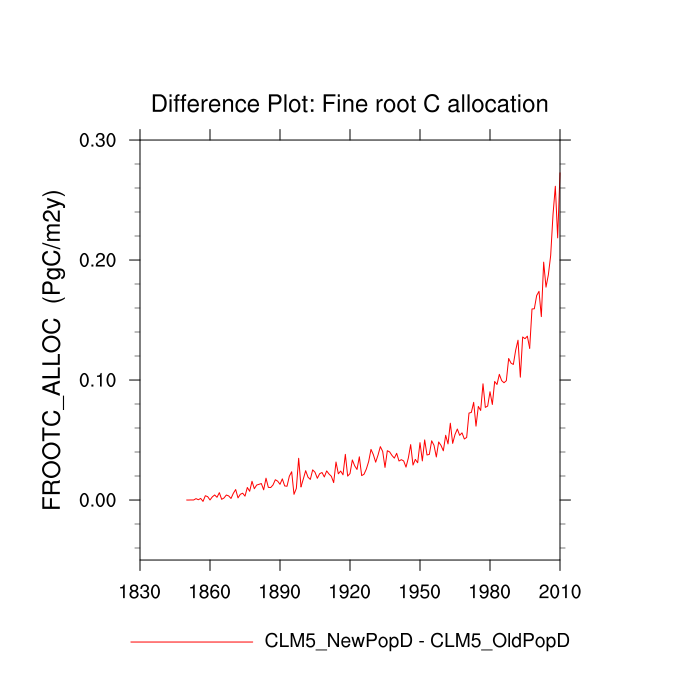
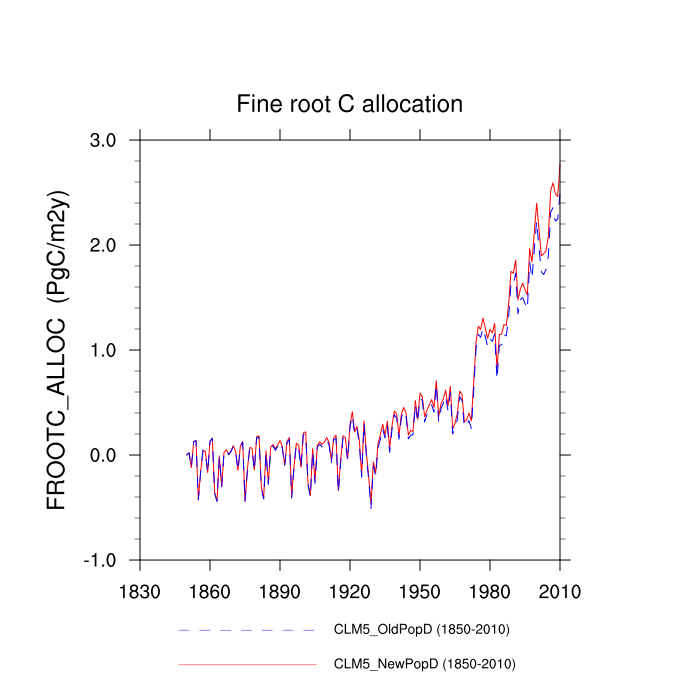
| Fine root C allocation (FROOTC_ALLOC) | TrendPlot | DifferencePlot | AnomalyPlot | ||
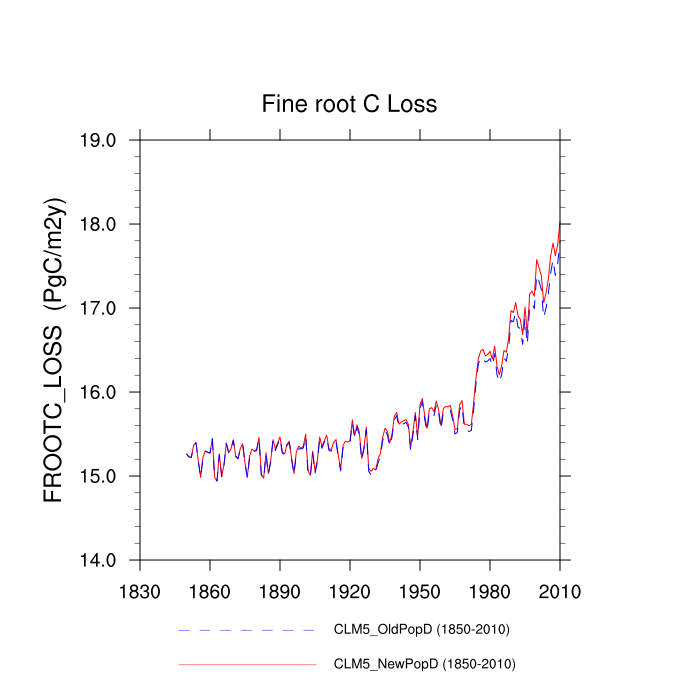
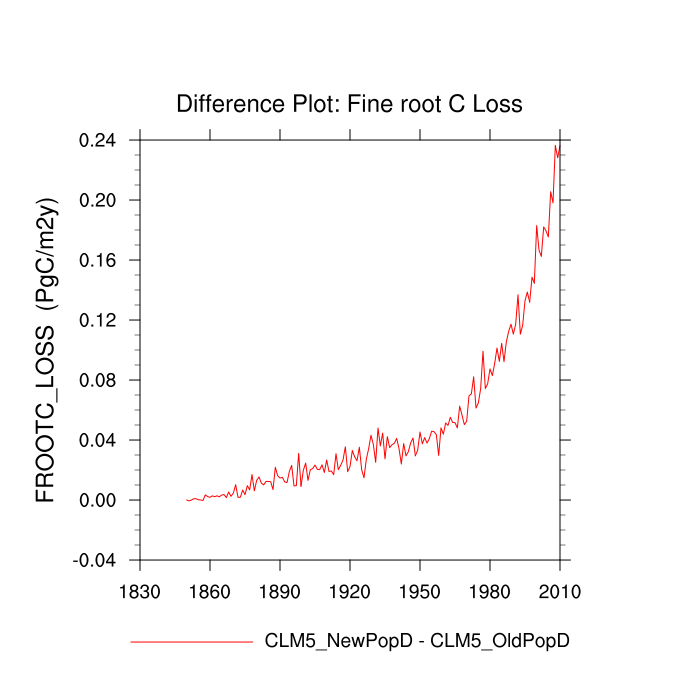
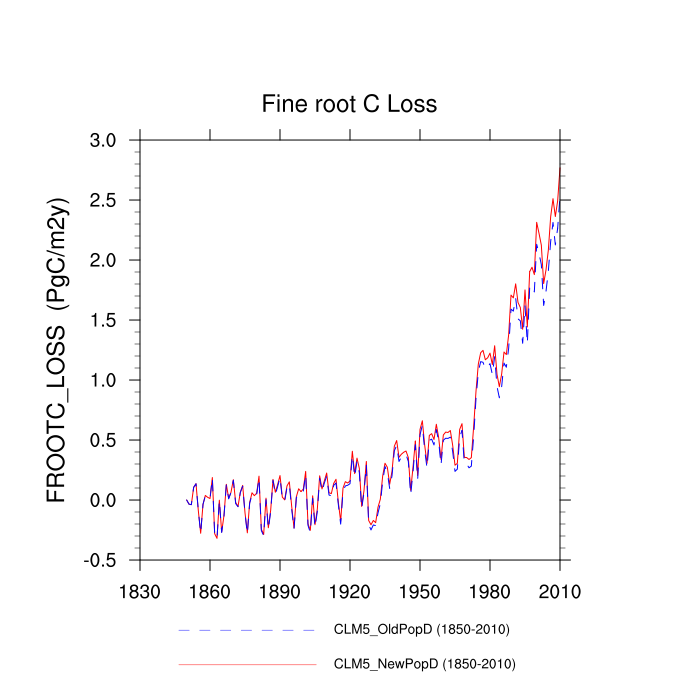
| Fine root C Loss (FROOTC_LOSS) | TrendPlot | DifferencePlot | AnomalyPlot | ||
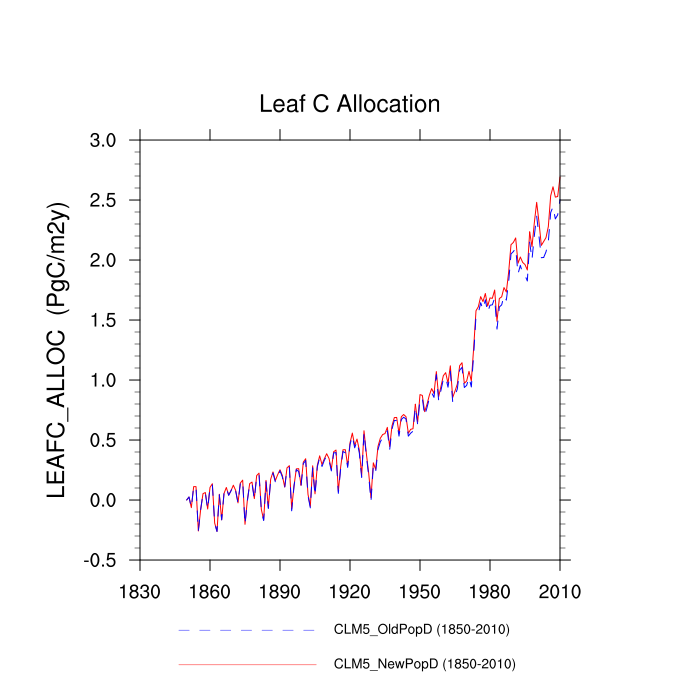
| Leaf C Allocation (LEAFC_ALLOC) | TrendPlot | DifferencePlot | AnomalyPlot | ||
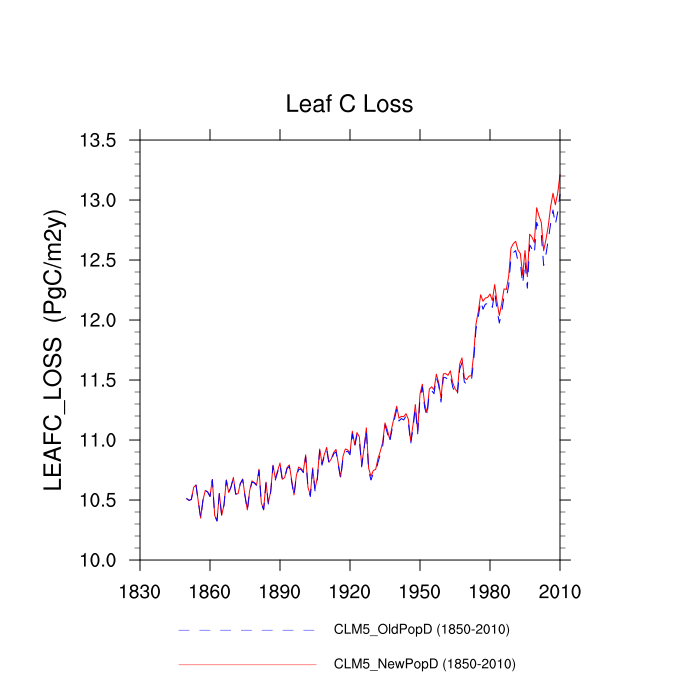
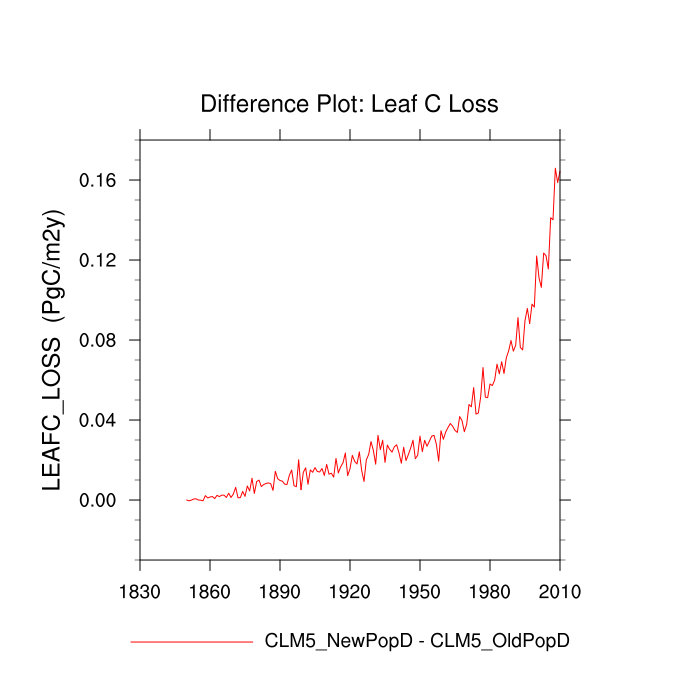
| Leaf C Loss (LEAFC_LOSS) | TrendPlot | DifferencePlot | AnomalyPlot | ||
| Total Litter C (LITTERC) | --- | --- | --- | ||
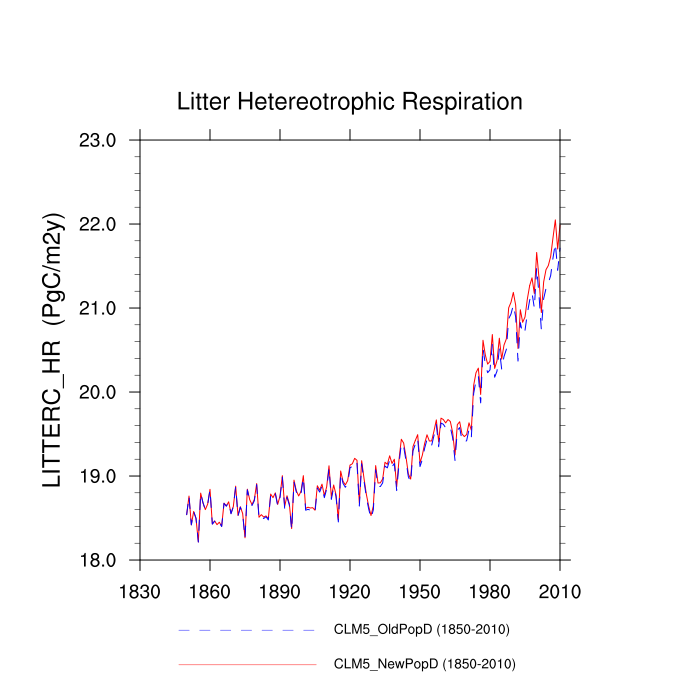
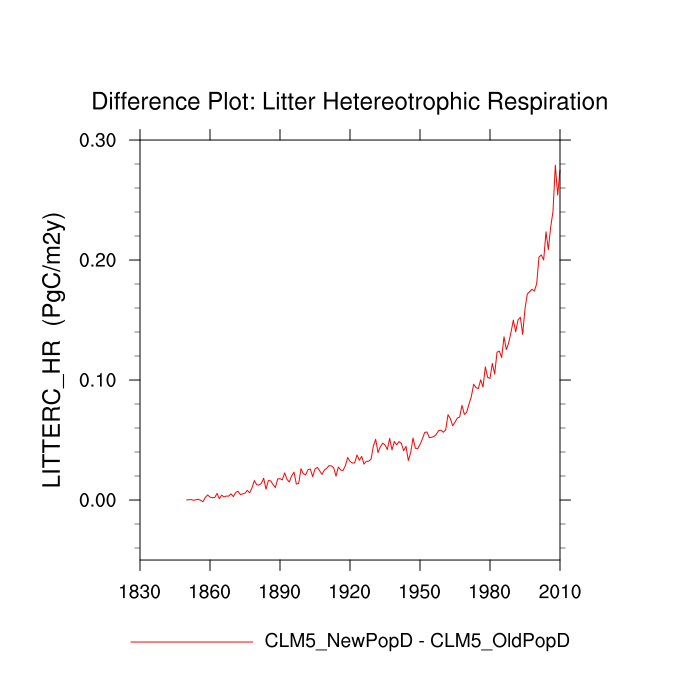
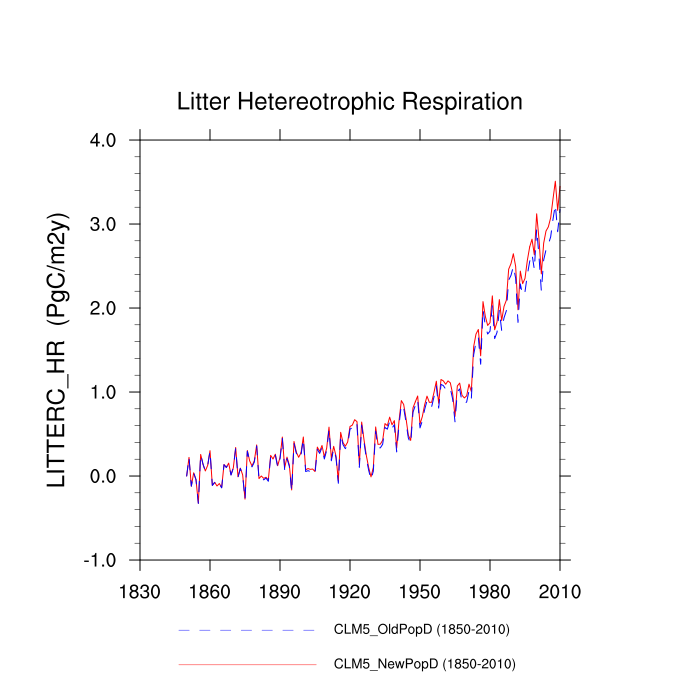
| Litter Hetereotrophic Respiration (LITTERC_HR) | TrendPlot | DifferencePlot | AnomalyPlot | ||
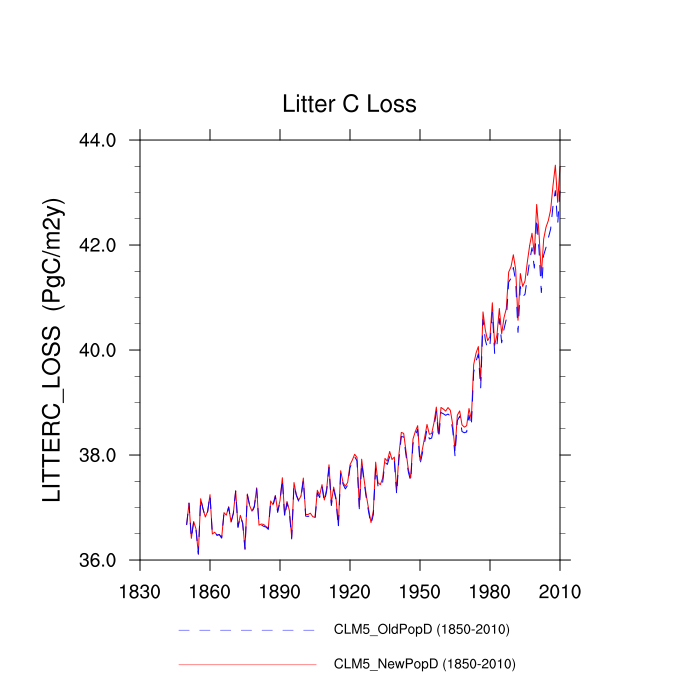
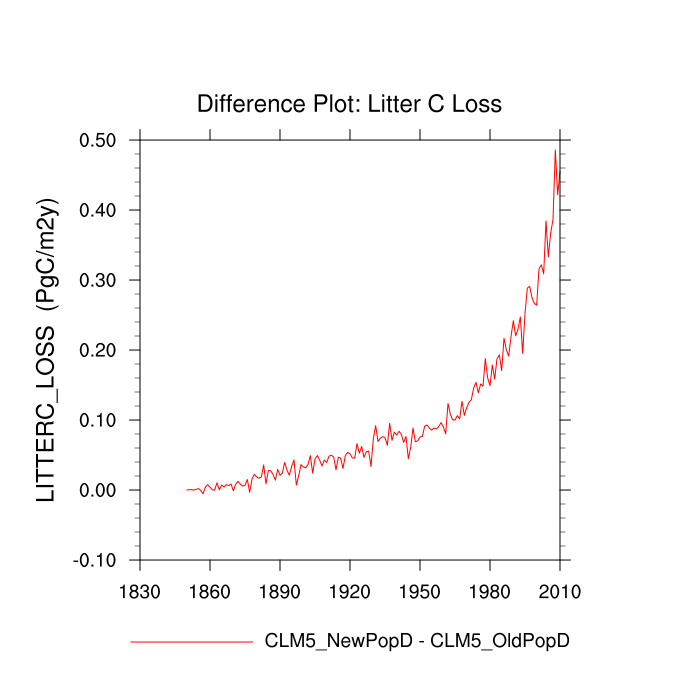
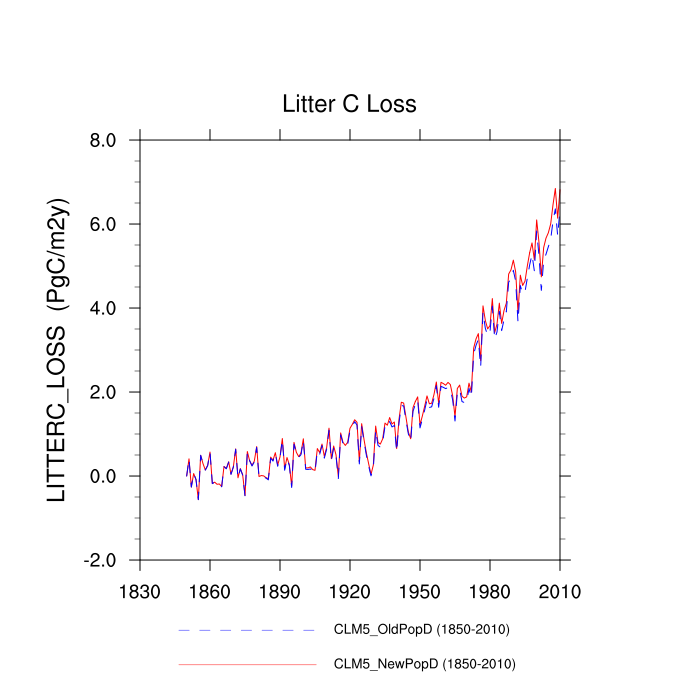
| Litter C Loss (LITTERC_LOSS) | TrendPlot | DifferencePlot | AnomalyPlot | ||
| soil organic matter C (fast pool) (SOILC) | --- | --- | --- | ||
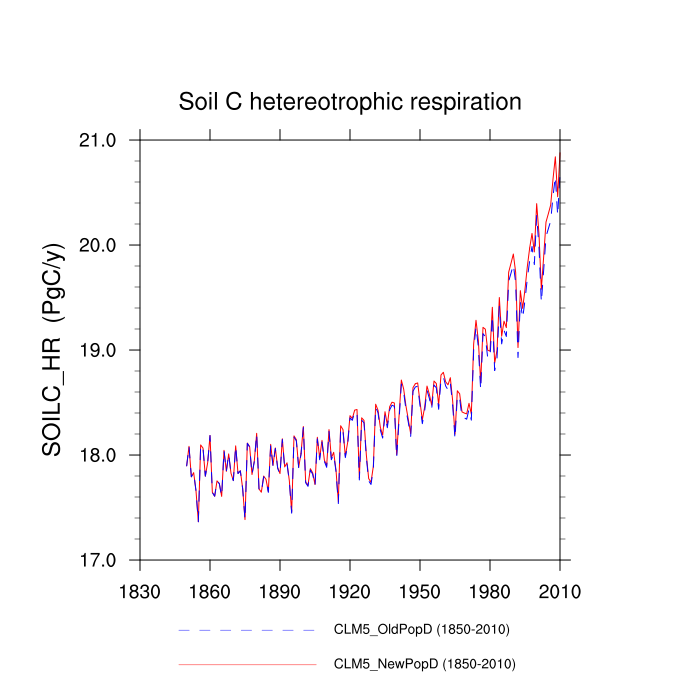
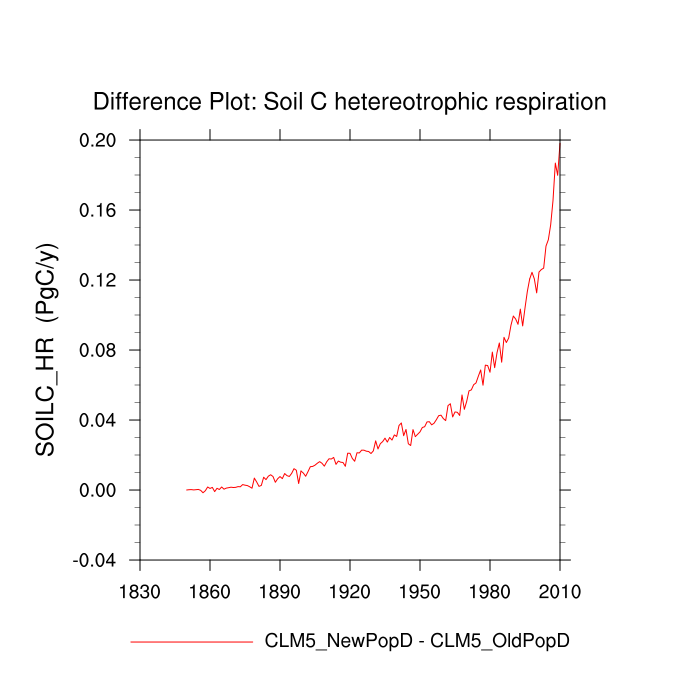
| Soil C hetereotrophic respiration (SOILC_HR) | TrendPlot | DifferencePlot | AnomalyPlot | ||
| Soil C Loss (SOILC_LOSS) | --- | --- | --- | ||
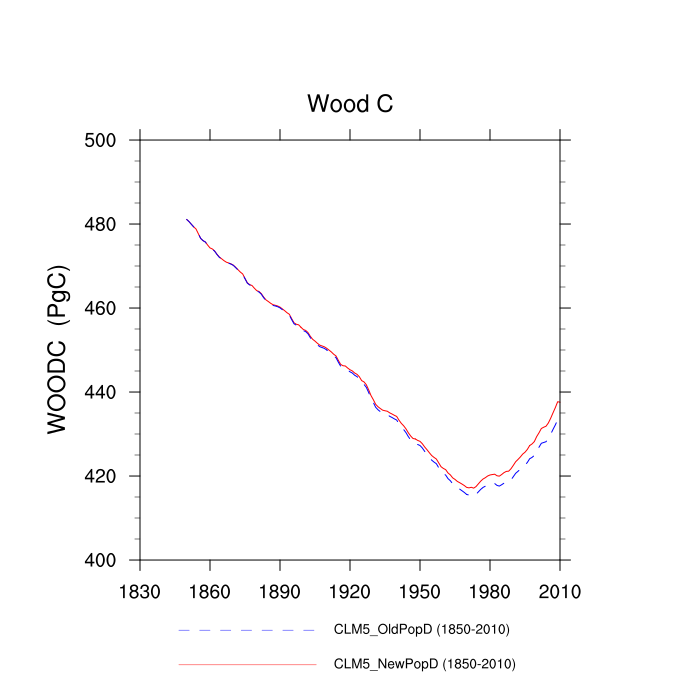
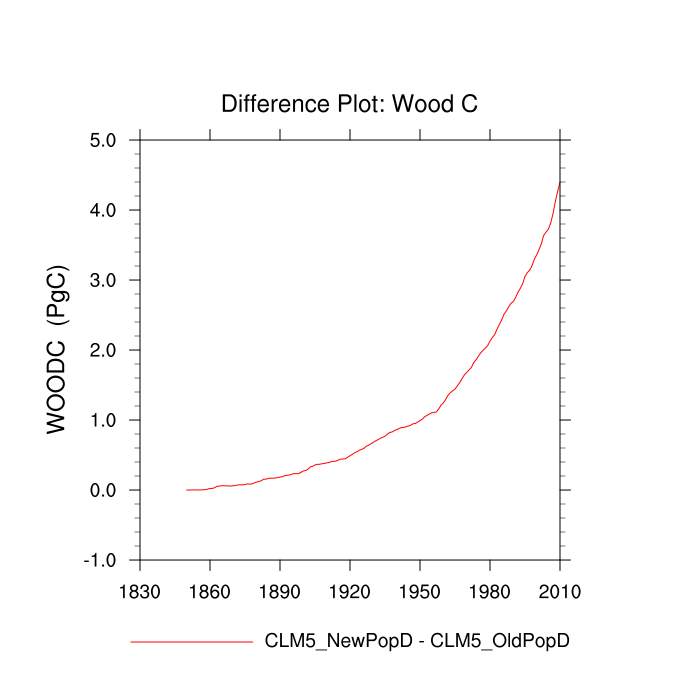
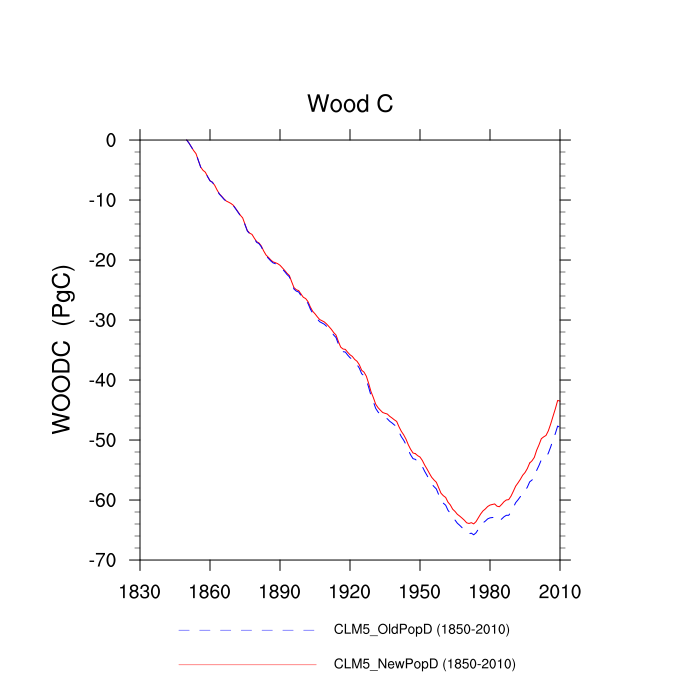
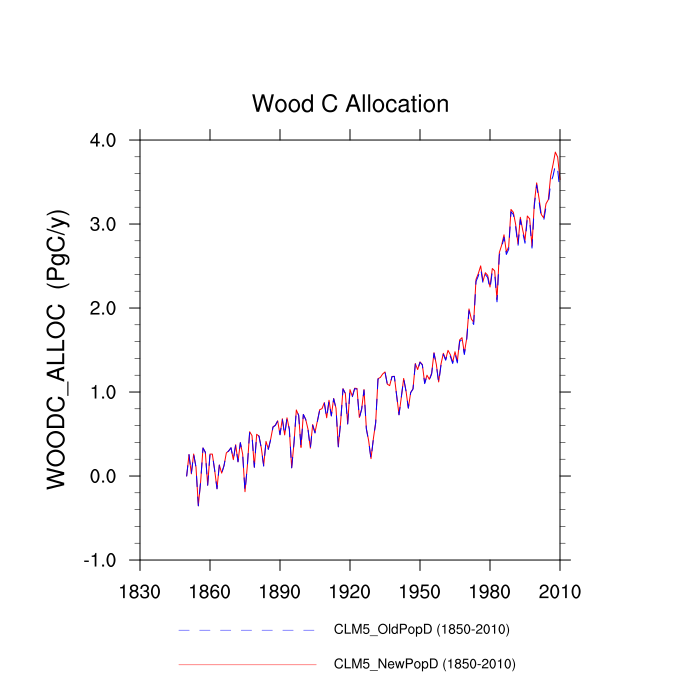
| Wood C (WOODC) | TrendPlot | DifferencePlot | AnomalyPlot | ||
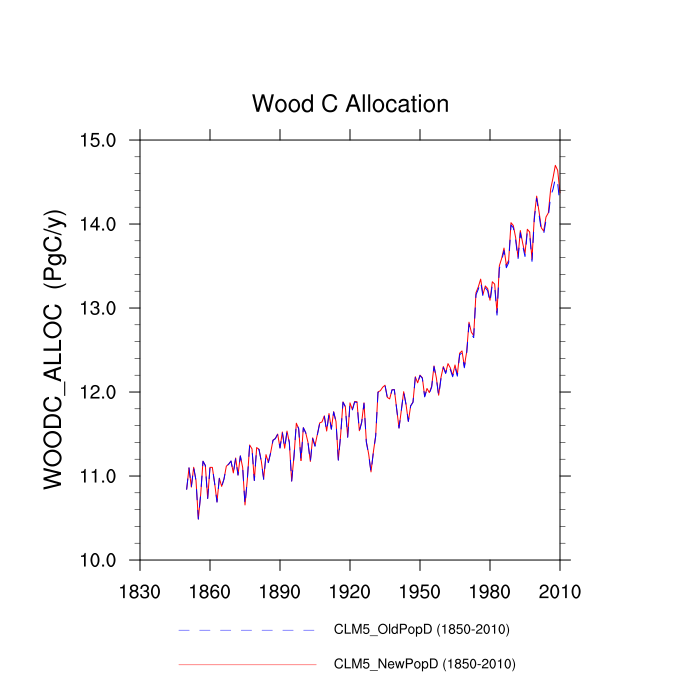
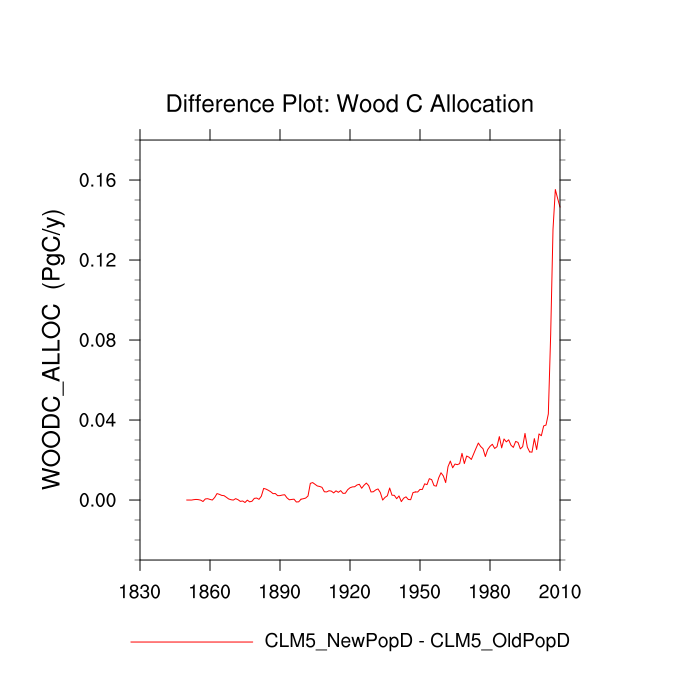
| Wood C Allocation (WOODC_ALLOC) | TrendPlot | DifferencePlot | AnomalyPlot | ||
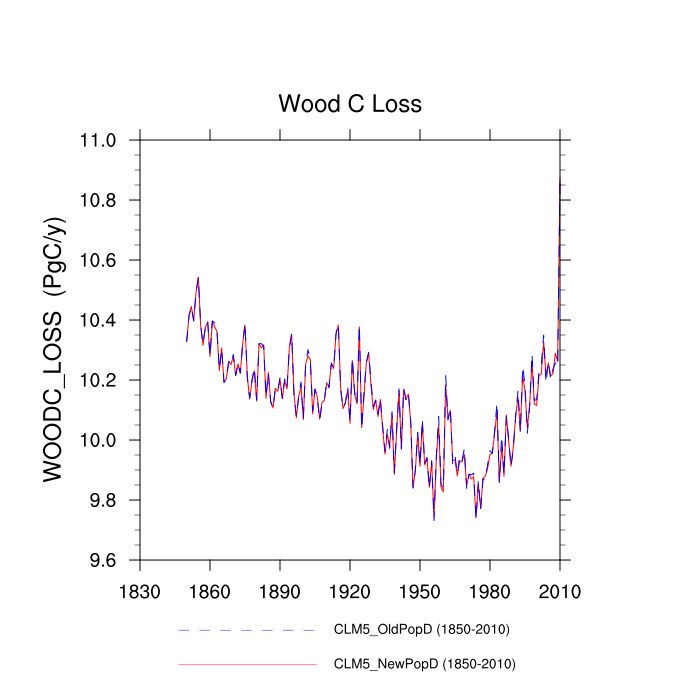
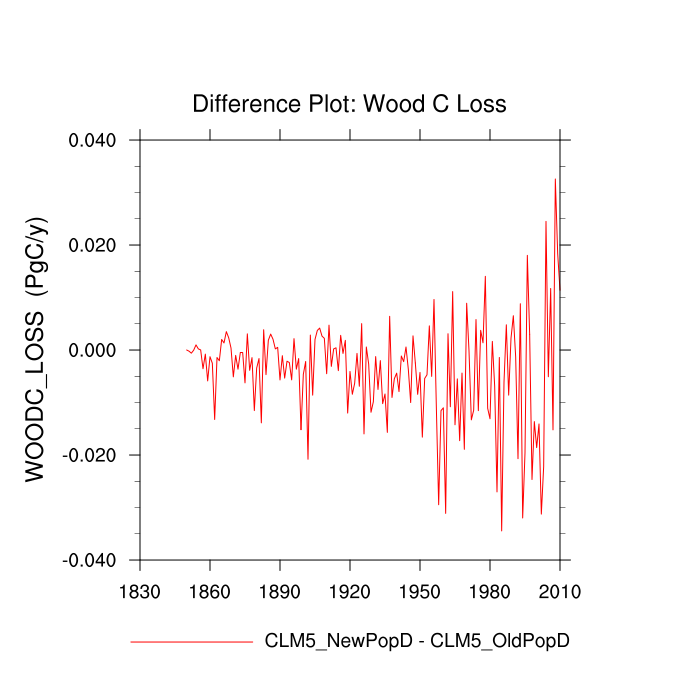
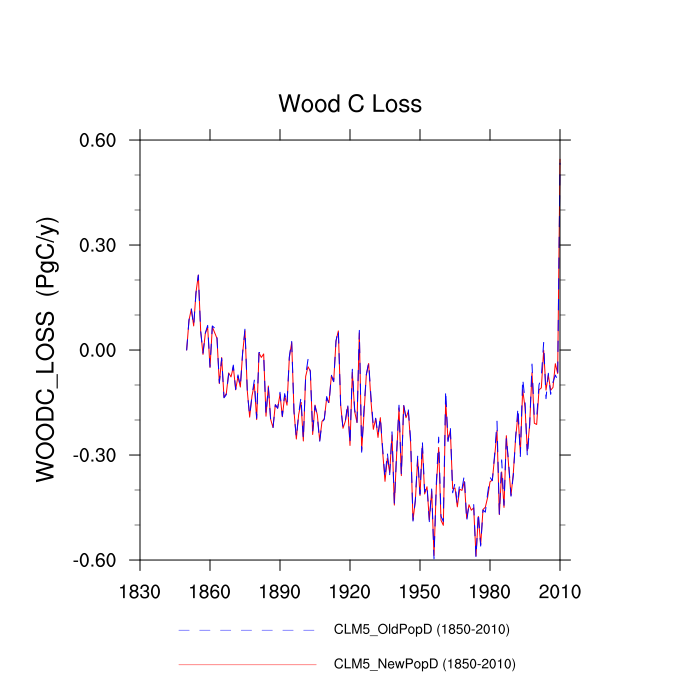
| Wood C Loss (WOODC_LOSS) | TrendPlot | DifferencePlot | AnomalyPlot | ||
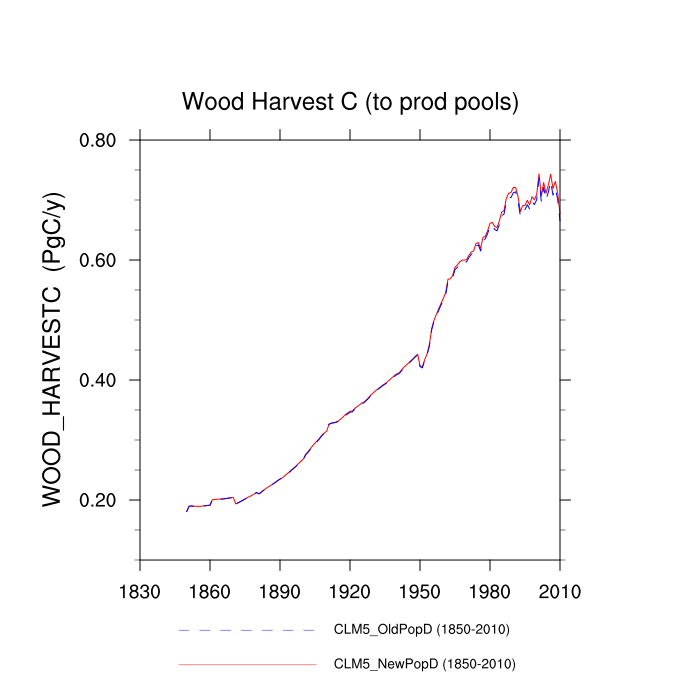
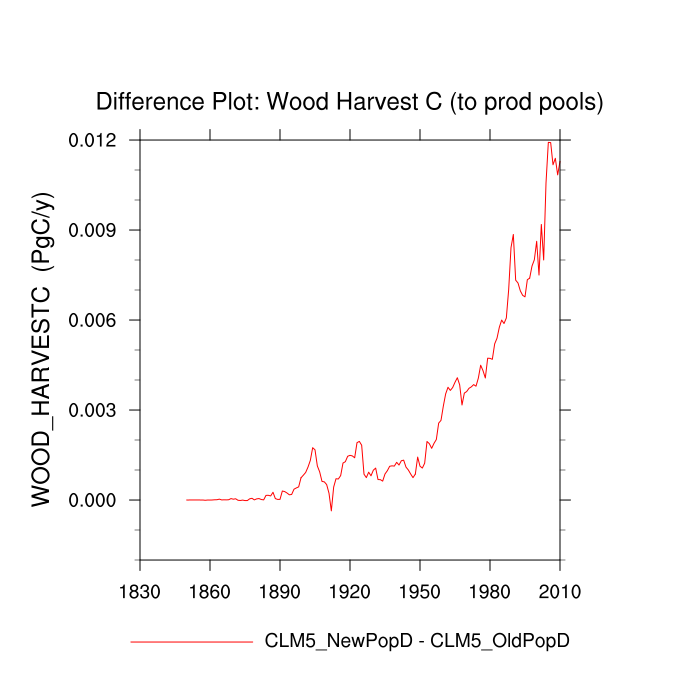
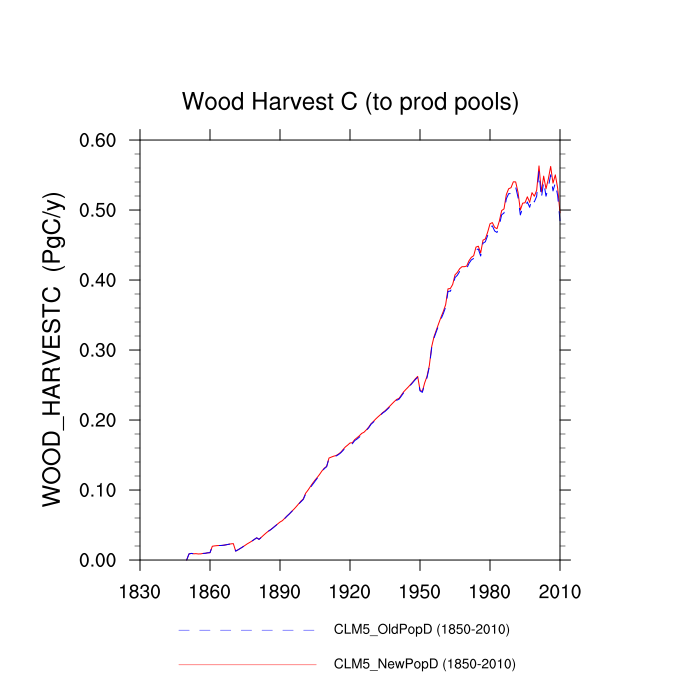
| Wood Harvest C (to prod pools) (WOOD_HARVESTC) | TrendPlot | DifferencePlot | AnomalyPlot | ||
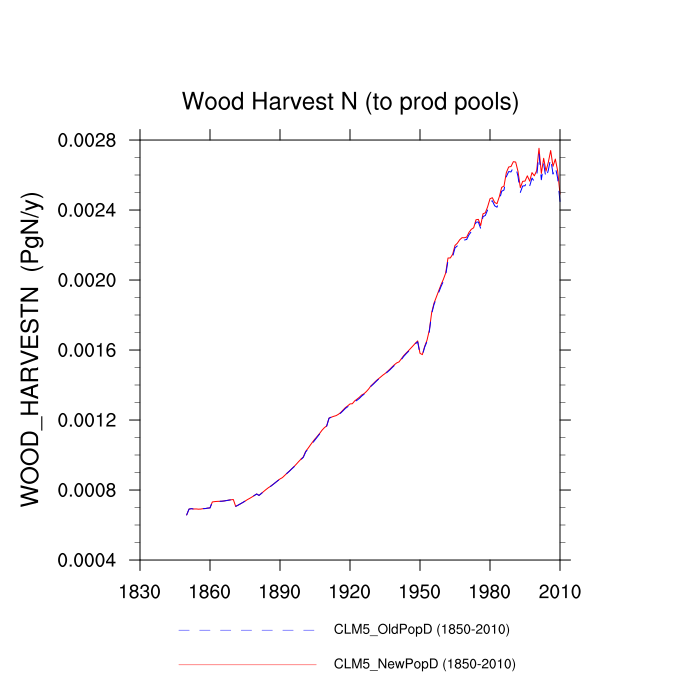
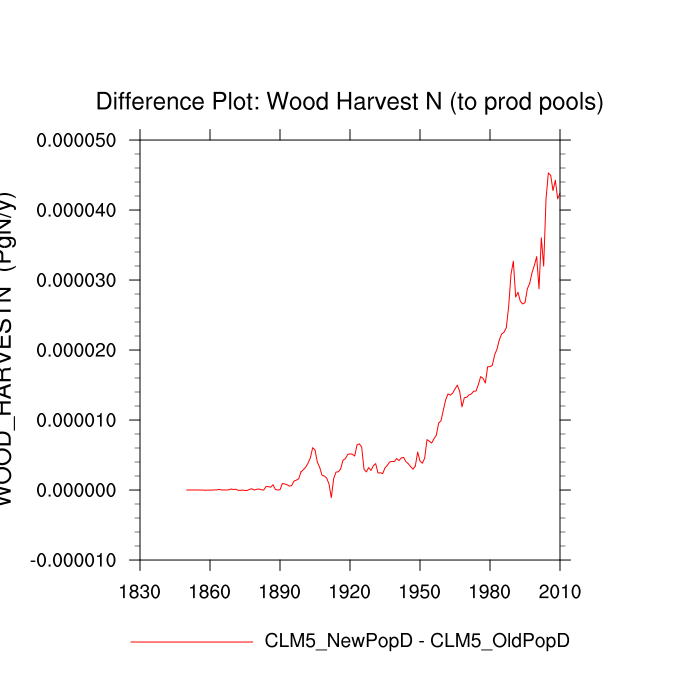
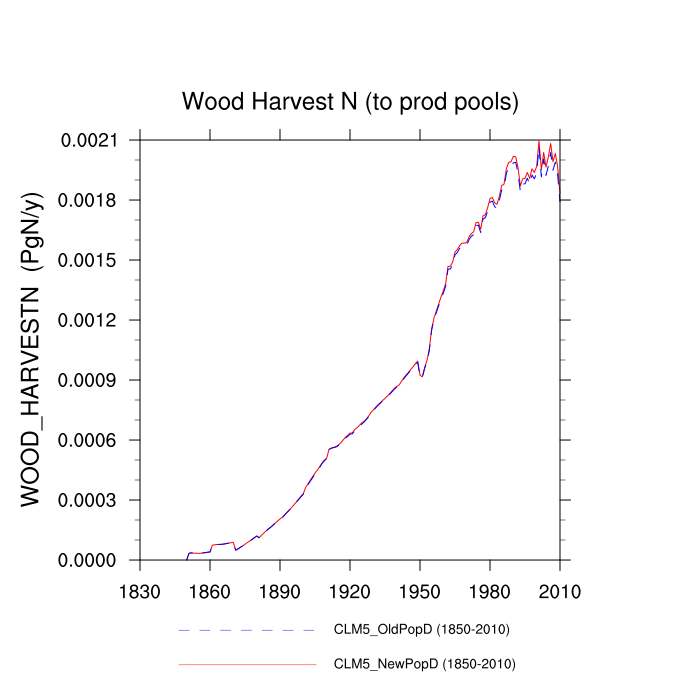
| Wood Harvest N (to prod pools) (WOOD_HARVESTN) | TrendPlot | DifferencePlot | AnomalyPlot | ||
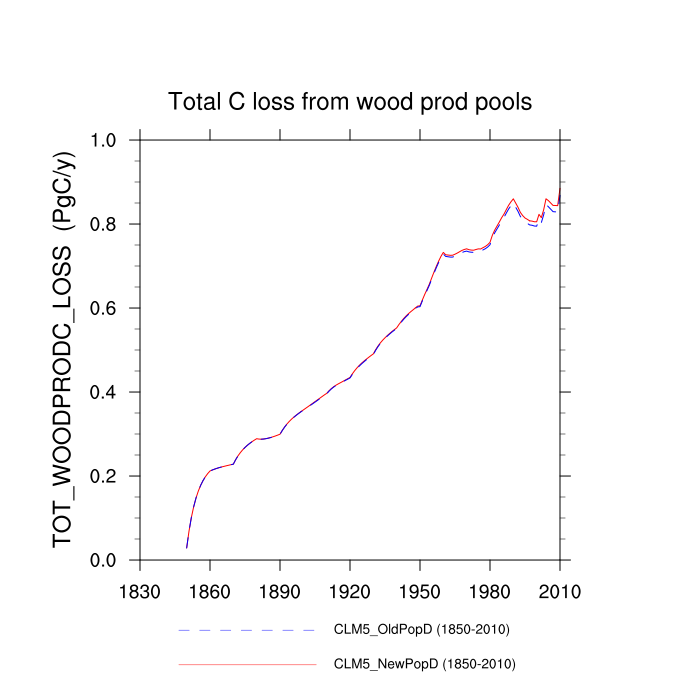
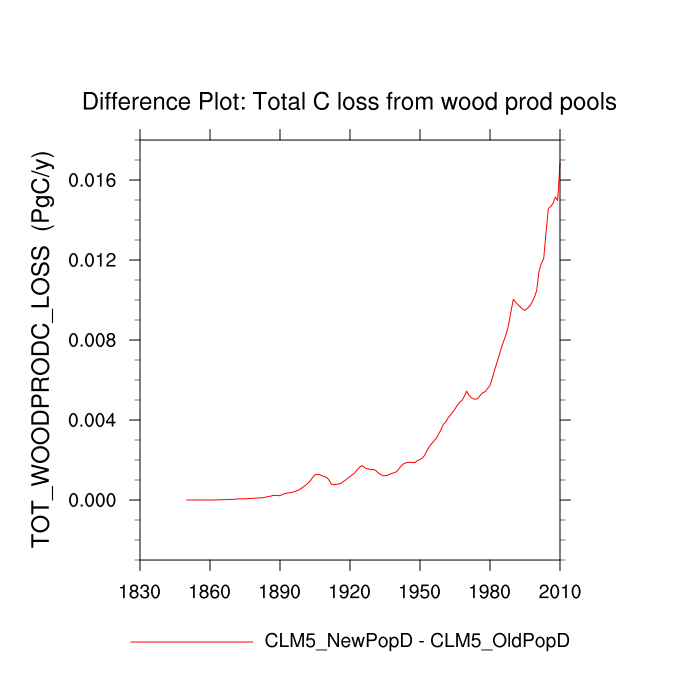
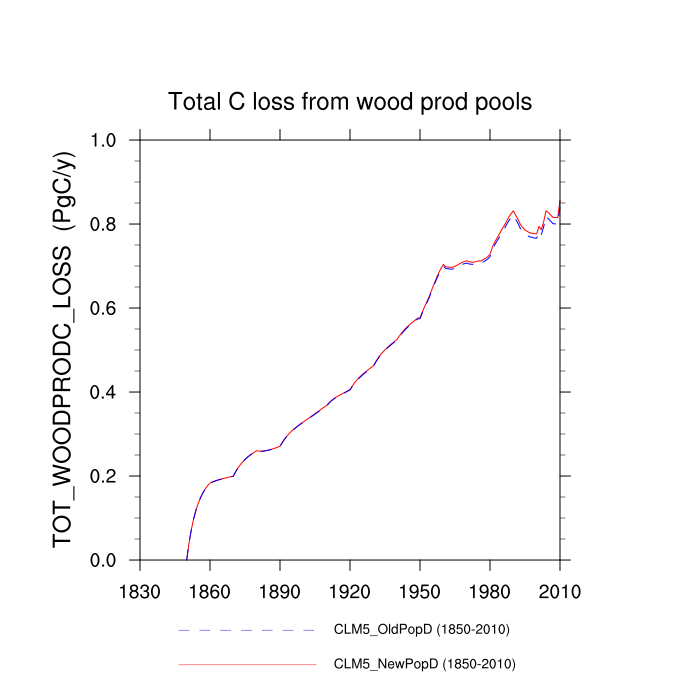
| Total C loss from wood prod pools (TOT_WOODPRODC_LOSS) | TrendPlot | DifferencePlot | AnomalyPlot | ||
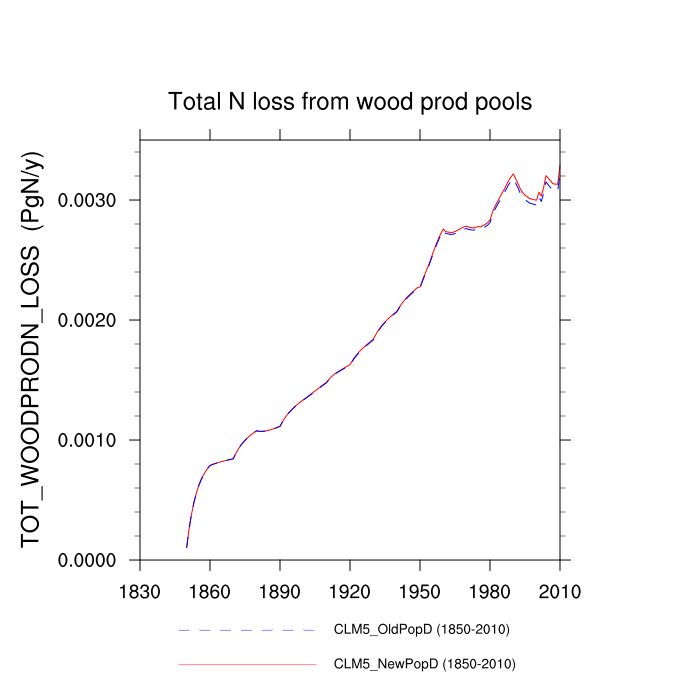
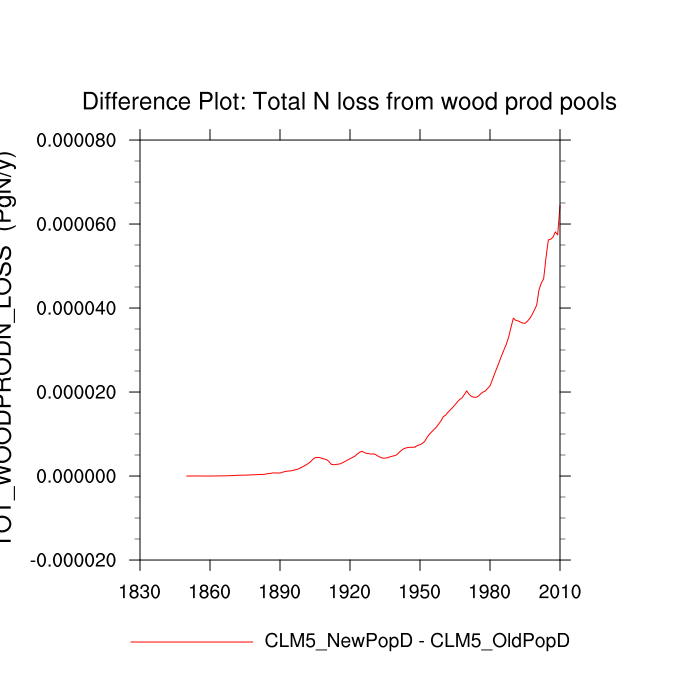
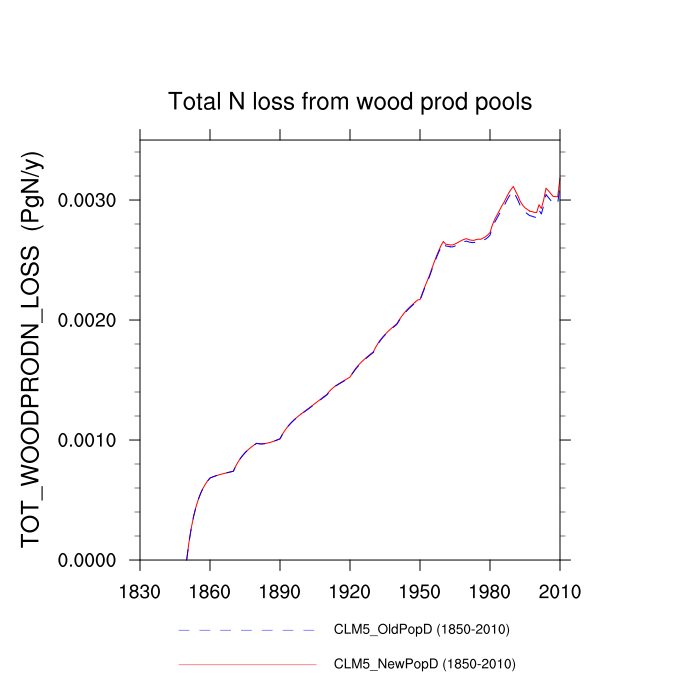
| Total N loss from wood prod pools (TOT_WOODPRODN_LOSS) | TrendPlot | DifferencePlot | AnomalyPlot | ||
| C loss from 10-yr wood prod pool (PROD10C_LOSS) | --- | --- | --- | ||
| N loss from 10-yr wood prod pool (PROD10N_LOSS) | --- | --- | --- | ||
| C loss from 100-yr wood prod pool (PROD100C_LOSS) | --- | --- | --- | ||
| N loss from 100-yr wood prod pool (PROD100N_LOSS) | --- | --- | --- | ||
| LCC-driven addition to 10-yr wood prod pool (DWT_PROD10C_GAIN) | --- | --- | --- | ||
| LCC-driven addition to 10-yr wood prod pool (DWT_PROD10N_GAIN) | --- | --- | --- | ||
| LCC-driven addition to 100-yr wood prod pool (DWT_PROD100C_GAIN) | --- | --- | --- | ||
| LCC-driven addition to 100-yr wood prod pool (DWT_PROD100N_GAIN) | --- | --- | --- | ||
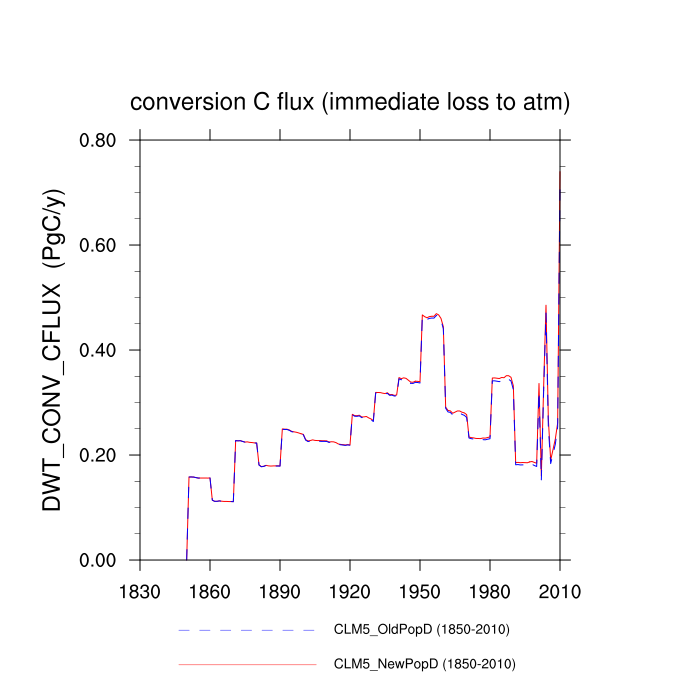
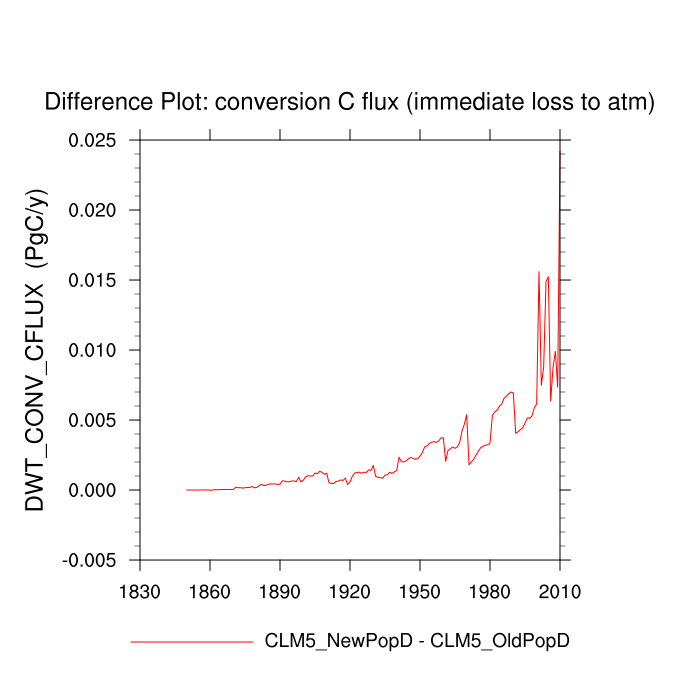
| conversion C flux (immediate loss to atm) (DWT_CONV_CFLUX) | TrendPlot | DifferencePlot | AnomalyPlot | ||
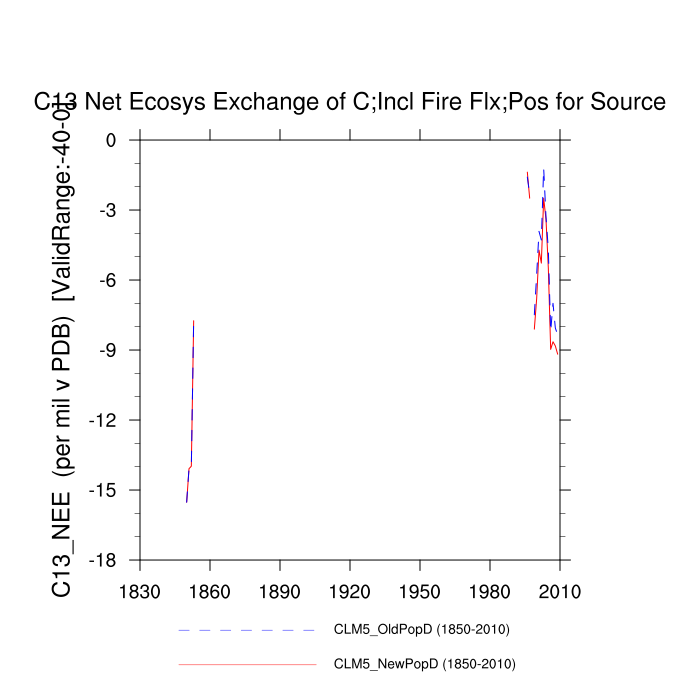
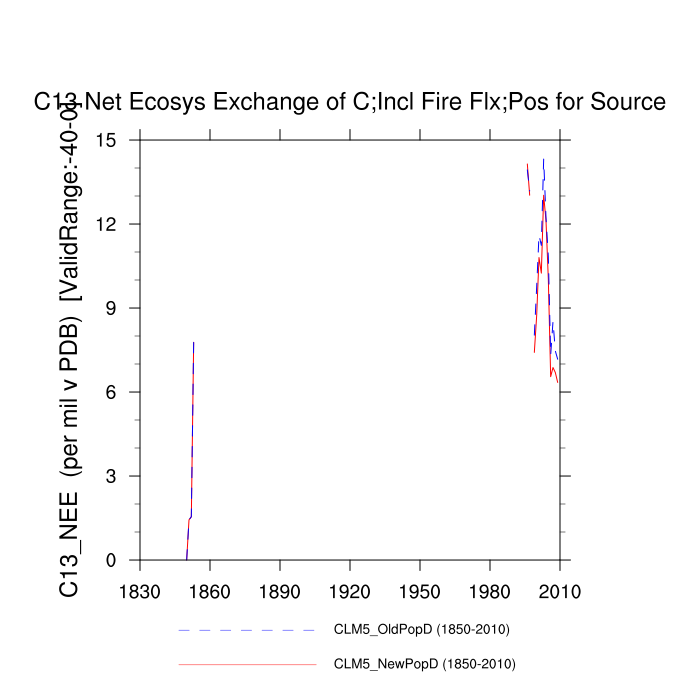
| C13 Net Ecosys Exchange of C;Incl Fire Flx;Pos for Source (C13_NEE) | TrendPlot | --- | AnomalyPlot | ||
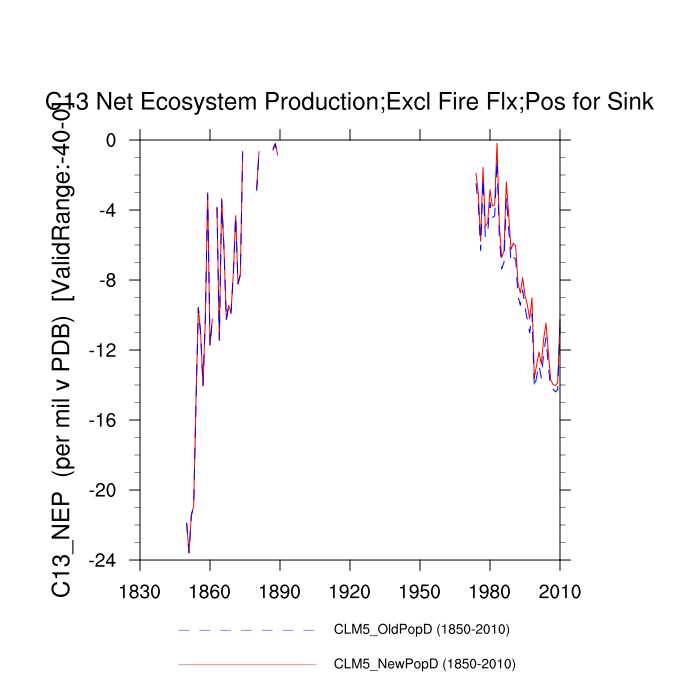
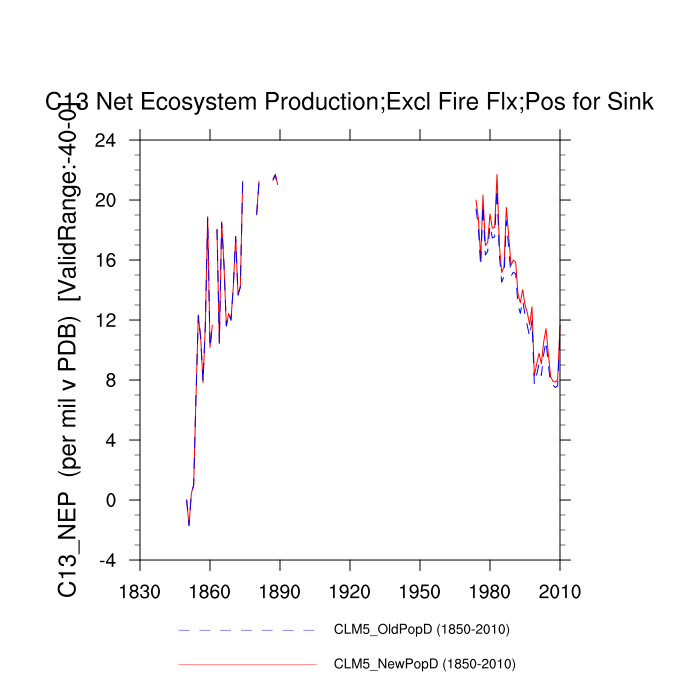
| C13 Net Ecosystem Production;Excl Fire Flx;Pos for Sink (C13_NEP) | TrendPlot | --- | AnomalyPlot | ||
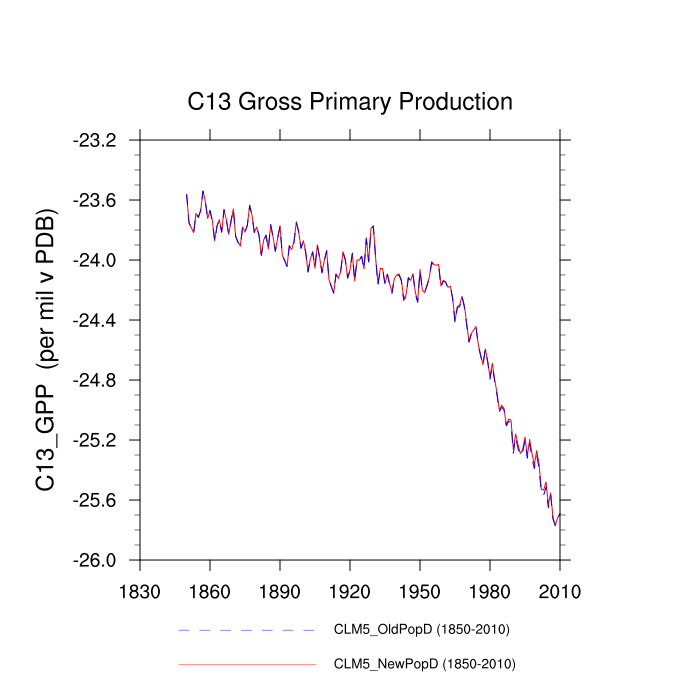
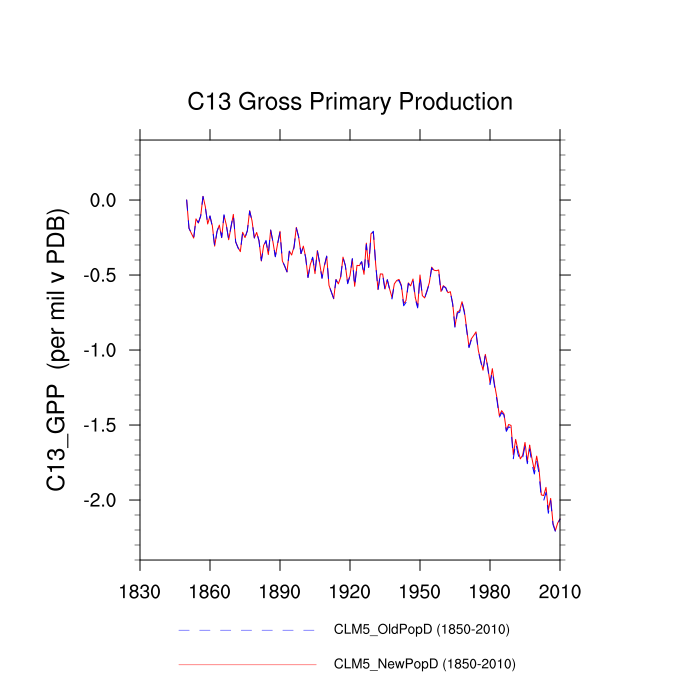
| C13 Gross Primary Production (C13_GPP) | TrendPlot | --- | AnomalyPlot | ||
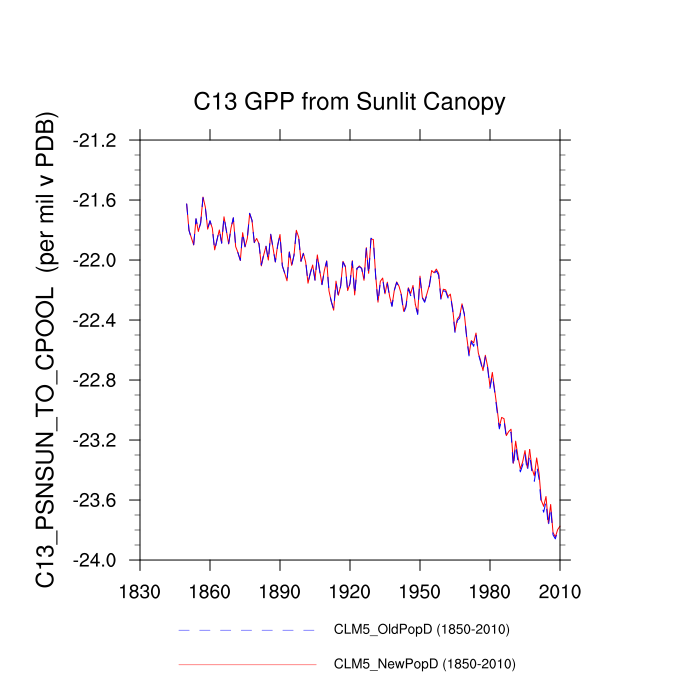
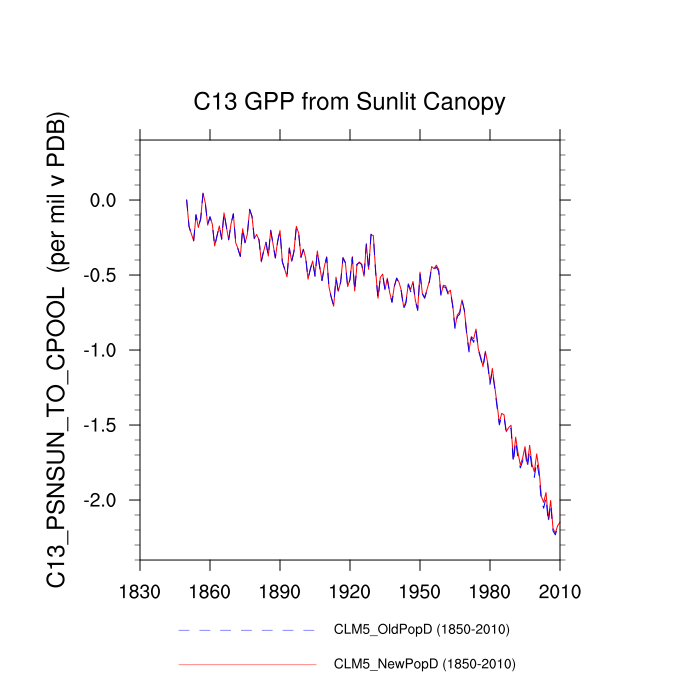
| C13 GPP from Sunlit Canopy (C13_PSNSUN_TO_CPOOL) | TrendPlot | --- | AnomalyPlot | ||
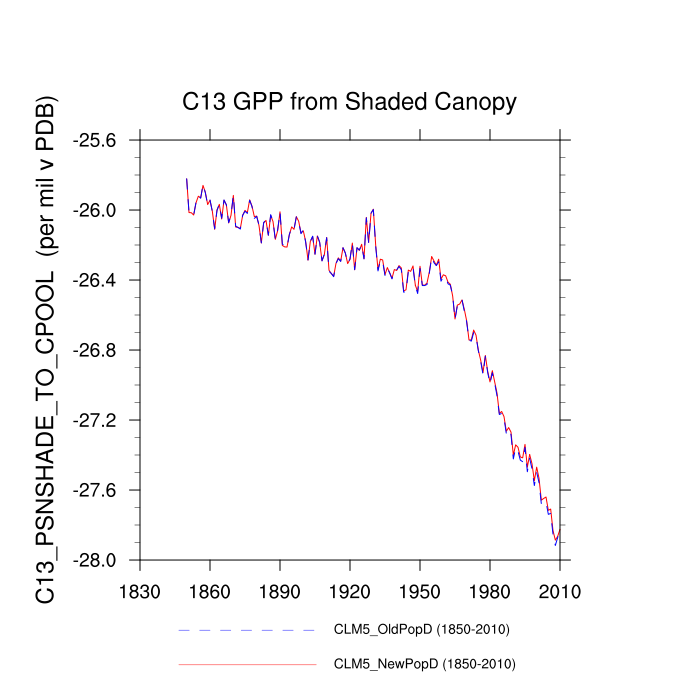
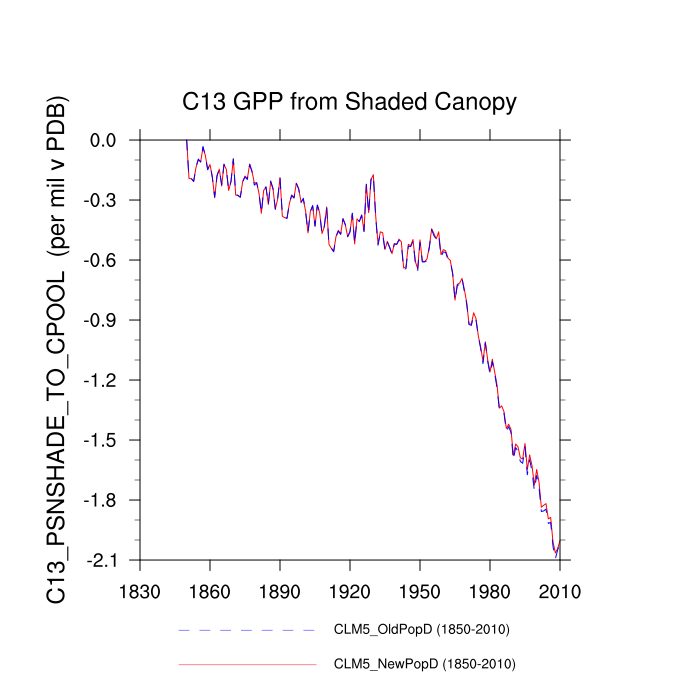
| C13 GPP from Shaded Canopy (C13_PSNSHADE_TO_CPOOL) | TrendPlot | --- | AnomalyPlot | ||
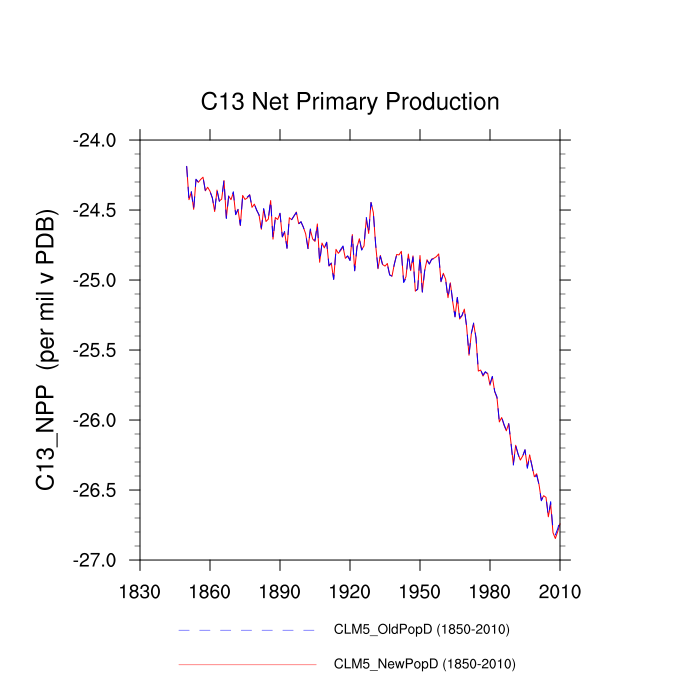
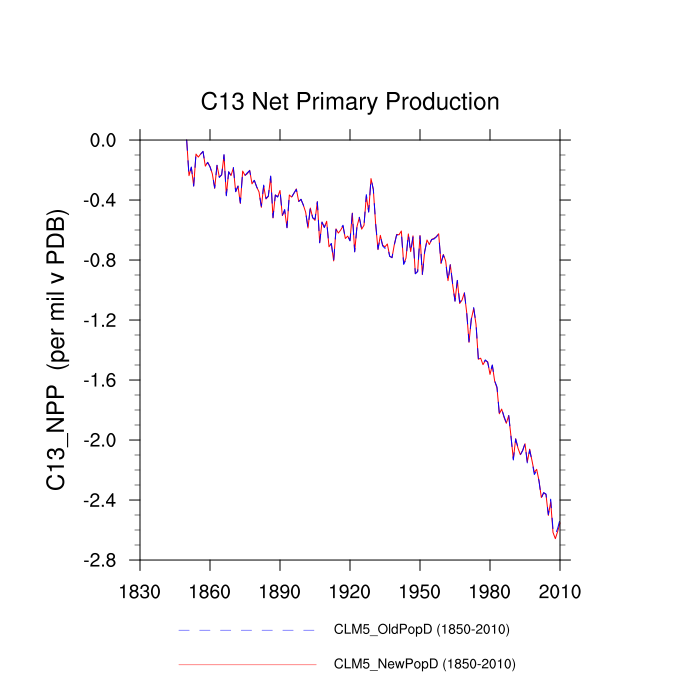
| C13 Net Primary Production (C13_NPP) | TrendPlot | --- | AnomalyPlot | ||
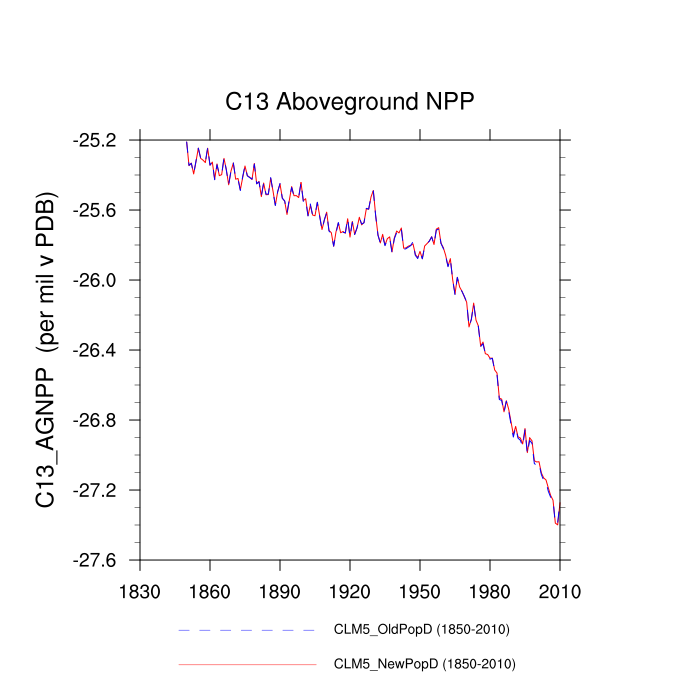
| C13 Aboveground NPP (C13_AGNPP) | TrendPlot | --- | AnomalyPlot | ||
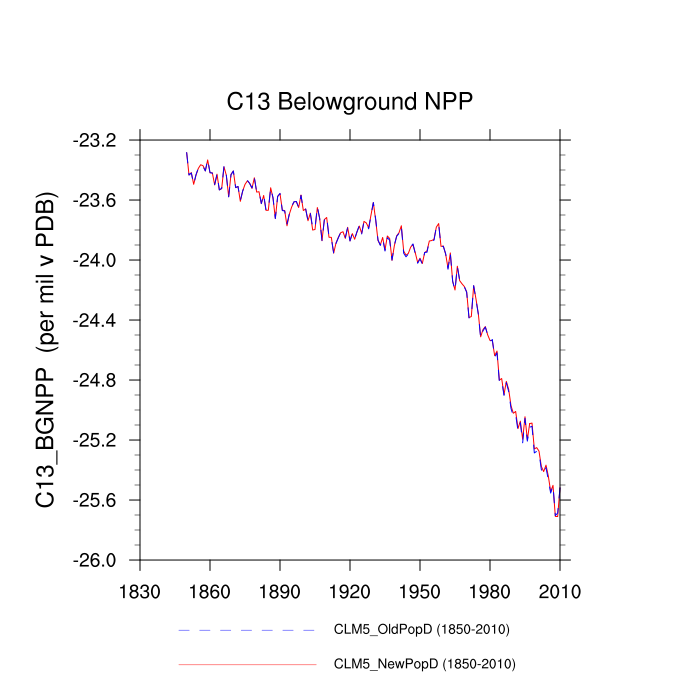
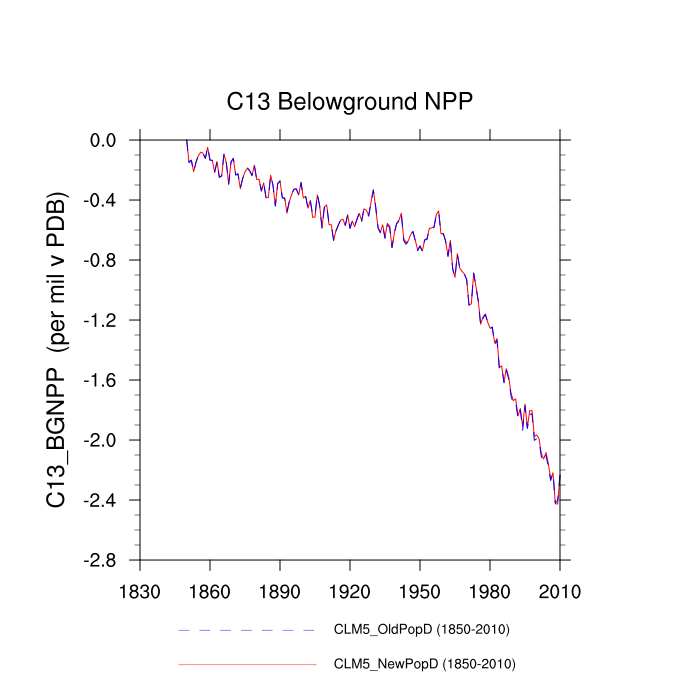
| C13 Belowground NPP (C13_BGNPP) | TrendPlot | --- | AnomalyPlot | ||
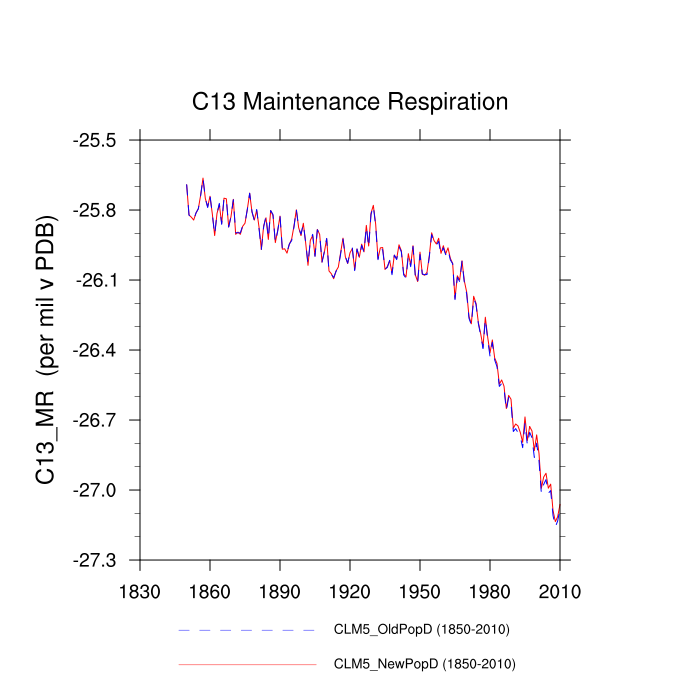
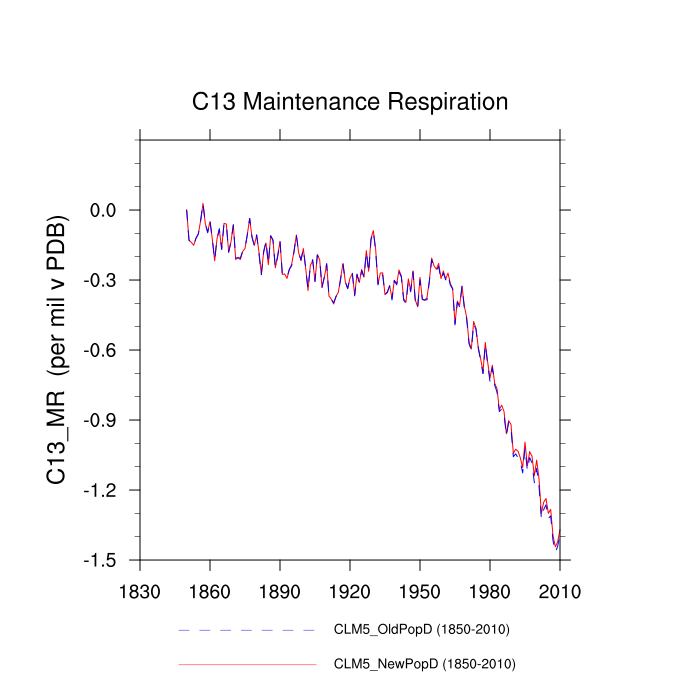
| C13 Maintenance Respiration (C13_MR) | TrendPlot | --- | AnomalyPlot | ||
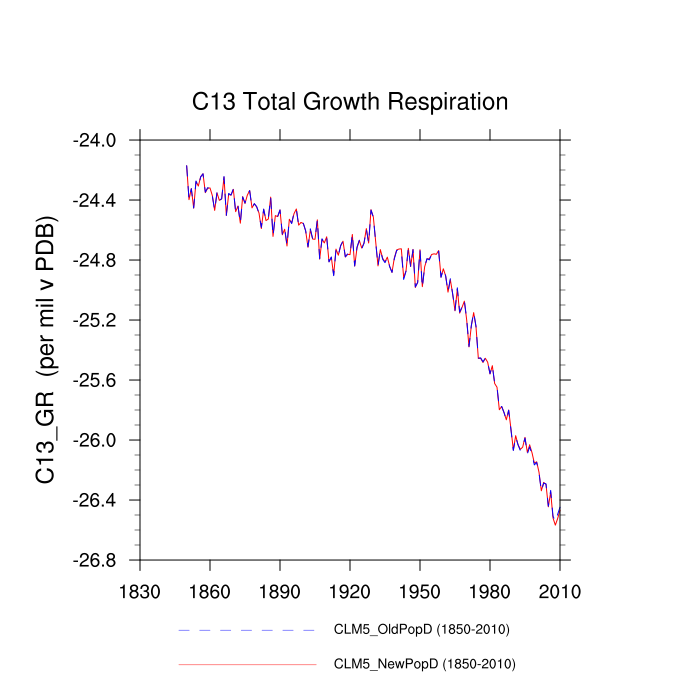
| C13 Total Growth Respiration (C13_GR) | TrendPlot | --- | AnomalyPlot | ||
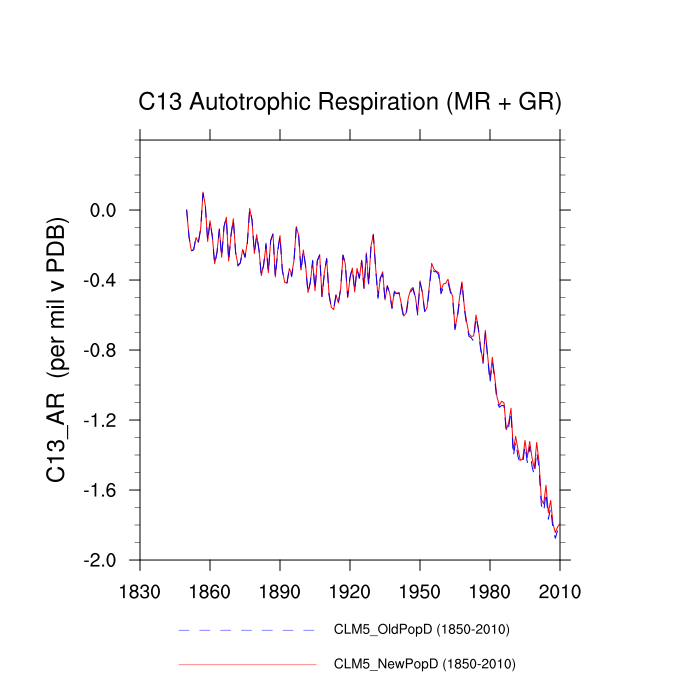
| C13 Autotrophic Respiration (MR + GR) (C13_AR) | TrendPlot | --- | AnomalyPlot | ||
| C13 Litter Hetereotrophic Respiration (C13_LITHR) | --- | --- | --- | ||
| C13 SOM Hetereotrophic Respiration (C13_SOMHR) | --- | --- | --- | ||
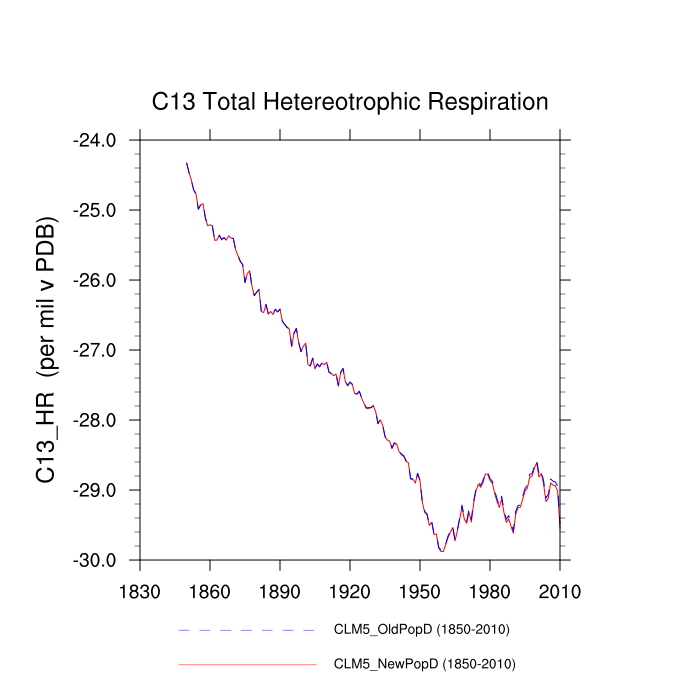
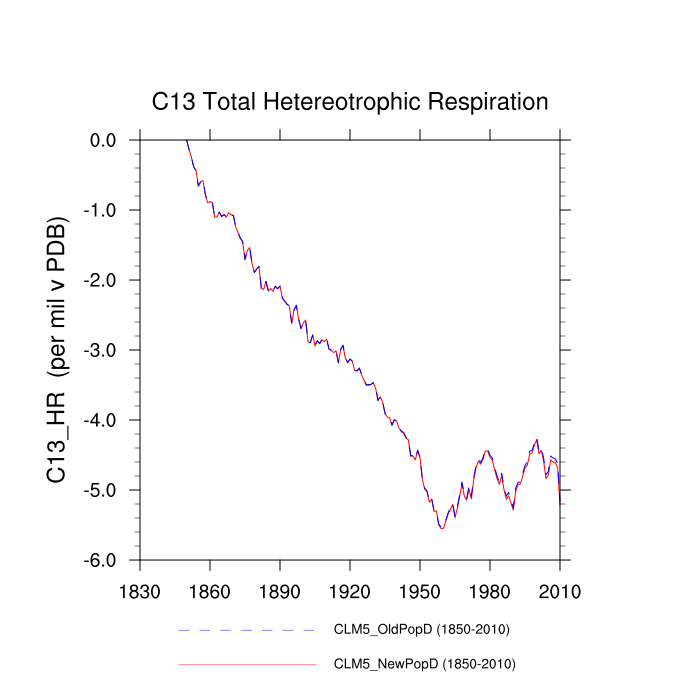
| C13 Total Hetereotrophic Respiration (C13_HR) | TrendPlot | --- | AnomalyPlot | ||
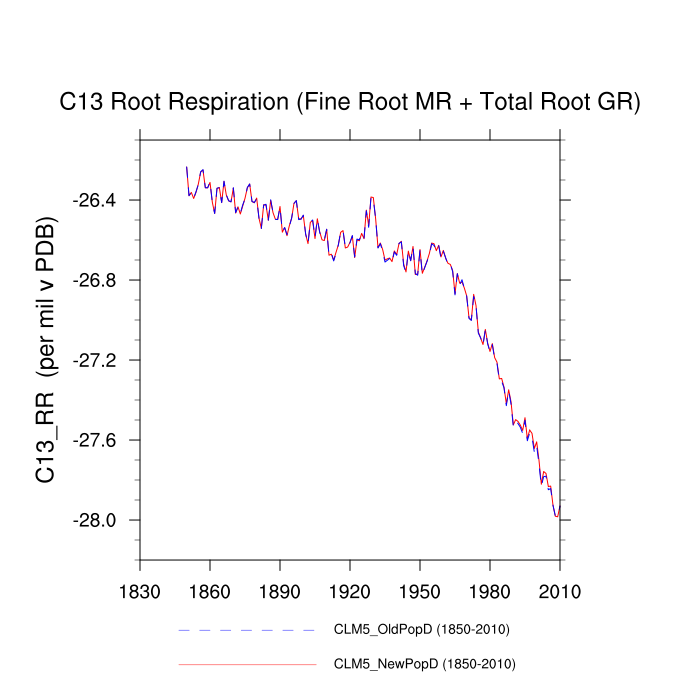
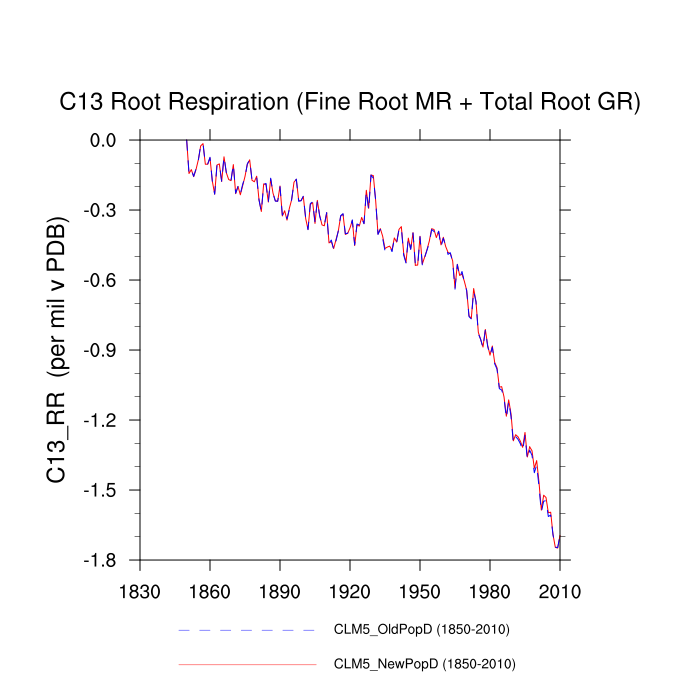
| C13 Root Respiration (Fine Root MR + Total Root GR) (C13_RR) | TrendPlot | --- | AnomalyPlot | ||
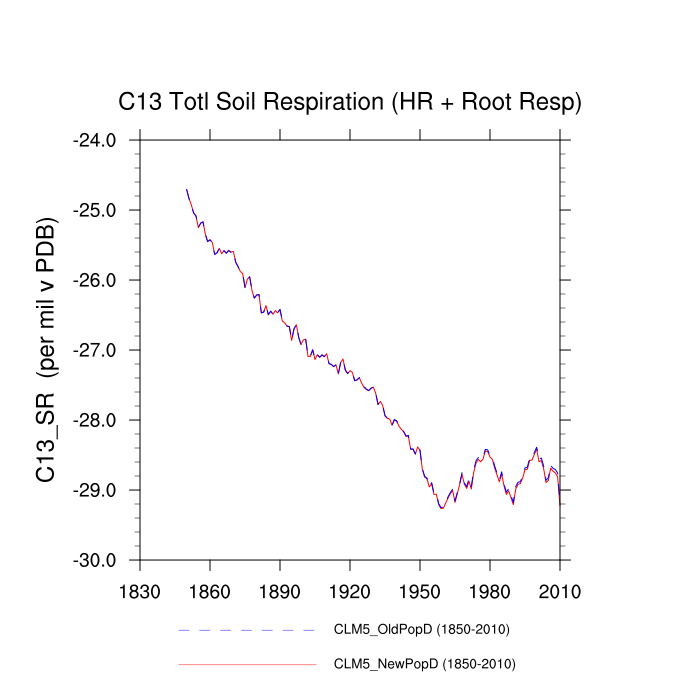
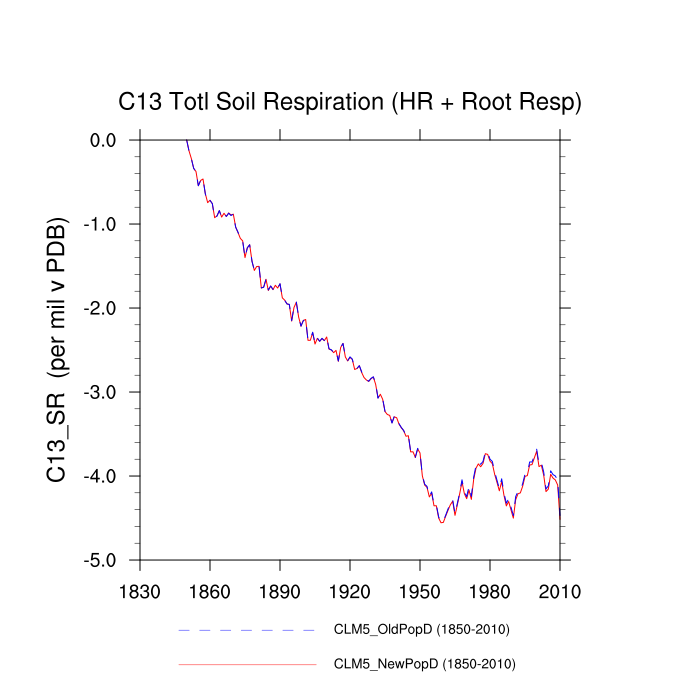
| C13 Totl Soil Respiration (HR + Root Resp) (C13_SR) | TrendPlot | --- | AnomalyPlot | ||
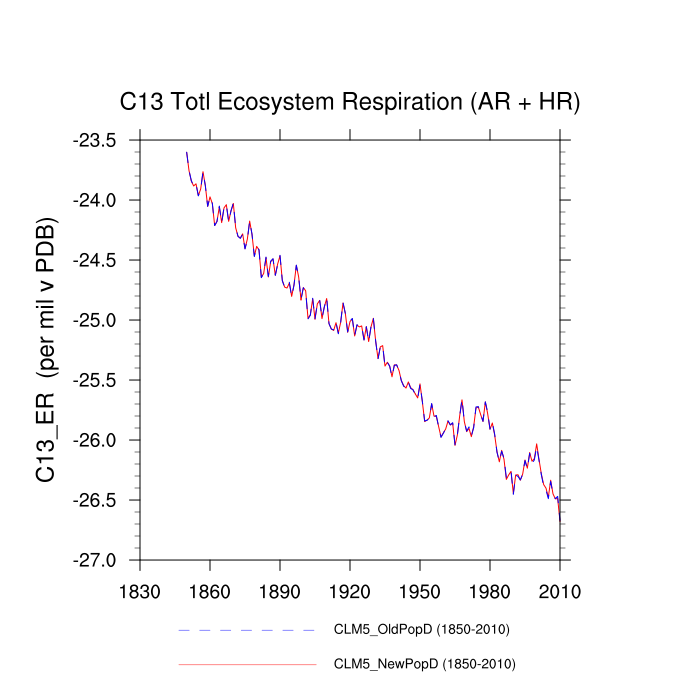
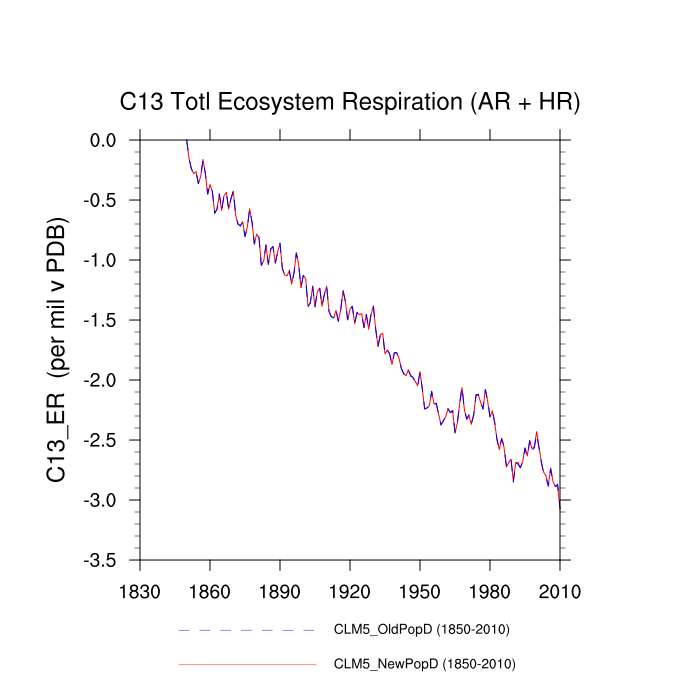
| C13 Totl Ecosystem Respiration (AR + HR) (C13_ER) | TrendPlot | --- | AnomalyPlot | ||
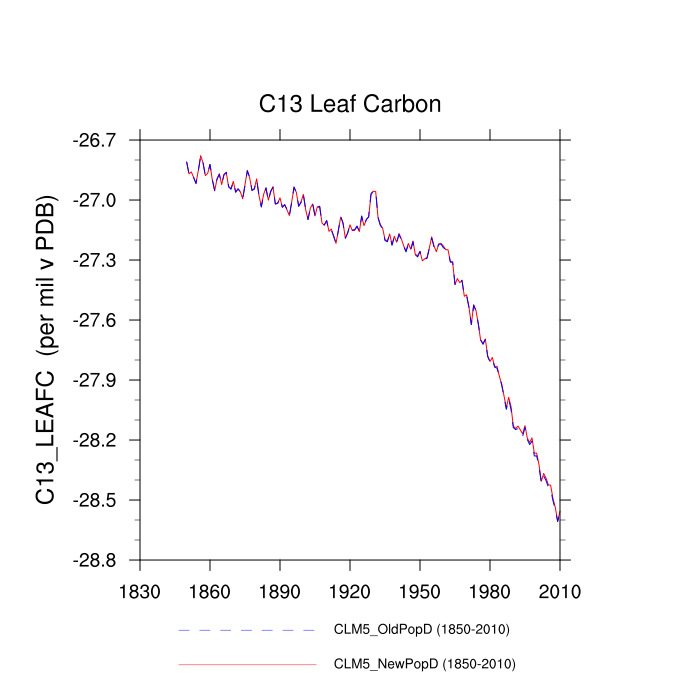
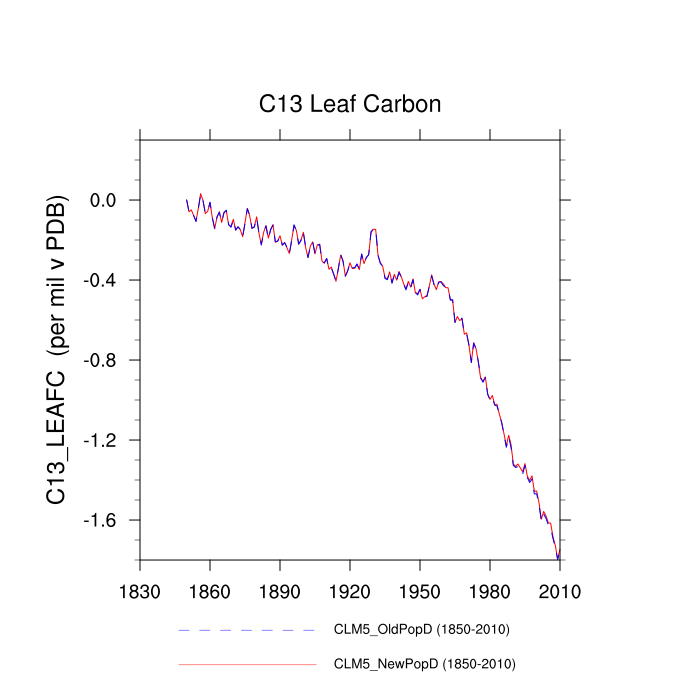
| C13 Leaf Carbon (C13_LEAFC) | TrendPlot | --- | AnomalyPlot | ||
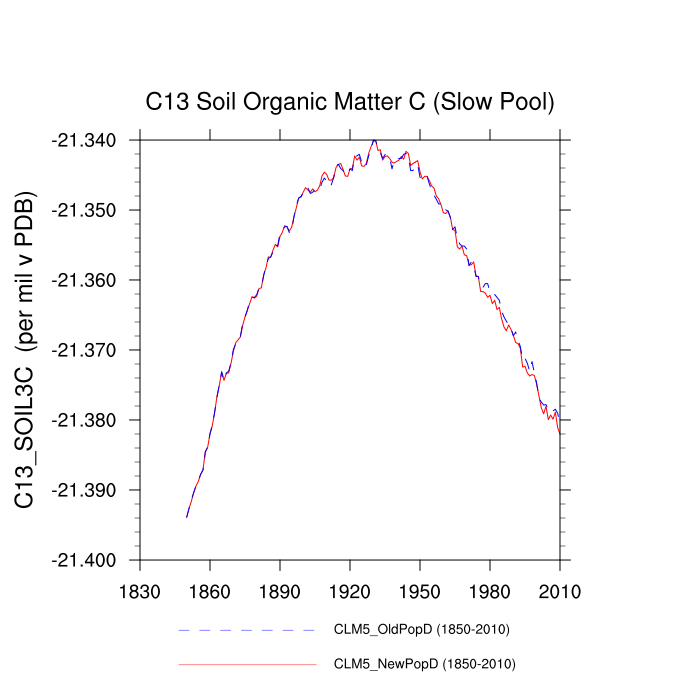
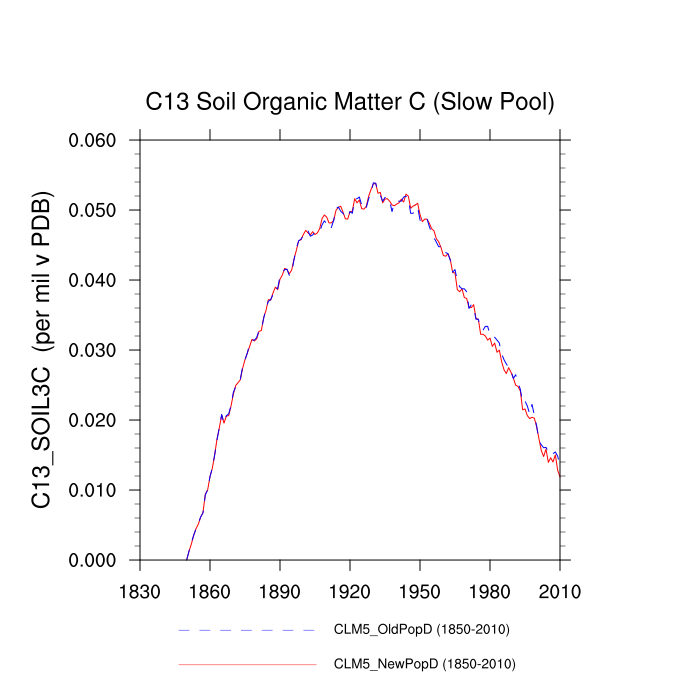
| C13 Soil Organic Matter C (Slow Pool) (C13_SOIL3C) | TrendPlot | --- | AnomalyPlot | ||
| C13 Soil Organic Matter C (Slowest Pool) (C13_SOIL4C) | --- | --- | --- | ||
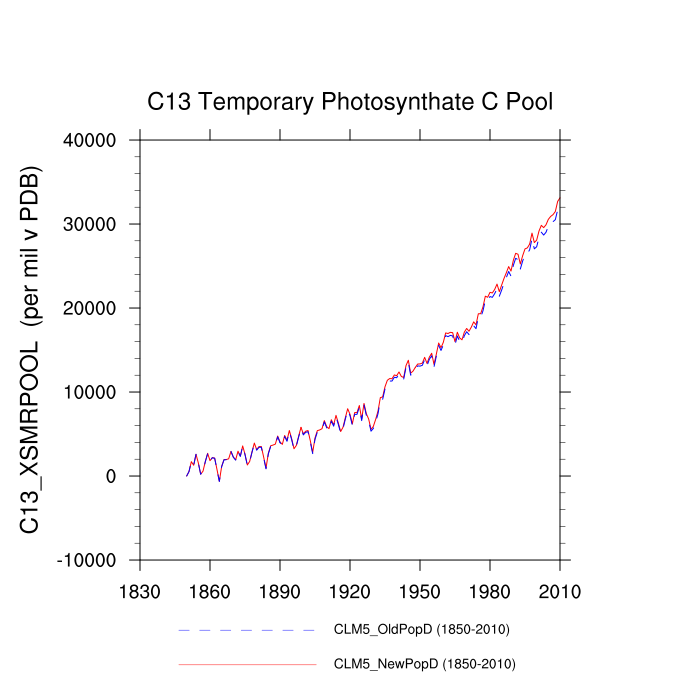
| C13 Temporary Photosynthate C Pool (C13_XSMRPOOL) | TrendPlot | --- | AnomalyPlot | ||
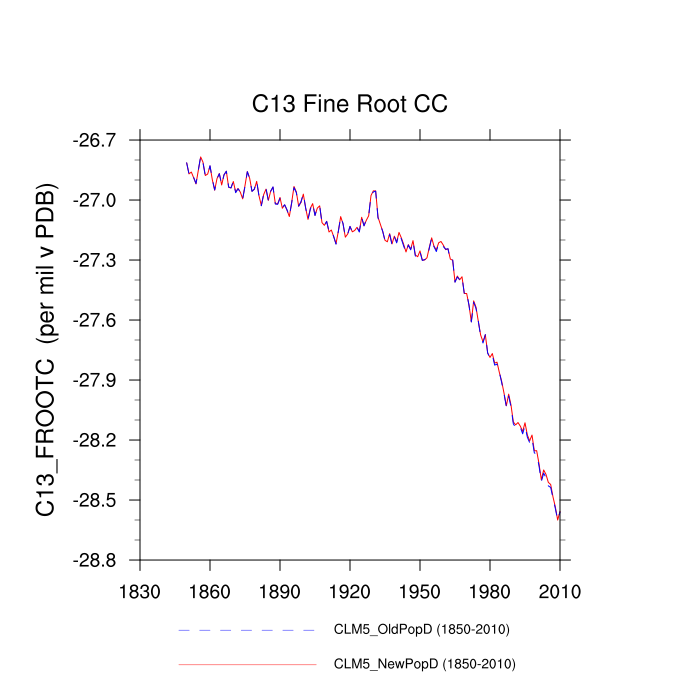
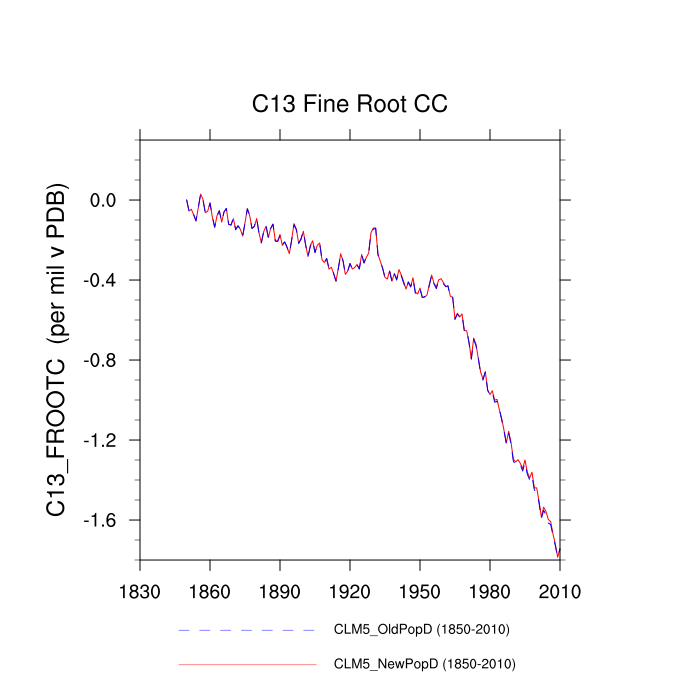
| C13 Fine Root CC (C13_FROOTC) | TrendPlot | --- | AnomalyPlot | ||
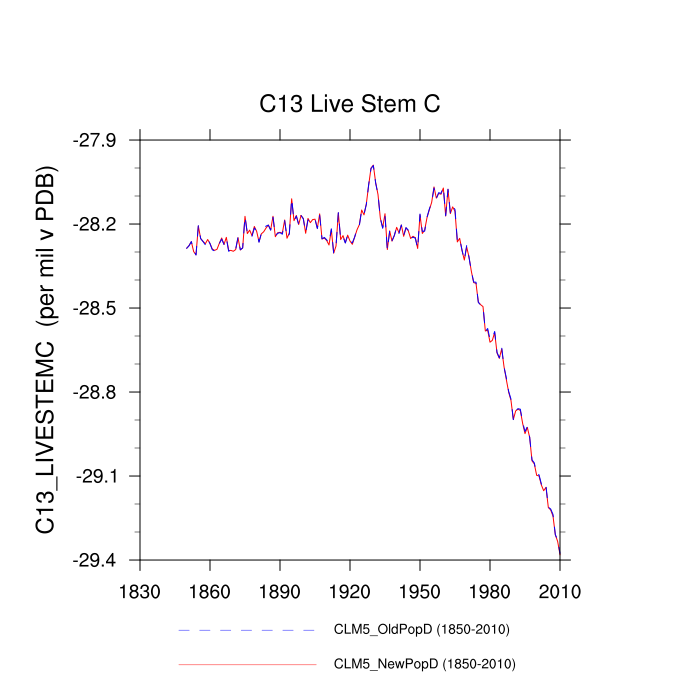
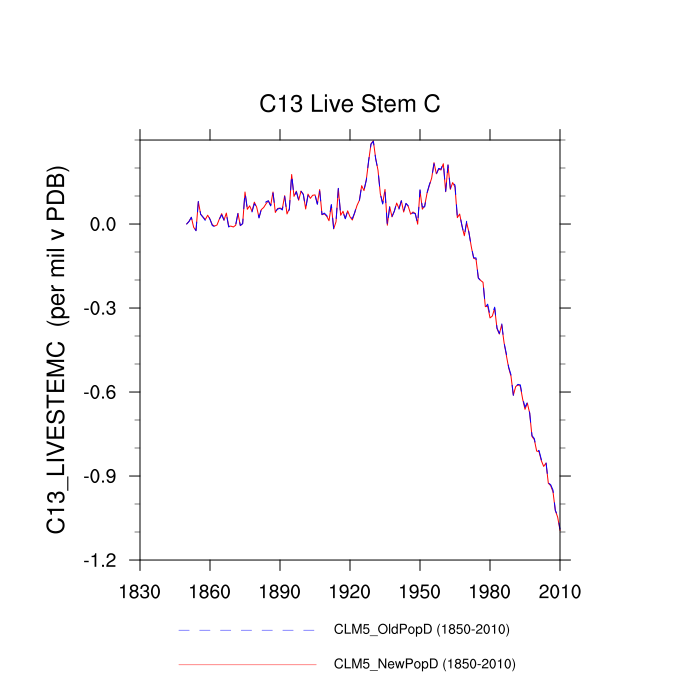
| C13 Live Stem C (C13_LIVESTEMC) | TrendPlot | --- | AnomalyPlot | ||
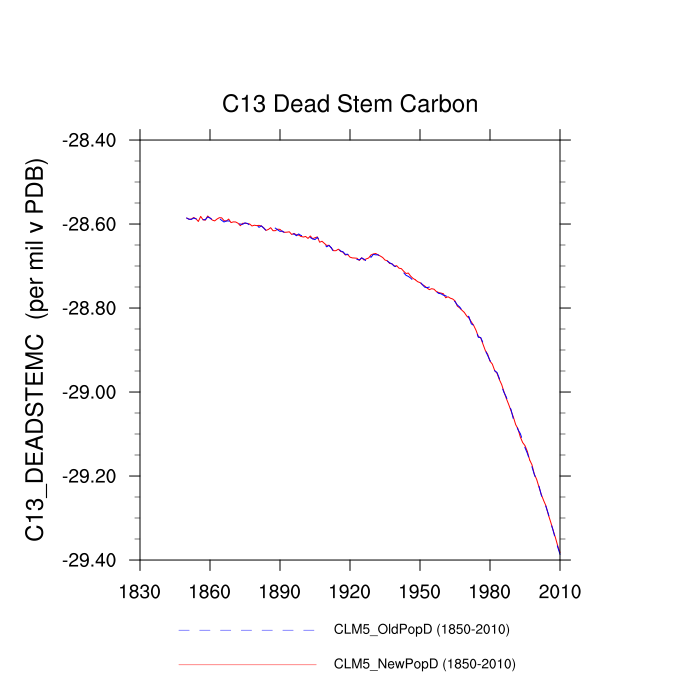
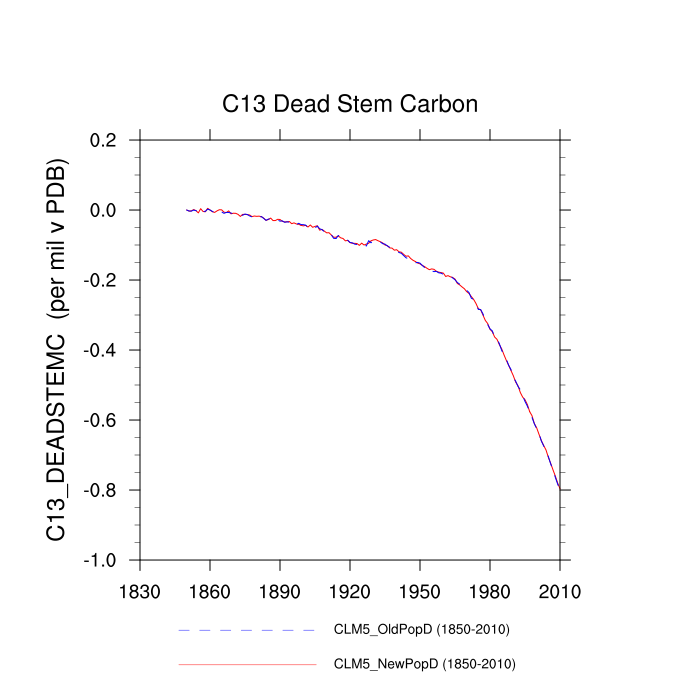
| C13 Dead Stem Carbon (C13_DEADSTEMC) | TrendPlot | --- | AnomalyPlot | ||
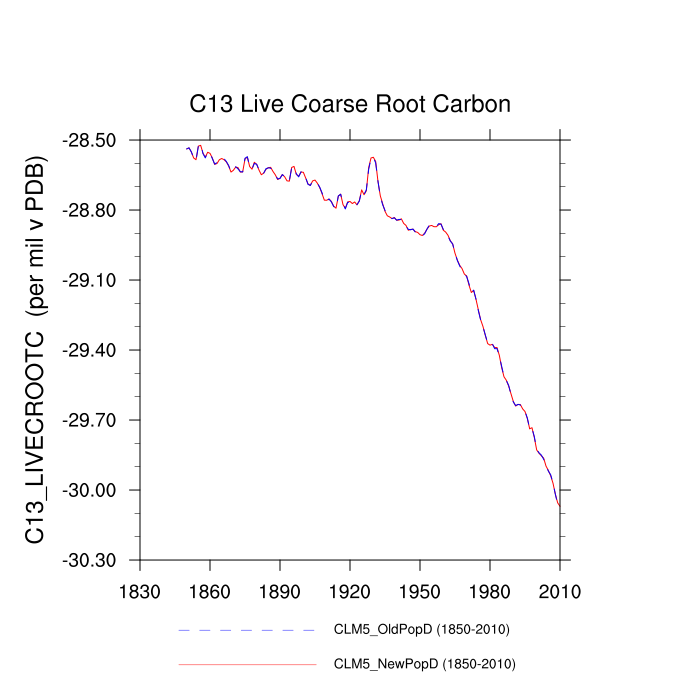
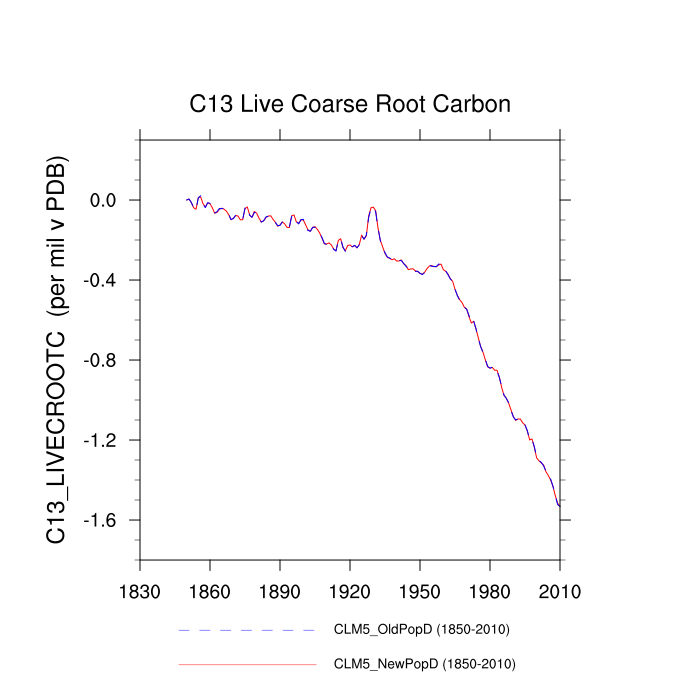
| C13 Live Coarse Root Carbon (C13_LIVECROOTC) | TrendPlot | --- | AnomalyPlot | ||
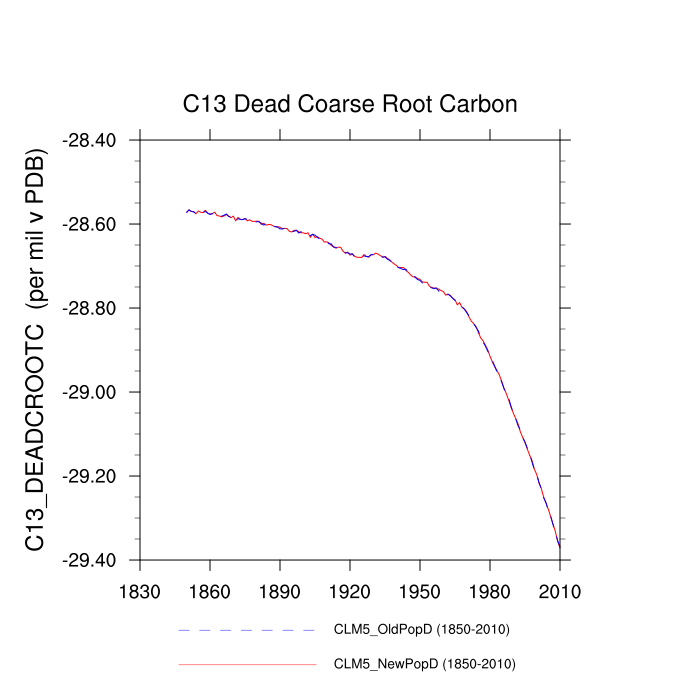
| C13 Dead Coarse Root Carbon (C13_DEADCROOTC) | TrendPlot | --- | AnomalyPlot | ||
| C13 Temporary Photosynthate C Pool (C13_CPOOL) | TrendPlot | --- | AnomalyPlot | ||
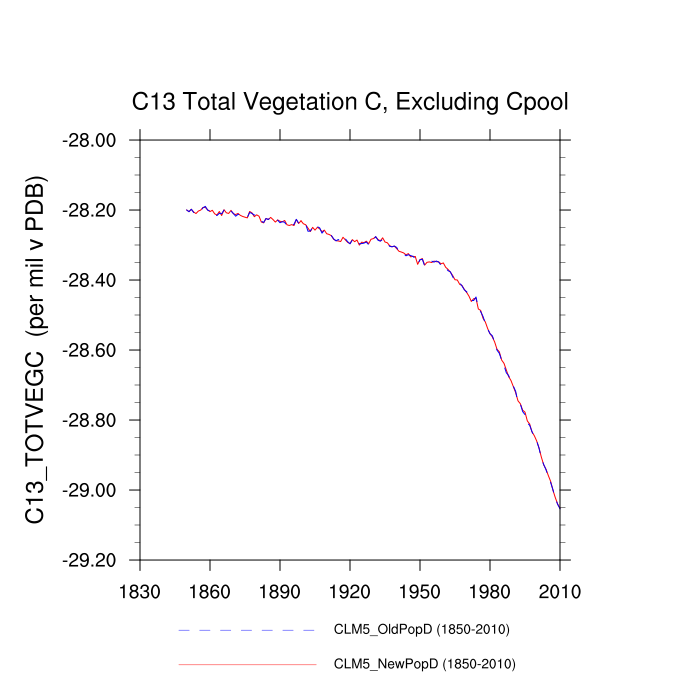
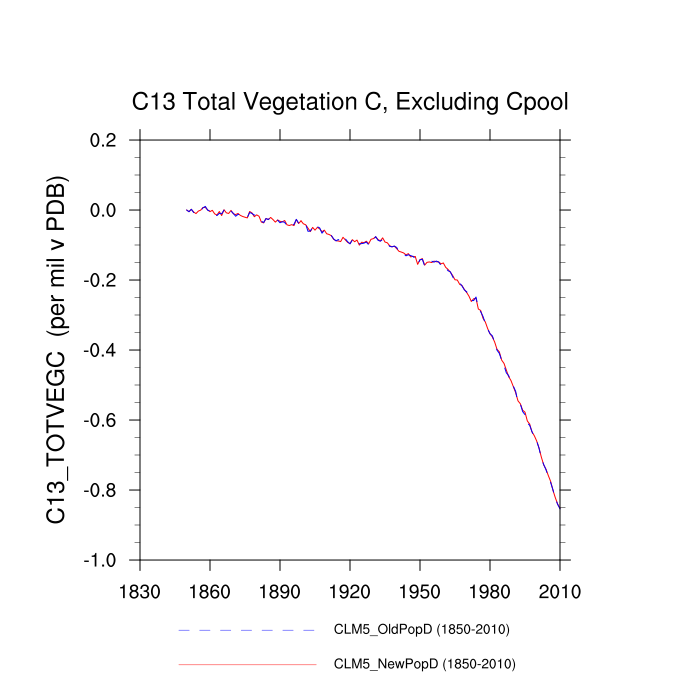
| C13 Total Vegetation C, Excluding Cpool (C13_TOTVEGC) | TrendPlot | --- | AnomalyPlot | ||
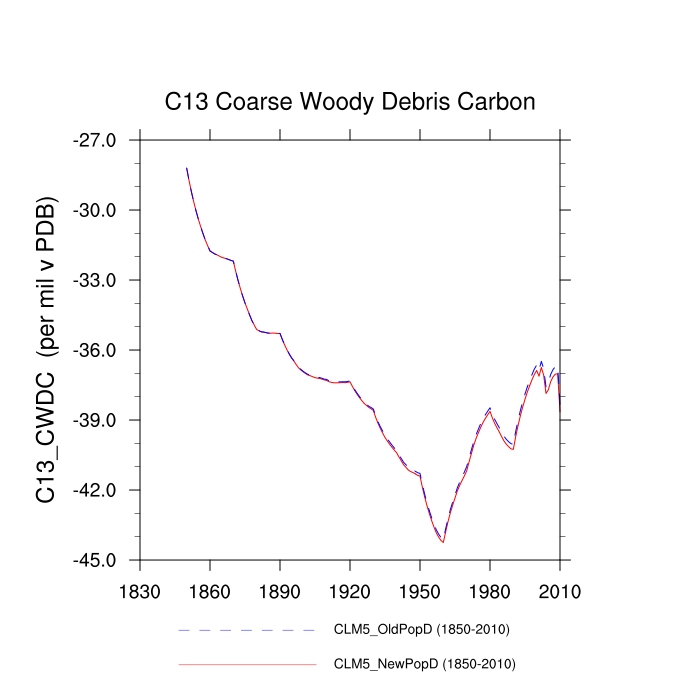
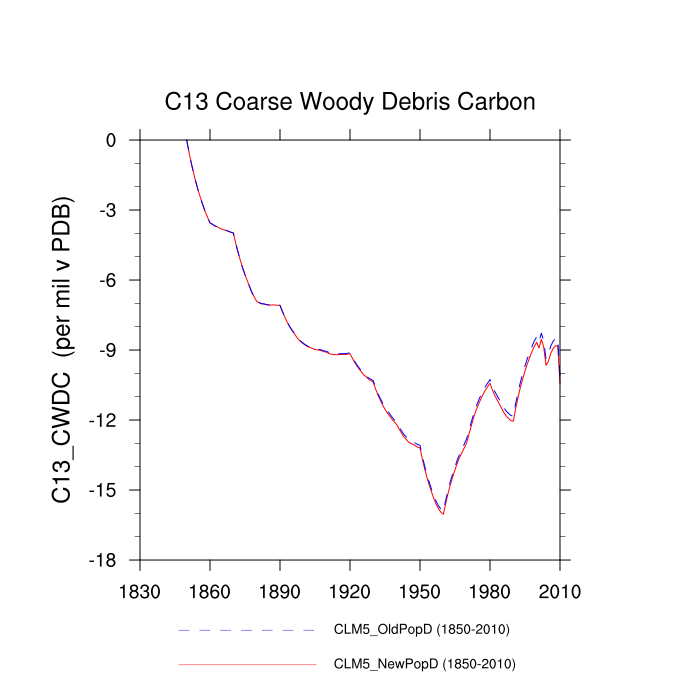
| C13 Coarse Woody Debris Carbon (C13_CWDC) | TrendPlot | --- | AnomalyPlot | ||
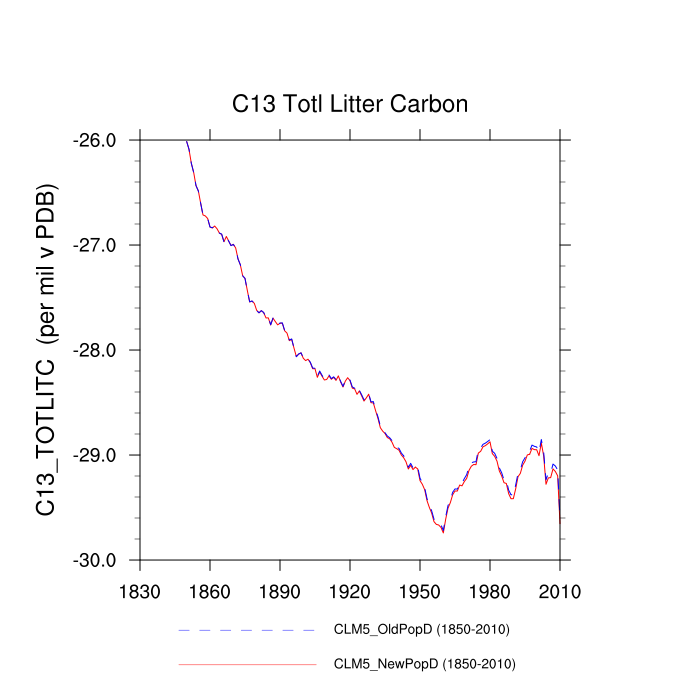
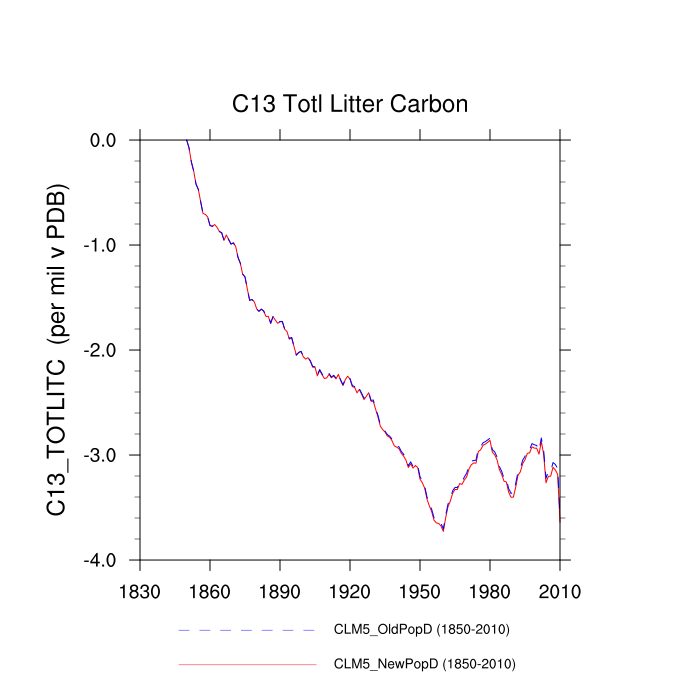
| C13 Totl Litter Carbon (C13_TOTLITC) | TrendPlot | --- | AnomalyPlot | ||
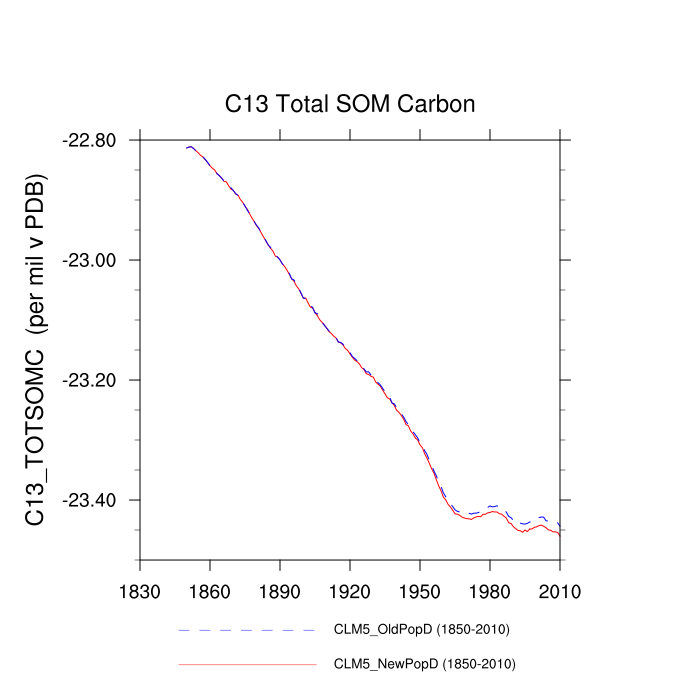
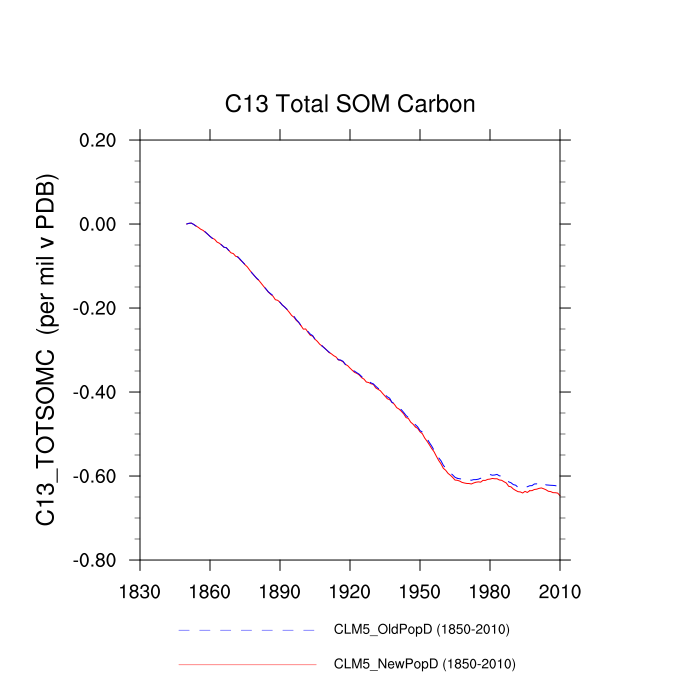
| C13 Total SOM Carbon (C13_TOTSOMC) | TrendPlot | --- | AnomalyPlot | ||
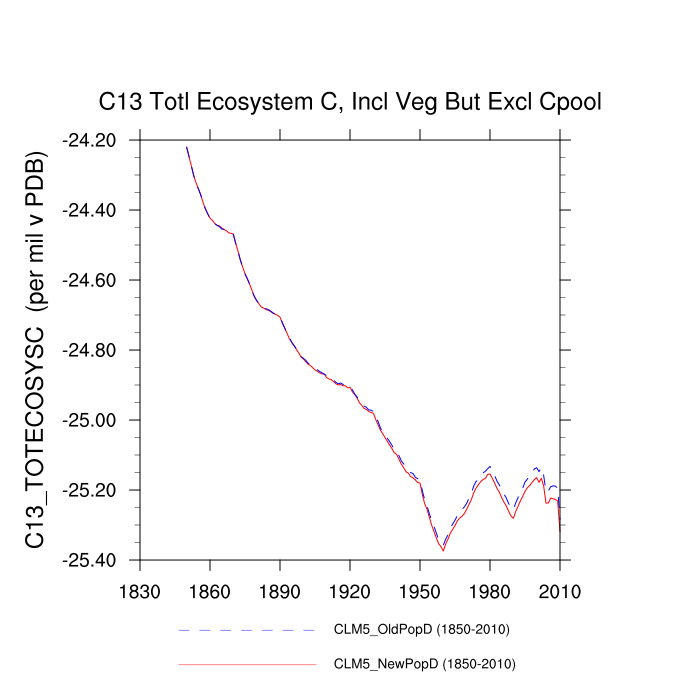
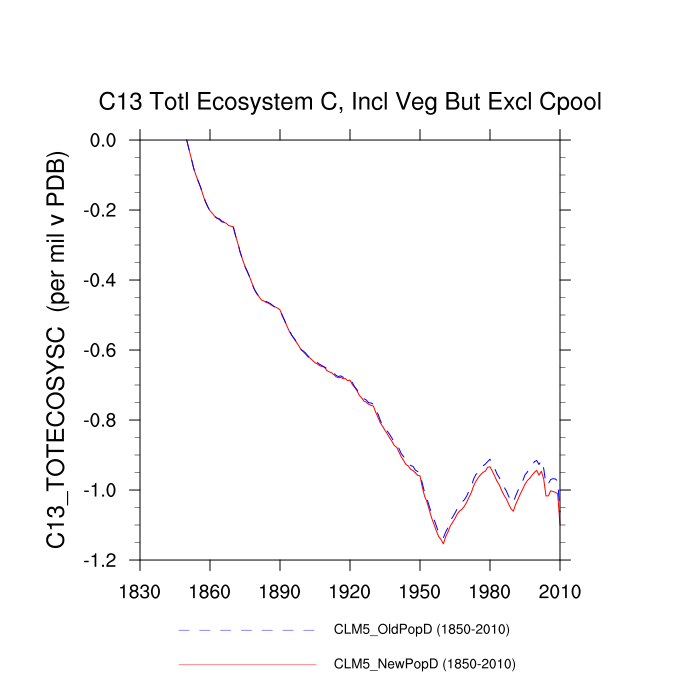
| C13 Totl Ecosystem C, Incl Veg But Excl Cpool (C13_TOTECOSYSC) | TrendPlot | --- | AnomalyPlot | ||
| C13 Column-Level Sink for C Truncation (C13_COL_CTRUNC) | --- | --- | --- | ||
| C13 Pft-Level Sink for C Truncation (C13_PFT_CTRUNC) | --- | --- | --- | ||
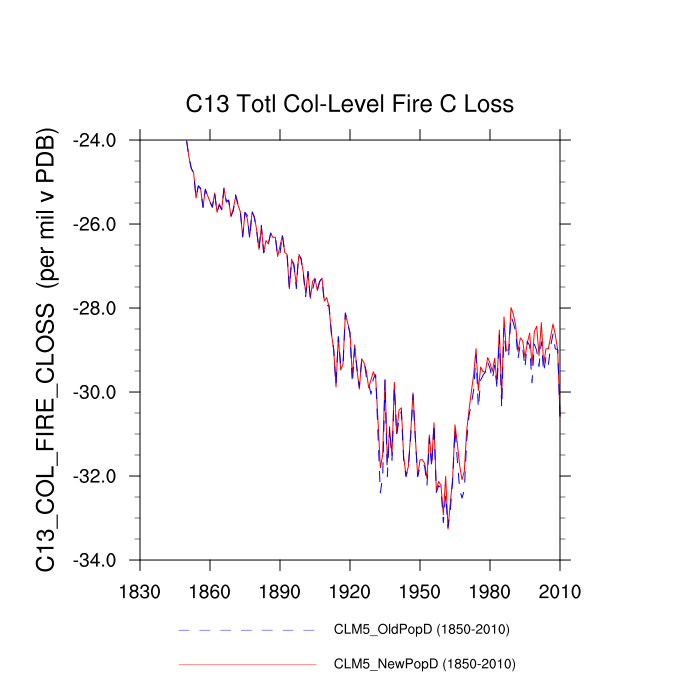
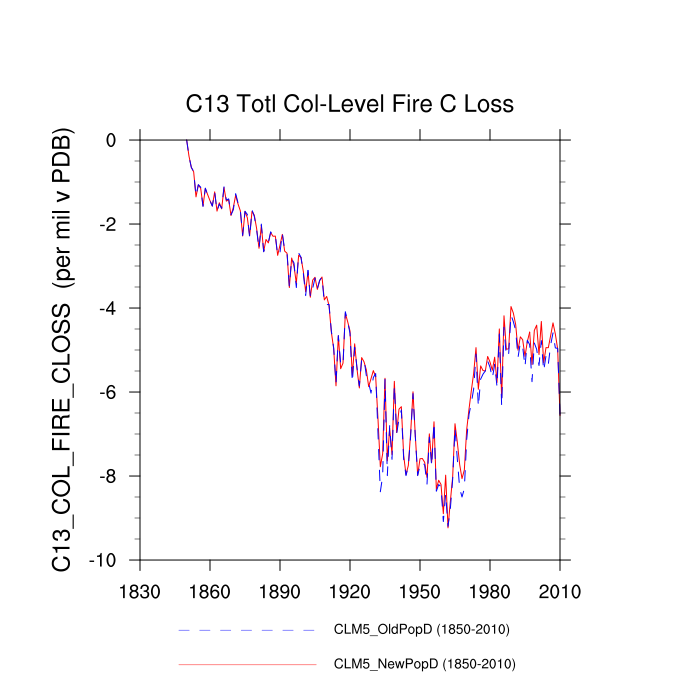
| C13 Totl Col-Level Fire C Loss (C13_COL_FIRE_CLOSS) | TrendPlot | --- | AnomalyPlot | ||
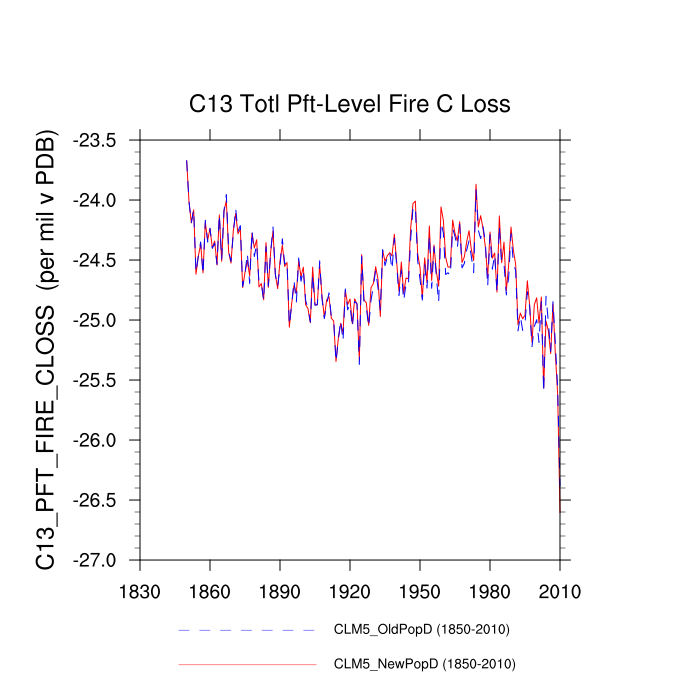
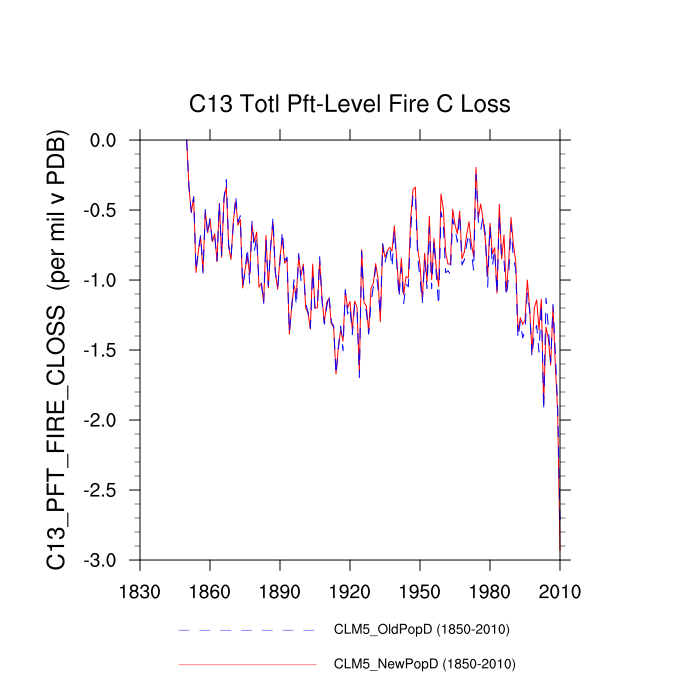
| C13 Totl Pft-Level Fire C Loss (C13_PFT_FIRE_CLOSS) | TrendPlot | --- | AnomalyPlot | ||