Mean State
Download Data |
Period Mean (original grids) [Pg] |
Model Period Mean (intersection) [Pg] |
Model Period Mean (complement) [Pg] |
Benchmark Period Mean (intersection) [Pg] |
Benchmark Period Mean (complement) [Pg] |
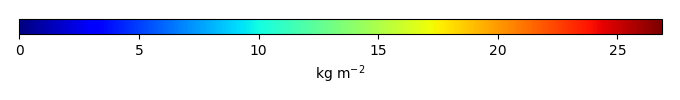
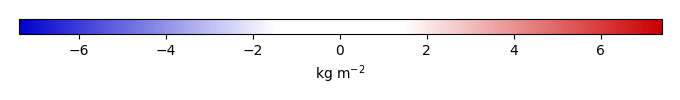
Bias [kg m-2] |
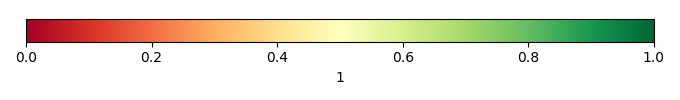
Bias Score [1] |
Spatial Distribution Score [1] |
Overall Score [1] |
|||
|---|---|---|---|---|---|---|---|---|---|---|---|---|
| Benchmark | [-] | 32.8 | ||||||||||
| CESM2_1 | [-] | 48.0 | 48.6 | 0.257 | 32.8 | 0.0526 | 4.17 | 0.594 | 0.822 | 0.708 | ||
| CRUJRA | [-] | 49.0 | 49.7 | 0.254 | 32.8 | 0.0526 | 4.44 | 0.592 | 0.819 | 0.706 | ||
| GSWP3 | [-] | 38.6 | 38.8 | 0.240 | 32.8 | 0.0526 | 1.75 | 0.717 | 0.925 | 0.821 | ||
| PRINCETON | [-] | 52.4 | 53.4 | 0.252 | 32.8 | 0.0526 | 5.35 | 0.551 | 0.788 | 0.670 |
Download Data |
Period Mean (original grids) [Pg] |
Model Period Mean (intersection) [Pg] |
Model Period Mean (complement) [Pg] |
Benchmark Period Mean (intersection) [Pg] |
Benchmark Period Mean (complement) [Pg] |
Bias [kg m-2] |
Bias Score [1] |
Spatial Distribution Score [1] |
Overall Score [1] |
|||
|---|---|---|---|---|---|---|---|---|---|---|---|---|
| Benchmark | [-] | 8.35 | ||||||||||
| CESM2_1 | [-] | 4.45 | 3.76 | 0.139 | 8.34 | 0.0114 | -0.786 | 0.502 | 0.818 | 0.660 | ||
| CRUJRA | [-] | 6.28 | 5.40 | 0.227 | 8.34 | 0.0114 | -0.498 | 0.545 | 0.847 | 0.696 | ||
| GSWP3 | [-] | 3.23 | 2.67 | 0.207 | 8.34 | 0.0114 | -0.981 | 0.476 | 0.622 | 0.549 | ||
| PRINCETON | [-] | 6.95 | 5.78 | 0.216 | 8.34 | 0.0114 | -0.428 | 0.537 | 0.816 | 0.676 |
Download Data |
Period Mean (original grids) [Pg] |
Model Period Mean (intersection) [Pg] |
Model Period Mean (complement) [Pg] |
Benchmark Period Mean (intersection) [Pg] |
Benchmark Period Mean (complement) [Pg] |
Bias [kg m-2] |
Bias Score [1] |
Spatial Distribution Score [1] |
Overall Score [1] |
|||
|---|---|---|---|---|---|---|---|---|---|---|---|---|
| Benchmark | [-] | 10.6 | ||||||||||
| CESM2_1 | [-] | 20.9 | 20.1 | 0.397 | 10.6 | 0.0246 | 1.20 | 0.446 | 0.400 | 0.423 | ||
| CRUJRA | [-] | 25.6 | 24.7 | 0.429 | 10.6 | 0.0246 | 1.75 | 0.415 | 0.362 | 0.389 | ||
| GSWP3 | [-] | 12.1 | 11.5 | 0.365 | 10.6 | 0.0246 | 0.280 | 0.502 | 0.560 | 0.531 | ||
| PRINCETON | [-] | 22.0 | 21.3 | 0.400 | 10.6 | 0.0246 | 1.37 | 0.436 | 0.385 | 0.411 |
Download Data |
Period Mean (original grids) [Pg] |
Model Period Mean (intersection) [Pg] |
Model Period Mean (complement) [Pg] |
Benchmark Period Mean (intersection) [Pg] |
Benchmark Period Mean (complement) [Pg] |
Bias [kg m-2] |
Bias Score [1] |
Spatial Distribution Score [1] |
Overall Score [1] |
|||
|---|---|---|---|---|---|---|---|---|---|---|---|---|
| Benchmark | [-] | 4.69 | ||||||||||
| CESM2_1 | [-] | 4.18 | 4.21 | 0.0241 | 4.67 | 0.0241 | -0.0653 | 0.602 | 0.873 | 0.738 | ||
| CRUJRA | [-] | 5.29 | 5.25 | 0.0759 | 4.67 | 0.0241 | 0.319 | 0.615 | 0.866 | 0.741 | ||
| GSWP3 | [-] | 4.15 | 4.10 | 0.0613 | 4.67 | 0.0241 | -0.0537 | 0.587 | 0.799 | 0.693 | ||
| PRINCETON | [-] | 10.4 | 10.4 | 0.108 | 4.67 | 0.0241 | 1.94 | 0.476 | 0.888 | 0.682 |
Download Data |
Period Mean (original grids) [Pg] |
Model Period Mean (intersection) [Pg] |
Model Period Mean (complement) [Pg] |
Benchmark Period Mean (intersection) [Pg] |
Benchmark Period Mean (complement) [Pg] |
Bias [kg m-2] |
Bias Score [1] |
Spatial Distribution Score [1] |
Overall Score [1] |
|||
|---|---|---|---|---|---|---|---|---|---|---|---|---|
| Benchmark | [-] | 27.8 | ||||||||||
| CESM2_1 | [-] | 45.7 | 43.9 | 1.68 | 26.8 | 0.921 | 9.85 | 0.517 | 0.915 | 0.716 | ||
| CRUJRA | [-] | 45.6 | 43.6 | 1.74 | 26.8 | 0.921 | 10.0 | 0.528 | 0.923 | 0.726 | ||
| GSWP3 | [-] | 39.8 | 38.1 | 1.50 | 26.8 | 0.921 | 7.85 | 0.607 | 0.919 | 0.763 | ||
| PRINCETON | [-] | 50.3 | 48.2 | 1.81 | 26.8 | 0.921 | 11.6 | 0.455 | 0.900 | 0.677 |
Download Data |
Period Mean (original grids) [Pg] |
Model Period Mean (intersection) [Pg] |
Model Period Mean (complement) [Pg] |
Benchmark Period Mean (intersection) [Pg] |
Benchmark Period Mean (complement) [Pg] |
Bias [kg m-2] |
Bias Score [1] |
Spatial Distribution Score [1] |
Overall Score [1] |
|||
|---|---|---|---|---|---|---|---|---|---|---|---|---|
| Benchmark | [-] | 43.5 | ||||||||||
| CESM2_1 | [-] | 55.6 | 54.5 | 0.264 | 43.5 | 0.0288 | 1.36 | 0.644 | 0.907 | 0.775 | ||
| CRUJRA | [-] | 76.0 | 74.4 | 0.338 | 43.5 | 0.0288 | 3.60 | 0.551 | 0.721 | 0.636 | ||
| GSWP3 | [-] | 53.4 | 52.3 | 0.323 | 43.5 | 0.0288 | 1.12 | 0.494 | 0.625 | 0.559 | ||
| PRINCETON | [-] | 99.2 | 97.2 | 0.404 | 43.5 | 0.0288 | 6.16 | 0.427 | 0.698 | 0.562 |
Download Data |
Period Mean (original grids) [Pg] |
Model Period Mean (intersection) [Pg] |
Model Period Mean (complement) [Pg] |
Benchmark Period Mean (intersection) [Pg] |
Benchmark Period Mean (complement) [Pg] |
Bias [kg m-2] |
Bias Score [1] |
Spatial Distribution Score [1] |
Overall Score [1] |
|||
|---|---|---|---|---|---|---|---|---|---|---|---|---|
| Benchmark | [-] | 32.0 | ||||||||||
| CESM2_1 | [-] | 34.2 | 34.4 | 0.737 | 31.9 | 0.0700 | 0.422 | 0.625 | 0.878 | 0.751 | ||
| CRUJRA | [-] | 37.4 | 37.4 | 0.828 | 31.9 | 0.0700 | 0.652 | 0.518 | 0.772 | 0.645 | ||
| GSWP3 | [-] | 32.4 | 32.5 | 0.635 | 31.9 | 0.0700 | 0.311 | 0.603 | 0.857 | 0.730 | ||
| PRINCETON | [-] | 48.8 | 49.3 | 0.816 | 31.9 | 0.0700 | 1.42 | 0.547 | 0.740 | 0.644 |
Download Data |
Period Mean (original grids) [Pg] |
Model Period Mean (intersection) [Pg] |
Model Period Mean (complement) [Pg] |
Benchmark Period Mean (intersection) [Pg] |
Benchmark Period Mean (complement) [Pg] |
Bias [kg m-2] |
Bias Score [1] |
Spatial Distribution Score [1] |
Overall Score [1] |
|||
|---|---|---|---|---|---|---|---|---|---|---|---|---|
| Benchmark | [-] | 21.1 | ||||||||||
| CESM2_1 | [-] | 24.7 | 23.3 | 0.612 | 20.9 | 0.146 | 1.31 | 0.572 | 0.799 | 0.685 | ||
| CRUJRA | [-] | 30.6 | 29.3 | 0.692 | 20.9 | 0.146 | 2.24 | 0.522 | 0.749 | 0.636 | ||
| GSWP3 | [-] | 25.0 | 23.5 | 0.612 | 20.9 | 0.146 | 1.31 | 0.599 | 0.818 | 0.709 | ||
| PRINCETON | [-] | 32.7 | 31.0 | 0.683 | 20.9 | 0.146 | 2.54 | 0.538 | 0.733 | 0.635 |
Download Data |
Period Mean (original grids) [Pg] |
Model Period Mean (intersection) [Pg] |
Model Period Mean (complement) [Pg] |
Benchmark Period Mean (intersection) [Pg] |
Benchmark Period Mean (complement) [Pg] |
Bias [kg m-2] |
Bias Score [1] |
Spatial Distribution Score [1] |
Overall Score [1] |
|||
|---|---|---|---|---|---|---|---|---|---|---|---|---|
| Benchmark | [-] | 3.81 | ||||||||||
| CESM2_1 | [-] | 2.61 | 2.75 | 0.0229 | 3.81 | 0.000319 | -0.293 | 0.542 | 0.832 | 0.687 | ||
| CRUJRA | [-] | 8.60 | 8.94 | 0.117 | 3.81 | 0.000319 | 1.56 | 0.495 | 0.783 | 0.639 | ||
| GSWP3 | [-] | 7.12 | 7.41 | 0.0931 | 3.81 | 0.000319 | 1.10 | 0.500 | 0.747 | 0.623 | ||
| PRINCETON | [-] | 11.9 | 12.3 | 0.128 | 3.81 | 0.000319 | 2.51 | 0.320 | 0.696 | 0.508 |
Download Data |
Period Mean (original grids) [Pg] |
Model Period Mean (intersection) [Pg] |
Model Period Mean (complement) [Pg] |
Benchmark Period Mean (intersection) [Pg] |
Benchmark Period Mean (complement) [Pg] |
Bias [kg m-2] |
Bias Score [1] |
Spatial Distribution Score [1] |
Overall Score [1] |
|||
|---|---|---|---|---|---|---|---|---|---|---|---|---|
| Benchmark | [-] | 9.16 | ||||||||||
| CESM2_1 | [-] | 11.7 | 10.8 | 0.729 | 8.87 | 0.289 | 0.791 | 0.617 | 0.847 | 0.732 | ||
| CRUJRA | [-] | 12.8 | 11.7 | 0.833 | 8.87 | 0.289 | 0.960 | 0.580 | 0.795 | 0.688 | ||
| GSWP3 | [-] | 11.0 | 10.0 | 0.829 | 8.87 | 0.289 | 0.761 | 0.605 | 0.812 | 0.708 | ||
| PRINCETON | [-] | 14.3 | 13.2 | 0.880 | 8.87 | 0.289 | 1.19 | 0.579 | 0.743 | 0.661 |
Download Data |
Period Mean (original grids) [Pg] |
Model Period Mean (intersection) [Pg] |
Model Period Mean (complement) [Pg] |
Benchmark Period Mean (intersection) [Pg] |
Benchmark Period Mean (complement) [Pg] |
Bias [kg m-2] |
Bias Score [1] |
Spatial Distribution Score [1] |
Overall Score [1] |
|||
|---|---|---|---|---|---|---|---|---|---|---|---|---|
| Benchmark | [-] | 12.0 | ||||||||||
| CESM2_1 | [-] | 14.6 | 14.0 | 0.335 | 12.0 | 0.0529 | 0.982 | 0.493 | 0.459 | 0.476 | ||
| CRUJRA | [-] | 24.8 | 23.8 | 0.614 | 12.0 | 0.0529 | 3.04 | 0.461 | 0.315 | 0.388 | ||
| GSWP3 | [-] | 18.5 | 17.6 | 0.537 | 12.0 | 0.0529 | 1.82 | 0.471 | 0.354 | 0.412 | ||
| PRINCETON | [-] | 26.2 | 25.1 | 0.644 | 12.0 | 0.0529 | 3.30 | 0.451 | 0.315 | 0.383 |
Download Data |
Period Mean (original grids) [Pg] |
Model Period Mean (intersection) [Pg] |
Model Period Mean (complement) [Pg] |
Benchmark Period Mean (intersection) [Pg] |
Benchmark Period Mean (complement) [Pg] |
Bias [kg m-2] |
Bias Score [1] |
Spatial Distribution Score [1] |
Overall Score [1] |
|||
|---|---|---|---|---|---|---|---|---|---|---|---|---|
| Benchmark | [-] | 368. | ||||||||||
| CESM2_1 | [-] | 487. | 478. | 8.77 | 363. | 4.62 | 1.43 | 0.573 | 0.784 | 0.678 | ||
| CRUJRA | [-] | 626. | 615. | 11.1 | 363. | 4.62 | 2.65 | 0.507 | 0.695 | 0.601 | ||
| GSWP3 | [-] | 491. | 481. | 9.76 | 363. | 4.62 | 1.49 | 0.573 | 0.782 | 0.677 | ||
| PRINCETON | [-] | 714. | 703. | 11.6 | 363. | 4.62 | 3.40 | 0.469 | 0.645 | 0.557 |
Download Data |
Period Mean (original grids) [Pg] |
Model Period Mean (intersection) [Pg] |
Model Period Mean (complement) [Pg] |
Benchmark Period Mean (intersection) [Pg] |
Benchmark Period Mean (complement) [Pg] |
Bias [kg m-2] |
Bias Score [1] |
Spatial Distribution Score [1] |
Overall Score [1] |
|||
|---|---|---|---|---|---|---|---|---|---|---|---|---|
| Benchmark | [-] | 1.24 | ||||||||||
| CESM2_1 | [-] | 1.15 | 0.883 | 0.287 | 1.23 | 0.00652 | -0.0478 | 0.477 | 0.365 | 0.421 | ||
| CRUJRA | [-] | 1.92 | 1.42 | 0.496 | 1.23 | 0.00652 | 0.0885 | 0.503 | 0.687 | 0.595 | ||
| GSWP3 | [-] | 1.59 | 1.26 | 0.342 | 1.23 | 0.00652 | 0.0758 | 0.509 | 0.746 | 0.627 | ||
| PRINCETON | [-] | 2.28 | 1.83 | 0.444 | 1.23 | 0.00652 | 0.209 | 0.513 | 0.697 | 0.605 |
Download Data |
Period Mean (original grids) [Pg] |
Model Period Mean (intersection) [Pg] |
Model Period Mean (complement) [Pg] |
Benchmark Period Mean (intersection) [Pg] |
Benchmark Period Mean (complement) [Pg] |
Bias [kg m-2] |
Bias Score [1] |
Spatial Distribution Score [1] |
Overall Score [1] |
|||
|---|---|---|---|---|---|---|---|---|---|---|---|---|
| Benchmark | [-] | 5.62 | ||||||||||
| CESM2_1 | [-] | 10.0 | 10.2 | 0.0616 | 5.59 | 0.0265 | 0.868 | 0.382 | 0.440 | 0.411 | ||
| CRUJRA | [-] | 16.4 | 16.0 | 0.321 | 5.59 | 0.0265 | 1.95 | 0.295 | 0.380 | 0.337 | ||
| GSWP3 | [-] | 14.9 | 14.5 | 0.221 | 5.59 | 0.0265 | 1.66 | 0.336 | 0.392 | 0.364 | ||
| PRINCETON | [-] | 22.3 | 21.9 | 0.408 | 5.59 | 0.0265 | 2.96 | 0.191 | 0.248 | 0.220 |
Download Data |
Period Mean (original grids) [Pg] |
Model Period Mean (intersection) [Pg] |
Model Period Mean (complement) [Pg] |
Benchmark Period Mean (intersection) [Pg] |
Benchmark Period Mean (complement) [Pg] |
Bias [kg m-2] |
Bias Score [1] |
Spatial Distribution Score [1] |
Overall Score [1] |
|||
|---|---|---|---|---|---|---|---|---|---|---|---|---|
| Benchmark | [-] | 8.21 | ||||||||||
| CESM2_1 | [-] | 9.84 | 9.22 | 0.390 | 8.09 | 0.122 | 1.43 | 0.552 | 0.686 | 0.619 | ||
| CRUJRA | [-] | 12.4 | 11.6 | 0.510 | 8.09 | 0.122 | 2.64 | 0.489 | 0.514 | 0.501 | ||
| GSWP3 | [-] | 10.2 | 9.51 | 0.475 | 8.09 | 0.122 | 1.76 | 0.538 | 0.598 | 0.568 | ||
| PRINCETON | [-] | 13.7 | 12.9 | 0.540 | 8.09 | 0.122 | 3.05 | 0.457 | 0.503 | 0.480 |
Download Data |
Period Mean (original grids) [Pg] |
Model Period Mean (intersection) [Pg] |
Model Period Mean (complement) [Pg] |
Benchmark Period Mean (intersection) [Pg] |
Benchmark Period Mean (complement) [Pg] |
Bias [kg m-2] |
Bias Score [1] |
Spatial Distribution Score [1] |
Overall Score [1] |
|||
|---|---|---|---|---|---|---|---|---|---|---|---|---|
| Benchmark | [-] | 14.8 | ||||||||||
| CESM2_1 | [-] | 9.53 | 9.29 | 0.156 | 14.8 | 0.0147 | -1.03 | 0.613 | 0.837 | 0.725 | ||
| CRUJRA | [-] | 18.0 | 17.7 | 0.222 | 14.8 | 0.0147 | 1.10 | 0.644 | 0.771 | 0.708 | ||
| GSWP3 | [-] | 11.9 | 11.7 | 0.182 | 14.8 | 0.0147 | -0.432 | 0.652 | 0.867 | 0.760 | ||
| PRINCETON | [-] | 19.2 | 18.8 | 0.232 | 14.8 | 0.0147 | 1.39 | 0.629 | 0.722 | 0.676 |
Download Data |
Period Mean (original grids) [Pg] |
Model Period Mean (intersection) [Pg] |
Model Period Mean (complement) [Pg] |
Benchmark Period Mean (intersection) [Pg] |
Benchmark Period Mean (complement) [Pg] |
Bias [kg m-2] |
Bias Score [1] |
Spatial Distribution Score [1] |
Overall Score [1] |
|||
|---|---|---|---|---|---|---|---|---|---|---|---|---|
| Benchmark | [-] | 20.1 | ||||||||||
| CESM2_1 | [-] | 35.2 | 34.7 | 0.213 | 19.8 | 0.219 | 3.19 | 0.502 | 0.737 | 0.620 | ||
| CRUJRA | [-] | 53.4 | 53.2 | 0.284 | 19.8 | 0.219 | 6.78 | 0.335 | 0.676 | 0.505 | ||
| GSWP3 | [-] | 44.5 | 44.4 | 0.247 | 19.8 | 0.219 | 5.07 | 0.395 | 0.711 | 0.553 | ||
| PRINCETON | [-] | 67.0 | 66.7 | 0.307 | 19.8 | 0.219 | 9.35 | 0.233 | 0.524 | 0.378 |
Download Data |
Period Mean (original grids) [Pg] |
Model Period Mean (intersection) [Pg] |
Model Period Mean (complement) [Pg] |
Benchmark Period Mean (intersection) [Pg] |
Benchmark Period Mean (complement) [Pg] |
Bias [kg m-2] |
Bias Score [1] |
Spatial Distribution Score [1] |
Overall Score [1] |
|||
|---|---|---|---|---|---|---|---|---|---|---|---|---|
| Benchmark | [-] | 8.04 | ||||||||||
| CESM2_1 | [-] | 1.65 | 1.64 | 0.0313 | 7.99 | 0.0515 | -1.46 | 0.448 | 0.253 | 0.351 | ||
| CRUJRA | [-] | 3.44 | 3.44 | 0.0455 | 7.99 | 0.0515 | -0.990 | 0.523 | 0.620 | 0.571 | ||
| GSWP3 | [-] | 3.12 | 3.12 | 0.0352 | 7.99 | 0.0515 | -1.09 | 0.513 | 0.490 | 0.502 | ||
| PRINCETON | [-] | 6.93 | 6.90 | 0.0529 | 7.99 | 0.0515 | -0.132 | 0.594 | 0.841 | 0.718 |
Download Data |
Period Mean (original grids) [Pg] |
Model Period Mean (intersection) [Pg] |
Model Period Mean (complement) [Pg] |
Benchmark Period Mean (intersection) [Pg] |
Benchmark Period Mean (complement) [Pg] |
Bias [kg m-2] |
Bias Score [1] |
Spatial Distribution Score [1] |
Overall Score [1] |
|||
|---|---|---|---|---|---|---|---|---|---|---|---|---|
| Benchmark | [-] | 88.9 | ||||||||||
| CESM2_1 | [-] | 130. | 129. | 0.290 | 88.8 | 0.0655 | 5.10 | 0.603 | 0.890 | 0.747 | ||
| CRUJRA | [-] | 163. | 162. | 0.398 | 88.8 | 0.0655 | 9.05 | 0.497 | 0.874 | 0.686 | ||
| GSWP3 | [-] | 129. | 128. | 0.374 | 88.8 | 0.0655 | 5.01 | 0.645 | 0.945 | 0.795 | ||
| PRINCETON | [-] | 168. | 167. | 0.429 | 88.8 | 0.0655 | 9.66 | 0.473 | 0.877 | 0.675 |
Download Data |
Period Mean (original grids) [Pg] |
Model Period Mean (intersection) [Pg] |
Model Period Mean (complement) [Pg] |
Benchmark Period Mean (intersection) [Pg] |
Benchmark Period Mean (complement) [Pg] |
Bias [kg m-2] |
Bias Score [1] |
Spatial Distribution Score [1] |
Overall Score [1] |
|||
|---|---|---|---|---|---|---|---|---|---|---|---|---|
| Benchmark | [-] | 9.09 | ||||||||||
| CESM2_1 | [-] | 13.6 | 13.8 | 0.211 | 9.08 | 0.0128 | 0.901 | 0.517 | 0.453 | 0.485 | ||
| CRUJRA | [-] | 28.2 | 28.5 | 0.302 | 9.08 | 0.0128 | 3.14 | 0.312 | 0.328 | 0.320 | ||
| GSWP3 | [-] | 21.8 | 21.9 | 0.283 | 9.08 | 0.0128 | 2.14 | 0.322 | 0.298 | 0.310 | ||
| PRINCETON | [-] | 29.9 | 30.1 | 0.325 | 9.08 | 0.0128 | 3.40 | 0.294 | 0.295 | 0.294 |
Download Data |
Period Mean (original grids) [Pg] |
Model Period Mean (intersection) [Pg] |
Model Period Mean (complement) [Pg] |
Benchmark Period Mean (intersection) [Pg] |
Benchmark Period Mean (complement) [Pg] |
Bias [kg m-2] |
Bias Score [1] |
Spatial Distribution Score [1] |
Overall Score [1] |
|||
|---|---|---|---|---|---|---|---|---|---|---|---|---|
| Benchmark | [-] | 2.45 | ||||||||||
| CESM2_1 | [-] | 7.17 | 7.07 | 0.136 | 2.40 | 0.0496 | 1.98 | 0.409 | 0.382 | 0.396 | ||
| CRUJRA | [-] | 5.20 | 5.09 | 0.143 | 2.40 | 0.0496 | 1.68 | 0.348 | 0.289 | 0.319 | ||
| GSWP3 | [-] | 6.27 | 6.16 | 0.140 | 2.40 | 0.0496 | 1.92 | 0.354 | 0.319 | 0.336 | ||
| PRINCETON | [-] | 7.48 | 7.40 | 0.131 | 2.40 | 0.0496 | 2.39 | 0.314 | 0.275 | 0.295 |
Temporally integrated period mean