Mean State
Download Data |
Period Mean (original grids) [Pg] |
Model Period Mean (intersection) [Pg] |
Model Period Mean (complement) [Pg] |
Benchmark Period Mean (intersection) [Pg] |
Benchmark Period Mean (complement) [Pg] |
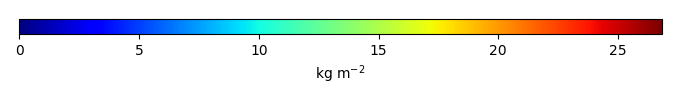
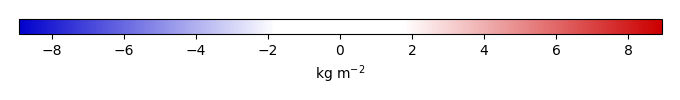
Bias [kg m-2] |
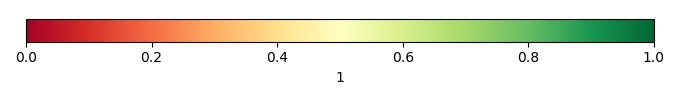
Bias Score [1] |
Spatial Distribution Score [1] |
Overall Score [1] |
|||
|---|---|---|---|---|---|---|---|---|---|---|---|---|
| Benchmark | [-] | 38.7 | ||||||||||
| CESM2_1 | [-] | 48.0 | 48.6 | 0.213 | 38.7 | 0.0457 | 2.55 | 0.668 | 0.866 | 0.767 | ||
| CRUJRA | [-] | 49.0 | 49.7 | 0.214 | 38.7 | 0.0457 | 2.81 | 0.667 | 0.864 | 0.766 | ||
| GSWP3 | [-] | 38.6 | 38.8 | 0.203 | 38.7 | 0.0457 | 0.312 | 0.774 | 0.951 | 0.863 | ||
| PRINCETON | [-] | 52.4 | 53.4 | 0.220 | 38.7 | 0.0457 | 3.65 | 0.630 | 0.833 | 0.732 |
Download Data |
Period Mean (original grids) [Pg] |
Model Period Mean (intersection) [Pg] |
Model Period Mean (complement) [Pg] |
Benchmark Period Mean (intersection) [Pg] |
Benchmark Period Mean (complement) [Pg] |
Bias [kg m-2] |
Bias Score [1] |
Spatial Distribution Score [1] |
Overall Score [1] |
|||
|---|---|---|---|---|---|---|---|---|---|---|---|---|
| Benchmark | [-] | 11.9 | ||||||||||
| CESM2_1 | [-] | 4.43 | 3.84 | 0.0294 | 11.9 | 0.0196 | -1.19 | 0.467 | 0.782 | 0.624 | ||
| CRUJRA | [-] | 6.29 | 5.58 | 0.0492 | 11.9 | 0.0196 | -0.936 | 0.504 | 0.820 | 0.662 | ||
| GSWP3 | [-] | 3.23 | 2.83 | 0.0442 | 11.9 | 0.0196 | -1.35 | 0.453 | 0.593 | 0.523 | ||
| PRINCETON | [-] | 6.98 | 5.98 | 0.0451 | 11.9 | 0.0196 | -0.873 | 0.491 | 0.792 | 0.642 |
Download Data |
Period Mean (original grids) [Pg] |
Model Period Mean (intersection) [Pg] |
Model Period Mean (complement) [Pg] |
Benchmark Period Mean (intersection) [Pg] |
Benchmark Period Mean (complement) [Pg] |
Bias [kg m-2] |
Bias Score [1] |
Spatial Distribution Score [1] |
Overall Score [1] |
|||
|---|---|---|---|---|---|---|---|---|---|---|---|---|
| Benchmark | [-] | 24.6 | ||||||||||
| CESM2_1 | [-] | 20.9 | 20.2 | 0.348 | 24.5 | 0.0612 | -0.330 | 0.532 | 0.682 | 0.607 | ||
| CRUJRA | [-] | 25.6 | 24.8 | 0.410 | 24.5 | 0.0612 | 0.197 | 0.537 | 0.637 | 0.587 | ||
| GSWP3 | [-] | 12.1 | 11.5 | 0.368 | 24.5 | 0.0612 | -1.22 | 0.505 | 0.797 | 0.651 | ||
| PRINCETON | [-] | 22.0 | 21.2 | 0.413 | 24.5 | 0.0612 | -0.177 | 0.536 | 0.665 | 0.601 |
Download Data |
Period Mean (original grids) [Pg] |
Model Period Mean (intersection) [Pg] |
Model Period Mean (complement) [Pg] |
Benchmark Period Mean (intersection) [Pg] |
Benchmark Period Mean (complement) [Pg] |
Bias [kg m-2] |
Bias Score [1] |
Spatial Distribution Score [1] |
Overall Score [1] |
|||
|---|---|---|---|---|---|---|---|---|---|---|---|---|
| Benchmark | [-] | 36.8 | ||||||||||
| CESM2_1 | [-] | 45.7 | 43.5 | 2.02 | 35.7 | 1.10 | 7.14 | 0.649 | 0.935 | 0.792 | ||
| CRUJRA | [-] | 45.6 | 43.2 | 2.10 | 35.7 | 1.10 | 7.28 | 0.672 | 0.930 | 0.801 | ||
| GSWP3 | [-] | 39.8 | 37.8 | 1.80 | 35.7 | 1.10 | 5.12 | 0.716 | 0.918 | 0.817 | ||
| PRINCETON | [-] | 50.3 | 47.8 | 2.17 | 35.7 | 1.10 | 8.88 | 0.607 | 0.927 | 0.767 |
Download Data |
Period Mean (original grids) [Pg] |
Model Period Mean (intersection) [Pg] |
Model Period Mean (complement) [Pg] |
Benchmark Period Mean (intersection) [Pg] |
Benchmark Period Mean (complement) [Pg] |
Bias [kg m-2] |
Bias Score [1] |
Spatial Distribution Score [1] |
Overall Score [1] |
|||
|---|---|---|---|---|---|---|---|---|---|---|---|---|
| Benchmark | [-] | 38.4 | ||||||||||
| CESM2_1 | [-] | 34.2 | 23.3 | 11.8 | 38.3 | 0.0891 | -1.52 | 0.613 | 0.851 | 0.732 | ||
| CRUJRA | [-] | 37.3 | 24.0 | 14.2 | 38.3 | 0.0891 | -1.38 | 0.553 | 0.712 | 0.632 | ||
| GSWP3 | [-] | 32.4 | 23.8 | 9.37 | 38.3 | 0.0891 | -1.45 | 0.587 | 0.793 | 0.690 | ||
| PRINCETON | [-] | 48.8 | 32.3 | 17.8 | 38.3 | 0.0891 | -0.222 | 0.601 | 0.682 | 0.641 |
Download Data |
Period Mean (original grids) [Pg] |
Model Period Mean (intersection) [Pg] |
Model Period Mean (complement) [Pg] |
Benchmark Period Mean (intersection) [Pg] |
Benchmark Period Mean (complement) [Pg] |
Bias [kg m-2] |
Bias Score [1] |
Spatial Distribution Score [1] |
Overall Score [1] |
|||
|---|---|---|---|---|---|---|---|---|---|---|---|---|
| Benchmark | [-] | 43.7 | ||||||||||
| CESM2_1 | [-] | 24.7 | 23.2 | 0.675 | 43.4 | 0.257 | -1.94 | 0.593 | 0.878 | 0.736 | ||
| CRUJRA | [-] | 30.6 | 29.2 | 0.739 | 43.4 | 0.257 | -1.05 | 0.631 | 0.876 | 0.753 | ||
| GSWP3 | [-] | 25.0 | 23.5 | 0.673 | 43.4 | 0.257 | -1.94 | 0.608 | 0.890 | 0.749 | ||
| PRINCETON | [-] | 32.7 | 31.0 | 0.750 | 43.4 | 0.257 | -0.764 | 0.638 | 0.865 | 0.752 |
Download Data |
Period Mean (original grids) [Pg] |
Model Period Mean (intersection) [Pg] |
Model Period Mean (complement) [Pg] |
Benchmark Period Mean (intersection) [Pg] |
Benchmark Period Mean (complement) [Pg] |
Bias [kg m-2] |
Bias Score [1] |
Spatial Distribution Score [1] |
Overall Score [1] |
|||
|---|---|---|---|---|---|---|---|---|---|---|---|---|
| Benchmark | [-] | 13.7 | ||||||||||
| CESM2_1 | [-] | 11.7 | 4.30 | 7.27 | 13.5 | 0.139 | -1.28 | 0.459 | 0.598 | 0.528 | ||
| CRUJRA | [-] | 12.8 | 5.45 | 7.09 | 13.5 | 0.139 | -1.08 | 0.484 | 0.584 | 0.534 | ||
| GSWP3 | [-] | 11.0 | 3.66 | 7.17 | 13.5 | 0.139 | -1.38 | 0.444 | 0.636 | 0.540 | ||
| PRINCETON | [-] | 14.2 | 5.70 | 8.31 | 13.5 | 0.139 | -1.01 | 0.463 | 0.472 | 0.468 |
Download Data |
Period Mean (original grids) [Pg] |
Model Period Mean (intersection) [Pg] |
Model Period Mean (complement) [Pg] |
Benchmark Period Mean (intersection) [Pg] |
Benchmark Period Mean (complement) [Pg] |
Bias [kg m-2] |
Bias Score [1] |
Spatial Distribution Score [1] |
Overall Score [1] |
|||
|---|---|---|---|---|---|---|---|---|---|---|---|---|
| Benchmark | [-] | 352. | ||||||||||
| CESM2_1 | [-] | 486. | 328. | 158. | 348. | 3.81 | 0.331 | 0.614 | 0.819 | 0.716 | ||
| CRUJRA | [-] | 626. | 394. | 232. | 348. | 3.81 | 1.36 | 0.579 | 0.756 | 0.668 | ||
| GSWP3 | [-] | 490. | 310. | 181. | 348. | 3.81 | 0.0772 | 0.638 | 0.853 | 0.746 | ||
| PRINCETON | [-] | 714. | 420. | 294. | 348. | 3.81 | 1.75 | 0.567 | 0.729 | 0.648 |
Download Data |
Period Mean (original grids) [Pg] |
Model Period Mean (intersection) [Pg] |
Model Period Mean (complement) [Pg] |
Benchmark Period Mean (intersection) [Pg] |
Benchmark Period Mean (complement) [Pg] |
Bias [kg m-2] |
Bias Score [1] |
Spatial Distribution Score [1] |
Overall Score [1] |
|||
|---|---|---|---|---|---|---|---|---|---|---|---|---|
| Benchmark | [-] | 2.53 | ||||||||||
| CESM2_1 | [-] | 1.14 | 0.220 | 0.939 | 2.53 | 0.00250 | -1.04 | 0.399 | 0.0286 | 0.214 | ||
| CRUJRA | [-] | 1.92 | 0.288 | 1.62 | 2.53 | 0.00250 | -1.01 | 0.400 | 0.0297 | 0.215 | ||
| GSWP3 | [-] | 1.59 | 0.213 | 1.39 | 2.53 | 0.00250 | -1.04 | 0.395 | 0.0215 | 0.208 | ||
| PRINCETON | [-] | 2.28 | 0.263 | 2.01 | 2.53 | 0.00250 | -1.02 | 0.401 | 0.0322 | 0.216 |
Download Data |
Period Mean (original grids) [Pg] |
Model Period Mean (intersection) [Pg] |
Model Period Mean (complement) [Pg] |
Benchmark Period Mean (intersection) [Pg] |
Benchmark Period Mean (complement) [Pg] |
Bias [kg m-2] |
Bias Score [1] |
Spatial Distribution Score [1] |
Overall Score [1] |
|||
|---|---|---|---|---|---|---|---|---|---|---|---|---|
| Benchmark | [-] | 11.1 | ||||||||||
| CESM2_1 | [-] | 9.83 | 9.15 | 0.448 | 10.9 | 0.149 | 0.516 | 0.602 | 0.832 | 0.717 | ||
| CRUJRA | [-] | 12.4 | 11.5 | 0.591 | 10.9 | 0.149 | 1.72 | 0.567 | 0.701 | 0.634 | ||
| GSWP3 | [-] | 10.2 | 9.43 | 0.548 | 10.9 | 0.149 | 0.831 | 0.607 | 0.774 | 0.691 | ||
| PRINCETON | [-] | 13.7 | 12.8 | 0.623 | 10.9 | 0.149 | 2.13 | 0.558 | 0.692 | 0.625 |
Download Data |
Period Mean (original grids) [Pg] |
Model Period Mean (intersection) [Pg] |
Model Period Mean (complement) [Pg] |
Benchmark Period Mean (intersection) [Pg] |
Benchmark Period Mean (complement) [Pg] |
Bias [kg m-2] |
Bias Score [1] |
Spatial Distribution Score [1] |
Overall Score [1] |
|||
|---|---|---|---|---|---|---|---|---|---|---|---|---|
| Benchmark | [-] | 1.55 | ||||||||||
| CESM2_1 | [-] | 9.51 | 1.37 | 8.06 | 1.52 | 0.0247 | 0.411 | 0.500 | 0.583 | 0.542 | ||
| CRUJRA | [-] | 18.0 | 3.74 | 14.2 | 1.52 | 0.0247 | 3.78 | 0.488 | 0.524 | 0.506 | ||
| GSWP3 | [-] | 11.9 | 1.28 | 10.5 | 1.52 | 0.0247 | 0.374 | 0.548 | 0.689 | 0.619 | ||
| PRINCETON | [-] | 19.2 | 3.80 | 15.2 | 1.52 | 0.0247 | 3.89 | 0.476 | 0.499 | 0.487 |
Download Data |
Period Mean (original grids) [Pg] |
Model Period Mean (intersection) [Pg] |
Model Period Mean (complement) [Pg] |
Benchmark Period Mean (intersection) [Pg] |
Benchmark Period Mean (complement) [Pg] |
Bias [kg m-2] |
Bias Score [1] |
Spatial Distribution Score [1] |
Overall Score [1] |
|||
|---|---|---|---|---|---|---|---|---|---|---|---|---|
| Benchmark | [-] | 0.219 | ||||||||||
| CESM2_1 | [-] | 1.65 | 0.0965 | 1.57 | 0.219 | -0.393 | 0.488 | 0.205 | 0.346 | |||
| CRUJRA | [-] | 3.43 | 0.124 | 3.35 | 0.219 | -0.311 | 0.519 | 0.219 | 0.369 | |||
| GSWP3 | [-] | 3.12 | 0.0823 | 3.07 | 0.219 | -0.440 | 0.466 | 0.0843 | 0.275 | |||
| PRINCETON | [-] | 6.92 | 0.0851 | 6.86 | 0.219 | -0.430 | 0.482 | 0.164 | 0.323 |
Download Data |
Period Mean (original grids) [Pg] |
Model Period Mean (intersection) [Pg] |
Model Period Mean (complement) [Pg] |
Benchmark Period Mean (intersection) [Pg] |
Benchmark Period Mean (complement) [Pg] |
Bias [kg m-2] |
Bias Score [1] |
Spatial Distribution Score [1] |
Overall Score [1] |
|||
|---|---|---|---|---|---|---|---|---|---|---|---|---|
| Benchmark | [-] | 100. | ||||||||||
| CESM2_1 | [-] | 130. | 129. | 0.323 | 100. | 0.0690 | 3.73 | 0.662 | 0.848 | 0.755 | ||
| CRUJRA | [-] | 163. | 162. | 0.427 | 100. | 0.0690 | 7.69 | 0.552 | 0.825 | 0.689 | ||
| GSWP3 | [-] | 128. | 128. | 0.396 | 100. | 0.0690 | 3.64 | 0.709 | 0.919 | 0.814 | ||
| PRINCETON | [-] | 168. | 167. | 0.454 | 100. | 0.0690 | 8.29 | 0.535 | 0.827 | 0.681 |
Download Data |
Period Mean (original grids) [Pg] |
Model Period Mean (intersection) [Pg] |
Model Period Mean (complement) [Pg] |
Benchmark Period Mean (intersection) [Pg] |
Benchmark Period Mean (complement) [Pg] |
Bias [kg m-2] |
Bias Score [1] |
Spatial Distribution Score [1] |
Overall Score [1] |
|||
|---|---|---|---|---|---|---|---|---|---|---|---|---|
| Benchmark | [-] | 18.4 | ||||||||||
| CESM2_1 | [-] | 13.6 | 13.7 | 0.250 | 18.4 | 0.0281 | -0.496 | 0.608 | 0.779 | 0.693 | ||
| CRUJRA | [-] | 28.3 | 28.4 | 0.368 | 18.4 | 0.0281 | 1.74 | 0.541 | 0.633 | 0.587 | ||
| GSWP3 | [-] | 21.9 | 21.8 | 0.347 | 18.4 | 0.0281 | 0.741 | 0.546 | 0.579 | 0.562 | ||
| PRINCETON | [-] | 29.9 | 30.1 | 0.397 | 18.4 | 0.0281 | 2.01 | 0.530 | 0.594 | 0.562 |
Download Data |
Period Mean (original grids) [Pg] |
Model Period Mean (intersection) [Pg] |
Model Period Mean (complement) [Pg] |
Benchmark Period Mean (intersection) [Pg] |
Benchmark Period Mean (complement) [Pg] |
Bias [kg m-2] |
Bias Score [1] |
Spatial Distribution Score [1] |
Overall Score [1] |
|||
|---|---|---|---|---|---|---|---|---|---|---|---|---|
| Benchmark | [-] | 7.28 | ||||||||||
| CESM2_1 | [-] | 7.17 | 7.07 | 0.125 | 7.15 | 0.128 | 0.452 | 0.585 | 0.653 | 0.619 | ||
| CRUJRA | [-] | 5.19 | 5.07 | 0.150 | 7.15 | 0.128 | 0.145 | 0.511 | 0.527 | 0.519 | ||
| GSWP3 | [-] | 6.26 | 6.15 | 0.145 | 7.15 | 0.128 | 0.390 | 0.526 | 0.568 | 0.547 | ||
| PRINCETON | [-] | 7.47 | 7.39 | 0.135 | 7.15 | 0.128 | 0.845 | 0.508 | 0.511 | 0.510 |
Temporally integrated period mean