Mean State
Download Data |
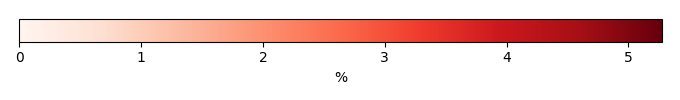
Period Mean (original grids) [%] |
Model Period Mean (intersection) [%] |
Model Period Mean (complement) [%] |
Benchmark Period Mean (intersection) [%] |
Benchmark Period Mean (complement) [%] |
Bias [%] |
RMSE [%] |
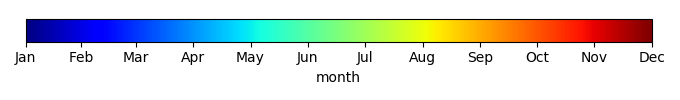
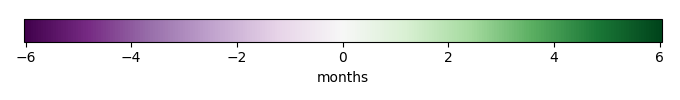
Phase Shift [months] |
Bias Score [1] |
RMSE Score [1] |
Seasonal Cycle Score [1] |
Spatial Distribution Score [1] |
Interannual Variability Score [1] |
Overall Score [1] |
|||
|---|---|---|---|---|---|---|---|---|---|---|---|---|---|---|---|---|---|
| Benchmark | [-] | 0.417 | |||||||||||||||
| CESM2_1 | [-] | 0.203 | 0.245 | 0.0112 | 0.420 | 0.0175 | -0.198 | 1.27 | 1.87 | 0.685 | 0.340 | 0.755 | 0.538 | 0.469 | 0.521 | ||
| CRUJRA | [-] | 0.188 | 0.230 | 0.0145 | 0.419 | 0.0170 | -0.212 | 1.23 | 1.84 | 0.665 | 0.350 | 0.797 | 0.426 | 0.459 | 0.508 | ||
| GSWP3 | [-] | 0.225 | 0.276 | 0.0202 | 0.419 | 0.0170 | -0.163 | 1.25 | 1.97 | 0.692 | 0.345 | 0.825 | 0.502 | 0.510 | 0.536 | ||
| PRINCETON | [-] | 0.201 | 0.224 | 0.0152 | 0.425 | 0.0171 | -0.223 | 1.25 | 1.87 | 0.669 | 0.352 | 0.792 | 0.498 | 0.474 | 0.523 |
Download Data |
Period Mean (original grids) [%] |
Model Period Mean (intersection) [%] |
Model Period Mean (complement) [%] |
Benchmark Period Mean (intersection) [%] |
Benchmark Period Mean (complement) [%] |
Bias [%] |
RMSE [%] |
Phase Shift [months] |
Bias Score [1] |
RMSE Score [1] |
Seasonal Cycle Score [1] |
Spatial Distribution Score [1] |
Interannual Variability Score [1] |
Overall Score [1] |
|||
|---|---|---|---|---|---|---|---|---|---|---|---|---|---|---|---|---|---|
| Benchmark | [-] | 1.68 | |||||||||||||||
| CESM2_1 | [-] | 1.08 | 1.10 | 0.0383 | 1.70 | 0.140 | -0.598 | 4.33 | 2.04 | 0.753 | 0.339 | 0.717 | 0.610 | 0.551 | 0.551 | ||
| CRUJRA | [-] | 1.09 | 1.12 | 0.0426 | 1.68 | 0.136 | -0.571 | 4.46 | 2.38 | 0.739 | 0.323 | 0.616 | 0.672 | 0.550 | 0.537 | ||
| GSWP3 | [-] | 0.953 | 0.970 | 0.0270 | 1.68 | 0.136 | -0.714 | 4.02 | 2.17 | 0.744 | 0.357 | 0.732 | 0.453 | 0.496 | 0.523 | ||
| PRINCETON | [-] | 1.02 | 1.05 | 0.0413 | 1.75 | 0.140 | -0.699 | 4.37 | 2.34 | 0.747 | 0.336 | 0.654 | 0.605 | 0.547 | 0.537 |
Download Data |
Period Mean (original grids) [%] |
Model Period Mean (intersection) [%] |
Model Period Mean (complement) [%] |
Benchmark Period Mean (intersection) [%] |
Benchmark Period Mean (complement) [%] |
Bias [%] |
RMSE [%] |
Phase Shift [months] |
Bias Score [1] |
RMSE Score [1] |
Seasonal Cycle Score [1] |
Spatial Distribution Score [1] |
Interannual Variability Score [1] |
Overall Score [1] |
|||
|---|---|---|---|---|---|---|---|---|---|---|---|---|---|---|---|---|---|
| Benchmark | [-] | 1.55 | |||||||||||||||
| CESM2_1 | [-] | 1.23 | 1.26 | 0.162 | 1.57 | 0.174 | -0.356 | 4.35 | 1.95 | 0.702 | 0.292 | 0.673 | 0.797 | 0.519 | 0.546 | ||
| CRUJRA | [-] | 0.938 | 0.965 | 0.110 | 1.56 | 0.170 | -0.638 | 3.94 | 1.77 | 0.675 | 0.325 | 0.721 | 0.673 | 0.505 | 0.538 | ||
| GSWP3 | [-] | 1.15 | 1.18 | 0.173 | 1.56 | 0.170 | -0.430 | 3.94 | 1.69 | 0.724 | 0.325 | 0.758 | 0.753 | 0.568 | 0.575 | ||
| PRINCETON | [-] | 0.892 | 0.918 | 0.102 | 1.59 | 0.176 | -0.707 | 3.81 | 1.57 | 0.672 | 0.345 | 0.780 | 0.675 | 0.500 | 0.553 |
Download Data |
Period Mean (original grids) [%] |
Model Period Mean (intersection) [%] |
Model Period Mean (complement) [%] |
Benchmark Period Mean (intersection) [%] |
Benchmark Period Mean (complement) [%] |
Bias [%] |
RMSE [%] |
Phase Shift [months] |
Bias Score [1] |
RMSE Score [1] |
Seasonal Cycle Score [1] |
Spatial Distribution Score [1] |
Interannual Variability Score [1] |
Overall Score [1] |
|||
|---|---|---|---|---|---|---|---|---|---|---|---|---|---|---|---|---|---|
| Benchmark | [-] | 0.0181 | |||||||||||||||
| CESM2_1 | [-] | 0.000206 | 0.000217 | 2.54e-05 | 0.0194 | 0.00172 | -0.0196 | 0.166 | 2.27 | 0.884 | 0.367 | 0.926 | 0.000363 | 0.368 | 0.485 | ||
| CRUJRA | [-] | 0.112 | 0.115 | 0.0454 | 0.0182 | 0.00169 | 0.0917 | 0.451 | 2.24 | 0.838 | 0.337 | 0.949 | 0.0432 | 0.391 | 0.482 | ||
| GSWP3 | [-] | 0.169 | 0.177 | 0.00223 | 0.0182 | 0.00169 | 0.149 | 0.656 | 2.18 | 0.755 | 0.278 | 0.953 | 0.0609 | 0.437 | 0.460 | ||
| PRINCETON | [-] | 0.00186 | 0.00195 | 0.000184 | 0.0223 | 0.00192 | -0.0209 | 0.179 | 2.34 | 0.880 | 0.368 | 0.936 | 0.0135 | 0.373 | 0.489 |
Download Data |
Period Mean (original grids) [%] |
Model Period Mean (intersection) [%] |
Model Period Mean (complement) [%] |
Benchmark Period Mean (intersection) [%] |
Benchmark Period Mean (complement) [%] |
Bias [%] |
RMSE [%] |
Phase Shift [months] |
Bias Score [1] |
RMSE Score [1] |
Seasonal Cycle Score [1] |
Spatial Distribution Score [1] |
Interannual Variability Score [1] |
Overall Score [1] |
|||
|---|---|---|---|---|---|---|---|---|---|---|---|---|---|---|---|---|---|
| Benchmark | [-] | 0.0519 | |||||||||||||||
| CESM2_1 | [-] | 0.103 | 0.101 | 0.112 | 0.0503 | 0.0178 | 0.0586 | 0.373 | 1.87 | 0.708 | 0.283 | 0.859 | 0.386 | 0.457 | 0.496 | ||
| CRUJRA | [-] | 0.0759 | 0.0739 | 0.0919 | 0.0550 | 0.0184 | 0.0223 | 0.296 | 2.03 | 0.744 | 0.317 | 0.862 | 0.658 | 0.475 | 0.562 | ||
| GSWP3 | [-] | 0.0805 | 0.0743 | 0.142 | 0.0550 | 0.0184 | 0.0271 | 0.306 | 1.89 | 0.741 | 0.313 | 0.869 | 0.640 | 0.479 | 0.559 | ||
| PRINCETON | [-] | 0.0668 | 0.0643 | 0.0865 | 0.0503 | 0.0182 | 0.0192 | 0.270 | 2.09 | 0.741 | 0.317 | 0.849 | 0.602 | 0.465 | 0.548 |
Download Data |
Period Mean (original grids) [%] |
Model Period Mean (intersection) [%] |
Model Period Mean (complement) [%] |
Benchmark Period Mean (intersection) [%] |
Benchmark Period Mean (complement) [%] |
Bias [%] |
RMSE [%] |
Phase Shift [months] |
Bias Score [1] |
RMSE Score [1] |
Seasonal Cycle Score [1] |
Spatial Distribution Score [1] |
Interannual Variability Score [1] |
Overall Score [1] |
|||
|---|---|---|---|---|---|---|---|---|---|---|---|---|---|---|---|---|---|
| Benchmark | [-] | 0.0781 | |||||||||||||||
| CESM2_1 | [-] | 0.0384 | 0.0383 | 0.00102 | 0.0789 | 0.0300 | -0.0395 | 0.496 | 1.95 | 0.829 | 0.345 | 0.784 | 0.567 | 0.427 | 0.549 | ||
| CRUJRA | [-] | 0.0475 | 0.0473 | 0.00248 | 0.0781 | 0.0281 | -0.0302 | 0.471 | 1.70 | 0.834 | 0.358 | 0.808 | 0.679 | 0.438 | 0.579 | ||
| GSWP3 | [-] | 0.159 | 0.160 | 0.00383 | 0.0781 | 0.0281 | 0.0811 | 0.829 | 1.68 | 0.792 | 0.291 | 0.735 | 0.469 | 0.475 | 0.509 | ||
| PRINCETON | [-] | 0.0229 | 0.0224 | 0.000620 | 0.0822 | 0.0256 | -0.0584 | 0.433 | 1.89 | 0.825 | 0.368 | 0.796 | 0.503 | 0.416 | 0.546 |
Download Data |
Period Mean (original grids) [%] |
Model Period Mean (intersection) [%] |
Model Period Mean (complement) [%] |
Benchmark Period Mean (intersection) [%] |
Benchmark Period Mean (complement) [%] |
Bias [%] |
RMSE [%] |
Phase Shift [months] |
Bias Score [1] |
RMSE Score [1] |
Seasonal Cycle Score [1] |
Spatial Distribution Score [1] |
Interannual Variability Score [1] |
Overall Score [1] |
|||
|---|---|---|---|---|---|---|---|---|---|---|---|---|---|---|---|---|---|
| Benchmark | [-] | 0.116 | |||||||||||||||
| CESM2_1 | [-] | 0.136 | 0.151 | 0.0129 | 0.115 | 0.0223 | 0.0306 | 0.724 | 2.37 | 0.767 | 0.332 | 0.733 | 0.547 | 0.445 | 0.526 | ||
| CRUJRA | [-] | 0.263 | 0.300 | 0.0105 | 0.116 | 0.0238 | 0.168 | 0.974 | 2.28 | 0.775 | 0.339 | 0.765 | 0.304 | 0.462 | 0.497 | ||
| GSWP3 | [-] | 0.208 | 0.236 | 0.0115 | 0.116 | 0.0238 | 0.109 | 0.896 | 2.38 | 0.774 | 0.324 | 0.770 | 0.475 | 0.453 | 0.520 | ||
| PRINCETON | [-] | 0.176 | 0.197 | 0.0124 | 0.120 | 0.0216 | 0.0664 | 0.749 | 2.23 | 0.782 | 0.345 | 0.790 | 0.506 | 0.468 | 0.539 |
Download Data |
Period Mean (original grids) [%] |
Model Period Mean (intersection) [%] |
Model Period Mean (complement) [%] |
Benchmark Period Mean (intersection) [%] |
Benchmark Period Mean (complement) [%] |
Bias [%] |
RMSE [%] |
Phase Shift [months] |
Bias Score [1] |
RMSE Score [1] |
Seasonal Cycle Score [1] |
Spatial Distribution Score [1] |
Interannual Variability Score [1] |
Overall Score [1] |
|||
|---|---|---|---|---|---|---|---|---|---|---|---|---|---|---|---|---|---|
| Benchmark | [-] | 0.179 | |||||||||||||||
| CESM2_1 | [-] | 0.222 | 0.238 | 0.0512 | 0.179 | 0.0206 | 0.0543 | 0.783 | 1.59 | 0.676 | 0.312 | 0.820 | 0.649 | 0.443 | 0.535 | ||
| CRUJRA | [-] | 0.202 | 0.207 | 0.0410 | 0.181 | 0.0206 | 0.0183 | 0.748 | 1.56 | 0.694 | 0.336 | 0.836 | 0.603 | 0.447 | 0.542 | ||
| GSWP3 | [-] | 0.219 | 0.234 | 0.0342 | 0.181 | 0.0206 | 0.0465 | 0.771 | 1.58 | 0.686 | 0.328 | 0.829 | 0.620 | 0.451 | 0.540 | ||
| PRINCETON | [-] | 0.191 | 0.202 | 0.0432 | 0.178 | 0.0206 | 0.0200 | 0.733 | 1.58 | 0.688 | 0.329 | 0.847 | 0.623 | 0.435 | 0.542 |
Download Data |
Period Mean (original grids) [%] |
Model Period Mean (intersection) [%] |
Model Period Mean (complement) [%] |
Benchmark Period Mean (intersection) [%] |
Benchmark Period Mean (complement) [%] |
Bias [%] |
RMSE [%] |
Phase Shift [months] |
Bias Score [1] |
RMSE Score [1] |
Seasonal Cycle Score [1] |
Spatial Distribution Score [1] |
Interannual Variability Score [1] |
Overall Score [1] |
|||
|---|---|---|---|---|---|---|---|---|---|---|---|---|---|---|---|---|---|
| Benchmark | [-] | 0.00845 | |||||||||||||||
| CESM2_1 | [-] | 0.000252 | 0.000279 | 1.68e-05 | 0.00902 | 0.000132 | -0.00879 | 0.0812 | 1.84 | 0.877 | 0.367 | 0.815 | 0.0450 | 0.370 | 0.474 | ||
| CRUJRA | [-] | 0.0487 | 0.0494 | 0.000654 | 0.00847 | 0.000130 | 0.0386 | 0.205 | 2.20 | 0.850 | 0.347 | 0.829 | 0.0549 | 0.410 | 0.473 | ||
| GSWP3 | [-] | 0.177 | 0.182 | 0.000442 | 0.00847 | 0.000130 | 0.169 | 0.621 | 2.15 | 0.722 | 0.266 | 0.839 | 0.0106 | 0.420 | 0.420 | ||
| PRINCETON | [-] | 0.000732 | 0.000806 | 2.69e-05 | 0.00696 | 7.24e-05 | -0.00603 | 0.0595 | 2.05 | 0.868 | 0.368 | 0.833 | 0.0621 | 0.375 | 0.479 |
Download Data |
Period Mean (original grids) [%] |
Model Period Mean (intersection) [%] |
Model Period Mean (complement) [%] |
Benchmark Period Mean (intersection) [%] |
Benchmark Period Mean (complement) [%] |
Bias [%] |
RMSE [%] |
Phase Shift [months] |
Bias Score [1] |
RMSE Score [1] |
Seasonal Cycle Score [1] |
Spatial Distribution Score [1] |
Interannual Variability Score [1] |
Overall Score [1] |
|||
|---|---|---|---|---|---|---|---|---|---|---|---|---|---|---|---|---|---|
| Benchmark | [-] | 0.521 | |||||||||||||||
| CESM2_1 | [-] | 0.411 | 0.416 | 0.313 | 0.532 | 0.281 | -0.129 | 2.27 | 1.71 | 0.789 | 0.351 | 0.773 | 0.628 | 0.456 | 0.558 | ||
| CRUJRA | [-] | 0.596 | 0.605 | 0.378 | 0.524 | 0.284 | 0.0631 | 2.40 | 1.62 | 0.801 | 0.345 | 0.799 | 0.752 | 0.474 | 0.586 | ||
| GSWP3 | [-] | 0.400 | 0.408 | 0.150 | 0.524 | 0.284 | -0.138 | 2.20 | 1.58 | 0.775 | 0.362 | 0.812 | 0.541 | 0.424 | 0.546 | ||
| PRINCETON | [-] | 0.376 | 0.382 | 0.218 | 0.558 | 0.280 | -0.191 | 2.31 | 1.53 | 0.766 | 0.364 | 0.834 | 0.502 | 0.423 | 0.542 |
Download Data |
Period Mean (original grids) [%] |
Model Period Mean (intersection) [%] |
Model Period Mean (complement) [%] |
Benchmark Period Mean (intersection) [%] |
Benchmark Period Mean (complement) [%] |
Bias [%] |
RMSE [%] |
Phase Shift [months] |
Bias Score [1] |
RMSE Score [1] |
Seasonal Cycle Score [1] |
Spatial Distribution Score [1] |
Interannual Variability Score [1] |
Overall Score [1] |
|||
|---|---|---|---|---|---|---|---|---|---|---|---|---|---|---|---|---|---|
| Benchmark | [-] | 0.0194 | |||||||||||||||
| CESM2_1 | [-] | 0.139 | 0.142 | 0.0861 | 0.0202 | 0.0135 | 0.122 | 0.321 | 2.23 | 0.586 | 0.244 | 0.852 | 0.0703 | 0.486 | 0.414 | ||
| CRUJRA | [-] | 0.0854 | 0.0873 | 0.0484 | 0.0195 | 0.0132 | 0.0705 | 0.229 | 2.16 | 0.693 | 0.297 | 0.854 | 0.0982 | 0.470 | 0.451 | ||
| GSWP3 | [-] | 0.103 | 0.109 | 0.0342 | 0.0195 | 0.0132 | 0.0834 | 0.280 | 2.16 | 0.623 | 0.243 | 0.860 | 0.120 | 0.468 | 0.426 | ||
| PRINCETON | [-] | 0.0432 | 0.0438 | 0.0309 | 0.0213 | 0.0146 | 0.0260 | 0.154 | 2.25 | 0.729 | 0.325 | 0.855 | 0.266 | 0.448 | 0.492 |
Download Data |
Period Mean (original grids) [%] |
Model Period Mean (intersection) [%] |
Model Period Mean (complement) [%] |
Benchmark Period Mean (intersection) [%] |
Benchmark Period Mean (complement) [%] |
Bias [%] |
RMSE [%] |
Phase Shift [months] |
Bias Score [1] |
RMSE Score [1] |
Seasonal Cycle Score [1] |
Spatial Distribution Score [1] |
Interannual Variability Score [1] |
Overall Score [1] |
|||
|---|---|---|---|---|---|---|---|---|---|---|---|---|---|---|---|---|---|
| Benchmark | [-] | 0.316 | |||||||||||||||
| CESM2_1 | [-] | 0.289 | 0.337 | 0.0190 | 0.324 | 0.0326 | 0.000622 | 1.20 | 2.02 | 0.721 | 0.313 | 0.726 | 0.755 | 0.505 | 0.556 | ||
| CRUJRA | [-] | 0.267 | 0.312 | 0.0160 | 0.321 | 0.0327 | -0.0232 | 1.16 | 1.98 | 0.716 | 0.329 | 0.723 | 0.697 | 0.501 | 0.549 | ||
| GSWP3 | [-] | 0.274 | 0.321 | 0.0127 | 0.321 | 0.0327 | -0.0161 | 1.17 | 1.97 | 0.732 | 0.336 | 0.771 | 0.696 | 0.506 | 0.563 | ||
| PRINCETON | [-] | 0.223 | 0.261 | 0.0124 | 0.331 | 0.0328 | -0.0821 | 1.08 | 1.95 | 0.713 | 0.342 | 0.762 | 0.662 | 0.492 | 0.552 |
Download Data |
Period Mean (original grids) [%] |
Model Period Mean (intersection) [%] |
Model Period Mean (complement) [%] |
Benchmark Period Mean (intersection) [%] |
Benchmark Period Mean (complement) [%] |
Bias [%] |
RMSE [%] |
Phase Shift [months] |
Bias Score [1] |
RMSE Score [1] |
Seasonal Cycle Score [1] |
Spatial Distribution Score [1] |
Interannual Variability Score [1] |
Overall Score [1] |
|||
|---|---|---|---|---|---|---|---|---|---|---|---|---|---|---|---|---|---|
| Benchmark | [-] | 0.0200 | |||||||||||||||
| CESM2_1 | [-] | 0.0318 | 0.0950 | 0.00246 | 0.0196 | 0.00285 | 0.0888 | 0.231 | 2.41 | 0.643 | 0.303 | 0.798 | 0.171 | 0.426 | 0.441 | ||
| CRUJRA | [-] | 0.0307 | 0.0936 | 0.00236 | 0.0202 | 0.00276 | 0.0889 | 0.235 | 2.51 | 0.652 | 0.306 | 0.795 | 0.173 | 0.426 | 0.443 | ||
| GSWP3 | [-] | 0.0303 | 0.0921 | 0.00164 | 0.0202 | 0.00276 | 0.0778 | 0.224 | 2.51 | 0.665 | 0.312 | 0.790 | 0.223 | 0.426 | 0.455 | ||
| PRINCETON | [-] | 0.0326 | 0.101 | 0.00162 | 0.0198 | 0.00294 | 0.0910 | 0.237 | 2.46 | 0.644 | 0.304 | 0.776 | 0.183 | 0.424 | 0.439 |
Download Data |
Period Mean (original grids) [%] |
Model Period Mean (intersection) [%] |
Model Period Mean (complement) [%] |
Benchmark Period Mean (intersection) [%] |
Benchmark Period Mean (complement) [%] |
Bias [%] |
RMSE [%] |
Phase Shift [months] |
Bias Score [1] |
RMSE Score [1] |
Seasonal Cycle Score [1] |
Spatial Distribution Score [1] |
Interannual Variability Score [1] |
Overall Score [1] |
|||
|---|---|---|---|---|---|---|---|---|---|---|---|---|---|---|---|---|---|
| Benchmark | [-] | 0.0162 | |||||||||||||||
| CESM2_1 | [-] | 0.000101 | 0.000117 | 1.03e-05 | 0.0156 | 6.09e-05 | -0.0154 | 0.140 | 2.57 | 0.890 | 0.367 | 0.477 | 0.000385 | 0.368 | 0.412 | ||
| CRUJRA | [-] | 0.00545 | 0.00638 | 0.000109 | 0.0162 | 5.69e-05 | -0.00999 | 0.152 | 2.55 | 0.896 | 0.367 | 0.744 | 0.510 | 0.378 | 0.544 | ||
| GSWP3 | [-] | 0.0143 | 0.0173 | 0.000482 | 0.0162 | 5.69e-05 | 0.000735 | 0.190 | 2.50 | 0.886 | 0.358 | 0.844 | 0.527 | 0.396 | 0.562 | ||
| PRINCETON | [-] | 0.00119 | 0.00131 | 0.000119 | 0.0137 | 6.72e-05 | -0.0123 | 0.117 | 2.72 | 0.883 | 0.367 | 0.669 | 0.0176 | 0.369 | 0.446 |
Download Data |
Period Mean (original grids) [%] |
Model Period Mean (intersection) [%] |
Model Period Mean (complement) [%] |
Benchmark Period Mean (intersection) [%] |
Benchmark Period Mean (complement) [%] |
Bias [%] |
RMSE [%] |
Phase Shift [months] |
Bias Score [1] |
RMSE Score [1] |
Seasonal Cycle Score [1] |
Spatial Distribution Score [1] |
Interannual Variability Score [1] |
Overall Score [1] |
|||
|---|---|---|---|---|---|---|---|---|---|---|---|---|---|---|---|---|---|
| Benchmark | [-] | 0.0806 | |||||||||||||||
| CESM2_1 | [-] | 0.362 | 0.378 | 0.181 | 0.0842 | 0.0187 | 0.266 | 0.823 | 1.88 | 0.595 | 0.261 | 0.792 | 0.114 | 0.397 | 0.403 | ||
| CRUJRA | [-] | 0.478 | 0.510 | 0.139 | 0.0827 | 0.0191 | 0.367 | 0.903 | 1.54 | 0.582 | 0.271 | 0.860 | 0.0664 | 0.397 | 0.408 | ||
| GSWP3 | [-] | 0.449 | 0.481 | 0.0846 | 0.0827 | 0.0191 | 0.330 | 0.879 | 1.66 | 0.566 | 0.269 | 0.857 | 0.0813 | 0.392 | 0.406 | ||
| PRINCETON | [-] | 0.435 | 0.468 | 0.0817 | 0.0858 | 0.0178 | 0.319 | 0.838 | 1.52 | 0.599 | 0.285 | 0.869 | 0.0698 | 0.381 | 0.415 |
Download Data |
Period Mean (original grids) [%] |
Model Period Mean (intersection) [%] |
Model Period Mean (complement) [%] |
Benchmark Period Mean (intersection) [%] |
Benchmark Period Mean (complement) [%] |
Bias [%] |
RMSE [%] |
Phase Shift [months] |
Bias Score [1] |
RMSE Score [1] |
Seasonal Cycle Score [1] |
Spatial Distribution Score [1] |
Interannual Variability Score [1] |
Overall Score [1] |
|||
|---|---|---|---|---|---|---|---|---|---|---|---|---|---|---|---|---|---|
| Benchmark | [-] | 0.0299 | |||||||||||||||
| CESM2_1 | [-] | 0.0492 | 0.0495 | 0.0108 | 0.0299 | 0.00710 | 0.0182 | 0.174 | 3.03 | 0.666 | 0.281 | 0.488 | 0.660 | 0.458 | 0.472 | ||
| CRUJRA | [-] | 0.0173 | 0.0162 | 0.00235 | 0.0301 | 0.00704 | -0.0148 | 0.123 | 2.86 | 0.680 | 0.326 | 0.568 | 0.369 | 0.422 | 0.449 | ||
| GSWP3 | [-] | 0.0424 | 0.0424 | 0.00445 | 0.0301 | 0.00704 | 0.0105 | 0.218 | 3.04 | 0.675 | 0.254 | 0.521 | 0.655 | 0.431 | 0.465 | ||
| PRINCETON | [-] | 0.0123 | 0.0114 | 0.00211 | 0.0306 | 0.00747 | -0.0198 | 0.112 | 2.67 | 0.682 | 0.338 | 0.593 | 0.257 | 0.421 | 0.438 |
Download Data |
Period Mean (original grids) [%] |
Model Period Mean (intersection) [%] |
Model Period Mean (complement) [%] |
Benchmark Period Mean (intersection) [%] |
Benchmark Period Mean (complement) [%] |
Bias [%] |
RMSE [%] |
Phase Shift [months] |
Bias Score [1] |
RMSE Score [1] |
Seasonal Cycle Score [1] |
Spatial Distribution Score [1] |
Interannual Variability Score [1] |
Overall Score [1] |
|||
|---|---|---|---|---|---|---|---|---|---|---|---|---|---|---|---|---|---|
| Benchmark | [-] | 0.0286 | |||||||||||||||
| CESM2_1 | [-] | 0.0185 | 0.0188 | 0.00422 | 0.0273 | 0.000223 | -0.00955 | 0.259 | 2.38 | 0.873 | 0.350 | 0.794 | 0.555 | 0.401 | 0.554 | ||
| CRUJRA | [-] | 0.00983 | 0.00977 | 0.00170 | 0.0288 | 0.000211 | -0.0188 | 0.243 | 2.28 | 0.879 | 0.365 | 0.827 | 0.339 | 0.391 | 0.528 | ||
| GSWP3 | [-] | 0.0276 | 0.0269 | 0.00394 | 0.0288 | 0.000211 | -0.00289 | 0.286 | 2.22 | 0.868 | 0.345 | 0.850 | 0.501 | 0.418 | 0.555 | ||
| PRINCETON | [-] | 0.00507 | 0.00520 | 0.00106 | 0.0249 | 0.000229 | -0.0193 | 0.196 | 2.42 | 0.867 | 0.366 | 0.820 | 0.0950 | 0.380 | 0.482 |
Download Data |
Period Mean (original grids) [%] |
Model Period Mean (intersection) [%] |
Model Period Mean (complement) [%] |
Benchmark Period Mean (intersection) [%] |
Benchmark Period Mean (complement) [%] |
Bias [%] |
RMSE [%] |
Phase Shift [months] |
Bias Score [1] |
RMSE Score [1] |
Seasonal Cycle Score [1] |
Spatial Distribution Score [1] |
Interannual Variability Score [1] |
Overall Score [1] |
|||
|---|---|---|---|---|---|---|---|---|---|---|---|---|---|---|---|---|---|
| Benchmark | [-] | 0.0300 | |||||||||||||||
| CESM2_1 | [-] | 0.0925 | 0.0956 | 0.0668 | 0.0297 | 0.0262 | 0.0669 | 0.370 | 2.21 | 0.752 | 0.302 | 0.741 | 0.164 | 0.424 | 0.447 | ||
| CRUJRA | [-] | 0.110 | 0.113 | 0.0144 | 0.0300 | 0.0255 | 0.0823 | 0.401 | 2.02 | 0.746 | 0.296 | 0.773 | 0.137 | 0.426 | 0.446 | ||
| GSWP3 | [-] | 0.150 | 0.153 | 0.100 | 0.0300 | 0.0255 | 0.124 | 0.501 | 2.00 | 0.709 | 0.280 | 0.788 | 0.0971 | 0.412 | 0.428 | ||
| PRINCETON | [-] | 0.145 | 0.146 | 0.0233 | 0.0313 | 0.0302 | 0.116 | 0.463 | 1.81 | 0.731 | 0.297 | 0.855 | 0.0884 | 0.407 | 0.446 |
Download Data |
Period Mean (original grids) [%] |
Model Period Mean (intersection) [%] |
Model Period Mean (complement) [%] |
Benchmark Period Mean (intersection) [%] |
Benchmark Period Mean (complement) [%] |
Bias [%] |
RMSE [%] |
Phase Shift [months] |
Bias Score [1] |
RMSE Score [1] |
Seasonal Cycle Score [1] |
Spatial Distribution Score [1] |
Interannual Variability Score [1] |
Overall Score [1] |
|||
|---|---|---|---|---|---|---|---|---|---|---|---|---|---|---|---|---|---|
| Benchmark | [-] | 0.124 | |||||||||||||||
| CESM2_1 | [-] | 0.223 | 0.223 | 0.129 | 0.125 | 0.0201 | 0.0926 | 0.604 | 1.36 | 0.650 | 0.288 | 0.879 | 0.385 | 0.460 | 0.492 | ||
| CRUJRA | [-] | 0.0626 | 0.0614 | 0.0387 | 0.124 | 0.0197 | -0.0647 | 0.393 | 1.32 | 0.681 | 0.342 | 0.878 | 0.582 | 0.432 | 0.543 | ||
| GSWP3 | [-] | 0.103 | 0.102 | 0.0463 | 0.124 | 0.0197 | -0.0234 | 0.434 | 1.28 | 0.688 | 0.313 | 0.892 | 0.734 | 0.440 | 0.563 | ||
| PRINCETON | [-] | 0.0369 | 0.0376 | 0.0276 | 0.130 | 0.0201 | -0.0940 | 0.377 | 1.31 | 0.680 | 0.347 | 0.890 | 0.233 | 0.433 | 0.489 |
Download Data |
Period Mean (original grids) [%] |
Model Period Mean (intersection) [%] |
Model Period Mean (complement) [%] |
Benchmark Period Mean (intersection) [%] |
Benchmark Period Mean (complement) [%] |
Bias [%] |
RMSE [%] |
Phase Shift [months] |
Bias Score [1] |
RMSE Score [1] |
Seasonal Cycle Score [1] |
Spatial Distribution Score [1] |
Interannual Variability Score [1] |
Overall Score [1] |
|||
|---|---|---|---|---|---|---|---|---|---|---|---|---|---|---|---|---|---|
| Benchmark | [-] | 0.223 | |||||||||||||||
| CESM2_1 | [-] | 1.03 | 1.03 | 0.0748 | 0.225 | 0.0102 | 0.771 | 2.05 | 1.46 | 0.508 | 0.176 | 0.861 | 0.314 | 0.479 | 0.419 | ||
| CRUJRA | [-] | 0.438 | 0.446 | 0.0473 | 0.224 | 0.00997 | 0.205 | 1.07 | 1.34 | 0.650 | 0.322 | 0.864 | 0.456 | 0.451 | 0.511 | ||
| GSWP3 | [-] | 0.494 | 0.502 | 0.0428 | 0.224 | 0.00997 | 0.255 | 1.22 | 1.44 | 0.660 | 0.299 | 0.854 | 0.583 | 0.471 | 0.528 | ||
| PRINCETON | [-] | 0.507 | 0.509 | 0.0346 | 0.235 | 0.0108 | 0.251 | 1.26 | 1.26 | 0.620 | 0.295 | 0.883 | 0.408 | 0.444 | 0.491 |
Download Data |
Period Mean (original grids) [%] |
Model Period Mean (intersection) [%] |
Model Period Mean (complement) [%] |
Benchmark Period Mean (intersection) [%] |
Benchmark Period Mean (complement) [%] |
Bias [%] |
RMSE [%] |
Phase Shift [months] |
Bias Score [1] |
RMSE Score [1] |
Seasonal Cycle Score [1] |
Spatial Distribution Score [1] |
Interannual Variability Score [1] |
Overall Score [1] |
|||
|---|---|---|---|---|---|---|---|---|---|---|---|---|---|---|---|---|---|
| Benchmark | [-] | 0.0264 | |||||||||||||||
| CESM2_1 | [-] | 0.191 | 0.183 | 0.0854 | 0.0272 | 0.00281 | 0.154 | 0.433 | 1.54 | 0.699 | 0.270 | 0.873 | 0.0839 | 0.460 | 0.442 | ||
| CRUJRA | [-] | 0.420 | 0.450 | 0.0331 | 0.0267 | 0.00272 | 0.381 | 0.809 | 1.74 | 0.672 | 0.280 | 0.878 | 0.0322 | 0.431 | 0.429 | ||
| GSWP3 | [-] | 0.271 | 0.277 | 0.0484 | 0.0267 | 0.00272 | 0.232 | 0.589 | 1.70 | 0.699 | 0.287 | 0.849 | 0.0595 | 0.410 | 0.432 | ||
| PRINCETON | [-] | 0.109 | 0.0982 | 0.0569 | 0.0283 | 0.00256 | 0.0676 | 0.285 | 1.54 | 0.765 | 0.318 | 0.887 | 0.238 | 0.475 | 0.500 |
Temporally integrated period mean