Mean State
Download Data |
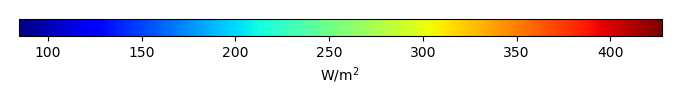
Period Mean (original grids) [W/m2] |
Model Period Mean (intersection) [W/m2] |
Model Period Mean (complement) [W/m2] |
Benchmark Period Mean (intersection) [W/m2] |
Benchmark Period Mean (complement) [W/m2] |
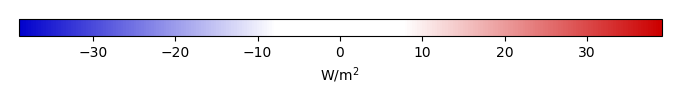
Bias [W/m2] |
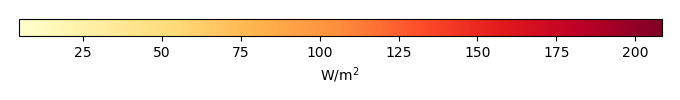
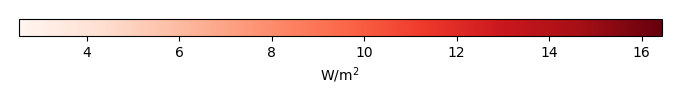
RMSE [W/m2] |
Phase Shift [months] |
Bias Score [1] |
RMSE Score [1] |
Seasonal Cycle Score [1] |
Spatial Distribution Score [1] |
Interannual Variability Score [1] |
Overall Score [1] |
|||
|---|---|---|---|---|---|---|---|---|---|---|---|---|---|---|---|---|---|
| Benchmark | [-] | 401. | |||||||||||||||
| CESM2_1 | [-] | 407. | 407. | 400. | 415. | 8.14 | 15.2 | 1.46 | 0.382 | 0.252 | 0.807 | 0.994 | 0.707 | 0.566 | |||
| CRUJRA | [-] | 390. | 390. | 400. | 415. | -8.34 | 12.3 | 1.20 | 0.351 | 0.409 | 0.843 | 0.979 | 0.803 | 0.633 | |||
| GSWP3 | [-] | 397. | 398. | 400. | 415. | -1.37 | 9.58 | 1.81 | 0.505 | 0.389 | 0.734 | 0.914 | 0.650 | 0.597 | |||
| PRINCETON | [-] | 395. | 395. | 400. | 415. | -3.64 | 8.91 | 2.18 | 0.513 | 0.439 | 0.640 | 1.00 | 0.872 | 0.650 |
Download Data |
Period Mean (original grids) [W/m2] |
Model Period Mean (intersection) [W/m2] |
Model Period Mean (complement) [W/m2] |
Benchmark Period Mean (intersection) [W/m2] |
Benchmark Period Mean (complement) [W/m2] |
Bias [W/m2] |
RMSE [W/m2] |
Phase Shift [months] |
Bias Score [1] |
RMSE Score [1] |
Seasonal Cycle Score [1] |
Spatial Distribution Score [1] |
Interannual Variability Score [1] |
Overall Score [1] |
|||
|---|---|---|---|---|---|---|---|---|---|---|---|---|---|---|---|---|---|
| Benchmark | [-] | 391. | |||||||||||||||
| CESM2_1 | [-] | 396. | 396. | 391. | 404. | 4.79 | 18.9 | 0.680 | 0.710 | 0.501 | 0.940 | 0.996 | 0.827 | 0.746 | |||
| CRUJRA | [-] | 376. | 376. | 391. | 404. | -14.6 | 19.0 | 0.925 | 0.555 | 0.631 | 0.899 | 0.999 | 0.841 | 0.760 | |||
| GSWP3 | [-] | 386. | 386. | 391. | 404. | -4.87 | 12.4 | 0.491 | 0.729 | 0.661 | 0.950 | 0.915 | 0.715 | 0.772 | |||
| PRINCETON | [-] | 386. | 385. | 391. | 404. | -5.17 | 11.5 | 0.685 | 0.743 | 0.691 | 0.929 | 0.995 | 0.815 | 0.811 |
Download Data |
Period Mean (original grids) [W/m2] |
Model Period Mean (intersection) [W/m2] |
Model Period Mean (complement) [W/m2] |
Benchmark Period Mean (intersection) [W/m2] |
Benchmark Period Mean (complement) [W/m2] |
Bias [W/m2] |
RMSE [W/m2] |
Phase Shift [months] |
Bias Score [1] |
RMSE Score [1] |
Seasonal Cycle Score [1] |
Spatial Distribution Score [1] |
Interannual Variability Score [1] |
Overall Score [1] |
|||
|---|---|---|---|---|---|---|---|---|---|---|---|---|---|---|---|---|---|
| Benchmark | [-] | 367. | |||||||||||||||
| CESM2_1 | [-] | 373. | 373. | 366. | 384. | 8.69 | 17.7 | 1.16 | 0.626 | 0.508 | 0.857 | 0.989 | 0.766 | 0.709 | |||
| CRUJRA | [-] | 355. | 354. | 366. | 384. | -8.90 | 14.1 | 0.850 | 0.607 | 0.687 | 0.896 | 0.997 | 0.889 | 0.794 | |||
| GSWP3 | [-] | 361. | 361. | 366. | 384. | -2.96 | 12.2 | 0.935 | 0.713 | 0.624 | 0.879 | 0.992 | 0.747 | 0.763 | |||
| PRINCETON | [-] | 358. | 358. | 366. | 384. | -5.84 | 10.8 | 0.701 | 0.692 | 0.687 | 0.912 | 0.997 | 0.903 | 0.813 |
Download Data |
Period Mean (original grids) [W/m2] |
Model Period Mean (intersection) [W/m2] |
Model Period Mean (complement) [W/m2] |
Benchmark Period Mean (intersection) [W/m2] |
Benchmark Period Mean (complement) [W/m2] |
Bias [W/m2] |
RMSE [W/m2] |
Phase Shift [months] |
Bias Score [1] |
RMSE Score [1] |
Seasonal Cycle Score [1] |
Spatial Distribution Score [1] |
Interannual Variability Score [1] |
Overall Score [1] |
|||
|---|---|---|---|---|---|---|---|---|---|---|---|---|---|---|---|---|---|
| Benchmark | [-] | 243. | |||||||||||||||
| CESM2_1 | [-] | 253. | 253. | 242. | 256. | 13.5 | 23.4 | 0.134 | 0.791 | 0.730 | 0.991 | 0.999 | 0.844 | 0.847 | |||
| CRUJRA | [-] | 227. | 227. | 242. | 256. | -12.6 | 16.1 | 0.0958 | 0.802 | 0.836 | 0.994 | 0.998 | 0.840 | 0.884 | |||
| GSWP3 | [-] | 237. | 237. | 242. | 256. | -2.60 | 13.7 | 0.123 | 0.923 | 0.802 | 0.992 | 0.992 | 0.888 | 0.900 | |||
| PRINCETON | [-] | 243. | 243. | 242. | 256. | 2.98 | 14.0 | 0.116 | 0.921 | 0.804 | 0.992 | 0.985 | 0.920 | 0.904 |
Download Data |
Period Mean (original grids) [W/m2] |
Model Period Mean (intersection) [W/m2] |
Model Period Mean (complement) [W/m2] |
Benchmark Period Mean (intersection) [W/m2] |
Benchmark Period Mean (complement) [W/m2] |
Bias [W/m2] |
RMSE [W/m2] |
Phase Shift [months] |
Bias Score [1] |
RMSE Score [1] |
Seasonal Cycle Score [1] |
Spatial Distribution Score [1] |
Interannual Variability Score [1] |
Overall Score [1] |
|||
|---|---|---|---|---|---|---|---|---|---|---|---|---|---|---|---|---|---|
| Benchmark | [-] | 411. | |||||||||||||||
| CESM2_1 | [-] | 423. | 423. | 409. | 416. | 16.1 | 19.5 | 2.22 | 0.149 | 0.250 | 0.664 | 0.685 | 0.660 | 0.443 | |||
| CRUJRA | [-] | 407. | 407. | 409. | 416. | -0.923 | 10.8 | 2.26 | 0.335 | 0.445 | 0.638 | 0.898 | 0.841 | 0.600 | |||
| GSWP3 | [-] | 411. | 411. | 409. | 416. | 3.75 | 11.6 | 1.88 | 0.366 | 0.371 | 0.709 | 0.567 | 0.747 | 0.522 | |||
| PRINCETON | [-] | 412. | 412. | 409. | 416. | 5.24 | 11.0 | 2.16 | 0.350 | 0.416 | 0.657 | 0.878 | 0.793 | 0.585 |
Download Data |
Period Mean (original grids) [W/m2] |
Model Period Mean (intersection) [W/m2] |
Model Period Mean (complement) [W/m2] |
Benchmark Period Mean (intersection) [W/m2] |
Benchmark Period Mean (complement) [W/m2] |
Bias [W/m2] |
RMSE [W/m2] |
Phase Shift [months] |
Bias Score [1] |
RMSE Score [1] |
Seasonal Cycle Score [1] |
Spatial Distribution Score [1] |
Interannual Variability Score [1] |
Overall Score [1] |
|||
|---|---|---|---|---|---|---|---|---|---|---|---|---|---|---|---|---|---|
| Benchmark | [-] | 268. | |||||||||||||||
| CESM2_1 | [-] | 273. | 273. | 267. | 280. | 5.58 | 22.0 | 0.0131 | 0.897 | 0.702 | 0.999 | 0.988 | 0.896 | 0.864 | |||
| CRUJRA | [-] | 256. | 256. | 267. | 280. | -10.9 | 13.0 | 0.00878 | 0.833 | 0.877 | 0.999 | 0.985 | 0.874 | 0.908 | |||
| GSWP3 | [-] | 265. | 264. | 267. | 280. | -2.61 | 10.9 | 0.0463 | 0.917 | 0.852 | 0.997 | 0.974 | 0.859 | 0.908 | |||
| PRINCETON | [-] | 264. | 264. | 267. | 280. | -3.21 | 9.32 | 0.00923 | 0.930 | 0.870 | 0.999 | 1.00 | 0.935 | 0.934 |
Download Data |
Period Mean (original grids) [W/m2] |
Model Period Mean (intersection) [W/m2] |
Model Period Mean (complement) [W/m2] |
Benchmark Period Mean (intersection) [W/m2] |
Benchmark Period Mean (complement) [W/m2] |
Bias [W/m2] |
RMSE [W/m2] |
Phase Shift [months] |
Bias Score [1] |
RMSE Score [1] |
Seasonal Cycle Score [1] |
Spatial Distribution Score [1] |
Interannual Variability Score [1] |
Overall Score [1] |
|||
|---|---|---|---|---|---|---|---|---|---|---|---|---|---|---|---|---|---|
| Benchmark | [-] | 297. | |||||||||||||||
| CESM2_1 | [-] | 291. | 291. | 296. | 355. | -1.74 | 20.0 | 0.158 | 0.853 | 0.699 | 0.988 | 0.999 | 0.781 | 0.837 | |||
| CRUJRA | [-] | 280. | 280. | 296. | 355. | -13.0 | 18.0 | 0.0804 | 0.759 | 0.811 | 0.994 | 0.995 | 0.883 | 0.876 | |||
| GSWP3 | [-] | 293. | 292. | 296. | 355. | -0.581 | 14.2 | 0.146 | 0.844 | 0.810 | 0.990 | 0.987 | 0.795 | 0.873 | |||
| PRINCETON | [-] | 288. | 287. | 296. | 355. | -5.45 | 12.3 | 0.0768 | 0.844 | 0.846 | 0.995 | 0.999 | 0.904 | 0.905 |
Download Data |
Period Mean (original grids) [W/m2] |
Model Period Mean (intersection) [W/m2] |
Model Period Mean (complement) [W/m2] |
Benchmark Period Mean (intersection) [W/m2] |
Benchmark Period Mean (complement) [W/m2] |
Bias [W/m2] |
RMSE [W/m2] |
Phase Shift [months] |
Bias Score [1] |
RMSE Score [1] |
Seasonal Cycle Score [1] |
Spatial Distribution Score [1] |
Interannual Variability Score [1] |
Overall Score [1] |
|||
|---|---|---|---|---|---|---|---|---|---|---|---|---|---|---|---|---|---|
| Benchmark | [-] | 387. | |||||||||||||||
| CESM2_1 | [-] | 379. | 380. | 385. | 415. | -0.431 | 19.9 | 0.612 | 0.729 | 0.565 | 0.945 | 0.994 | 0.719 | 0.753 | |||
| CRUJRA | [-] | 370. | 371. | 385. | 415. | -9.14 | 16.1 | 0.480 | 0.690 | 0.724 | 0.956 | 0.977 | 0.874 | 0.824 | |||
| GSWP3 | [-] | 374. | 375. | 385. | 415. | -5.63 | 15.4 | 0.408 | 0.718 | 0.713 | 0.963 | 0.998 | 0.799 | 0.817 | |||
| PRINCETON | [-] | 376. | 376. | 385. | 415. | -4.18 | 13.0 | 0.465 | 0.744 | 0.745 | 0.958 | 0.995 | 0.876 | 0.844 |
Download Data |
Period Mean (original grids) [W/m2] |
Model Period Mean (intersection) [W/m2] |
Model Period Mean (complement) [W/m2] |
Benchmark Period Mean (intersection) [W/m2] |
Benchmark Period Mean (complement) [W/m2] |
Bias [W/m2] |
RMSE [W/m2] |
Phase Shift [months] |
Bias Score [1] |
RMSE Score [1] |
Seasonal Cycle Score [1] |
Spatial Distribution Score [1] |
Interannual Variability Score [1] |
Overall Score [1] |
|||
|---|---|---|---|---|---|---|---|---|---|---|---|---|---|---|---|---|---|
| Benchmark | [-] | 249. | |||||||||||||||
| CESM2_1 | [-] | 261. | 262. | 248. | 253. | 13.7 | 26.1 | 0.0651 | 0.787 | 0.682 | 0.996 | 0.922 | 0.924 | 0.832 | |||
| CRUJRA | [-] | 234. | 234. | 248. | 253. | -13.2 | 15.2 | 0.0575 | 0.790 | 0.854 | 0.996 | 0.993 | 0.886 | 0.896 | |||
| GSWP3 | [-] | 243. | 244. | 248. | 253. | -4.14 | 13.6 | 0.0505 | 0.917 | 0.797 | 0.997 | 0.977 | 0.914 | 0.900 | |||
| PRINCETON | [-] | 250. | 250. | 248. | 253. | 2.73 | 13.6 | 0.0480 | 0.926 | 0.799 | 0.997 | 0.969 | 0.936 | 0.904 |
Download Data |
Period Mean (original grids) [W/m2] |
Model Period Mean (intersection) [W/m2] |
Model Period Mean (complement) [W/m2] |
Benchmark Period Mean (intersection) [W/m2] |
Benchmark Period Mean (complement) [W/m2] |
Bias [W/m2] |
RMSE [W/m2] |
Phase Shift [months] |
Bias Score [1] |
RMSE Score [1] |
Seasonal Cycle Score [1] |
Spatial Distribution Score [1] |
Interannual Variability Score [1] |
Overall Score [1] |
|||
|---|---|---|---|---|---|---|---|---|---|---|---|---|---|---|---|---|---|
| Benchmark | [-] | 353. | |||||||||||||||
| CESM2_1 | [-] | 358. | 358. | 352. | 359. | 6.21 | 18.8 | 0.446 | 0.800 | 0.577 | 0.970 | 0.999 | 0.815 | 0.790 | |||
| CRUJRA | [-] | 345. | 345. | 352. | 359. | -6.98 | 11.2 | 0.461 | 0.785 | 0.781 | 0.967 | 1.00 | 0.937 | 0.875 | |||
| GSWP3 | [-] | 351. | 351. | 352. | 359. | -0.968 | 9.75 | 0.299 | 0.865 | 0.762 | 0.980 | 0.992 | 0.867 | 0.871 | |||
| PRINCETON | [-] | 347. | 347. | 352. | 359. | -4.55 | 8.91 | 0.366 | 0.823 | 0.809 | 0.976 | 0.999 | 0.936 | 0.892 |
Download Data |
Period Mean (original grids) [W/m2] |
Model Period Mean (intersection) [W/m2] |
Model Period Mean (complement) [W/m2] |
Benchmark Period Mean (intersection) [W/m2] |
Benchmark Period Mean (complement) [W/m2] |
Bias [W/m2] |
RMSE [W/m2] |
Phase Shift [months] |
Bias Score [1] |
RMSE Score [1] |
Seasonal Cycle Score [1] |
Spatial Distribution Score [1] |
Interannual Variability Score [1] |
Overall Score [1] |
|||
|---|---|---|---|---|---|---|---|---|---|---|---|---|---|---|---|---|---|
| Benchmark | [-] | 314. | |||||||||||||||
| CESM2_1 | [-] | 316. | 316. | 312. | 329. | 5.51 | 18.1 | 0.320 | 0.774 | 0.605 | 0.976 | 0.974 | 0.796 | 0.788 | |||
| CRUJRA | [-] | 300. | 300. | 312. | 329. | -9.73 | 12.9 | 0.178 | 0.722 | 0.786 | 0.988 | 0.996 | 0.859 | 0.856 | |||
| GSWP3 | [-] | 306. | 306. | 312. | 329. | -3.25 | 11.6 | 0.223 | 0.807 | 0.752 | 0.982 | 0.997 | 0.696 | 0.831 | |||
| PRINCETON | [-] | 307. | 307. | 312. | 329. | -3.10 | 9.48 | 0.135 | 0.821 | 0.803 | 0.991 | 0.979 | 0.875 | 0.878 |
Download Data |
Period Mean (original grids) [W/m2] |
Model Period Mean (intersection) [W/m2] |
Model Period Mean (complement) [W/m2] |
Benchmark Period Mean (intersection) [W/m2] |
Benchmark Period Mean (complement) [W/m2] |
Bias [W/m2] |
RMSE [W/m2] |
Phase Shift [months] |
Bias Score [1] |
RMSE Score [1] |
Seasonal Cycle Score [1] |
Spatial Distribution Score [1] |
Interannual Variability Score [1] |
Overall Score [1] |
|||
|---|---|---|---|---|---|---|---|---|---|---|---|---|---|---|---|---|---|
| Benchmark | [-] | 345. | |||||||||||||||
| CESM2_1 | [-] | 314. | 314. | 315. | 360. | 2.18 | 20.2 | 0.710 | 0.698 | 0.551 | 0.915 | 0.995 | 0.800 | 0.752 | |||
| CRUJRA | [-] | 317. | 317. | 315. | 360. | 3.71 | 26.6 | 0.601 | 0.622 | 0.701 | 0.928 | 0.772 | 0.848 | 0.762 | |||
| GSWP3 | [-] | 309. | 309. | 315. | 360. | -2.77 | 13.1 | 0.509 | 0.758 | 0.686 | 0.941 | 0.999 | 0.796 | 0.811 | |||
| PRINCETON | [-] | 310. | 310. | 315. | 360. | -2.34 | 12.3 | 0.533 | 0.749 | 0.716 | 0.934 | 0.998 | 0.884 | 0.833 |
Download Data |
Period Mean (original grids) [W/m2] |
Model Period Mean (intersection) [W/m2] |
Model Period Mean (complement) [W/m2] |
Benchmark Period Mean (intersection) [W/m2] |
Benchmark Period Mean (complement) [W/m2] |
Bias [W/m2] |
RMSE [W/m2] |
Phase Shift [months] |
Bias Score [1] |
RMSE Score [1] |
Seasonal Cycle Score [1] |
Spatial Distribution Score [1] |
Interannual Variability Score [1] |
Overall Score [1] |
|||
|---|---|---|---|---|---|---|---|---|---|---|---|---|---|---|---|---|---|
| Benchmark | [-] | 350. | |||||||||||||||
| CESM2_1 | [-] | 339. | 339. | 349. | 373. | -8.91 | 20.5 | 0.854 | 0.742 | 0.641 | 0.910 | 0.996 | 0.867 | 0.800 | |||
| CRUJRA | [-] | 335. | 335. | 349. | 373. | -12.2 | 17.7 | 0.340 | 0.716 | 0.742 | 0.972 | 0.999 | 0.898 | 0.845 | |||
| GSWP3 | [-] | 344. | 344. | 349. | 373. | -3.81 | 14.4 | 0.432 | 0.818 | 0.734 | 0.963 | 0.989 | 0.789 | 0.838 | |||
| PRINCETON | [-] | 340. | 340. | 349. | 373. | -7.89 | 13.3 | 0.341 | 0.775 | 0.795 | 0.973 | 0.995 | 0.892 | 0.871 |
Download Data |
Period Mean (original grids) [W/m2] |
Model Period Mean (intersection) [W/m2] |
Model Period Mean (complement) [W/m2] |
Benchmark Period Mean (intersection) [W/m2] |
Benchmark Period Mean (complement) [W/m2] |
Bias [W/m2] |
RMSE [W/m2] |
Phase Shift [months] |
Bias Score [1] |
RMSE Score [1] |
Seasonal Cycle Score [1] |
Spatial Distribution Score [1] |
Interannual Variability Score [1] |
Overall Score [1] |
|||
|---|---|---|---|---|---|---|---|---|---|---|---|---|---|---|---|---|---|
| Benchmark | [-] | 248. | |||||||||||||||
| CESM2_1 | [-] | 262. | 262. | 247. | 258. | 14.1 | 24.9 | 0.209 | 0.765 | 0.690 | 0.986 | 0.998 | 0.876 | 0.834 | |||
| CRUJRA | [-] | 235. | 235. | 247. | 258. | -12.6 | 16.1 | 0.135 | 0.785 | 0.829 | 0.991 | 0.976 | 0.850 | 0.877 | |||
| GSWP3 | [-] | 243. | 243. | 247. | 258. | -4.19 | 13.4 | 0.126 | 0.901 | 0.793 | 0.992 | 1.00 | 0.895 | 0.896 | |||
| PRINCETON | [-] | 250. | 250. | 247. | 258. | 2.49 | 13.9 | 0.118 | 0.921 | 0.787 | 0.992 | 0.972 | 0.929 | 0.898 |
Download Data |
Period Mean (original grids) [W/m2] |
Model Period Mean (intersection) [W/m2] |
Model Period Mean (complement) [W/m2] |
Benchmark Period Mean (intersection) [W/m2] |
Benchmark Period Mean (complement) [W/m2] |
Bias [W/m2] |
RMSE [W/m2] |
Phase Shift [months] |
Bias Score [1] |
RMSE Score [1] |
Seasonal Cycle Score [1] |
Spatial Distribution Score [1] |
Interannual Variability Score [1] |
Overall Score [1] |
|||
|---|---|---|---|---|---|---|---|---|---|---|---|---|---|---|---|---|---|
| Benchmark | [-] | 376. | |||||||||||||||
| CESM2_1 | [-] | 372. | 372. | 371. | 402. | 8.06 | 18.9 | 1.48 | 0.601 | 0.547 | 0.797 | 0.996 | 0.814 | 0.717 | |||
| CRUJRA | [-] | 355. | 355. | 371. | 402. | -7.19 | 15.0 | 0.797 | 0.595 | 0.702 | 0.900 | 0.999 | 0.873 | 0.795 | |||
| GSWP3 | [-] | 363. | 363. | 371. | 402. | -1.23 | 14.5 | 0.704 | 0.640 | 0.676 | 0.911 | 0.994 | 0.783 | 0.780 | |||
| PRINCETON | [-] | 359. | 359. | 371. | 402. | -4.26 | 12.4 | 0.818 | 0.635 | 0.721 | 0.903 | 0.999 | 0.870 | 0.808 |
Download Data |
Period Mean (original grids) [W/m2] |
Model Period Mean (intersection) [W/m2] |
Model Period Mean (complement) [W/m2] |
Benchmark Period Mean (intersection) [W/m2] |
Benchmark Period Mean (complement) [W/m2] |
Bias [W/m2] |
RMSE [W/m2] |
Phase Shift [months] |
Bias Score [1] |
RMSE Score [1] |
Seasonal Cycle Score [1] |
Spatial Distribution Score [1] |
Interannual Variability Score [1] |
Overall Score [1] |
|||
|---|---|---|---|---|---|---|---|---|---|---|---|---|---|---|---|---|---|
| Benchmark | [-] | 335. | |||||||||||||||
| CESM2_1 | [-] | 333. | 333. | 333. | 372. | 2.49 | 18.2 | 0.557 | 0.906 | 0.688 | 0.963 | 0.995 | 0.754 | 0.832 | |||
| CRUJRA | [-] | 322. | 322. | 333. | 372. | -8.52 | 10.8 | 0.115 | 0.832 | 0.864 | 0.992 | 1.00 | 0.897 | 0.908 | |||
| GSWP3 | [-] | 328. | 328. | 333. | 372. | -2.37 | 9.63 | 0.122 | 0.919 | 0.831 | 0.992 | 1.00 | 0.814 | 0.898 | |||
| PRINCETON | [-] | 329. | 329. | 333. | 372. | -2.32 | 7.56 | 0.118 | 0.922 | 0.872 | 0.992 | 0.996 | 0.953 | 0.934 |
Download Data |
Period Mean (original grids) [W/m2] |
Model Period Mean (intersection) [W/m2] |
Model Period Mean (complement) [W/m2] |
Benchmark Period Mean (intersection) [W/m2] |
Benchmark Period Mean (complement) [W/m2] |
Bias [W/m2] |
RMSE [W/m2] |
Phase Shift [months] |
Bias Score [1] |
RMSE Score [1] |
Seasonal Cycle Score [1] |
Spatial Distribution Score [1] |
Interannual Variability Score [1] |
Overall Score [1] |
|||
|---|---|---|---|---|---|---|---|---|---|---|---|---|---|---|---|---|---|
| Benchmark | [-] | 278. | |||||||||||||||
| CESM2_1 | [-] | 284. | 284. | 277. | 303. | 8.58 | 20.0 | 0.305 | 0.809 | 0.684 | 0.979 | 0.980 | 0.812 | 0.825 | |||
| CRUJRA | [-] | 269. | 269. | 277. | 303. | -7.20 | 10.1 | 0.0434 | 0.835 | 0.855 | 0.997 | 0.999 | 0.831 | 0.895 | |||
| GSWP3 | [-] | 275. | 275. | 277. | 303. | -0.971 | 9.62 | 0.0673 | 0.909 | 0.823 | 0.995 | 0.995 | 0.864 | 0.901 | |||
| PRINCETON | [-] | 276. | 276. | 277. | 303. | -0.0591 | 8.88 | 0.0383 | 0.916 | 0.835 | 0.997 | 0.993 | 0.931 | 0.918 |
Download Data |
Period Mean (original grids) [W/m2] |
Model Period Mean (intersection) [W/m2] |
Model Period Mean (complement) [W/m2] |
Benchmark Period Mean (intersection) [W/m2] |
Benchmark Period Mean (complement) [W/m2] |
Bias [W/m2] |
RMSE [W/m2] |
Phase Shift [months] |
Bias Score [1] |
RMSE Score [1] |
Seasonal Cycle Score [1] |
Spatial Distribution Score [1] |
Interannual Variability Score [1] |
Overall Score [1] |
|||
|---|---|---|---|---|---|---|---|---|---|---|---|---|---|---|---|---|---|
| Benchmark | [-] | 298. | |||||||||||||||
| CESM2_1 | [-] | 298. | 300. | 298. | 325. | 2.20 | 16.8 | 0.489 | 0.822 | 0.661 | 0.967 | 0.994 | 0.703 | 0.801 | |||
| CRUJRA | [-] | 286. | 288. | 298. | 325. | -9.69 | 14.0 | 0.0880 | 0.753 | 0.797 | 0.994 | 0.997 | 0.900 | 0.873 | |||
| GSWP3 | [-] | 293. | 294. | 298. | 325. | -3.00 | 12.5 | 0.124 | 0.828 | 0.763 | 0.992 | 0.992 | 0.738 | 0.846 | |||
| PRINCETON | [-] | 292. | 294. | 298. | 325. | -4.04 | 10.0 | 0.0635 | 0.830 | 0.826 | 0.996 | 0.995 | 0.912 | 0.897 |
Download Data |
Period Mean (original grids) [W/m2] |
Model Period Mean (intersection) [W/m2] |
Model Period Mean (complement) [W/m2] |
Benchmark Period Mean (intersection) [W/m2] |
Benchmark Period Mean (complement) [W/m2] |
Bias [W/m2] |
RMSE [W/m2] |
Phase Shift [months] |
Bias Score [1] |
RMSE Score [1] |
Seasonal Cycle Score [1] |
Spatial Distribution Score [1] |
Interannual Variability Score [1] |
Overall Score [1] |
|||
|---|---|---|---|---|---|---|---|---|---|---|---|---|---|---|---|---|---|
| Benchmark | [-] | 410. | |||||||||||||||
| CESM2_1 | [-] | 412. | 412. | 410. | 415. | 2.68 | 16.2 | 2.66 | 0.462 | 0.257 | 0.572 | 0.979 | 0.846 | 0.562 | |||
| CRUJRA | [-] | 403. | 403. | 410. | 415. | -5.63 | 11.4 | 2.23 | 0.502 | 0.479 | 0.648 | 0.992 | 0.710 | 0.635 | |||
| GSWP3 | [-] | 406. | 406. | 410. | 415. | -2.98 | 10.8 | 1.26 | 0.546 | 0.467 | 0.837 | 0.978 | 0.774 | 0.678 | |||
| PRINCETON | [-] | 407. | 407. | 410. | 415. | -2.23 | 9.58 | 1.45 | 0.604 | 0.473 | 0.810 | 0.984 | 0.802 | 0.691 |
Download Data |
Period Mean (original grids) [W/m2] |
Model Period Mean (intersection) [W/m2] |
Model Period Mean (complement) [W/m2] |
Benchmark Period Mean (intersection) [W/m2] |
Benchmark Period Mean (complement) [W/m2] |
Bias [W/m2] |
RMSE [W/m2] |
Phase Shift [months] |
Bias Score [1] |
RMSE Score [1] |
Seasonal Cycle Score [1] |
Spatial Distribution Score [1] |
Interannual Variability Score [1] |
Overall Score [1] |
|||
|---|---|---|---|---|---|---|---|---|---|---|---|---|---|---|---|---|---|
| Benchmark | [-] | 379. | |||||||||||||||
| CESM2_1 | [-] | 379. | 378. | 380. | 374. | -1.15 | 17.4 | 0.869 | 0.754 | 0.462 | 0.906 | 1.00 | 0.841 | 0.738 | |||
| CRUJRA | [-] | 371. | 370. | 380. | 374. | -8.87 | 12.8 | 1.43 | 0.646 | 0.709 | 0.783 | 0.996 | 0.889 | 0.789 | |||
| GSWP3 | [-] | 377. | 376. | 380. | 374. | -2.98 | 11.2 | 0.680 | 0.765 | 0.650 | 0.935 | 0.994 | 0.845 | 0.807 | |||
| PRINCETON | [-] | 376. | 375. | 380. | 374. | -4.23 | 9.64 | 0.711 | 0.738 | 0.718 | 0.926 | 0.998 | 0.897 | 0.832 |
Download Data |
Period Mean (original grids) [W/m2] |
Model Period Mean (intersection) [W/m2] |
Model Period Mean (complement) [W/m2] |
Benchmark Period Mean (intersection) [W/m2] |
Benchmark Period Mean (complement) [W/m2] |
Bias [W/m2] |
RMSE [W/m2] |
Phase Shift [months] |
Bias Score [1] |
RMSE Score [1] |
Seasonal Cycle Score [1] |
Spatial Distribution Score [1] |
Interannual Variability Score [1] |
Overall Score [1] |
|||
|---|---|---|---|---|---|---|---|---|---|---|---|---|---|---|---|---|---|
| Benchmark | [-] | 303. | |||||||||||||||
| CESM2_1 | [-] | 301. | 301. | 298. | 346. | 7.80 | 26.5 | 0.654 | 0.470 | 0.418 | 0.950 | 0.995 | 0.786 | 0.673 | |||
| CRUJRA | [-] | 285. | 285. | 298. | 346. | -6.27 | 22.2 | 0.475 | 0.493 | 0.561 | 0.961 | 0.985 | 0.804 | 0.728 | |||
| GSWP3 | [-] | 301. | 301. | 298. | 346. | 6.58 | 22.1 | 0.556 | 0.480 | 0.531 | 0.953 | 0.929 | 0.746 | 0.695 | |||
| PRINCETON | [-] | 292. | 291. | 298. | 346. | -1.53 | 19.0 | 0.358 | 0.535 | 0.594 | 0.969 | 0.997 | 0.825 | 0.752 |
Temporally integrated period mean