Mean State
Download Data |
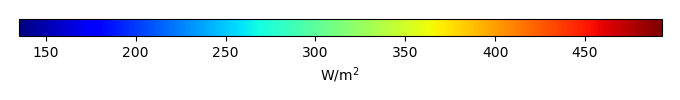
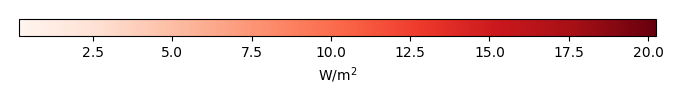
Period Mean (original grids) [W/m2] |
Model Period Mean (intersection) [W/m2] |
Model Period Mean (complement) [W/m2] |
Benchmark Period Mean (intersection) [W/m2] |
Benchmark Period Mean (complement) [W/m2] |
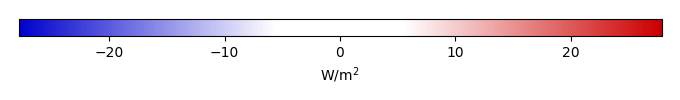
Bias [W/m2] |
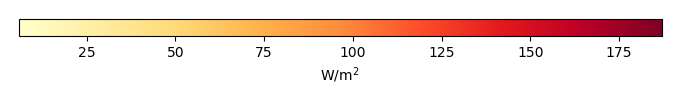
RMSE [W/m2] |
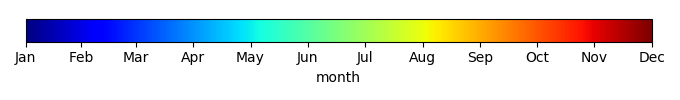
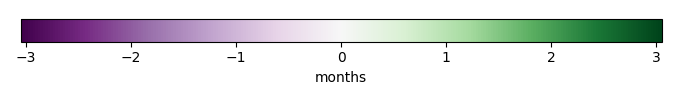
Phase Shift [months] |
Bias Score [1] |
RMSE Score [1] |
Seasonal Cycle Score [1] |
Spatial Distribution Score [1] |
Interannual Variability Score [1] |
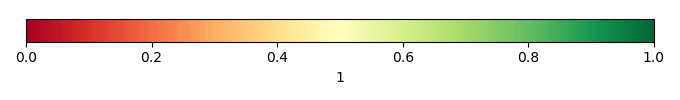
Overall Score [1] |
|||
|---|---|---|---|---|---|---|---|---|---|---|---|---|---|---|---|---|---|
| Benchmark | [-] | 457. | |||||||||||||||
| CESM2_1 | [-] | 460. | 460. | 456. | 465. | 5.21 | 15.9 | 1.86 | 0.505 | 0.347 | 0.739 | 0.975 | 0.630 | 0.591 | |||
| CRUJRA | [-] | 457. | 457. | 456. | 465. | 1.78 | 15.4 | 1.70 | 0.467 | 0.379 | 0.769 | 0.944 | 0.587 | 0.588 | |||
| GSWP3 | [-] | 463. | 463. | 456. | 465. | 7.79 | 16.3 | 1.43 | 0.460 | 0.382 | 0.806 | 0.979 | 0.612 | 0.603 | |||
| PRINCETON | [-] | 463. | 463. | 456. | 465. | 7.15 | 15.8 | 1.47 | 0.490 | 0.384 | 0.795 | 0.982 | 0.588 | 0.604 |
Download Data |
Period Mean (original grids) [W/m2] |
Model Period Mean (intersection) [W/m2] |
Model Period Mean (complement) [W/m2] |
Benchmark Period Mean (intersection) [W/m2] |
Benchmark Period Mean (complement) [W/m2] |
Bias [W/m2] |
RMSE [W/m2] |
Phase Shift [months] |
Bias Score [1] |
RMSE Score [1] |
Seasonal Cycle Score [1] |
Spatial Distribution Score [1] |
Interannual Variability Score [1] |
Overall Score [1] |
|||
|---|---|---|---|---|---|---|---|---|---|---|---|---|---|---|---|---|---|
| Benchmark | [-] | 466. | |||||||||||||||
| CESM2_1 | [-] | 479. | 479. | 467. | 458. | 12.7 | 24.6 | 0.790 | 0.545 | 0.408 | 0.923 | 0.974 | 0.667 | 0.654 | |||
| CRUJRA | [-] | 473. | 473. | 467. | 458. | 6.42 | 20.2 | 0.951 | 0.653 | 0.455 | 0.906 | 0.970 | 0.605 | 0.674 | |||
| GSWP3 | [-] | 484. | 484. | 467. | 458. | 17.2 | 23.5 | 0.637 | 0.460 | 0.503 | 0.942 | 0.952 | 0.622 | 0.664 | |||
| PRINCETON | [-] | 480. | 480. | 467. | 458. | 13.6 | 21.9 | 0.705 | 0.531 | 0.492 | 0.936 | 0.981 | 0.596 | 0.671 |
Download Data |
Period Mean (original grids) [W/m2] |
Model Period Mean (intersection) [W/m2] |
Model Period Mean (complement) [W/m2] |
Benchmark Period Mean (intersection) [W/m2] |
Benchmark Period Mean (complement) [W/m2] |
Bias [W/m2] |
RMSE [W/m2] |
Phase Shift [months] |
Bias Score [1] |
RMSE Score [1] |
Seasonal Cycle Score [1] |
Spatial Distribution Score [1] |
Interannual Variability Score [1] |
Overall Score [1] |
|||
|---|---|---|---|---|---|---|---|---|---|---|---|---|---|---|---|---|---|
| Benchmark | [-] | 443. | |||||||||||||||
| CESM2_1 | [-] | 450. | 450. | 443. | 446. | 7.87 | 21.4 | 1.59 | 0.568 | 0.405 | 0.794 | 0.963 | 0.711 | 0.641 | |||
| CRUJRA | [-] | 442. | 442. | 443. | 446. | -0.260 | 18.2 | 1.45 | 0.648 | 0.444 | 0.819 | 0.998 | 0.587 | 0.657 | |||
| GSWP3 | [-] | 452. | 452. | 443. | 446. | 9.04 | 18.8 | 1.35 | 0.572 | 0.463 | 0.818 | 1.00 | 0.603 | 0.653 | |||
| PRINCETON | [-] | 449. | 449. | 443. | 446. | 6.78 | 18.9 | 1.50 | 0.591 | 0.451 | 0.793 | 0.999 | 0.591 | 0.646 |
Download Data |
Period Mean (original grids) [W/m2] |
Model Period Mean (intersection) [W/m2] |
Model Period Mean (complement) [W/m2] |
Benchmark Period Mean (intersection) [W/m2] |
Benchmark Period Mean (complement) [W/m2] |
Bias [W/m2] |
RMSE [W/m2] |
Phase Shift [months] |
Bias Score [1] |
RMSE Score [1] |
Seasonal Cycle Score [1] |
Spatial Distribution Score [1] |
Interannual Variability Score [1] |
Overall Score [1] |
|||
|---|---|---|---|---|---|---|---|---|---|---|---|---|---|---|---|---|---|
| Benchmark | [-] | 279. | |||||||||||||||
| CESM2_1 | [-] | 288. | 288. | 278. | 296. | 12.2 | 24.9 | 0.285 | 0.822 | 0.734 | 0.980 | 0.921 | 0.850 | 0.840 | |||
| CRUJRA | [-] | 273. | 273. | 278. | 296. | -2.92 | 15.1 | 0.129 | 0.906 | 0.809 | 0.990 | 1.00 | 0.787 | 0.883 | |||
| GSWP3 | [-] | 277. | 277. | 278. | 296. | 2.28 | 15.4 | 0.131 | 0.902 | 0.809 | 0.989 | 0.999 | 0.744 | 0.875 | |||
| PRINCETON | [-] | 279. | 279. | 278. | 296. | 2.92 | 15.5 | 0.128 | 0.901 | 0.810 | 0.990 | 0.999 | 0.746 | 0.876 |
Download Data |
Period Mean (original grids) [W/m2] |
Model Period Mean (intersection) [W/m2] |
Model Period Mean (complement) [W/m2] |
Benchmark Period Mean (intersection) [W/m2] |
Benchmark Period Mean (complement) [W/m2] |
Bias [W/m2] |
RMSE [W/m2] |
Phase Shift [months] |
Bias Score [1] |
RMSE Score [1] |
Seasonal Cycle Score [1] |
Spatial Distribution Score [1] |
Interannual Variability Score [1] |
Overall Score [1] |
|||
|---|---|---|---|---|---|---|---|---|---|---|---|---|---|---|---|---|---|
| Benchmark | [-] | 457. | |||||||||||||||
| CESM2_1 | [-] | 458. | 457. | 454. | 467. | 6.21 | 14.9 | 1.95 | 0.292 | 0.331 | 0.714 | 0.861 | 0.646 | 0.529 | |||
| CRUJRA | [-] | 455. | 455. | 454. | 467. | 2.48 | 14.2 | 1.71 | 0.314 | 0.381 | 0.739 | 0.883 | 0.573 | 0.545 | |||
| GSWP3 | [-] | 459. | 459. | 454. | 467. | 5.57 | 14.7 | 1.56 | 0.285 | 0.378 | 0.765 | 0.649 | 0.578 | 0.506 | |||
| PRINCETON | [-] | 460. | 460. | 454. | 467. | 6.84 | 15.1 | 1.61 | 0.280 | 0.387 | 0.750 | 0.735 | 0.556 | 0.516 |
Download Data |
Period Mean (original grids) [W/m2] |
Model Period Mean (intersection) [W/m2] |
Model Period Mean (complement) [W/m2] |
Benchmark Period Mean (intersection) [W/m2] |
Benchmark Period Mean (complement) [W/m2] |
Bias [W/m2] |
RMSE [W/m2] |
Phase Shift [months] |
Bias Score [1] |
RMSE Score [1] |
Seasonal Cycle Score [1] |
Spatial Distribution Score [1] |
Interannual Variability Score [1] |
Overall Score [1] |
|||
|---|---|---|---|---|---|---|---|---|---|---|---|---|---|---|---|---|---|
| Benchmark | [-] | 312. | |||||||||||||||
| CESM2_1 | [-] | 322. | 321. | 311. | 334. | 10.2 | 23.9 | 0.0361 | 0.860 | 0.737 | 0.998 | 0.985 | 0.867 | 0.864 | |||
| CRUJRA | [-] | 311. | 311. | 311. | 334. | -0.188 | 9.62 | 0.0411 | 0.933 | 0.889 | 0.997 | 0.990 | 0.874 | 0.929 | |||
| GSWP3 | [-] | 317. | 317. | 311. | 334. | 5.64 | 11.7 | 0.0485 | 0.907 | 0.884 | 0.997 | 0.999 | 0.858 | 0.922 | |||
| PRINCETON | [-] | 316. | 316. | 311. | 334. | 5.12 | 11.2 | 0.0523 | 0.911 | 0.889 | 0.996 | 1.00 | 0.859 | 0.924 |
Download Data |
Period Mean (original grids) [W/m2] |
Model Period Mean (intersection) [W/m2] |
Model Period Mean (complement) [W/m2] |
Benchmark Period Mean (intersection) [W/m2] |
Benchmark Period Mean (complement) [W/m2] |
Bias [W/m2] |
RMSE [W/m2] |
Phase Shift [months] |
Bias Score [1] |
RMSE Score [1] |
Seasonal Cycle Score [1] |
Spatial Distribution Score [1] |
Interannual Variability Score [1] |
Overall Score [1] |
|||
|---|---|---|---|---|---|---|---|---|---|---|---|---|---|---|---|---|---|
| Benchmark | [-] | 364. | |||||||||||||||
| CESM2_1 | [-] | 369. | 368. | 363. | 410. | 7.58 | 21.6 | 0.282 | 0.822 | 0.730 | 0.978 | 0.999 | 0.853 | 0.852 | |||
| CRUJRA | [-] | 360. | 359. | 363. | 410. | -1.30 | 14.9 | 0.210 | 0.856 | 0.810 | 0.984 | 0.996 | 0.805 | 0.877 | |||
| GSWP3 | [-] | 365. | 365. | 363. | 410. | 3.99 | 14.2 | 0.163 | 0.860 | 0.823 | 0.988 | 0.996 | 0.763 | 0.875 | |||
| PRINCETON | [-] | 364. | 363. | 363. | 410. | 2.34 | 14.1 | 0.158 | 0.861 | 0.823 | 0.988 | 0.999 | 0.780 | 0.879 |
Download Data |
Period Mean (original grids) [W/m2] |
Model Period Mean (intersection) [W/m2] |
Model Period Mean (complement) [W/m2] |
Benchmark Period Mean (intersection) [W/m2] |
Benchmark Period Mean (complement) [W/m2] |
Bias [W/m2] |
RMSE [W/m2] |
Phase Shift [months] |
Bias Score [1] |
RMSE Score [1] |
Seasonal Cycle Score [1] |
Spatial Distribution Score [1] |
Interannual Variability Score [1] |
Overall Score [1] |
|||
|---|---|---|---|---|---|---|---|---|---|---|---|---|---|---|---|---|---|
| Benchmark | [-] | 448. | |||||||||||||||
| CESM2_1 | [-] | 455. | 456. | 446. | 467. | 11.2 | 23.5 | 1.06 | 0.565 | 0.448 | 0.897 | 1.00 | 0.763 | 0.687 | |||
| CRUJRA | [-] | 452. | 453. | 446. | 467. | 8.13 | 19.3 | 0.881 | 0.605 | 0.538 | 0.908 | 1.00 | 0.640 | 0.705 | |||
| GSWP3 | [-] | 453. | 454. | 446. | 467. | 9.37 | 18.8 | 0.830 | 0.607 | 0.557 | 0.912 | 0.980 | 0.628 | 0.707 | |||
| PRINCETON | [-] | 455. | 456. | 446. | 467. | 11.1 | 19.6 | 0.840 | 0.581 | 0.550 | 0.913 | 0.990 | 0.634 | 0.703 |
Download Data |
Period Mean (original grids) [W/m2] |
Model Period Mean (intersection) [W/m2] |
Model Period Mean (complement) [W/m2] |
Benchmark Period Mean (intersection) [W/m2] |
Benchmark Period Mean (complement) [W/m2] |
Bias [W/m2] |
RMSE [W/m2] |
Phase Shift [months] |
Bias Score [1] |
RMSE Score [1] |
Seasonal Cycle Score [1] |
Spatial Distribution Score [1] |
Interannual Variability Score [1] |
Overall Score [1] |
|||
|---|---|---|---|---|---|---|---|---|---|---|---|---|---|---|---|---|---|
| Benchmark | [-] | 281. | |||||||||||||||
| CESM2_1 | [-] | 290. | 291. | 281. | 288. | 10.1 | 28.7 | 0.165 | 0.845 | 0.663 | 0.988 | 0.940 | 0.834 | 0.822 | |||
| CRUJRA | [-] | 281. | 281. | 281. | 288. | 0.703 | 12.7 | 0.0825 | 0.935 | 0.820 | 0.993 | 0.996 | 0.819 | 0.897 | |||
| GSWP3 | [-] | 284. | 285. | 281. | 288. | 4.60 | 13.4 | 0.0882 | 0.909 | 0.828 | 0.993 | 0.999 | 0.766 | 0.887 | |||
| PRINCETON | [-] | 286. | 286. | 281. | 288. | 5.91 | 14.2 | 0.0825 | 0.891 | 0.826 | 0.993 | 1.00 | 0.785 | 0.887 |
Download Data |
Period Mean (original grids) [W/m2] |
Model Period Mean (intersection) [W/m2] |
Model Period Mean (complement) [W/m2] |
Benchmark Period Mean (intersection) [W/m2] |
Benchmark Period Mean (complement) [W/m2] |
Bias [W/m2] |
RMSE [W/m2] |
Phase Shift [months] |
Bias Score [1] |
RMSE Score [1] |
Seasonal Cycle Score [1] |
Spatial Distribution Score [1] |
Interannual Variability Score [1] |
Overall Score [1] |
|||
|---|---|---|---|---|---|---|---|---|---|---|---|---|---|---|---|---|---|
| Benchmark | [-] | 441. | |||||||||||||||
| CESM2_1 | [-] | 450. | 450. | 443. | 426. | 4.68 | 19.6 | 0.519 | 0.751 | 0.583 | 0.955 | 0.971 | 0.766 | 0.768 | |||
| CRUJRA | [-] | 444. | 444. | 443. | 426. | -0.732 | 13.8 | 0.400 | 0.804 | 0.678 | 0.966 | 0.992 | 0.737 | 0.809 | |||
| GSWP3 | [-] | 449. | 449. | 443. | 426. | 3.64 | 13.3 | 0.382 | 0.796 | 0.692 | 0.969 | 0.990 | 0.739 | 0.813 | |||
| PRINCETON | [-] | 447. | 447. | 443. | 426. | 1.66 | 13.2 | 0.400 | 0.810 | 0.686 | 0.967 | 0.992 | 0.736 | 0.813 |
Download Data |
Period Mean (original grids) [W/m2] |
Model Period Mean (intersection) [W/m2] |
Model Period Mean (complement) [W/m2] |
Benchmark Period Mean (intersection) [W/m2] |
Benchmark Period Mean (complement) [W/m2] |
Bias [W/m2] |
RMSE [W/m2] |
Phase Shift [months] |
Bias Score [1] |
RMSE Score [1] |
Seasonal Cycle Score [1] |
Spatial Distribution Score [1] |
Interannual Variability Score [1] |
Overall Score [1] |
|||
|---|---|---|---|---|---|---|---|---|---|---|---|---|---|---|---|---|---|
| Benchmark | [-] | 368. | |||||||||||||||
| CESM2_1 | [-] | 374. | 374. | 366. | 389. | 10.8 | 21.0 | 0.521 | 0.737 | 0.656 | 0.965 | 0.998 | 0.780 | 0.799 | |||
| CRUJRA | [-] | 362. | 362. | 366. | 389. | -1.05 | 11.7 | 0.465 | 0.858 | 0.768 | 0.969 | 0.998 | 0.784 | 0.857 | |||
| GSWP3 | [-] | 365. | 365. | 366. | 389. | 1.38 | 11.8 | 0.435 | 0.859 | 0.773 | 0.971 | 0.999 | 0.780 | 0.859 | |||
| PRINCETON | [-] | 365. | 365. | 366. | 389. | 1.39 | 11.7 | 0.408 | 0.858 | 0.776 | 0.973 | 0.996 | 0.776 | 0.859 |
Download Data |
Period Mean (original grids) [W/m2] |
Model Period Mean (intersection) [W/m2] |
Model Period Mean (complement) [W/m2] |
Benchmark Period Mean (intersection) [W/m2] |
Benchmark Period Mean (complement) [W/m2] |
Bias [W/m2] |
RMSE [W/m2] |
Phase Shift [months] |
Bias Score [1] |
RMSE Score [1] |
Seasonal Cycle Score [1] |
Spatial Distribution Score [1] |
Interannual Variability Score [1] |
Overall Score [1] |
|||
|---|---|---|---|---|---|---|---|---|---|---|---|---|---|---|---|---|---|
| Benchmark | [-] | 399. | |||||||||||||||
| CESM2_1 | [-] | 382. | 382. | 376. | 409. | 7.47 | 21.1 | 0.702 | 0.694 | 0.592 | 0.926 | 0.999 | 0.785 | 0.765 | |||
| CRUJRA | [-] | 387. | 387. | 376. | 409. | 11.5 | 25.2 | 0.678 | 0.689 | 0.639 | 0.923 | 0.818 | 0.693 | 0.734 | |||
| GSWP3 | [-] | 381. | 381. | 376. | 409. | 6.30 | 16.1 | 0.538 | 0.722 | 0.667 | 0.940 | 0.999 | 0.692 | 0.781 | |||
| PRINCETON | [-] | 380. | 380. | 376. | 409. | 5.45 | 15.5 | 0.565 | 0.730 | 0.678 | 0.934 | 1.00 | 0.711 | 0.788 |
Download Data |
Period Mean (original grids) [W/m2] |
Model Period Mean (intersection) [W/m2] |
Model Period Mean (complement) [W/m2] |
Benchmark Period Mean (intersection) [W/m2] |
Benchmark Period Mean (complement) [W/m2] |
Bias [W/m2] |
RMSE [W/m2] |
Phase Shift [months] |
Bias Score [1] |
RMSE Score [1] |
Seasonal Cycle Score [1] |
Spatial Distribution Score [1] |
Interannual Variability Score [1] |
Overall Score [1] |
|||
|---|---|---|---|---|---|---|---|---|---|---|---|---|---|---|---|---|---|
| Benchmark | [-] | 450. | |||||||||||||||
| CESM2_1 | [-] | 449. | 449. | 450. | 447. | -0.735 | 18.4 | 0.399 | 0.829 | 0.710 | 0.969 | 0.999 | 0.793 | 0.835 | |||
| CRUJRA | [-] | 445. | 445. | 450. | 447. | -4.72 | 16.9 | 0.395 | 0.823 | 0.738 | 0.968 | 0.999 | 0.704 | 0.828 | |||
| GSWP3 | [-] | 452. | 452. | 450. | 447. | 2.19 | 15.1 | 0.357 | 0.844 | 0.760 | 0.973 | 1.00 | 0.716 | 0.842 | |||
| PRINCETON | [-] | 451. | 451. | 450. | 447. | 1.55 | 14.9 | 0.302 | 0.845 | 0.762 | 0.977 | 1.00 | 0.696 | 0.840 |
Download Data |
Period Mean (original grids) [W/m2] |
Model Period Mean (intersection) [W/m2] |
Model Period Mean (complement) [W/m2] |
Benchmark Period Mean (intersection) [W/m2] |
Benchmark Period Mean (complement) [W/m2] |
Bias [W/m2] |
RMSE [W/m2] |
Phase Shift [months] |
Bias Score [1] |
RMSE Score [1] |
Seasonal Cycle Score [1] |
Spatial Distribution Score [1] |
Interannual Variability Score [1] |
Overall Score [1] |
|||
|---|---|---|---|---|---|---|---|---|---|---|---|---|---|---|---|---|---|
| Benchmark | [-] | 281. | |||||||||||||||
| CESM2_1 | [-] | 292. | 292. | 281. | 293. | 10.5 | 27.1 | 0.464 | 0.841 | 0.682 | 0.968 | 0.998 | 0.855 | 0.838 | |||
| CRUJRA | [-] | 284. | 284. | 281. | 293. | 2.31 | 14.6 | 0.168 | 0.917 | 0.803 | 0.986 | 0.998 | 0.813 | 0.887 | |||
| GSWP3 | [-] | 287. | 287. | 281. | 293. | 6.32 | 16.7 | 0.176 | 0.884 | 0.793 | 0.986 | 1.00 | 0.761 | 0.870 | |||
| PRINCETON | [-] | 289. | 289. | 281. | 293. | 7.19 | 16.5 | 0.160 | 0.878 | 0.801 | 0.987 | 1.00 | 0.767 | 0.872 |
Download Data |
Period Mean (original grids) [W/m2] |
Model Period Mean (intersection) [W/m2] |
Model Period Mean (complement) [W/m2] |
Benchmark Period Mean (intersection) [W/m2] |
Benchmark Period Mean (complement) [W/m2] |
Bias [W/m2] |
RMSE [W/m2] |
Phase Shift [months] |
Bias Score [1] |
RMSE Score [1] |
Seasonal Cycle Score [1] |
Spatial Distribution Score [1] |
Interannual Variability Score [1] |
Overall Score [1] |
|||
|---|---|---|---|---|---|---|---|---|---|---|---|---|---|---|---|---|---|
| Benchmark | [-] | 442. | |||||||||||||||
| CESM2_1 | [-] | 448. | 448. | 439. | 459. | 14.3 | 23.8 | 1.31 | 0.440 | 0.457 | 0.838 | 0.993 | 0.768 | 0.659 | |||
| CRUJRA | [-] | 441. | 441. | 439. | 459. | 6.80 | 16.8 | 0.977 | 0.576 | 0.542 | 0.879 | 0.997 | 0.682 | 0.703 | |||
| GSWP3 | [-] | 447. | 447. | 439. | 459. | 12.0 | 18.5 | 0.881 | 0.510 | 0.561 | 0.893 | 0.950 | 0.673 | 0.691 | |||
| PRINCETON | [-] | 448. | 448. | 439. | 459. | 12.2 | 19.2 | 0.934 | 0.510 | 0.544 | 0.885 | 0.956 | 0.679 | 0.686 |
Download Data |
Period Mean (original grids) [W/m2] |
Model Period Mean (intersection) [W/m2] |
Model Period Mean (complement) [W/m2] |
Benchmark Period Mean (intersection) [W/m2] |
Benchmark Period Mean (complement) [W/m2] |
Bias [W/m2] |
RMSE [W/m2] |
Phase Shift [months] |
Bias Score [1] |
RMSE Score [1] |
Seasonal Cycle Score [1] |
Spatial Distribution Score [1] |
Interannual Variability Score [1] |
Overall Score [1] |
|||
|---|---|---|---|---|---|---|---|---|---|---|---|---|---|---|---|---|---|
| Benchmark | [-] | 386. | |||||||||||||||
| CESM2_1 | [-] | 402. | 402. | 384. | 429. | 19.2 | 26.6 | 0.794 | 0.677 | 0.710 | 0.947 | 0.990 | 0.915 | 0.825 | |||
| CRUJRA | [-] | 387. | 387. | 384. | 429. | 4.93 | 10.8 | 0.143 | 0.879 | 0.848 | 0.990 | 0.997 | 0.848 | 0.902 | |||
| GSWP3 | [-] | 391. | 391. | 384. | 429. | 9.08 | 13.1 | 0.116 | 0.820 | 0.856 | 0.992 | 0.993 | 0.850 | 0.895 | |||
| PRINCETON | [-] | 391. | 391. | 384. | 429. | 8.85 | 12.9 | 0.135 | 0.824 | 0.857 | 0.991 | 0.998 | 0.854 | 0.897 |
Download Data |
Period Mean (original grids) [W/m2] |
Model Period Mean (intersection) [W/m2] |
Model Period Mean (complement) [W/m2] |
Benchmark Period Mean (intersection) [W/m2] |
Benchmark Period Mean (complement) [W/m2] |
Bias [W/m2] |
RMSE [W/m2] |
Phase Shift [months] |
Bias Score [1] |
RMSE Score [1] |
Seasonal Cycle Score [1] |
Spatial Distribution Score [1] |
Interannual Variability Score [1] |
Overall Score [1] |
|||
|---|---|---|---|---|---|---|---|---|---|---|---|---|---|---|---|---|---|
| Benchmark | [-] | 324. | |||||||||||||||
| CESM2_1 | [-] | 335. | 335. | 323. | 347. | 12.9 | 23.9 | 0.483 | 0.793 | 0.716 | 0.968 | 0.987 | 0.856 | 0.839 | |||
| CRUJRA | [-] | 325. | 325. | 323. | 347. | 2.56 | 11.6 | 0.123 | 0.906 | 0.836 | 0.991 | 0.980 | 0.809 | 0.893 | |||
| GSWP3 | [-] | 328. | 328. | 323. | 347. | 6.00 | 13.2 | 0.114 | 0.878 | 0.832 | 0.992 | 0.971 | 0.780 | 0.881 | |||
| PRINCETON | [-] | 329. | 329. | 323. | 347. | 6.46 | 13.1 | 0.126 | 0.876 | 0.837 | 0.991 | 0.972 | 0.786 | 0.883 |
Download Data |
Period Mean (original grids) [W/m2] |
Model Period Mean (intersection) [W/m2] |
Model Period Mean (complement) [W/m2] |
Benchmark Period Mean (intersection) [W/m2] |
Benchmark Period Mean (complement) [W/m2] |
Bias [W/m2] |
RMSE [W/m2] |
Phase Shift [months] |
Bias Score [1] |
RMSE Score [1] |
Seasonal Cycle Score [1] |
Spatial Distribution Score [1] |
Interannual Variability Score [1] |
Overall Score [1] |
|||
|---|---|---|---|---|---|---|---|---|---|---|---|---|---|---|---|---|---|
| Benchmark | [-] | 377. | |||||||||||||||
| CESM2_1 | [-] | 392. | 393. | 377. | 378. | 15.5 | 24.5 | 0.311 | 0.734 | 0.714 | 0.979 | 0.998 | 0.838 | 0.830 | |||
| CRUJRA | [-] | 375. | 376. | 377. | 378. | -0.741 | 13.9 | 0.127 | 0.854 | 0.804 | 0.991 | 0.999 | 0.753 | 0.868 | |||
| GSWP3 | [-] | 381. | 382. | 377. | 378. | 5.22 | 14.1 | 0.113 | 0.842 | 0.814 | 0.992 | 0.999 | 0.745 | 0.868 | |||
| PRINCETON | [-] | 382. | 383. | 377. | 378. | 6.46 | 14.7 | 0.113 | 0.831 | 0.814 | 0.992 | 0.998 | 0.763 | 0.869 |
Download Data |
Period Mean (original grids) [W/m2] |
Model Period Mean (intersection) [W/m2] |
Model Period Mean (complement) [W/m2] |
Benchmark Period Mean (intersection) [W/m2] |
Benchmark Period Mean (complement) [W/m2] |
Bias [W/m2] |
RMSE [W/m2] |
Phase Shift [months] |
Bias Score [1] |
RMSE Score [1] |
Seasonal Cycle Score [1] |
Spatial Distribution Score [1] |
Interannual Variability Score [1] |
Overall Score [1] |
|||
|---|---|---|---|---|---|---|---|---|---|---|---|---|---|---|---|---|---|
| Benchmark | [-] | 449. | |||||||||||||||
| CESM2_1 | [-] | 458. | 458. | 449. | 463. | 9.51 | 16.0 | 1.18 | 0.305 | 0.332 | 0.854 | 0.982 | 0.742 | 0.591 | |||
| CRUJRA | [-] | 452. | 452. | 449. | 463. | 3.84 | 11.8 | 1.29 | 0.465 | 0.407 | 0.825 | 0.987 | 0.611 | 0.617 | |||
| GSWP3 | [-] | 458. | 458. | 449. | 463. | 9.10 | 14.8 | 1.21 | 0.318 | 0.399 | 0.838 | 0.991 | 0.625 | 0.595 | |||
| PRINCETON | [-] | 459. | 459. | 449. | 463. | 9.87 | 15.3 | 1.42 | 0.310 | 0.391 | 0.801 | 0.994 | 0.623 | 0.585 |
Download Data |
Period Mean (original grids) [W/m2] |
Model Period Mean (intersection) [W/m2] |
Model Period Mean (complement) [W/m2] |
Benchmark Period Mean (intersection) [W/m2] |
Benchmark Period Mean (complement) [W/m2] |
Bias [W/m2] |
RMSE [W/m2] |
Phase Shift [months] |
Bias Score [1] |
RMSE Score [1] |
Seasonal Cycle Score [1] |
Spatial Distribution Score [1] |
Interannual Variability Score [1] |
Overall Score [1] |
|||
|---|---|---|---|---|---|---|---|---|---|---|---|---|---|---|---|---|---|
| Benchmark | [-] | 443. | |||||||||||||||
| CESM2_1 | [-] | 453. | 452. | 443. | 434. | 8.35 | 20.1 | 1.02 | 0.628 | 0.452 | 0.871 | 0.990 | 0.779 | 0.695 | |||
| CRUJRA | [-] | 442. | 442. | 443. | 434. | -1.52 | 14.0 | 1.10 | 0.741 | 0.543 | 0.843 | 1.00 | 0.643 | 0.719 | |||
| GSWP3 | [-] | 450. | 449. | 443. | 434. | 5.48 | 14.2 | 0.907 | 0.694 | 0.563 | 0.866 | 0.992 | 0.663 | 0.724 | |||
| PRINCETON | [-] | 447. | 447. | 443. | 434. | 3.41 | 14.1 | 1.18 | 0.743 | 0.541 | 0.821 | 0.999 | 0.655 | 0.717 |
Download Data |
Period Mean (original grids) [W/m2] |
Model Period Mean (intersection) [W/m2] |
Model Period Mean (complement) [W/m2] |
Benchmark Period Mean (intersection) [W/m2] |
Benchmark Period Mean (complement) [W/m2] |
Bias [W/m2] |
RMSE [W/m2] |
Phase Shift [months] |
Bias Score [1] |
RMSE Score [1] |
Seasonal Cycle Score [1] |
Spatial Distribution Score [1] |
Interannual Variability Score [1] |
Overall Score [1] |
|||
|---|---|---|---|---|---|---|---|---|---|---|---|---|---|---|---|---|---|
| Benchmark | [-] | 383. | |||||||||||||||
| CESM2_1 | [-] | 388. | 387. | 381. | 396. | 6.97 | 22.4 | 0.871 | 0.626 | 0.520 | 0.891 | 0.996 | 0.688 | 0.707 | |||
| CRUJRA | [-] | 379. | 378. | 381. | 396. | -0.951 | 21.7 | 1.09 | 0.613 | 0.561 | 0.849 | 0.999 | 0.648 | 0.705 | |||
| GSWP3 | [-] | 387. | 386. | 381. | 396. | 5.49 | 20.2 | 0.896 | 0.632 | 0.569 | 0.890 | 0.998 | 0.636 | 0.716 | |||
| PRINCETON | [-] | 386. | 386. | 381. | 396. | 5.83 | 21.0 | 0.920 | 0.617 | 0.570 | 0.886 | 0.999 | 0.650 | 0.715 |
Temporally integrated period mean