Mean State
Download Data |
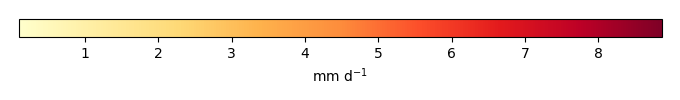
Period Mean (original grids) [mm d-1] |
Model Period Mean (intersection) [mm d-1] |
Model Period Mean (complement) [mm d-1] |
Benchmark Period Mean (intersection) [mm d-1] |
Benchmark Period Mean (complement) [mm d-1] |
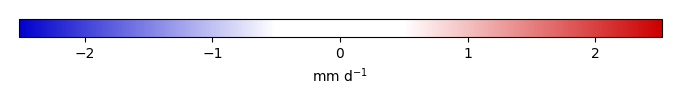
Bias [mm d-1] |
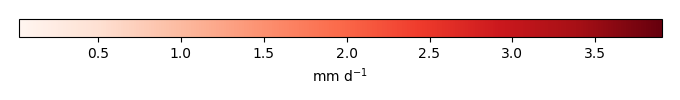
RMSE [mm d-1] |
Phase Shift [months] |
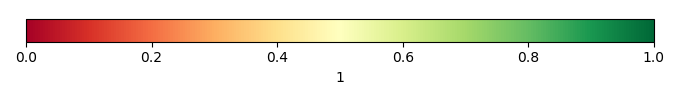
Bias Score [1] |
RMSE Score [1] |
Seasonal Cycle Score [1] |
Spatial Distribution Score [1] |
Interannual Variability Score [1] |
Overall Score [1] |
|||
|---|---|---|---|---|---|---|---|---|---|---|---|---|---|---|---|---|---|
| Benchmark | [-] | 3.68 | |||||||||||||||
| CESM2_1_001 | [-] | 4.19 | 4.21 | 3.70 | 3.31 | 0.509 | 2.63 | 1.69 | 0.755 | 0.314 | 0.860 | 0.955 | 0.644 | 0.640 | |||
| CESM2_1_002 | [-] | 4.16 | 4.18 | 3.70 | 3.31 | 0.474 | 2.67 | 1.71 | 0.764 | 0.313 | 0.850 | 0.963 | 0.626 | 0.638 | |||
| CESM2_1_003 | [-] | 4.24 | 4.26 | 3.70 | 3.31 | 0.561 | 2.72 | 1.79 | 0.740 | 0.307 | 0.867 | 0.953 | 0.621 | 0.632 | |||
| CRUJRA | [-] | 3.57 | 3.59 | 3.70 | 3.31 | -0.105 | 1.59 | 0.657 | 0.829 | 0.499 | 0.931 | 0.993 | 0.751 | 0.750 | |||
| GSWP3 | [-] | 3.57 | 3.58 | 3.70 | 3.31 | -0.120 | 1.58 | 0.837 | 0.806 | 0.502 | 0.910 | 0.990 | 0.635 | 0.724 | |||
| LENS1 | [-] | 4.19 | 4.18 | 3.71 | 3.34 | 0.484 | 2.60 | 2.79 | 0.750 | 0.346 | 0.635 | 0.988 | 0.766 | 0.639 | |||
| LENS10 | [-] | 4.12 | 4.11 | 3.71 | 3.34 | 0.409 | 2.55 | 2.71 | 0.746 | 0.347 | 0.640 | 0.984 | 0.798 | 0.644 | |||
| LENS5 | [-] | 4.09 | 4.07 | 3.71 | 3.34 | 0.381 | 2.52 | 2.67 | 0.752 | 0.350 | 0.660 | 0.984 | 0.796 | 0.649 | |||
| PRINCETON | [-] | 3.53 | 3.55 | 3.70 | 3.31 | -0.161 | 1.52 | 0.572 | 0.830 | 0.513 | 0.935 | 0.993 | 0.803 | 0.765 |
Download Data |
Period Mean (original grids) [mm d-1] |
Model Period Mean (intersection) [mm d-1] |
Model Period Mean (complement) [mm d-1] |
Benchmark Period Mean (intersection) [mm d-1] |
Benchmark Period Mean (complement) [mm d-1] |
Bias [mm d-1] |
RMSE [mm d-1] |
Phase Shift [months] |
Bias Score [1] |
RMSE Score [1] |
Seasonal Cycle Score [1] |
Spatial Distribution Score [1] |
Interannual Variability Score [1] |
Overall Score [1] |
|||
|---|---|---|---|---|---|---|---|---|---|---|---|---|---|---|---|---|---|
| Benchmark | [-] | 2.47 | |||||||||||||||
| CESM2_1_001 | [-] | 2.59 | 2.54 | 2.45 | 3.94 | 0.0893 | 1.91 | 0.511 | 0.805 | 0.491 | 0.940 | 0.916 | 0.632 | 0.712 | |||
| CESM2_1_002 | [-] | 2.56 | 2.52 | 2.45 | 3.94 | 0.0692 | 1.98 | 0.549 | 0.807 | 0.478 | 0.931 | 0.918 | 0.593 | 0.701 | |||
| CESM2_1_003 | [-] | 2.61 | 2.57 | 2.45 | 3.94 | 0.115 | 1.99 | 0.550 | 0.801 | 0.473 | 0.938 | 0.917 | 0.579 | 0.697 | |||
| CRUJRA | [-] | 2.36 | 2.33 | 2.45 | 3.94 | -0.112 | 1.19 | 0.199 | 0.873 | 0.642 | 0.977 | 0.991 | 0.752 | 0.813 | |||
| GSWP3 | [-] | 2.34 | 2.31 | 2.45 | 3.94 | -0.131 | 1.12 | 0.222 | 0.863 | 0.664 | 0.973 | 0.990 | 0.734 | 0.815 | |||
| LENS1 | [-] | 2.98 | 2.95 | 2.43 | 4.10 | 0.517 | 2.06 | 0.845 | 0.785 | 0.490 | 0.866 | 0.969 | 0.815 | 0.736 | |||
| LENS10 | [-] | 2.93 | 2.91 | 2.43 | 4.10 | 0.473 | 2.07 | 0.846 | 0.786 | 0.484 | 0.864 | 0.973 | 0.832 | 0.737 | |||
| LENS5 | [-] | 2.96 | 2.95 | 2.43 | 4.10 | 0.507 | 2.06 | 0.850 | 0.784 | 0.487 | 0.869 | 0.970 | 0.850 | 0.741 | |||
| PRINCETON | [-] | 2.30 | 2.27 | 2.45 | 3.94 | -0.177 | 1.16 | 0.209 | 0.867 | 0.652 | 0.976 | 0.991 | 0.784 | 0.820 |
Download Data |
Period Mean (original grids) [mm d-1] |
Model Period Mean (intersection) [mm d-1] |
Model Period Mean (complement) [mm d-1] |
Benchmark Period Mean (intersection) [mm d-1] |
Benchmark Period Mean (complement) [mm d-1] |
Bias [mm d-1] |
RMSE [mm d-1] |
Phase Shift [months] |
Bias Score [1] |
RMSE Score [1] |
Seasonal Cycle Score [1] |
Spatial Distribution Score [1] |
Interannual Variability Score [1] |
Overall Score [1] |
|||
|---|---|---|---|---|---|---|---|---|---|---|---|---|---|---|---|---|---|
| Benchmark | [-] | 2.43 | |||||||||||||||
| CESM2_1_001 | [-] | 2.95 | 2.94 | 2.43 | 2.45 | 0.463 | 2.47 | 0.966 | 0.766 | 0.385 | 0.873 | 0.981 | 0.622 | 0.669 | |||
| CESM2_1_002 | [-] | 2.95 | 2.94 | 2.43 | 2.45 | 0.454 | 2.55 | 1.00 | 0.748 | 0.381 | 0.869 | 0.976 | 0.632 | 0.665 | |||
| CESM2_1_003 | [-] | 2.95 | 2.94 | 2.43 | 2.45 | 0.462 | 2.55 | 1.08 | 0.752 | 0.376 | 0.865 | 0.976 | 0.614 | 0.660 | |||
| CRUJRA | [-] | 2.31 | 2.30 | 2.43 | 2.45 | -0.121 | 1.27 | 0.662 | 0.859 | 0.606 | 0.925 | 0.991 | 0.816 | 0.801 | |||
| GSWP3 | [-] | 2.37 | 2.37 | 2.43 | 2.45 | -0.0788 | 1.22 | 0.593 | 0.855 | 0.623 | 0.921 | 0.986 | 0.750 | 0.793 | |||
| LENS1 | [-] | 2.84 | 2.84 | 2.42 | 2.48 | 0.425 | 2.24 | 0.948 | 0.787 | 0.436 | 0.869 | 0.972 | 0.828 | 0.721 | |||
| LENS10 | [-] | 2.82 | 2.82 | 2.42 | 2.48 | 0.408 | 2.26 | 1.00 | 0.783 | 0.432 | 0.852 | 0.974 | 0.821 | 0.716 | |||
| LENS5 | [-] | 2.89 | 2.89 | 2.42 | 2.48 | 0.476 | 2.30 | 1.12 | 0.775 | 0.429 | 0.844 | 0.972 | 0.814 | 0.711 | |||
| PRINCETON | [-] | 2.29 | 2.28 | 2.43 | 2.45 | -0.168 | 1.25 | 0.679 | 0.857 | 0.614 | 0.921 | 0.991 | 0.859 | 0.809 |
Download Data |
Period Mean (original grids) [mm d-1] |
Model Period Mean (intersection) [mm d-1] |
Model Period Mean (complement) [mm d-1] |
Benchmark Period Mean (intersection) [mm d-1] |
Benchmark Period Mean (complement) [mm d-1] |
Bias [mm d-1] |
RMSE [mm d-1] |
Phase Shift [months] |
Bias Score [1] |
RMSE Score [1] |
Seasonal Cycle Score [1] |
Spatial Distribution Score [1] |
Interannual Variability Score [1] |
Overall Score [1] |
|||
|---|---|---|---|---|---|---|---|---|---|---|---|---|---|---|---|---|---|
| Benchmark | [-] | 1.33 | |||||||||||||||
| CESM2_1_001 | [-] | 1.45 | 1.45 | 1.31 | 1.57 | 0.167 | 1.06 | 0.956 | 0.767 | 0.296 | 0.859 | 0.990 | 0.822 | 0.672 | |||
| CESM2_1_002 | [-] | 1.46 | 1.46 | 1.31 | 1.57 | 0.185 | 1.09 | 0.864 | 0.762 | 0.287 | 0.861 | 0.990 | 0.806 | 0.666 | |||
| CESM2_1_003 | [-] | 1.50 | 1.50 | 1.31 | 1.57 | 0.221 | 1.09 | 0.827 | 0.741 | 0.290 | 0.856 | 0.984 | 0.799 | 0.660 | |||
| CRUJRA | [-] | 0.944 | 0.944 | 1.31 | 1.57 | -0.340 | 0.616 | 0.678 | 0.658 | 0.560 | 0.888 | 0.942 | 0.799 | 0.734 | |||
| GSWP3 | [-] | 1.12 | 1.11 | 1.31 | 1.57 | -0.155 | 0.528 | 0.673 | 0.764 | 0.584 | 0.898 | 0.986 | 0.838 | 0.776 | |||
| LENS1 | [-] | 1.24 | 1.24 | 1.30 | 1.55 | -0.0198 | 1.01 | 0.928 | 0.773 | 0.302 | 0.860 | 0.986 | 0.820 | 0.674 | |||
| LENS10 | [-] | 1.24 | 1.24 | 1.30 | 1.55 | -0.0182 | 1.01 | 0.882 | 0.765 | 0.305 | 0.873 | 0.987 | 0.798 | 0.672 | |||
| LENS5 | [-] | 1.21 | 1.21 | 1.30 | 1.55 | -0.0453 | 1.03 | 0.874 | 0.757 | 0.297 | 0.860 | 0.983 | 0.805 | 0.666 | |||
| PRINCETON | [-] | 0.924 | 0.925 | 1.31 | 1.57 | -0.349 | 0.630 | 0.662 | 0.649 | 0.556 | 0.892 | 0.945 | 0.779 | 0.730 |
Download Data |
Period Mean (original grids) [mm d-1] |
Model Period Mean (intersection) [mm d-1] |
Model Period Mean (complement) [mm d-1] |
Benchmark Period Mean (intersection) [mm d-1] |
Benchmark Period Mean (complement) [mm d-1] |
Bias [mm d-1] |
RMSE [mm d-1] |
Phase Shift [months] |
Bias Score [1] |
RMSE Score [1] |
Seasonal Cycle Score [1] |
Spatial Distribution Score [1] |
Interannual Variability Score [1] |
Overall Score [1] |
|||
|---|---|---|---|---|---|---|---|---|---|---|---|---|---|---|---|---|---|
| Benchmark | [-] | 6.97 | |||||||||||||||
| CESM2_1_001 | [-] | 9.74 | 9.76 | 7.28 | 5.92 | 1.84 | 5.56 | 1.36 | 0.531 | 0.204 | 0.800 | 0.831 | 0.518 | 0.515 | |||
| CESM2_1_002 | [-] | 9.99 | 10.0 | 7.28 | 5.92 | 2.10 | 5.80 | 1.45 | 0.519 | 0.192 | 0.788 | 0.813 | 0.487 | 0.499 | |||
| CESM2_1_003 | [-] | 10.0 | 10.0 | 7.28 | 5.92 | 2.10 | 5.80 | 1.50 | 0.509 | 0.193 | 0.779 | 0.813 | 0.524 | 0.502 | |||
| CRUJRA | [-] | 8.01 | 8.02 | 7.28 | 5.92 | 0.434 | 3.29 | 1.34 | 0.682 | 0.393 | 0.796 | 0.988 | 0.763 | 0.669 | |||
| GSWP3 | [-] | 8.02 | 8.04 | 7.28 | 5.92 | 0.268 | 3.18 | 1.31 | 0.660 | 0.422 | 0.795 | 0.950 | 0.746 | 0.666 | |||
| LENS1 | [-] | 7.47 | 7.47 | 7.17 | 5.84 | 0.427 | 4.90 | 1.59 | 0.597 | 0.244 | 0.773 | 0.978 | 0.699 | 0.589 | |||
| LENS10 | [-] | 7.48 | 7.48 | 7.17 | 5.84 | 0.433 | 4.69 | 1.59 | 0.596 | 0.263 | 0.777 | 0.978 | 0.733 | 0.602 | |||
| LENS5 | [-] | 7.78 | 7.78 | 7.17 | 5.84 | 0.753 | 4.69 | 2.00 | 0.578 | 0.268 | 0.687 | 0.973 | 0.760 | 0.589 | |||
| PRINCETON | [-] | 7.97 | 7.98 | 7.28 | 5.92 | 0.214 | 3.19 | 1.30 | 0.674 | 0.404 | 0.804 | 0.987 | 0.781 | 0.676 |
Download Data |
Period Mean (original grids) [mm d-1] |
Model Period Mean (intersection) [mm d-1] |
Model Period Mean (complement) [mm d-1] |
Benchmark Period Mean (intersection) [mm d-1] |
Benchmark Period Mean (complement) [mm d-1] |
Bias [mm d-1] |
RMSE [mm d-1] |
Phase Shift [months] |
Bias Score [1] |
RMSE Score [1] |
Seasonal Cycle Score [1] |
Spatial Distribution Score [1] |
Interannual Variability Score [1] |
Overall Score [1] |
|||
|---|---|---|---|---|---|---|---|---|---|---|---|---|---|---|---|---|---|
| Benchmark | [-] | 1.71 | |||||||||||||||
| CESM2_1_001 | [-] | 1.62 | 1.62 | 1.70 | 2.46 | -0.0613 | 1.16 | 1.11 | 0.707 | 0.322 | 0.811 | 0.915 | 0.810 | 0.648 | |||
| CESM2_1_002 | [-] | 1.62 | 1.62 | 1.70 | 2.46 | -0.0659 | 1.14 | 1.26 | 0.716 | 0.329 | 0.792 | 0.923 | 0.814 | 0.650 | |||
| CESM2_1_003 | [-] | 1.63 | 1.63 | 1.70 | 2.46 | -0.0576 | 1.15 | 1.23 | 0.720 | 0.326 | 0.784 | 0.915 | 0.806 | 0.646 | |||
| CRUJRA | [-] | 1.43 | 1.43 | 1.70 | 2.46 | -0.256 | 0.566 | 0.910 | 0.726 | 0.610 | 0.832 | 0.884 | 0.891 | 0.759 | |||
| GSWP3 | [-] | 1.47 | 1.47 | 1.70 | 2.46 | -0.216 | 0.507 | 0.833 | 0.761 | 0.642 | 0.844 | 0.972 | 0.898 | 0.793 | |||
| LENS1 | [-] | 1.45 | 1.45 | 1.68 | 2.44 | -0.228 | 1.12 | 0.990 | 0.666 | 0.335 | 0.851 | 0.897 | 0.853 | 0.656 | |||
| LENS10 | [-] | 1.45 | 1.45 | 1.68 | 2.44 | -0.223 | 1.14 | 0.860 | 0.668 | 0.331 | 0.866 | 0.904 | 0.844 | 0.657 | |||
| LENS5 | [-] | 1.48 | 1.48 | 1.68 | 2.44 | -0.194 | 1.12 | 0.986 | 0.685 | 0.334 | 0.859 | 0.915 | 0.857 | 0.664 | |||
| PRINCETON | [-] | 1.41 | 1.41 | 1.70 | 2.46 | -0.272 | 0.572 | 0.920 | 0.716 | 0.611 | 0.830 | 0.887 | 0.890 | 0.758 |
Download Data |
Period Mean (original grids) [mm d-1] |
Model Period Mean (intersection) [mm d-1] |
Model Period Mean (complement) [mm d-1] |
Benchmark Period Mean (intersection) [mm d-1] |
Benchmark Period Mean (complement) [mm d-1] |
Bias [mm d-1] |
RMSE [mm d-1] |
Phase Shift [months] |
Bias Score [1] |
RMSE Score [1] |
Seasonal Cycle Score [1] |
Spatial Distribution Score [1] |
Interannual Variability Score [1] |
Overall Score [1] |
|||
|---|---|---|---|---|---|---|---|---|---|---|---|---|---|---|---|---|---|
| Benchmark | [-] | 1.77 | |||||||||||||||
| CESM2_1_001 | [-] | 1.88 | 1.89 | 1.73 | 4.26 | 0.244 | 1.71 | 0.910 | 0.688 | 0.324 | 0.886 | 0.931 | 0.650 | 0.634 | |||
| CESM2_1_002 | [-] | 1.92 | 1.93 | 1.73 | 4.26 | 0.282 | 1.75 | 0.906 | 0.683 | 0.315 | 0.884 | 0.930 | 0.645 | 0.629 | |||
| CESM2_1_003 | [-] | 1.89 | 1.91 | 1.73 | 4.26 | 0.259 | 1.76 | 0.873 | 0.677 | 0.312 | 0.889 | 0.924 | 0.633 | 0.624 | |||
| CRUJRA | [-] | 1.45 | 1.45 | 1.73 | 4.26 | -0.170 | 0.784 | 0.987 | 0.793 | 0.597 | 0.875 | 0.990 | 0.825 | 0.779 | |||
| GSWP3 | [-] | 1.46 | 1.47 | 1.73 | 4.26 | -0.176 | 0.742 | 0.785 | 0.790 | 0.619 | 0.894 | 0.987 | 0.836 | 0.791 | |||
| LENS1 | [-] | 1.90 | 1.93 | 1.74 | 2.78 | 0.270 | 1.72 | 1.03 | 0.695 | 0.336 | 0.863 | 0.898 | 0.737 | 0.644 | |||
| LENS10 | [-] | 1.91 | 1.94 | 1.74 | 2.78 | 0.279 | 1.72 | 0.995 | 0.695 | 0.336 | 0.862 | 0.902 | 0.751 | 0.647 | |||
| LENS5 | [-] | 1.91 | 1.94 | 1.74 | 2.78 | 0.281 | 1.71 | 1.08 | 0.692 | 0.341 | 0.862 | 0.903 | 0.751 | 0.648 | |||
| PRINCETON | [-] | 1.42 | 1.42 | 1.73 | 4.26 | -0.217 | 0.817 | 0.988 | 0.783 | 0.582 | 0.872 | 0.989 | 0.839 | 0.774 |
Download Data |
Period Mean (original grids) [mm d-1] |
Model Period Mean (intersection) [mm d-1] |
Model Period Mean (complement) [mm d-1] |
Benchmark Period Mean (intersection) [mm d-1] |
Benchmark Period Mean (complement) [mm d-1] |
Bias [mm d-1] |
RMSE [mm d-1] |
Phase Shift [months] |
Bias Score [1] |
RMSE Score [1] |
Seasonal Cycle Score [1] |
Spatial Distribution Score [1] |
Interannual Variability Score [1] |
Overall Score [1] |
|||
|---|---|---|---|---|---|---|---|---|---|---|---|---|---|---|---|---|---|
| Benchmark | [-] | 3.99 | |||||||||||||||
| CESM2_1_001 | [-] | 3.72 | 3.66 | 3.89 | 5.24 | 0.0173 | 3.91 | 0.868 | 0.776 | 0.384 | 0.902 | 0.925 | 0.638 | 0.668 | |||
| CESM2_1_002 | [-] | 3.77 | 3.72 | 3.89 | 5.24 | 0.0632 | 3.90 | 0.942 | 0.786 | 0.383 | 0.903 | 0.932 | 0.649 | 0.673 | |||
| CESM2_1_003 | [-] | 3.75 | 3.70 | 3.89 | 5.24 | 0.0442 | 3.94 | 0.918 | 0.777 | 0.381 | 0.912 | 0.930 | 0.646 | 0.671 | |||
| CRUJRA | [-] | 3.54 | 3.52 | 3.89 | 5.24 | -0.104 | 2.59 | 0.706 | 0.831 | 0.531 | 0.921 | 0.977 | 0.721 | 0.752 | |||
| GSWP3 | [-] | 3.73 | 3.71 | 3.89 | 5.24 | 0.0311 | 2.39 | 0.665 | 0.789 | 0.580 | 0.916 | 0.919 | 0.738 | 0.754 | |||
| LENS1 | [-] | 3.78 | 3.69 | 3.87 | 5.20 | 0.0775 | 3.88 | 0.894 | 0.719 | 0.422 | 0.915 | 0.854 | 0.776 | 0.685 | |||
| LENS10 | [-] | 3.74 | 3.65 | 3.87 | 5.20 | 0.0459 | 3.85 | 0.917 | 0.725 | 0.423 | 0.919 | 0.840 | 0.776 | 0.684 | |||
| LENS5 | [-] | 3.78 | 3.69 | 3.87 | 5.20 | 0.0914 | 3.78 | 0.937 | 0.728 | 0.429 | 0.912 | 0.841 | 0.789 | 0.688 | |||
| PRINCETON | [-] | 3.44 | 3.43 | 3.89 | 5.24 | -0.223 | 2.27 | 0.703 | 0.822 | 0.575 | 0.929 | 0.976 | 0.784 | 0.777 |
Download Data |
Period Mean (original grids) [mm d-1] |
Model Period Mean (intersection) [mm d-1] |
Model Period Mean (complement) [mm d-1] |
Benchmark Period Mean (intersection) [mm d-1] |
Benchmark Period Mean (complement) [mm d-1] |
Bias [mm d-1] |
RMSE [mm d-1] |
Phase Shift [months] |
Bias Score [1] |
RMSE Score [1] |
Seasonal Cycle Score [1] |
Spatial Distribution Score [1] |
Interannual Variability Score [1] |
Overall Score [1] |
|||
|---|---|---|---|---|---|---|---|---|---|---|---|---|---|---|---|---|---|
| Benchmark | [-] | 1.56 | |||||||||||||||
| CESM2_1_001 | [-] | 1.34 | 1.34 | 1.57 | 1.29 | -0.228 | 0.954 | 1.10 | 0.626 | 0.298 | 0.853 | 0.693 | 0.829 | 0.599 | |||
| CESM2_1_002 | [-] | 1.35 | 1.35 | 1.57 | 1.29 | -0.222 | 0.948 | 1.11 | 0.633 | 0.299 | 0.859 | 0.711 | 0.840 | 0.607 | |||
| CESM2_1_003 | [-] | 1.35 | 1.35 | 1.57 | 1.29 | -0.219 | 0.951 | 1.04 | 0.634 | 0.297 | 0.845 | 0.715 | 0.837 | 0.604 | |||
| CRUJRA | [-] | 1.08 | 1.09 | 1.57 | 1.29 | -0.491 | 0.684 | 1.18 | 0.507 | 0.527 | 0.835 | 0.789 | 0.804 | 0.665 | |||
| GSWP3 | [-] | 1.29 | 1.30 | 1.57 | 1.29 | -0.282 | 0.531 | 0.823 | 0.668 | 0.568 | 0.886 | 0.975 | 0.881 | 0.758 | |||
| LENS1 | [-] | 1.09 | 1.10 | 1.55 | 1.24 | -0.450 | 0.991 | 0.862 | 0.518 | 0.296 | 0.909 | 0.611 | 0.855 | 0.581 | |||
| LENS10 | [-] | 1.05 | 1.06 | 1.55 | 1.24 | -0.484 | 0.999 | 0.849 | 0.494 | 0.301 | 0.906 | 0.594 | 0.844 | 0.573 | |||
| LENS5 | [-] | 1.06 | 1.06 | 1.55 | 1.24 | -0.478 | 1.00 | 1.25 | 0.498 | 0.297 | 0.828 | 0.615 | 0.851 | 0.564 | |||
| PRINCETON | [-] | 1.06 | 1.07 | 1.57 | 1.29 | -0.512 | 0.697 | 1.19 | 0.492 | 0.530 | 0.833 | 0.793 | 0.792 | 0.662 |
Download Data |
Period Mean (original grids) [mm d-1] |
Model Period Mean (intersection) [mm d-1] |
Model Period Mean (complement) [mm d-1] |
Benchmark Period Mean (intersection) [mm d-1] |
Benchmark Period Mean (complement) [mm d-1] |
Bias [mm d-1] |
RMSE [mm d-1] |
Phase Shift [months] |
Bias Score [1] |
RMSE Score [1] |
Seasonal Cycle Score [1] |
Spatial Distribution Score [1] |
Interannual Variability Score [1] |
Overall Score [1] |
|||
|---|---|---|---|---|---|---|---|---|---|---|---|---|---|---|---|---|---|
| Benchmark | [-] | 1.74 | |||||||||||||||
| CESM2_1_001 | [-] | 1.61 | 1.60 | 1.65 | 2.87 | 0.0520 | 2.21 | 0.851 | 0.796 | 0.301 | 0.891 | 0.966 | 0.799 | 0.676 | |||
| CESM2_1_002 | [-] | 1.76 | 1.76 | 1.65 | 2.87 | 0.204 | 2.26 | 0.995 | 0.782 | 0.295 | 0.878 | 0.976 | 0.799 | 0.671 | |||
| CESM2_1_003 | [-] | 1.71 | 1.70 | 1.65 | 2.87 | 0.149 | 2.29 | 0.953 | 0.777 | 0.291 | 0.876 | 0.973 | 0.781 | 0.665 | |||
| CRUJRA | [-] | 1.48 | 1.47 | 1.65 | 2.87 | -0.0164 | 0.958 | 0.719 | 0.835 | 0.592 | 0.910 | 0.953 | 0.871 | 0.792 | |||
| GSWP3 | [-] | 1.48 | 1.48 | 1.65 | 2.87 | -0.0209 | 0.886 | 0.623 | 0.828 | 0.623 | 0.919 | 0.963 | 0.849 | 0.801 | |||
| LENS1 | [-] | 2.15 | 2.15 | 1.62 | 2.85 | 0.628 | 2.31 | 1.04 | 0.676 | 0.302 | 0.847 | 0.971 | 0.820 | 0.653 | |||
| LENS10 | [-] | 2.07 | 2.07 | 1.62 | 2.85 | 0.547 | 2.22 | 1.08 | 0.697 | 0.315 | 0.840 | 0.970 | 0.831 | 0.661 | |||
| LENS5 | [-] | 2.16 | 2.16 | 1.62 | 2.85 | 0.637 | 2.31 | 1.19 | 0.684 | 0.303 | 0.822 | 0.972 | 0.818 | 0.651 | |||
| PRINCETON | [-] | 1.40 | 1.40 | 1.65 | 2.87 | -0.109 | 0.996 | 0.719 | 0.824 | 0.582 | 0.918 | 0.965 | 0.866 | 0.790 |
Download Data |
Period Mean (original grids) [mm d-1] |
Model Period Mean (intersection) [mm d-1] |
Model Period Mean (complement) [mm d-1] |
Benchmark Period Mean (intersection) [mm d-1] |
Benchmark Period Mean (complement) [mm d-1] |
Bias [mm d-1] |
RMSE [mm d-1] |
Phase Shift [months] |
Bias Score [1] |
RMSE Score [1] |
Seasonal Cycle Score [1] |
Spatial Distribution Score [1] |
Interannual Variability Score [1] |
Overall Score [1] |
|||
|---|---|---|---|---|---|---|---|---|---|---|---|---|---|---|---|---|---|
| Benchmark | [-] | 2.58 | |||||||||||||||
| CESM2_1_001 | [-] | 2.12 | 2.13 | 2.55 | 2.82 | -0.429 | 1.79 | 1.71 | 0.685 | 0.300 | 0.770 | 0.984 | 0.837 | 0.646 | |||
| CESM2_1_002 | [-] | 2.10 | 2.11 | 2.55 | 2.82 | -0.448 | 1.82 | 1.66 | 0.678 | 0.293 | 0.778 | 0.983 | 0.840 | 0.644 | |||
| CESM2_1_003 | [-] | 2.14 | 2.15 | 2.55 | 2.82 | -0.413 | 1.79 | 1.43 | 0.688 | 0.300 | 0.806 | 0.982 | 0.839 | 0.652 | |||
| CRUJRA | [-] | 2.15 | 2.16 | 2.55 | 2.82 | -0.352 | 0.954 | 1.12 | 0.699 | 0.579 | 0.818 | 0.979 | 0.846 | 0.750 | |||
| GSWP3 | [-] | 2.33 | 2.34 | 2.55 | 2.82 | -0.219 | 0.865 | 0.894 | 0.744 | 0.606 | 0.861 | 0.973 | 0.863 | 0.776 | |||
| LENS1 | [-] | 2.17 | 2.17 | 2.54 | 2.84 | -0.370 | 1.77 | 1.54 | 0.710 | 0.303 | 0.785 | 0.987 | 0.838 | 0.654 | |||
| LENS10 | [-] | 2.14 | 2.15 | 2.54 | 2.84 | -0.393 | 1.80 | 1.58 | 0.703 | 0.299 | 0.774 | 0.987 | 0.842 | 0.651 | |||
| LENS5 | [-] | 2.17 | 2.18 | 2.54 | 2.84 | -0.367 | 1.80 | 1.42 | 0.714 | 0.296 | 0.804 | 0.987 | 0.832 | 0.655 | |||
| PRINCETON | [-] | 2.14 | 2.15 | 2.55 | 2.82 | -0.381 | 0.972 | 1.11 | 0.692 | 0.574 | 0.818 | 0.982 | 0.839 | 0.746 |
Download Data |
Period Mean (original grids) [mm d-1] |
Model Period Mean (intersection) [mm d-1] |
Model Period Mean (complement) [mm d-1] |
Benchmark Period Mean (intersection) [mm d-1] |
Benchmark Period Mean (complement) [mm d-1] |
Bias [mm d-1] |
RMSE [mm d-1] |
Phase Shift [months] |
Bias Score [1] |
RMSE Score [1] |
Seasonal Cycle Score [1] |
Spatial Distribution Score [1] |
Interannual Variability Score [1] |
Overall Score [1] |
|||
|---|---|---|---|---|---|---|---|---|---|---|---|---|---|---|---|---|---|
| Benchmark | [-] | 2.68 | |||||||||||||||
| CESM2_1_001 | [-] | 2.23 | 2.23 | 2.25 | 2.89 | 0.0902 | 1.94 | 1.39 | 0.700 | 0.328 | 0.847 | 0.959 | 0.701 | 0.644 | |||
| CESM2_1_002 | [-] | 2.26 | 2.26 | 2.25 | 2.89 | 0.119 | 1.96 | 1.39 | 0.700 | 0.324 | 0.847 | 0.957 | 0.700 | 0.642 | |||
| CESM2_1_003 | [-] | 2.25 | 2.25 | 2.25 | 2.89 | 0.108 | 1.96 | 1.37 | 0.695 | 0.324 | 0.851 | 0.957 | 0.703 | 0.642 | |||
| CRUJRA | [-] | 2.32 | 2.32 | 2.25 | 2.89 | 0.168 | 1.37 | 1.09 | 0.761 | 0.532 | 0.875 | 0.818 | 0.772 | 0.715 | |||
| GSWP3 | [-] | 2.09 | 2.09 | 2.25 | 2.89 | -0.0552 | 1.04 | 0.924 | 0.773 | 0.567 | 0.889 | 0.975 | 0.772 | 0.757 | |||
| LENS1 | [-] | 2.21 | 2.21 | 2.25 | 2.90 | 0.0833 | 1.92 | 1.45 | 0.673 | 0.353 | 0.819 | 0.948 | 0.758 | 0.651 | |||
| LENS10 | [-] | 2.19 | 2.19 | 2.25 | 2.90 | 0.0617 | 1.91 | 1.42 | 0.673 | 0.355 | 0.817 | 0.948 | 0.766 | 0.652 | |||
| LENS5 | [-] | 2.21 | 2.21 | 2.25 | 2.90 | 0.0898 | 1.91 | 1.44 | 0.670 | 0.356 | 0.811 | 0.946 | 0.766 | 0.651 | |||
| PRINCETON | [-] | 1.99 | 1.99 | 2.25 | 2.89 | -0.158 | 1.10 | 1.05 | 0.763 | 0.541 | 0.879 | 0.978 | 0.797 | 0.750 |
Download Data |
Period Mean (original grids) [mm d-1] |
Model Period Mean (intersection) [mm d-1] |
Model Period Mean (complement) [mm d-1] |
Benchmark Period Mean (intersection) [mm d-1] |
Benchmark Period Mean (complement) [mm d-1] |
Bias [mm d-1] |
RMSE [mm d-1] |
Phase Shift [months] |
Bias Score [1] |
RMSE Score [1] |
Seasonal Cycle Score [1] |
Spatial Distribution Score [1] |
Interannual Variability Score [1] |
Overall Score [1] |
|||
|---|---|---|---|---|---|---|---|---|---|---|---|---|---|---|---|---|---|
| Benchmark | [-] | 0.447 | |||||||||||||||
| CESM2_1_001 | [-] | 0.368 | 0.371 | 0.434 | 0.778 | -0.0475 | 0.659 | 2.65 | 0.751 | 0.303 | 0.670 | 0.949 | 0.764 | 0.623 | |||
| CESM2_1_002 | [-] | 0.373 | 0.376 | 0.434 | 0.778 | -0.0418 | 0.674 | 2.52 | 0.743 | 0.299 | 0.697 | 0.944 | 0.766 | 0.625 | |||
| CESM2_1_003 | [-] | 0.359 | 0.362 | 0.434 | 0.778 | -0.0565 | 0.664 | 2.45 | 0.742 | 0.302 | 0.712 | 0.936 | 0.777 | 0.628 | |||
| CRUJRA | [-] | 0.381 | 0.382 | 0.434 | 0.778 | -0.0302 | 0.413 | 1.40 | 0.777 | 0.509 | 0.836 | 0.964 | 0.776 | 0.728 | |||
| GSWP3 | [-] | 0.350 | 0.352 | 0.434 | 0.778 | -0.0580 | 0.398 | 0.987 | 0.745 | 0.523 | 0.854 | 0.963 | 0.760 | 0.728 | |||
| LENS1 | [-] | 0.532 | 0.534 | 0.436 | 0.806 | 0.121 | 0.882 | 2.47 | 0.690 | 0.271 | 0.631 | 0.916 | 0.699 | 0.579 | |||
| LENS10 | [-] | 0.501 | 0.504 | 0.436 | 0.806 | 0.0909 | 0.854 | 2.30 | 0.697 | 0.280 | 0.677 | 0.919 | 0.714 | 0.594 | |||
| LENS5 | [-] | 0.490 | 0.492 | 0.436 | 0.806 | 0.0776 | 0.820 | 2.22 | 0.697 | 0.283 | 0.686 | 0.920 | 0.729 | 0.600 | |||
| PRINCETON | [-] | 0.329 | 0.330 | 0.434 | 0.778 | -0.0818 | 0.405 | 1.23 | 0.754 | 0.507 | 0.839 | 0.966 | 0.762 | 0.723 |
Download Data |
Period Mean (original grids) [mm d-1] |
Model Period Mean (intersection) [mm d-1] |
Model Period Mean (complement) [mm d-1] |
Benchmark Period Mean (intersection) [mm d-1] |
Benchmark Period Mean (complement) [mm d-1] |
Bias [mm d-1] |
RMSE [mm d-1] |
Phase Shift [months] |
Bias Score [1] |
RMSE Score [1] |
Seasonal Cycle Score [1] |
Spatial Distribution Score [1] |
Interannual Variability Score [1] |
Overall Score [1] |
|||
|---|---|---|---|---|---|---|---|---|---|---|---|---|---|---|---|---|---|
| Benchmark | [-] | 1.25 | |||||||||||||||
| CESM2_1_001 | [-] | 1.56 | 1.56 | 1.23 | 1.66 | 0.334 | 0.992 | 0.528 | 0.634 | 0.306 | 0.922 | 0.934 | 0.752 | 0.642 | |||
| CESM2_1_002 | [-] | 1.58 | 1.58 | 1.23 | 1.66 | 0.349 | 1.01 | 0.610 | 0.623 | 0.304 | 0.936 | 0.938 | 0.753 | 0.643 | |||
| CESM2_1_003 | [-] | 1.57 | 1.57 | 1.23 | 1.66 | 0.341 | 1.00 | 0.580 | 0.628 | 0.303 | 0.927 | 0.941 | 0.747 | 0.642 | |||
| CRUJRA | [-] | 1.04 | 1.03 | 1.23 | 1.66 | -0.189 | 0.578 | 0.394 | 0.737 | 0.510 | 0.934 | 0.943 | 0.820 | 0.742 | |||
| GSWP3 | [-] | 1.21 | 1.20 | 1.23 | 1.66 | 0.00700 | 0.606 | 0.400 | 0.719 | 0.508 | 0.933 | 0.923 | 0.719 | 0.718 | |||
| LENS1 | [-] | 1.35 | 1.35 | 1.24 | 1.70 | 0.124 | 0.920 | 0.699 | 0.717 | 0.312 | 0.916 | 0.966 | 0.748 | 0.662 | |||
| LENS10 | [-] | 1.34 | 1.33 | 1.24 | 1.70 | 0.105 | 0.917 | 0.691 | 0.724 | 0.312 | 0.917 | 0.962 | 0.758 | 0.664 | |||
| LENS5 | [-] | 1.35 | 1.35 | 1.24 | 1.70 | 0.120 | 0.921 | 0.609 | 0.712 | 0.312 | 0.925 | 0.959 | 0.760 | 0.663 | |||
| PRINCETON | [-] | 0.981 | 0.971 | 1.23 | 1.66 | -0.249 | 0.603 | 0.382 | 0.698 | 0.511 | 0.938 | 0.947 | 0.781 | 0.731 |
Download Data |
Period Mean (original grids) [mm d-1] |
Model Period Mean (intersection) [mm d-1] |
Model Period Mean (complement) [mm d-1] |
Benchmark Period Mean (intersection) [mm d-1] |
Benchmark Period Mean (complement) [mm d-1] |
Bias [mm d-1] |
RMSE [mm d-1] |
Phase Shift [months] |
Bias Score [1] |
RMSE Score [1] |
Seasonal Cycle Score [1] |
Spatial Distribution Score [1] |
Interannual Variability Score [1] |
Overall Score [1] |
|||
|---|---|---|---|---|---|---|---|---|---|---|---|---|---|---|---|---|---|
| Benchmark | [-] | 3.23 | |||||||||||||||
| CESM2_1_001 | [-] | 3.02 | 3.01 | 3.18 | 3.49 | -0.0573 | 3.00 | 1.32 | 0.691 | 0.356 | 0.836 | 0.967 | 0.677 | 0.647 | |||
| CESM2_1_002 | [-] | 3.08 | 3.07 | 3.18 | 3.49 | 0.0288 | 3.09 | 1.30 | 0.709 | 0.337 | 0.845 | 0.969 | 0.594 | 0.632 | |||
| CESM2_1_003 | [-] | 3.04 | 3.03 | 3.18 | 3.49 | -0.0268 | 3.09 | 1.39 | 0.697 | 0.341 | 0.830 | 0.966 | 0.638 | 0.636 | |||
| CRUJRA | [-] | 3.04 | 3.05 | 3.18 | 3.49 | 0.145 | 1.99 | 0.900 | 0.771 | 0.499 | 0.846 | 0.951 | 0.642 | 0.701 | |||
| GSWP3 | [-] | 3.00 | 3.02 | 3.18 | 3.49 | 0.0801 | 1.71 | 0.866 | 0.767 | 0.569 | 0.867 | 0.955 | 0.747 | 0.745 | |||
| LENS1 | [-] | 3.24 | 3.24 | 3.20 | 3.51 | 0.159 | 2.84 | 1.51 | 0.707 | 0.381 | 0.835 | 0.951 | 0.762 | 0.669 | |||
| LENS10 | [-] | 3.13 | 3.13 | 3.20 | 3.51 | 0.0385 | 2.80 | 1.52 | 0.691 | 0.388 | 0.823 | 0.941 | 0.771 | 0.667 | |||
| LENS5 | [-] | 3.23 | 3.23 | 3.20 | 3.51 | 0.147 | 2.78 | 1.50 | 0.702 | 0.392 | 0.830 | 0.955 | 0.761 | 0.672 | |||
| PRINCETON | [-] | 3.00 | 3.01 | 3.18 | 3.49 | 0.0753 | 1.92 | 0.897 | 0.771 | 0.512 | 0.854 | 0.947 | 0.681 | 0.713 |
Download Data |
Period Mean (original grids) [mm d-1] |
Model Period Mean (intersection) [mm d-1] |
Model Period Mean (complement) [mm d-1] |
Benchmark Period Mean (intersection) [mm d-1] |
Benchmark Period Mean (complement) [mm d-1] |
Bias [mm d-1] |
RMSE [mm d-1] |
Phase Shift [months] |
Bias Score [1] |
RMSE Score [1] |
Seasonal Cycle Score [1] |
Spatial Distribution Score [1] |
Interannual Variability Score [1] |
Overall Score [1] |
|||
|---|---|---|---|---|---|---|---|---|---|---|---|---|---|---|---|---|---|
| Benchmark | [-] | 3.28 | |||||||||||||||
| CESM2_1_001 | [-] | 2.74 | 2.77 | 3.26 | 3.77 | -0.428 | 2.30 | 1.89 | 0.740 | 0.273 | 0.694 | 0.916 | 0.869 | 0.628 | |||
| CESM2_1_002 | [-] | 2.72 | 2.74 | 3.26 | 3.77 | -0.451 | 2.33 | 1.55 | 0.739 | 0.268 | 0.747 | 0.923 | 0.876 | 0.637 | |||
| CESM2_1_003 | [-] | 2.71 | 2.73 | 3.26 | 3.77 | -0.470 | 2.25 | 1.82 | 0.737 | 0.282 | 0.710 | 0.943 | 0.857 | 0.635 | |||
| CRUJRA | [-] | 2.87 | 2.89 | 3.26 | 3.77 | -0.316 | 0.992 | 1.07 | 0.815 | 0.589 | 0.824 | 0.996 | 0.932 | 0.791 | |||
| GSWP3 | [-] | 3.04 | 3.06 | 3.26 | 3.77 | -0.147 | 0.922 | 0.890 | 0.870 | 0.601 | 0.856 | 0.997 | 0.903 | 0.805 | |||
| LENS1 | [-] | 2.67 | 2.68 | 3.29 | 3.86 | -0.548 | 2.23 | 1.75 | 0.713 | 0.288 | 0.702 | 0.960 | 0.839 | 0.632 | |||
| LENS10 | [-] | 2.62 | 2.63 | 3.29 | 3.86 | -0.604 | 2.23 | 1.83 | 0.698 | 0.292 | 0.696 | 0.955 | 0.832 | 0.628 | |||
| LENS5 | [-] | 2.63 | 2.64 | 3.29 | 3.86 | -0.592 | 2.16 | 1.62 | 0.702 | 0.305 | 0.736 | 0.951 | 0.812 | 0.635 | |||
| PRINCETON | [-] | 2.85 | 2.87 | 3.26 | 3.77 | -0.353 | 1.02 | 1.02 | 0.803 | 0.582 | 0.833 | 0.997 | 0.929 | 0.788 |
Download Data |
Period Mean (original grids) [mm d-1] |
Model Period Mean (intersection) [mm d-1] |
Model Period Mean (complement) [mm d-1] |
Benchmark Period Mean (intersection) [mm d-1] |
Benchmark Period Mean (complement) [mm d-1] |
Bias [mm d-1] |
RMSE [mm d-1] |
Phase Shift [months] |
Bias Score [1] |
RMSE Score [1] |
Seasonal Cycle Score [1] |
Spatial Distribution Score [1] |
Interannual Variability Score [1] |
Overall Score [1] |
|||
|---|---|---|---|---|---|---|---|---|---|---|---|---|---|---|---|---|---|
| Benchmark | [-] | 2.43 | |||||||||||||||
| CESM2_1_001 | [-] | 2.22 | 2.22 | 2.35 | 4.76 | -0.00544 | 1.47 | 0.893 | 0.766 | 0.313 | 0.878 | 0.988 | 0.837 | 0.682 | |||
| CESM2_1_002 | [-] | 2.21 | 2.20 | 2.35 | 4.76 | -0.0183 | 1.49 | 1.01 | 0.766 | 0.308 | 0.866 | 0.988 | 0.851 | 0.681 | |||
| CESM2_1_003 | [-] | 2.22 | 2.22 | 2.35 | 4.76 | -0.00336 | 1.45 | 0.979 | 0.762 | 0.319 | 0.872 | 0.988 | 0.845 | 0.684 | |||
| CRUJRA | [-] | 2.07 | 2.08 | 2.35 | 4.76 | -0.145 | 0.844 | 0.695 | 0.778 | 0.548 | 0.896 | 0.966 | 0.860 | 0.766 | |||
| GSWP3 | [-] | 2.15 | 2.16 | 2.35 | 4.76 | -0.0441 | 0.753 | 0.624 | 0.785 | 0.598 | 0.908 | 0.976 | 0.820 | 0.781 | |||
| LENS1 | [-] | 2.15 | 2.15 | 2.36 | 4.83 | -0.0948 | 1.48 | 1.20 | 0.760 | 0.312 | 0.837 | 0.979 | 0.838 | 0.673 | |||
| LENS10 | [-] | 2.16 | 2.16 | 2.36 | 4.83 | -0.0904 | 1.50 | 1.16 | 0.757 | 0.310 | 0.824 | 0.979 | 0.835 | 0.669 | |||
| LENS5 | [-] | 2.17 | 2.17 | 2.36 | 4.83 | -0.0804 | 1.50 | 1.11 | 0.754 | 0.309 | 0.840 | 0.982 | 0.830 | 0.671 | |||
| PRINCETON | [-] | 2.05 | 2.06 | 2.35 | 4.76 | -0.171 | 0.870 | 0.690 | 0.771 | 0.537 | 0.897 | 0.964 | 0.856 | 0.760 |
Download Data |
Period Mean (original grids) [mm d-1] |
Model Period Mean (intersection) [mm d-1] |
Model Period Mean (complement) [mm d-1] |
Benchmark Period Mean (intersection) [mm d-1] |
Benchmark Period Mean (complement) [mm d-1] |
Bias [mm d-1] |
RMSE [mm d-1] |
Phase Shift [months] |
Bias Score [1] |
RMSE Score [1] |
Seasonal Cycle Score [1] |
Spatial Distribution Score [1] |
Interannual Variability Score [1] |
Overall Score [1] |
|||
|---|---|---|---|---|---|---|---|---|---|---|---|---|---|---|---|---|---|
| Benchmark | [-] | 1.44 | |||||||||||||||
| CESM2_1_001 | [-] | 1.44 | 1.44 | 1.41 | 2.83 | 0.0549 | 1.45 | 1.40 | 0.753 | 0.303 | 0.844 | 0.918 | 0.801 | 0.653 | |||
| CESM2_1_002 | [-] | 1.48 | 1.48 | 1.41 | 2.83 | 0.0912 | 1.49 | 1.24 | 0.745 | 0.295 | 0.866 | 0.908 | 0.804 | 0.652 | |||
| CESM2_1_003 | [-] | 1.45 | 1.45 | 1.41 | 2.83 | 0.0640 | 1.43 | 1.55 | 0.747 | 0.307 | 0.827 | 0.906 | 0.807 | 0.650 | |||
| CRUJRA | [-] | 1.24 | 1.25 | 1.41 | 2.83 | -0.119 | 0.684 | 0.727 | 0.783 | 0.599 | 0.914 | 0.980 | 0.849 | 0.787 | |||
| GSWP3 | [-] | 1.29 | 1.30 | 1.41 | 2.83 | -0.0739 | 0.672 | 0.749 | 0.787 | 0.610 | 0.911 | 0.956 | 0.826 | 0.784 | |||
| LENS1 | [-] | 1.90 | 1.90 | 1.44 | 2.88 | 0.487 | 1.72 | 1.42 | 0.625 | 0.277 | 0.837 | 0.926 | 0.779 | 0.620 | |||
| LENS10 | [-] | 1.87 | 1.87 | 1.44 | 2.88 | 0.459 | 1.67 | 1.31 | 0.632 | 0.282 | 0.848 | 0.943 | 0.796 | 0.630 | |||
| LENS5 | [-] | 1.88 | 1.88 | 1.44 | 2.88 | 0.464 | 1.69 | 1.43 | 0.625 | 0.279 | 0.836 | 0.923 | 0.775 | 0.620 | |||
| PRINCETON | [-] | 1.21 | 1.21 | 1.41 | 2.83 | -0.163 | 0.704 | 0.688 | 0.771 | 0.593 | 0.921 | 0.979 | 0.846 | 0.784 |
Download Data |
Period Mean (original grids) [mm d-1] |
Model Period Mean (intersection) [mm d-1] |
Model Period Mean (complement) [mm d-1] |
Benchmark Period Mean (intersection) [mm d-1] |
Benchmark Period Mean (complement) [mm d-1] |
Bias [mm d-1] |
RMSE [mm d-1] |
Phase Shift [months] |
Bias Score [1] |
RMSE Score [1] |
Seasonal Cycle Score [1] |
Spatial Distribution Score [1] |
Interannual Variability Score [1] |
Overall Score [1] |
|||
|---|---|---|---|---|---|---|---|---|---|---|---|---|---|---|---|---|---|
| Benchmark | [-] | 6.25 | |||||||||||||||
| CESM2_1_001 | [-] | 5.52 | 5.53 | 6.29 | 4.51 | -0.731 | 3.80 | 0.703 | 0.677 | 0.375 | 0.925 | 0.898 | 0.721 | 0.662 | |||
| CESM2_1_002 | [-] | 5.66 | 5.67 | 6.29 | 4.51 | -0.589 | 3.83 | 0.761 | 0.689 | 0.372 | 0.907 | 0.879 | 0.729 | 0.658 | |||
| CESM2_1_003 | [-] | 5.58 | 5.59 | 6.29 | 4.51 | -0.671 | 3.82 | 0.613 | 0.683 | 0.374 | 0.933 | 0.887 | 0.750 | 0.667 | |||
| CRUJRA | [-] | 6.12 | 6.12 | 6.29 | 4.51 | -0.120 | 2.53 | 0.693 | 0.784 | 0.512 | 0.919 | 0.974 | 0.682 | 0.731 | |||
| GSWP3 | [-] | 6.13 | 6.14 | 6.29 | 4.51 | -0.105 | 2.15 | 0.617 | 0.792 | 0.575 | 0.927 | 0.925 | 0.712 | 0.751 | |||
| LENS1 | [-] | 4.92 | 4.94 | 6.25 | 4.54 | -1.20 | 3.65 | 1.06 | 0.579 | 0.429 | 0.859 | 0.779 | 0.690 | 0.627 | |||
| LENS10 | [-] | 4.91 | 4.92 | 6.25 | 4.54 | -1.21 | 3.63 | 1.18 | 0.579 | 0.432 | 0.846 | 0.785 | 0.693 | 0.628 | |||
| LENS5 | [-] | 4.90 | 4.92 | 6.25 | 4.54 | -1.21 | 3.67 | 1.17 | 0.574 | 0.429 | 0.842 | 0.764 | 0.683 | 0.620 | |||
| PRINCETON | [-] | 6.10 | 6.10 | 6.29 | 4.51 | -0.160 | 2.45 | 0.659 | 0.784 | 0.521 | 0.924 | 0.977 | 0.700 | 0.738 |
Download Data |
Period Mean (original grids) [mm d-1] |
Model Period Mean (intersection) [mm d-1] |
Model Period Mean (complement) [mm d-1] |
Benchmark Period Mean (intersection) [mm d-1] |
Benchmark Period Mean (complement) [mm d-1] |
Bias [mm d-1] |
RMSE [mm d-1] |
Phase Shift [months] |
Bias Score [1] |
RMSE Score [1] |
Seasonal Cycle Score [1] |
Spatial Distribution Score [1] |
Interannual Variability Score [1] |
Overall Score [1] |
|||
|---|---|---|---|---|---|---|---|---|---|---|---|---|---|---|---|---|---|
| Benchmark | [-] | 3.49 | |||||||||||||||
| CESM2_1_001 | [-] | 3.17 | 3.18 | 3.49 | 3.32 | -0.322 | 3.27 | 1.47 | 0.723 | 0.338 | 0.805 | 0.953 | 0.752 | 0.652 | |||
| CESM2_1_002 | [-] | 3.10 | 3.11 | 3.49 | 3.32 | -0.390 | 3.08 | 1.28 | 0.723 | 0.360 | 0.816 | 0.961 | 0.812 | 0.672 | |||
| CESM2_1_003 | [-] | 3.08 | 3.09 | 3.49 | 3.32 | -0.413 | 3.17 | 1.19 | 0.715 | 0.351 | 0.831 | 0.966 | 0.819 | 0.672 | |||
| CRUJRA | [-] | 3.33 | 3.31 | 3.49 | 3.32 | -0.157 | 1.41 | 0.642 | 0.861 | 0.615 | 0.923 | 0.989 | 0.886 | 0.815 | |||
| GSWP3 | [-] | 3.35 | 3.34 | 3.49 | 3.32 | -0.136 | 1.28 | 0.610 | 0.870 | 0.646 | 0.922 | 0.995 | 0.849 | 0.821 | |||
| LENS1 | [-] | 3.17 | 3.20 | 3.52 | 3.35 | -0.301 | 2.86 | 1.65 | 0.676 | 0.404 | 0.769 | 0.952 | 0.737 | 0.657 | |||
| LENS10 | [-] | 3.18 | 3.21 | 3.52 | 3.35 | -0.290 | 2.90 | 1.67 | 0.674 | 0.399 | 0.763 | 0.945 | 0.742 | 0.654 | |||
| LENS5 | [-] | 3.19 | 3.22 | 3.52 | 3.35 | -0.276 | 2.91 | 1.55 | 0.673 | 0.400 | 0.777 | 0.948 | 0.739 | 0.656 | |||
| PRINCETON | [-] | 3.31 | 3.29 | 3.49 | 3.32 | -0.191 | 1.42 | 0.689 | 0.859 | 0.613 | 0.915 | 0.989 | 0.888 | 0.813 |
Download Data |
Period Mean (original grids) [mm d-1] |
Model Period Mean (intersection) [mm d-1] |
Model Period Mean (complement) [mm d-1] |
Benchmark Period Mean (intersection) [mm d-1] |
Benchmark Period Mean (complement) [mm d-1] |
Bias [mm d-1] |
RMSE [mm d-1] |
Phase Shift [months] |
Bias Score [1] |
RMSE Score [1] |
Seasonal Cycle Score [1] |
Spatial Distribution Score [1] |
Interannual Variability Score [1] |
Overall Score [1] |
|||
|---|---|---|---|---|---|---|---|---|---|---|---|---|---|---|---|---|---|
| Benchmark | [-] | 1.77 | |||||||||||||||
| CESM2_1_001 | [-] | 2.73 | 2.74 | 1.78 | 1.62 | 1.00 | 2.49 | 1.24 | 0.502 | 0.241 | 0.872 | 0.572 | 0.565 | 0.499 | |||
| CESM2_1_002 | [-] | 2.79 | 2.80 | 1.78 | 1.62 | 1.06 | 2.57 | 1.15 | 0.498 | 0.230 | 0.895 | 0.578 | 0.546 | 0.496 | |||
| CESM2_1_003 | [-] | 2.74 | 2.75 | 1.78 | 1.62 | 1.01 | 2.54 | 1.29 | 0.494 | 0.236 | 0.864 | 0.574 | 0.558 | 0.494 | |||
| CRUJRA | [-] | 1.18 | 1.18 | 1.78 | 1.62 | -0.532 | 1.31 | 0.904 | 0.540 | 0.464 | 0.917 | 0.937 | 0.698 | 0.670 | |||
| GSWP3 | [-] | 1.56 | 1.56 | 1.78 | 1.62 | -0.152 | 1.20 | 0.788 | 0.542 | 0.515 | 0.919 | 0.813 | 0.734 | 0.673 | |||
| LENS1 | [-] | 3.62 | 3.56 | 1.82 | 1.67 | 1.67 | 3.05 | 1.06 | 0.448 | 0.236 | 0.905 | 0.537 | 0.610 | 0.495 | |||
| LENS10 | [-] | 3.58 | 3.51 | 1.82 | 1.67 | 1.64 | 3.00 | 1.11 | 0.460 | 0.239 | 0.890 | 0.520 | 0.627 | 0.496 | |||
| LENS5 | [-] | 3.60 | 3.53 | 1.82 | 1.67 | 1.66 | 3.01 | 1.22 | 0.451 | 0.234 | 0.849 | 0.528 | 0.621 | 0.486 | |||
| PRINCETON | [-] | 1.12 | 1.12 | 1.78 | 1.62 | -0.596 | 1.33 | 0.918 | 0.533 | 0.461 | 0.923 | 0.934 | 0.689 | 0.667 |
Temporally integrated period mean