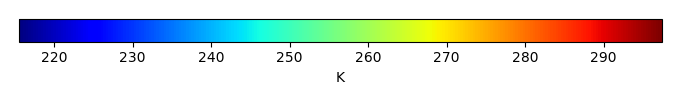
Mean State
Download Data |
Period Mean (original grids) [K] |
Model Period Mean (intersection) [K] |
Model Period Mean (complement) [K] |
Benchmark Period Mean (intersection) [K] |
Benchmark Period Mean (complement) [K] |
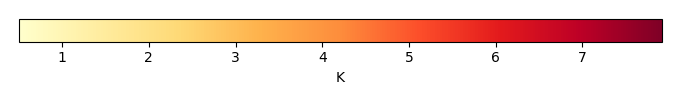
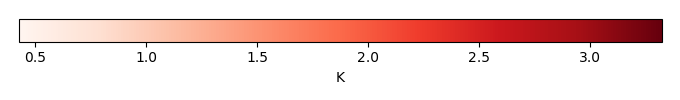
Bias [K] |
RMSE [K] |
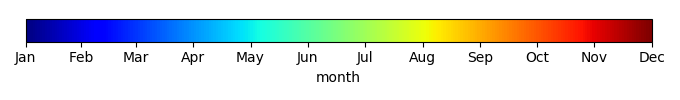
Phase Shift [months] |
Bias Score [1] |
RMSE Score [1] |
Seasonal Cycle Score [1] |
Spatial Distribution Score [1] |
Interannual Variability Score [1] |
Overall Score [1] |
|||
|---|---|---|---|---|---|---|---|---|---|---|---|---|---|---|---|---|---|
| Benchmark | [-] | 293. | |||||||||||||||
| CLM4 | [-] | 293. | 293. | 296. | 293. | 296. | 0.0254 | 1.31 | 0.832 | 0.523 | 0.416 | 0.903 | 1.00 | 0.709 | 0.661 | ||
| CLM4.5 | [-] | 293. | 293. | 296. | 293. | 296. | 0.348 | 1.31 | 0.802 | 0.536 | 0.436 | 0.903 | 0.995 | 0.725 | 0.672 | ||
| CLM5 | [-] | 294. | 293. | 297. | 293. | 296. | 0.843 | 1.30 | 0.638 | 0.446 | 0.486 | 0.928 | 0.997 | 0.773 | 0.686 |
Download Data |
Period Mean (original grids) [K] |
Model Period Mean (intersection) [K] |
Model Period Mean (complement) [K] |
Benchmark Period Mean (intersection) [K] |
Benchmark Period Mean (complement) [K] |
Bias [K] |
RMSE [K] |
Phase Shift [months] |
Bias Score [1] |
RMSE Score [1] |
Seasonal Cycle Score [1] |
Spatial Distribution Score [1] |
Interannual Variability Score [1] |
Overall Score [1] |
|||
|---|---|---|---|---|---|---|---|---|---|---|---|---|---|---|---|---|---|
| Benchmark | [-] | 293. | |||||||||||||||
| CLM4 | [-] | 293. | 293. | 296. | 293. | 294. | 0.463 | 1.42 | 0.264 | 0.745 | 0.666 | 0.979 | 0.988 | 0.870 | 0.819 | ||
| CLM4.5 | [-] | 294. | 294. | 296. | 293. | 294. | 0.842 | 1.53 | 0.201 | 0.652 | 0.708 | 0.983 | 0.985 | 0.867 | 0.818 | ||
| CLM5 | [-] | 294. | 294. | 296. | 293. | 294. | 1.17 | 1.50 | 0.181 | 0.620 | 0.750 | 0.985 | 0.987 | 0.860 | 0.825 |
Download Data |
Period Mean (original grids) [K] |
Model Period Mean (intersection) [K] |
Model Period Mean (complement) [K] |
Benchmark Period Mean (intersection) [K] |
Benchmark Period Mean (complement) [K] |
Bias [K] |
RMSE [K] |
Phase Shift [months] |
Bias Score [1] |
RMSE Score [1] |
Seasonal Cycle Score [1] |
Spatial Distribution Score [1] |
Interannual Variability Score [1] |
Overall Score [1] |
|||
|---|---|---|---|---|---|---|---|---|---|---|---|---|---|---|---|---|---|
| Benchmark | [-] | 288. | |||||||||||||||
| CLM4 | [-] | 289. | 289. | 293. | 288. | 293. | 0.450 | 1.26 | 0.690 | 0.729 | 0.738 | 0.913 | 1.00 | 0.845 | 0.827 | ||
| CLM4.5 | [-] | 289. | 289. | 293. | 288. | 293. | 0.786 | 1.32 | 0.727 | 0.685 | 0.764 | 0.906 | 1.00 | 0.844 | 0.827 | ||
| CLM5 | [-] | 289. | 289. | 293. | 288. | 293. | 1.00 | 1.36 | 0.598 | 0.662 | 0.786 | 0.927 | 1.00 | 0.839 | 0.834 |
Download Data |
Period Mean (original grids) [K] |
Model Period Mean (intersection) [K] |
Model Period Mean (complement) [K] |
Benchmark Period Mean (intersection) [K] |
Benchmark Period Mean (complement) [K] |
Bias [K] |
RMSE [K] |
Phase Shift [months] |
Bias Score [1] |
RMSE Score [1] |
Seasonal Cycle Score [1] |
Spatial Distribution Score [1] |
Interannual Variability Score [1] |
Overall Score [1] |
|||
|---|---|---|---|---|---|---|---|---|---|---|---|---|---|---|---|---|---|
| Benchmark | [-] | 256. | |||||||||||||||
| CLM4 | [-] | 255. | 255. | 263. | 256. | 261. | -0.475 | 1.97 | 0.0379 | 0.920 | 0.909 | 0.997 | 1.00 | 0.908 | 0.941 | ||
| CLM4.5 | [-] | 256. | 255. | 262. | 256. | 261. | -0.319 | 1.92 | 0.0372 | 0.926 | 0.909 | 0.997 | 1.00 | 0.910 | 0.942 | ||
| CLM5 | [-] | 256. | 256. | 264. | 256. | 261. | 0.395 | 1.75 | 0.0380 | 0.932 | 0.918 | 0.997 | 0.999 | 0.908 | 0.945 |
Download Data |
Period Mean (original grids) [K] |
Model Period Mean (intersection) [K] |
Model Period Mean (complement) [K] |
Benchmark Period Mean (intersection) [K] |
Benchmark Period Mean (complement) [K] |
Bias [K] |
RMSE [K] |
Phase Shift [months] |
Bias Score [1] |
RMSE Score [1] |
Seasonal Cycle Score [1] |
Spatial Distribution Score [1] |
Interannual Variability Score [1] |
Overall Score [1] |
|||
|---|---|---|---|---|---|---|---|---|---|---|---|---|---|---|---|---|---|
| Benchmark | [-] | 294. | |||||||||||||||
| CLM4 | [-] | 294. | 294. | 296. | 294. | 295. | 0.343 | 1.49 | 1.54 | 0.356 | 0.431 | 0.769 | 0.931 | 0.849 | 0.628 | ||
| CLM4.5 | [-] | 294. | 294. | 296. | 294. | 295. | 0.526 | 1.45 | 1.53 | 0.382 | 0.439 | 0.771 | 0.926 | 0.853 | 0.635 | ||
| CLM5 | [-] | 295. | 295. | 297. | 294. | 295. | 1.21 | 1.66 | 1.28 | 0.281 | 0.505 | 0.809 | 0.960 | 0.814 | 0.646 |
Download Data |
Period Mean (original grids) [K] |
Model Period Mean (intersection) [K] |
Model Period Mean (complement) [K] |
Benchmark Period Mean (intersection) [K] |
Benchmark Period Mean (complement) [K] |
Bias [K] |
RMSE [K] |
Phase Shift [months] |
Bias Score [1] |
RMSE Score [1] |
Seasonal Cycle Score [1] |
Spatial Distribution Score [1] |
Interannual Variability Score [1] |
Overall Score [1] |
|||
|---|---|---|---|---|---|---|---|---|---|---|---|---|---|---|---|---|---|
| Benchmark | [-] | 265. | |||||||||||||||
| CLM4 | [-] | 264. | 263. | 271. | 265. | 269. | -1.68 | 2.17 | 0.0266 | 0.874 | 0.923 | 0.998 | 0.998 | 0.950 | 0.944 | ||
| CLM4.5 | [-] | 264. | 264. | 271. | 265. | 269. | -1.38 | 1.98 | 0.0268 | 0.887 | 0.924 | 0.998 | 0.993 | 0.952 | 0.946 | ||
| CLM5 | [-] | 265. | 265. | 272. | 265. | 269. | -0.198 | 1.13 | 0.0191 | 0.945 | 0.945 | 0.999 | 0.997 | 0.965 | 0.966 |
Download Data |
Period Mean (original grids) [K] |
Model Period Mean (intersection) [K] |
Model Period Mean (complement) [K] |
Benchmark Period Mean (intersection) [K] |
Benchmark Period Mean (complement) [K] |
Bias [K] |
RMSE [K] |
Phase Shift [months] |
Bias Score [1] |
RMSE Score [1] |
Seasonal Cycle Score [1] |
Spatial Distribution Score [1] |
Interannual Variability Score [1] |
Overall Score [1] |
|||
|---|---|---|---|---|---|---|---|---|---|---|---|---|---|---|---|---|---|
| Benchmark | [-] | 274. | |||||||||||||||
| CLM4 | [-] | 274. | 273. | 284. | 274. | 280. | -0.247 | 1.79 | 0.0175 | 0.871 | 0.895 | 0.999 | 0.998 | 0.866 | 0.921 | ||
| CLM4.5 | [-] | 274. | 274. | 284. | 274. | 280. | -0.0301 | 1.73 | 0.0171 | 0.875 | 0.900 | 0.999 | 0.997 | 0.881 | 0.925 | ||
| CLM5 | [-] | 274. | 274. | 285. | 274. | 280. | 0.670 | 1.54 | 0.0163 | 0.881 | 0.923 | 0.999 | 0.999 | 0.928 | 0.942 |
Download Data |
Period Mean (original grids) [K] |
Model Period Mean (intersection) [K] |
Model Period Mean (complement) [K] |
Benchmark Period Mean (intersection) [K] |
Benchmark Period Mean (complement) [K] |
Bias [K] |
RMSE [K] |
Phase Shift [months] |
Bias Score [1] |
RMSE Score [1] |
Seasonal Cycle Score [1] |
Spatial Distribution Score [1] |
Interannual Variability Score [1] |
Overall Score [1] |
|||
|---|---|---|---|---|---|---|---|---|---|---|---|---|---|---|---|---|---|
| Benchmark | [-] | 291. | |||||||||||||||
| CLM4 | [-] | 290. | 290. | 296. | 291. | 296. | -0.339 | 1.65 | 0.310 | 0.746 | 0.786 | 0.974 | 0.995 | 0.836 | 0.854 | ||
| CLM4.5 | [-] | 291. | 291. | 296. | 291. | 296. | 0.110 | 1.56 | 0.282 | 0.740 | 0.808 | 0.976 | 0.998 | 0.885 | 0.869 | ||
| CLM5 | [-] | 291. | 291. | 297. | 291. | 296. | 0.736 | 1.51 | 0.255 | 0.717 | 0.846 | 0.978 | 0.999 | 0.929 | 0.886 |
Download Data |
Period Mean (original grids) [K] |
Model Period Mean (intersection) [K] |
Model Period Mean (complement) [K] |
Benchmark Period Mean (intersection) [K] |
Benchmark Period Mean (complement) [K] |
Bias [K] |
RMSE [K] |
Phase Shift [months] |
Bias Score [1] |
RMSE Score [1] |
Seasonal Cycle Score [1] |
Spatial Distribution Score [1] |
Interannual Variability Score [1] |
Overall Score [1] |
|||
|---|---|---|---|---|---|---|---|---|---|---|---|---|---|---|---|---|---|
| Benchmark | [-] | 259. | |||||||||||||||
| CLM4 | [-] | 258. | 258. | 262. | 259. | 260. | -1.23 | 2.13 | 0.0252 | 0.905 | 0.912 | 0.998 | 1.00 | 0.919 | 0.941 | ||
| CLM4.5 | [-] | 258. | 258. | 262. | 259. | 260. | -1.09 | 2.02 | 0.0227 | 0.913 | 0.912 | 0.998 | 0.999 | 0.919 | 0.942 | ||
| CLM5 | [-] | 259. | 259. | 263. | 259. | 260. | -0.224 | 1.48 | 0.0263 | 0.954 | 0.923 | 0.998 | 1.00 | 0.921 | 0.953 |
Download Data |
Period Mean (original grids) [K] |
Model Period Mean (intersection) [K] |
Model Period Mean (complement) [K] |
Benchmark Period Mean (intersection) [K] |
Benchmark Period Mean (complement) [K] |
Bias [K] |
RMSE [K] |
Phase Shift [months] |
Bias Score [1] |
RMSE Score [1] |
Seasonal Cycle Score [1] |
Spatial Distribution Score [1] |
Interannual Variability Score [1] |
Overall Score [1] |
|||
|---|---|---|---|---|---|---|---|---|---|---|---|---|---|---|---|---|---|
| Benchmark | [-] | 287. | |||||||||||||||
| CLM4 | [-] | 288. | 288. | 290. | 287. | 289. | 0.780 | 1.16 | 0.125 | 0.814 | 0.875 | 0.992 | 0.998 | 0.931 | 0.914 | ||
| CLM4.5 | [-] | 288. | 288. | 290. | 287. | 289. | 0.829 | 1.18 | 0.130 | 0.809 | 0.878 | 0.991 | 0.998 | 0.936 | 0.915 | ||
| CLM5 | [-] | 289. | 289. | 290. | 287. | 289. | 1.16 | 1.34 | 0.138 | 0.770 | 0.891 | 0.991 | 1.00 | 0.943 | 0.914 |
Download Data |
Period Mean (original grids) [K] |
Model Period Mean (intersection) [K] |
Model Period Mean (complement) [K] |
Benchmark Period Mean (intersection) [K] |
Benchmark Period Mean (complement) [K] |
Bias [K] |
RMSE [K] |
Phase Shift [months] |
Bias Score [1] |
RMSE Score [1] |
Seasonal Cycle Score [1] |
Spatial Distribution Score [1] |
Interannual Variability Score [1] |
Overall Score [1] |
|||
|---|---|---|---|---|---|---|---|---|---|---|---|---|---|---|---|---|---|
| Benchmark | [-] | 277. | |||||||||||||||
| CLM4 | [-] | 276. | 276. | 280. | 277. | 281. | -0.858 | 1.61 | 0.0968 | 0.808 | 0.874 | 0.993 | 0.986 | 0.897 | 0.906 | ||
| CLM4.5 | [-] | 276. | 276. | 279. | 277. | 281. | -0.928 | 1.65 | 0.0970 | 0.800 | 0.877 | 0.993 | 0.987 | 0.906 | 0.907 | ||
| CLM5 | [-] | 277. | 277. | 280. | 277. | 281. | 0.00878 | 1.14 | 0.219 | 0.859 | 0.905 | 0.985 | 0.994 | 0.942 | 0.932 |
Download Data |
Period Mean (original grids) [K] |
Model Period Mean (intersection) [K] |
Model Period Mean (complement) [K] |
Benchmark Period Mean (intersection) [K] |
Benchmark Period Mean (complement) [K] |
Bias [K] |
RMSE [K] |
Phase Shift [months] |
Bias Score [1] |
RMSE Score [1] |
Seasonal Cycle Score [1] |
Spatial Distribution Score [1] |
Interannual Variability Score [1] |
Overall Score [1] |
|||
|---|---|---|---|---|---|---|---|---|---|---|---|---|---|---|---|---|---|
| Benchmark | [-] | 281. | |||||||||||||||
| CLM4 | [-] | 276. | 280. | 243. | 280. | 287. | -0.111 | 1.59 | 0.312 | 0.783 | 0.800 | 0.962 | 0.999 | 0.890 | 0.872 | ||
| CLM4.5 | [-] | 276. | 280. | 243. | 280. | 287. | 0.0800 | 1.59 | 0.302 | 0.771 | 0.808 | 0.963 | 0.998 | 0.896 | 0.874 | ||
| CLM5 | [-] | 277. | 281. | 244. | 280. | 287. | 0.686 | 1.46 | 0.269 | 0.759 | 0.835 | 0.968 | 0.999 | 0.909 | 0.884 |
Download Data |
Period Mean (original grids) [K] |
Model Period Mean (intersection) [K] |
Model Period Mean (complement) [K] |
Benchmark Period Mean (intersection) [K] |
Benchmark Period Mean (complement) [K] |
Bias [K] |
RMSE [K] |
Phase Shift [months] |
Bias Score [1] |
RMSE Score [1] |
Seasonal Cycle Score [1] |
Spatial Distribution Score [1] |
Interannual Variability Score [1] |
Overall Score [1] |
|||
|---|---|---|---|---|---|---|---|---|---|---|---|---|---|---|---|---|---|
| Benchmark | [-] | 289. | |||||||||||||||
| CLM4 | [-] | 289. | 289. | 292. | 288. | 292. | 0.117 | 1.32 | 0.289 | 0.870 | 0.860 | 0.977 | 1.00 | 0.913 | 0.913 | ||
| CLM4.5 | [-] | 289. | 289. | 292. | 288. | 292. | 0.314 | 1.32 | 0.255 | 0.863 | 0.866 | 0.980 | 1.00 | 0.910 | 0.914 | ||
| CLM5 | [-] | 289. | 289. | 292. | 288. | 292. | 0.623 | 1.29 | 0.238 | 0.852 | 0.882 | 0.982 | 1.00 | 0.909 | 0.918 |
Download Data |
Period Mean (original grids) [K] |
Model Period Mean (intersection) [K] |
Model Period Mean (complement) [K] |
Benchmark Period Mean (intersection) [K] |
Benchmark Period Mean (complement) [K] |
Bias [K] |
RMSE [K] |
Phase Shift [months] |
Bias Score [1] |
RMSE Score [1] |
Seasonal Cycle Score [1] |
Spatial Distribution Score [1] |
Interannual Variability Score [1] |
Overall Score [1] |
|||
|---|---|---|---|---|---|---|---|---|---|---|---|---|---|---|---|---|---|
| Benchmark | [-] | 260. | |||||||||||||||
| CLM4 | [-] | 259. | 259. | 261. | 260. | 262. | -0.749 | 1.96 | 0.0558 | 0.907 | 0.900 | 0.996 | 0.999 | 0.924 | 0.938 | ||
| CLM4.5 | [-] | 259. | 259. | 261. | 260. | 262. | -0.590 | 1.87 | 0.0458 | 0.916 | 0.899 | 0.997 | 1.00 | 0.923 | 0.939 | ||
| CLM5 | [-] | 260. | 260. | 262. | 260. | 262. | 0.385 | 1.52 | 0.0456 | 0.938 | 0.915 | 0.997 | 0.998 | 0.920 | 0.947 |
Download Data |
Period Mean (original grids) [K] |
Model Period Mean (intersection) [K] |
Model Period Mean (complement) [K] |
Benchmark Period Mean (intersection) [K] |
Benchmark Period Mean (complement) [K] |
Bias [K] |
RMSE [K] |
Phase Shift [months] |
Bias Score [1] |
RMSE Score [1] |
Seasonal Cycle Score [1] |
Spatial Distribution Score [1] |
Interannual Variability Score [1] |
Overall Score [1] |
|||
|---|---|---|---|---|---|---|---|---|---|---|---|---|---|---|---|---|---|
| Benchmark | [-] | 289. | |||||||||||||||
| CLM4 | [-] | 289. | 289. | 294. | 289. | 293. | 1.07 | 1.88 | 0.358 | 0.594 | 0.755 | 0.963 | 1.00 | 0.900 | 0.828 | ||
| CLM4.5 | [-] | 289. | 289. | 294. | 289. | 293. | 1.08 | 1.86 | 0.357 | 0.600 | 0.751 | 0.964 | 0.998 | 0.910 | 0.829 | ||
| CLM5 | [-] | 289. | 289. | 294. | 289. | 293. | 1.40 | 2.00 | 0.369 | 0.568 | 0.766 | 0.961 | 0.999 | 0.905 | 0.828 |
Download Data |
Period Mean (original grids) [K] |
Model Period Mean (intersection) [K] |
Model Period Mean (complement) [K] |
Benchmark Period Mean (intersection) [K] |
Benchmark Period Mean (complement) [K] |
Bias [K] |
RMSE [K] |
Phase Shift [months] |
Bias Score [1] |
RMSE Score [1] |
Seasonal Cycle Score [1] |
Spatial Distribution Score [1] |
Interannual Variability Score [1] |
Overall Score [1] |
|||
|---|---|---|---|---|---|---|---|---|---|---|---|---|---|---|---|---|---|
| Benchmark | [-] | 280. | |||||||||||||||
| CLM4 | [-] | 280. | 280. | 289. | 280. | 287. | 0.134 | 1.03 | 0.0328 | 0.924 | 0.915 | 0.998 | 1.00 | 0.947 | 0.950 | ||
| CLM4.5 | [-] | 280. | 280. | 289. | 280. | 287. | 0.380 | 1.02 | 0.0296 | 0.919 | 0.922 | 0.998 | 1.00 | 0.956 | 0.953 | ||
| CLM5 | [-] | 281. | 281. | 289. | 280. | 287. | 1.06 | 1.27 | 0.0255 | 0.876 | 0.936 | 0.998 | 1.00 | 0.972 | 0.953 |
Download Data |
Period Mean (original grids) [K] |
Model Period Mean (intersection) [K] |
Model Period Mean (complement) [K] |
Benchmark Period Mean (intersection) [K] |
Benchmark Period Mean (complement) [K] |
Bias [K] |
RMSE [K] |
Phase Shift [months] |
Bias Score [1] |
RMSE Score [1] |
Seasonal Cycle Score [1] |
Spatial Distribution Score [1] |
Interannual Variability Score [1] |
Overall Score [1] |
|||
|---|---|---|---|---|---|---|---|---|---|---|---|---|---|---|---|---|---|
| Benchmark | [-] | 268. | |||||||||||||||
| CLM4 | [-] | 267. | 267. | 273. | 268. | 274. | -0.915 | 1.66 | 0.0351 | 0.882 | 0.907 | 0.998 | 0.986 | 0.938 | 0.936 | ||
| CLM4.5 | [-] | 267. | 267. | 273. | 268. | 274. | -0.706 | 1.54 | 0.0351 | 0.894 | 0.906 | 0.998 | 0.991 | 0.939 | 0.939 | ||
| CLM5 | [-] | 268. | 268. | 274. | 268. | 274. | 0.439 | 1.14 | 0.0361 | 0.922 | 0.926 | 0.998 | 0.997 | 0.952 | 0.953 |
Download Data |
Period Mean (original grids) [K] |
Model Period Mean (intersection) [K] |
Model Period Mean (complement) [K] |
Benchmark Period Mean (intersection) [K] |
Benchmark Period Mean (complement) [K] |
Bias [K] |
RMSE [K] |
Phase Shift [months] |
Bias Score [1] |
RMSE Score [1] |
Seasonal Cycle Score [1] |
Spatial Distribution Score [1] |
Interannual Variability Score [1] |
Overall Score [1] |
|||
|---|---|---|---|---|---|---|---|---|---|---|---|---|---|---|---|---|---|
| Benchmark | [-] | 276. | |||||||||||||||
| CLM4 | [-] | 276. | 276. | 282. | 276. | 280. | 0.948 | 1.83 | 0.0296 | 0.810 | 0.882 | 0.998 | 1.00 | 0.923 | 0.916 | ||
| CLM4.5 | [-] | 276. | 277. | 282. | 276. | 280. | 1.10 | 1.85 | 0.0383 | 0.809 | 0.881 | 0.997 | 0.999 | 0.922 | 0.915 | ||
| CLM5 | [-] | 277. | 277. | 283. | 276. | 280. | 1.52 | 2.00 | 0.0516 | 0.787 | 0.891 | 0.997 | 0.998 | 0.943 | 0.918 |
Download Data |
Period Mean (original grids) [K] |
Model Period Mean (intersection) [K] |
Model Period Mean (complement) [K] |
Benchmark Period Mean (intersection) [K] |
Benchmark Period Mean (complement) [K] |
Bias [K] |
RMSE [K] |
Phase Shift [months] |
Bias Score [1] |
RMSE Score [1] |
Seasonal Cycle Score [1] |
Spatial Distribution Score [1] |
Interannual Variability Score [1] |
Overall Score [1] |
|||
|---|---|---|---|---|---|---|---|---|---|---|---|---|---|---|---|---|---|
| Benchmark | [-] | 294. | |||||||||||||||
| CLM4 | [-] | 294. | 294. | 296. | 294. | 294. | 0.145 | 1.23 | 1.38 | 0.537 | 0.479 | 0.788 | 0.996 | 0.878 | 0.693 | ||
| CLM4.5 | [-] | 294. | 294. | 296. | 294. | 294. | 0.342 | 1.28 | 1.35 | 0.486 | 0.485 | 0.789 | 0.996 | 0.879 | 0.687 | ||
| CLM5 | [-] | 295. | 295. | 297. | 294. | 294. | 0.925 | 1.38 | 1.11 | 0.399 | 0.552 | 0.833 | 0.996 | 0.871 | 0.700 |
Download Data |
Period Mean (original grids) [K] |
Model Period Mean (intersection) [K] |
Model Period Mean (complement) [K] |
Benchmark Period Mean (intersection) [K] |
Benchmark Period Mean (complement) [K] |
Bias [K] |
RMSE [K] |
Phase Shift [months] |
Bias Score [1] |
RMSE Score [1] |
Seasonal Cycle Score [1] |
Spatial Distribution Score [1] |
Interannual Variability Score [1] |
Overall Score [1] |
|||
|---|---|---|---|---|---|---|---|---|---|---|---|---|---|---|---|---|---|
| Benchmark | [-] | 290. | |||||||||||||||
| CLM4 | [-] | 290. | 290. | 292. | 290. | 288. | 0.441 | 1.18 | 0.469 | 0.728 | 0.745 | 0.938 | 0.997 | 0.924 | 0.846 | ||
| CLM4.5 | [-] | 290. | 290. | 292. | 290. | 288. | 0.675 | 1.21 | 0.483 | 0.694 | 0.759 | 0.936 | 0.997 | 0.924 | 0.845 | ||
| CLM5 | [-] | 291. | 291. | 293. | 290. | 288. | 1.06 | 1.31 | 0.478 | 0.637 | 0.798 | 0.938 | 1.00 | 0.935 | 0.851 |
Download Data |
Period Mean (original grids) [K] |
Model Period Mean (intersection) [K] |
Model Period Mean (complement) [K] |
Benchmark Period Mean (intersection) [K] |
Benchmark Period Mean (complement) [K] |
Bias [K] |
RMSE [K] |
Phase Shift [months] |
Bias Score [1] |
RMSE Score [1] |
Seasonal Cycle Score [1] |
Spatial Distribution Score [1] |
Interannual Variability Score [1] |
Overall Score [1] |
|||
|---|---|---|---|---|---|---|---|---|---|---|---|---|---|---|---|---|---|
| Benchmark | [-] | 278. | |||||||||||||||
| CLM4 | [-] | 278. | 278. | 284. | 278. | 281. | 0.656 | 2.13 | 0.148 | 0.611 | 0.760 | 0.987 | 0.999 | 0.917 | 0.839 | ||
| CLM4.5 | [-] | 278. | 278. | 284. | 278. | 281. | 0.934 | 2.17 | 0.134 | 0.602 | 0.774 | 0.988 | 1.00 | 0.925 | 0.844 | ||
| CLM5 | [-] | 279. | 278. | 284. | 278. | 281. | 1.24 | 2.18 | 0.122 | 0.596 | 0.793 | 0.989 | 1.00 | 0.922 | 0.849 |
Temporally integrated period mean