Mean State
Download Data |
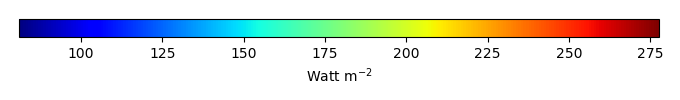
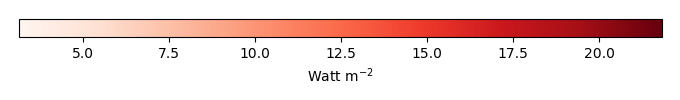
Period Mean (original grids) [Watt m-2] |
Model Period Mean (intersection) [Watt m-2] |
Model Period Mean (complement) [Watt m-2] |
Benchmark Period Mean (intersection) [Watt m-2] |
Benchmark Period Mean (complement) [Watt m-2] |
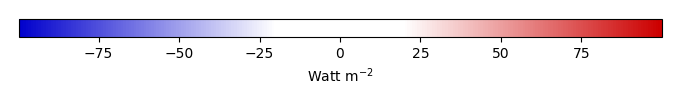
Bias [Watt m-2] |
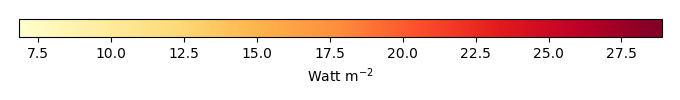
RMSE [Watt m-2] |
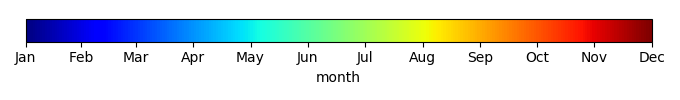
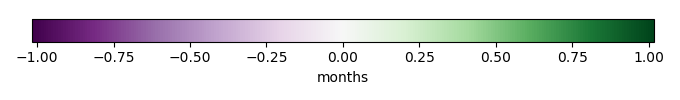
Phase Shift [months] |
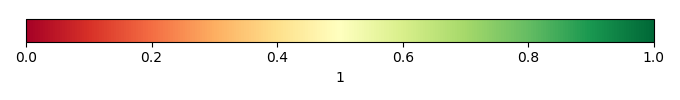
Bias Score [1] |
RMSE Score [1] |
Seasonal Cycle Score [1] |
Spatial Distribution Score [1] |
Interannual Variability Score [1] |
Overall Score [1] |
|||
|---|---|---|---|---|---|---|---|---|---|---|---|---|---|---|---|---|---|
| Benchmark | [-] | 217. | |||||||||||||||
| CLM4 | [-] | 217. | 216. | 217. | 232. | 0.504 | 14.1 | 0.318 | 0.860 | 0.543 | 0.956 | 0.999 | 0.759 | 0.777 | |||
| CLM4.5 | [-] | 217. | 216. | 217. | 232. | 0.504 | 14.1 | 0.318 | 0.860 | 0.543 | 0.956 | 0.999 | 0.759 | 0.777 | |||
| CLM5 | [-] | 217. | 216. | 217. | 232. | 0.504 | 14.1 | 0.318 | 0.860 | 0.543 | 0.956 | 0.999 | 0.759 | 0.777 |
Download Data |
Period Mean (original grids) [Watt m-2] |
Model Period Mean (intersection) [Watt m-2] |
Model Period Mean (complement) [Watt m-2] |
Benchmark Period Mean (intersection) [Watt m-2] |
Benchmark Period Mean (complement) [Watt m-2] |
Bias [Watt m-2] |
RMSE [Watt m-2] |
Phase Shift [months] |
Bias Score [1] |
RMSE Score [1] |
Seasonal Cycle Score [1] |
Spatial Distribution Score [1] |
Interannual Variability Score [1] |
Overall Score [1] |
|||
|---|---|---|---|---|---|---|---|---|---|---|---|---|---|---|---|---|---|
| Benchmark | [-] | 241. | |||||||||||||||
| CLM4 | [-] | 240. | 241. | 241. | 238. | -0.171 | 13.3 | 0.143 | 0.901 | 0.613 | 0.990 | 0.999 | 0.815 | 0.822 | |||
| CLM4.5 | [-] | 240. | 241. | 241. | 238. | -0.171 | 13.3 | 0.143 | 0.901 | 0.613 | 0.990 | 0.999 | 0.815 | 0.822 | |||
| CLM5 | [-] | 240. | 241. | 241. | 238. | -0.171 | 13.3 | 0.143 | 0.901 | 0.613 | 0.990 | 0.999 | 0.815 | 0.822 |
Download Data |
Period Mean (original grids) [Watt m-2] |
Model Period Mean (intersection) [Watt m-2] |
Model Period Mean (complement) [Watt m-2] |
Benchmark Period Mean (intersection) [Watt m-2] |
Benchmark Period Mean (complement) [Watt m-2] |
Bias [Watt m-2] |
RMSE [Watt m-2] |
Phase Shift [months] |
Bias Score [1] |
RMSE Score [1] |
Seasonal Cycle Score [1] |
Spatial Distribution Score [1] |
Interannual Variability Score [1] |
Overall Score [1] |
|||
|---|---|---|---|---|---|---|---|---|---|---|---|---|---|---|---|---|---|
| Benchmark | [-] | 233. | |||||||||||||||
| CLM4 | [-] | 233. | 233. | 233. | 238. | 0.143 | 15.9 | 0.237 | 0.890 | 0.601 | 0.969 | 0.994 | 0.696 | 0.792 | |||
| CLM4.5 | [-] | 233. | 233. | 233. | 238. | 0.143 | 15.9 | 0.237 | 0.890 | 0.601 | 0.969 | 0.994 | 0.696 | 0.792 | |||
| CLM5 | [-] | 233. | 233. | 233. | 238. | 0.143 | 15.9 | 0.237 | 0.890 | 0.601 | 0.969 | 0.994 | 0.696 | 0.792 |
Download Data |
Period Mean (original grids) [Watt m-2] |
Model Period Mean (intersection) [Watt m-2] |
Model Period Mean (complement) [Watt m-2] |
Benchmark Period Mean (intersection) [Watt m-2] |
Benchmark Period Mean (complement) [Watt m-2] |
Bias [Watt m-2] |
RMSE [Watt m-2] |
Phase Shift [months] |
Bias Score [1] |
RMSE Score [1] |
Seasonal Cycle Score [1] |
Spatial Distribution Score [1] |
Interannual Variability Score [1] |
Overall Score [1] |
|||
|---|---|---|---|---|---|---|---|---|---|---|---|---|---|---|---|---|---|
| Benchmark | [-] | 111. | |||||||||||||||
| CLM4 | [-] | 107. | 107. | 111. | 117. | -3.90 | 12.6 | 0.0241 | 0.948 | 0.850 | 0.998 | 0.896 | 0.691 | 0.872 | |||
| CLM4.5 | [-] | 107. | 107. | 111. | 117. | -3.90 | 12.6 | 0.0241 | 0.948 | 0.850 | 0.998 | 0.896 | 0.691 | 0.872 | |||
| CLM5 | [-] | 107. | 107. | 111. | 117. | -3.90 | 12.6 | 0.0241 | 0.948 | 0.850 | 0.998 | 0.896 | 0.691 | 0.872 |
Download Data |
Period Mean (original grids) [Watt m-2] |
Model Period Mean (intersection) [Watt m-2] |
Model Period Mean (complement) [Watt m-2] |
Benchmark Period Mean (intersection) [Watt m-2] |
Benchmark Period Mean (complement) [Watt m-2] |
Bias [Watt m-2] |
RMSE [Watt m-2] |
Phase Shift [months] |
Bias Score [1] |
RMSE Score [1] |
Seasonal Cycle Score [1] |
Spatial Distribution Score [1] |
Interannual Variability Score [1] |
Overall Score [1] |
|||
|---|---|---|---|---|---|---|---|---|---|---|---|---|---|---|---|---|---|
| Benchmark | [-] | 213. | |||||||||||||||
| CLM4 | [-] | 205. | 205. | 209. | 225. | 0.417 | 17.6 | 0.524 | 0.789 | 0.464 | 0.924 | 0.989 | 0.769 | 0.733 | |||
| CLM4.5 | [-] | 205. | 205. | 209. | 225. | 0.417 | 17.6 | 0.524 | 0.789 | 0.464 | 0.924 | 0.989 | 0.769 | 0.733 | |||
| CLM5 | [-] | 205. | 205. | 209. | 225. | 0.417 | 17.6 | 0.524 | 0.789 | 0.464 | 0.924 | 0.989 | 0.769 | 0.733 |
Download Data |
Period Mean (original grids) [Watt m-2] |
Model Period Mean (intersection) [Watt m-2] |
Model Period Mean (complement) [Watt m-2] |
Benchmark Period Mean (intersection) [Watt m-2] |
Benchmark Period Mean (complement) [Watt m-2] |
Bias [Watt m-2] |
RMSE [Watt m-2] |
Phase Shift [months] |
Bias Score [1] |
RMSE Score [1] |
Seasonal Cycle Score [1] |
Spatial Distribution Score [1] |
Interannual Variability Score [1] |
Overall Score [1] |
|||
|---|---|---|---|---|---|---|---|---|---|---|---|---|---|---|---|---|---|
| Benchmark | [-] | 126. | |||||||||||||||
| CLM4 | [-] | 126. | 125. | 126. | 145. | 0.0721 | 11.8 | 0.0425 | 0.982 | 0.860 | 0.997 | 1.00 | 0.637 | 0.889 | |||
| CLM4.5 | [-] | 126. | 125. | 126. | 145. | 0.0721 | 11.8 | 0.0425 | 0.982 | 0.860 | 0.997 | 1.00 | 0.637 | 0.889 | |||
| CLM5 | [-] | 126. | 126. | 126. | 145. | 0.0721 | 11.8 | 0.0425 | 0.982 | 0.860 | 0.997 | 1.00 | 0.637 | 0.889 |
Download Data |
Period Mean (original grids) [Watt m-2] |
Model Period Mean (intersection) [Watt m-2] |
Model Period Mean (complement) [Watt m-2] |
Benchmark Period Mean (intersection) [Watt m-2] |
Benchmark Period Mean (complement) [Watt m-2] |
Bias [Watt m-2] |
RMSE [Watt m-2] |
Phase Shift [months] |
Bias Score [1] |
RMSE Score [1] |
Seasonal Cycle Score [1] |
Spatial Distribution Score [1] |
Interannual Variability Score [1] |
Overall Score [1] |
|||
|---|---|---|---|---|---|---|---|---|---|---|---|---|---|---|---|---|---|
| Benchmark | [-] | 170. | |||||||||||||||
| CLM4 | [-] | 171. | 171. | 170. | 169. | 0.441 | 14.1 | 0.129 | 0.949 | 0.787 | 0.988 | 0.999 | 0.620 | 0.855 | |||
| CLM4.5 | [-] | 171. | 171. | 170. | 169. | 0.441 | 14.1 | 0.129 | 0.949 | 0.787 | 0.988 | 0.999 | 0.620 | 0.855 | |||
| CLM5 | [-] | 171. | 171. | 170. | 169. | 0.441 | 14.1 | 0.129 | 0.949 | 0.787 | 0.988 | 0.999 | 0.620 | 0.855 |
Download Data |
Period Mean (original grids) [Watt m-2] |
Model Period Mean (intersection) [Watt m-2] |
Model Period Mean (complement) [Watt m-2] |
Benchmark Period Mean (intersection) [Watt m-2] |
Benchmark Period Mean (complement) [Watt m-2] |
Bias [Watt m-2] |
RMSE [Watt m-2] |
Phase Shift [months] |
Bias Score [1] |
RMSE Score [1] |
Seasonal Cycle Score [1] |
Spatial Distribution Score [1] |
Interannual Variability Score [1] |
Overall Score [1] |
|||
|---|---|---|---|---|---|---|---|---|---|---|---|---|---|---|---|---|---|
| Benchmark | [-] | 210. | |||||||||||||||
| CLM4 | [-] | 208. | 208. | 209. | 224. | 0.482 | 16.5 | 0.148 | 0.894 | 0.657 | 0.990 | 0.991 | 0.664 | 0.809 | |||
| CLM4.5 | [-] | 208. | 208. | 209. | 224. | 0.482 | 16.5 | 0.148 | 0.894 | 0.657 | 0.990 | 0.991 | 0.664 | 0.809 | |||
| CLM5 | [-] | 208. | 208. | 209. | 224. | 0.482 | 16.5 | 0.148 | 0.894 | 0.657 | 0.990 | 0.991 | 0.664 | 0.809 |
Download Data |
Period Mean (original grids) [Watt m-2] |
Model Period Mean (intersection) [Watt m-2] |
Model Period Mean (complement) [Watt m-2] |
Benchmark Period Mean (intersection) [Watt m-2] |
Benchmark Period Mean (complement) [Watt m-2] |
Bias [Watt m-2] |
RMSE [Watt m-2] |
Phase Shift [months] |
Bias Score [1] |
RMSE Score [1] |
Seasonal Cycle Score [1] |
Spatial Distribution Score [1] |
Interannual Variability Score [1] |
Overall Score [1] |
|||
|---|---|---|---|---|---|---|---|---|---|---|---|---|---|---|---|---|---|
| Benchmark | [-] | 105. | |||||||||||||||
| CLM4 | [-] | 96.3 | 96.5 | 105. | 108. | -8.76 | 12.5 | 0.0632 | 0.901 | 0.827 | 0.996 | 0.798 | 0.644 | 0.832 | |||
| CLM4.5 | [-] | 96.3 | 96.5 | 105. | 108. | -8.76 | 12.5 | 0.0632 | 0.901 | 0.827 | 0.996 | 0.798 | 0.644 | 0.832 | |||
| CLM5 | [-] | 96.3 | 96.5 | 105. | 108. | -8.76 | 12.5 | 0.0632 | 0.901 | 0.827 | 0.996 | 0.798 | 0.644 | 0.832 |
Download Data |
Period Mean (original grids) [Watt m-2] |
Model Period Mean (intersection) [Watt m-2] |
Model Period Mean (complement) [Watt m-2] |
Benchmark Period Mean (intersection) [Watt m-2] |
Benchmark Period Mean (complement) [Watt m-2] |
Bias [Watt m-2] |
RMSE [Watt m-2] |
Phase Shift [months] |
Bias Score [1] |
RMSE Score [1] |
Seasonal Cycle Score [1] |
Spatial Distribution Score [1] |
Interannual Variability Score [1] |
Overall Score [1] |
|||
|---|---|---|---|---|---|---|---|---|---|---|---|---|---|---|---|---|---|
| Benchmark | [-] | 228. | |||||||||||||||
| CLM4 | [-] | 232. | 232. | 229. | 216. | 0.0913 | 15.0 | 0.0879 | 0.946 | 0.762 | 0.993 | 1.00 | 0.677 | 0.857 | |||
| CLM4.5 | [-] | 232. | 232. | 229. | 216. | 0.0913 | 15.0 | 0.0879 | 0.946 | 0.762 | 0.993 | 1.00 | 0.677 | 0.857 | |||
| CLM5 | [-] | 232. | 232. | 229. | 216. | 0.0913 | 15.0 | 0.0879 | 0.946 | 0.762 | 0.993 | 1.00 | 0.677 | 0.857 |
Download Data |
Period Mean (original grids) [Watt m-2] |
Model Period Mean (intersection) [Watt m-2] |
Model Period Mean (complement) [Watt m-2] |
Benchmark Period Mean (intersection) [Watt m-2] |
Benchmark Period Mean (complement) [Watt m-2] |
Bias [Watt m-2] |
RMSE [Watt m-2] |
Phase Shift [months] |
Bias Score [1] |
RMSE Score [1] |
Seasonal Cycle Score [1] |
Spatial Distribution Score [1] |
Interannual Variability Score [1] |
Overall Score [1] |
|||
|---|---|---|---|---|---|---|---|---|---|---|---|---|---|---|---|---|---|
| Benchmark | [-] | 140. | |||||||||||||||
| CLM4 | [-] | 135. | 135. | 138. | 161. | 0.0454 | 13.3 | 0.0808 | 0.952 | 0.846 | 0.994 | 0.998 | 0.641 | 0.880 | |||
| CLM4.5 | [-] | 135. | 135. | 138. | 161. | 0.0454 | 13.3 | 0.0808 | 0.952 | 0.846 | 0.994 | 0.998 | 0.641 | 0.880 | |||
| CLM5 | [-] | 135. | 135. | 138. | 161. | 0.0454 | 13.3 | 0.0808 | 0.952 | 0.846 | 0.994 | 0.998 | 0.641 | 0.880 |
Download Data |
Period Mean (original grids) [Watt m-2] |
Model Period Mean (intersection) [Watt m-2] |
Model Period Mean (complement) [Watt m-2] |
Benchmark Period Mean (intersection) [Watt m-2] |
Benchmark Period Mean (complement) [Watt m-2] |
Bias [Watt m-2] |
RMSE [Watt m-2] |
Phase Shift [months] |
Bias Score [1] |
RMSE Score [1] |
Seasonal Cycle Score [1] |
Spatial Distribution Score [1] |
Interannual Variability Score [1] |
Overall Score [1] |
|||
|---|---|---|---|---|---|---|---|---|---|---|---|---|---|---|---|---|---|
| Benchmark | [-] | 191. | |||||||||||||||
| CLM4 | [-] | 182. | 182. | 186. | 193. | -4.43 | 14.4 | 0.132 | 0.905 | 0.731 | 0.986 | 0.986 | 0.662 | 0.833 | |||
| CLM4.5 | [-] | 182. | 182. | 186. | 193. | -4.43 | 14.4 | 0.132 | 0.905 | 0.731 | 0.986 | 0.986 | 0.662 | 0.833 | |||
| CLM5 | [-] | 182. | 182. | 186. | 193. | -4.43 | 14.4 | 0.132 | 0.905 | 0.731 | 0.986 | 0.986 | 0.662 | 0.833 |
Download Data |
Period Mean (original grids) [Watt m-2] |
Model Period Mean (intersection) [Watt m-2] |
Model Period Mean (complement) [Watt m-2] |
Benchmark Period Mean (intersection) [Watt m-2] |
Benchmark Period Mean (complement) [Watt m-2] |
Bias [Watt m-2] |
RMSE [Watt m-2] |
Phase Shift [months] |
Bias Score [1] |
RMSE Score [1] |
Seasonal Cycle Score [1] |
Spatial Distribution Score [1] |
Interannual Variability Score [1] |
Overall Score [1] |
|||
|---|---|---|---|---|---|---|---|---|---|---|---|---|---|---|---|---|---|
| Benchmark | [-] | 240. | |||||||||||||||
| CLM4 | [-] | 240. | 240. | 240. | 241. | -0.0717 | 13.2 | 0.119 | 0.941 | 0.795 | 0.991 | 0.999 | 0.617 | 0.856 | |||
| CLM4.5 | [-] | 240. | 240. | 240. | 241. | -0.0717 | 13.2 | 0.119 | 0.941 | 0.795 | 0.991 | 0.999 | 0.617 | 0.856 | |||
| CLM5 | [-] | 240. | 240. | 240. | 241. | -0.0717 | 13.2 | 0.119 | 0.941 | 0.795 | 0.991 | 0.999 | 0.617 | 0.856 |
Download Data |
Period Mean (original grids) [Watt m-2] |
Model Period Mean (intersection) [Watt m-2] |
Model Period Mean (complement) [Watt m-2] |
Benchmark Period Mean (intersection) [Watt m-2] |
Benchmark Period Mean (complement) [Watt m-2] |
Bias [Watt m-2] |
RMSE [Watt m-2] |
Phase Shift [months] |
Bias Score [1] |
RMSE Score [1] |
Seasonal Cycle Score [1] |
Spatial Distribution Score [1] |
Interannual Variability Score [1] |
Overall Score [1] |
|||
|---|---|---|---|---|---|---|---|---|---|---|---|---|---|---|---|---|---|
| Benchmark | [-] | 113. | |||||||||||||||
| CLM4 | [-] | 108. | 108. | 113. | 116. | -5.10 | 12.3 | 0.0429 | 0.936 | 0.846 | 0.997 | 0.848 | 0.716 | 0.865 | |||
| CLM4.5 | [-] | 108. | 108. | 113. | 116. | -5.10 | 12.3 | 0.0429 | 0.936 | 0.846 | 0.997 | 0.848 | 0.716 | 0.865 | |||
| CLM5 | [-] | 108. | 108. | 113. | 116. | -5.10 | 12.3 | 0.0429 | 0.936 | 0.846 | 0.997 | 0.848 | 0.716 | 0.865 |
Download Data |
Period Mean (original grids) [Watt m-2] |
Model Period Mean (intersection) [Watt m-2] |
Model Period Mean (complement) [Watt m-2] |
Benchmark Period Mean (intersection) [Watt m-2] |
Benchmark Period Mean (complement) [Watt m-2] |
Bias [Watt m-2] |
RMSE [Watt m-2] |
Phase Shift [months] |
Bias Score [1] |
RMSE Score [1] |
Seasonal Cycle Score [1] |
Spatial Distribution Score [1] |
Interannual Variability Score [1] |
Overall Score [1] |
|||
|---|---|---|---|---|---|---|---|---|---|---|---|---|---|---|---|---|---|
| Benchmark | [-] | 229. | |||||||||||||||
| CLM4 | [-] | 226. | 226. | 227. | 241. | 0.355 | 16.5 | 0.210 | 0.851 | 0.683 | 0.979 | 0.989 | 0.692 | 0.813 | |||
| CLM4.5 | [-] | 226. | 226. | 227. | 241. | 0.355 | 16.5 | 0.210 | 0.851 | 0.683 | 0.979 | 0.989 | 0.692 | 0.813 | |||
| CLM5 | [-] | 226. | 226. | 227. | 241. | 0.355 | 16.5 | 0.210 | 0.851 | 0.683 | 0.979 | 0.989 | 0.692 | 0.813 |
Download Data |
Period Mean (original grids) [Watt m-2] |
Model Period Mean (intersection) [Watt m-2] |
Model Period Mean (complement) [Watt m-2] |
Benchmark Period Mean (intersection) [Watt m-2] |
Benchmark Period Mean (complement) [Watt m-2] |
Bias [Watt m-2] |
RMSE [Watt m-2] |
Phase Shift [months] |
Bias Score [1] |
RMSE Score [1] |
Seasonal Cycle Score [1] |
Spatial Distribution Score [1] |
Interannual Variability Score [1] |
Overall Score [1] |
|||
|---|---|---|---|---|---|---|---|---|---|---|---|---|---|---|---|---|---|
| Benchmark | [-] | 173. | |||||||||||||||
| CLM4 | [-] | 171. | 171. | 172. | 207. | 0.686 | 13.8 | 0.0926 | 0.964 | 0.804 | 0.994 | 1.00 | 0.633 | 0.866 | |||
| CLM4.5 | [-] | 171. | 171. | 172. | 207. | 0.686 | 13.8 | 0.0926 | 0.964 | 0.804 | 0.994 | 1.00 | 0.633 | 0.866 | |||
| CLM5 | [-] | 171. | 171. | 172. | 207. | 0.686 | 13.8 | 0.0926 | 0.964 | 0.804 | 0.994 | 1.00 | 0.633 | 0.866 |
Download Data |
Period Mean (original grids) [Watt m-2] |
Model Period Mean (intersection) [Watt m-2] |
Model Period Mean (complement) [Watt m-2] |
Benchmark Period Mean (intersection) [Watt m-2] |
Benchmark Period Mean (complement) [Watt m-2] |
Bias [Watt m-2] |
RMSE [Watt m-2] |
Phase Shift [months] |
Bias Score [1] |
RMSE Score [1] |
Seasonal Cycle Score [1] |
Spatial Distribution Score [1] |
Interannual Variability Score [1] |
Overall Score [1] |
|||
|---|---|---|---|---|---|---|---|---|---|---|---|---|---|---|---|---|---|
| Benchmark | [-] | 135. | |||||||||||||||
| CLM4 | [-] | 135. | 135. | 135. | 133. | 0.0758 | 11.1 | 0.0540 | 0.980 | 0.864 | 0.996 | 1.00 | 0.654 | 0.893 | |||
| CLM4.5 | [-] | 135. | 135. | 135. | 133. | 0.0758 | 11.1 | 0.0540 | 0.980 | 0.864 | 0.996 | 1.00 | 0.654 | 0.893 | |||
| CLM5 | [-] | 135. | 135. | 135. | 133. | 0.0758 | 11.1 | 0.0540 | 0.980 | 0.864 | 0.996 | 1.00 | 0.654 | 0.893 |
Download Data |
Period Mean (original grids) [Watt m-2] |
Model Period Mean (intersection) [Watt m-2] |
Model Period Mean (complement) [Watt m-2] |
Benchmark Period Mean (intersection) [Watt m-2] |
Benchmark Period Mean (complement) [Watt m-2] |
Bias [Watt m-2] |
RMSE [Watt m-2] |
Phase Shift [months] |
Bias Score [1] |
RMSE Score [1] |
Seasonal Cycle Score [1] |
Spatial Distribution Score [1] |
Interannual Variability Score [1] |
Overall Score [1] |
|||
|---|---|---|---|---|---|---|---|---|---|---|---|---|---|---|---|---|---|
| Benchmark | [-] | 193. | |||||||||||||||
| CLM4 | [-] | 193. | 193. | 193. | 181. | -0.0247 | 13.4 | 0.0748 | 0.969 | 0.838 | 0.995 | 1.00 | 0.647 | 0.881 | |||
| CLM4.5 | [-] | 193. | 193. | 193. | 181. | -0.0247 | 13.4 | 0.0748 | 0.969 | 0.838 | 0.995 | 1.00 | 0.647 | 0.881 | |||
| CLM5 | [-] | 193. | 193. | 193. | 181. | -0.0247 | 13.4 | 0.0748 | 0.969 | 0.838 | 0.995 | 1.00 | 0.647 | 0.881 |
Download Data |
Period Mean (original grids) [Watt m-2] |
Model Period Mean (intersection) [Watt m-2] |
Model Period Mean (complement) [Watt m-2] |
Benchmark Period Mean (intersection) [Watt m-2] |
Benchmark Period Mean (complement) [Watt m-2] |
Bias [Watt m-2] |
RMSE [Watt m-2] |
Phase Shift [months] |
Bias Score [1] |
RMSE Score [1] |
Seasonal Cycle Score [1] |
Spatial Distribution Score [1] |
Interannual Variability Score [1] |
Overall Score [1] |
|||
|---|---|---|---|---|---|---|---|---|---|---|---|---|---|---|---|---|---|
| Benchmark | [-] | 202. | |||||||||||||||
| CLM4 | [-] | 201. | 201. | 201. | 241. | 0.303 | 15.0 | 0.334 | 0.865 | 0.504 | 0.955 | 0.995 | 0.752 | 0.762 | |||
| CLM4.5 | [-] | 201. | 201. | 201. | 241. | 0.303 | 15.0 | 0.334 | 0.865 | 0.504 | 0.955 | 0.995 | 0.752 | 0.762 | |||
| CLM5 | [-] | 201. | 201. | 201. | 241. | 0.303 | 15.0 | 0.334 | 0.865 | 0.504 | 0.955 | 0.995 | 0.752 | 0.762 |
Download Data |
Period Mean (original grids) [Watt m-2] |
Model Period Mean (intersection) [Watt m-2] |
Model Period Mean (complement) [Watt m-2] |
Benchmark Period Mean (intersection) [Watt m-2] |
Benchmark Period Mean (complement) [Watt m-2] |
Bias [Watt m-2] |
RMSE [Watt m-2] |
Phase Shift [months] |
Bias Score [1] |
RMSE Score [1] |
Seasonal Cycle Score [1] |
Spatial Distribution Score [1] |
Interannual Variability Score [1] |
Overall Score [1] |
|||
|---|---|---|---|---|---|---|---|---|---|---|---|---|---|---|---|---|---|
| Benchmark | [-] | 211. | |||||||||||||||
| CLM4 | [-] | 212. | 212. | 211. | 216. | 0.782 | 17.8 | 0.173 | 0.918 | 0.624 | 0.980 | 0.996 | 0.673 | 0.802 | |||
| CLM4.5 | [-] | 212. | 212. | 211. | 216. | 0.782 | 17.8 | 0.173 | 0.918 | 0.624 | 0.980 | 0.996 | 0.673 | 0.802 | |||
| CLM5 | [-] | 212. | 212. | 211. | 216. | 0.782 | 17.8 | 0.173 | 0.918 | 0.624 | 0.980 | 0.996 | 0.673 | 0.802 |
Download Data |
Period Mean (original grids) [Watt m-2] |
Model Period Mean (intersection) [Watt m-2] |
Model Period Mean (complement) [Watt m-2] |
Benchmark Period Mean (intersection) [Watt m-2] |
Benchmark Period Mean (complement) [Watt m-2] |
Bias [Watt m-2] |
RMSE [Watt m-2] |
Phase Shift [months] |
Bias Score [1] |
RMSE Score [1] |
Seasonal Cycle Score [1] |
Spatial Distribution Score [1] |
Interannual Variability Score [1] |
Overall Score [1] |
|||
|---|---|---|---|---|---|---|---|---|---|---|---|---|---|---|---|---|---|
| Benchmark | [-] | 204. | |||||||||||||||
| CLM4 | [-] | 210. | 208. | 205. | 190. | -0.797 | 19.6 | 0.252 | 0.880 | 0.725 | 0.974 | 0.999 | 0.643 | 0.825 | |||
| CLM4.5 | [-] | 210. | 208. | 205. | 190. | -0.797 | 19.6 | 0.252 | 0.880 | 0.725 | 0.974 | 0.999 | 0.643 | 0.825 | |||
| CLM5 | [-] | 210. | 208. | 205. | 190. | -0.797 | 19.6 | 0.252 | 0.880 | 0.725 | 0.974 | 0.999 | 0.643 | 0.825 |
Temporally integrated period mean