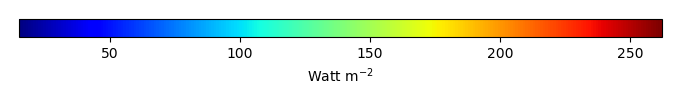
Mean State
Download Data |
Period Mean (original grids) [Watt m-2] |
Model Period Mean (intersection) [Watt m-2] |
Model Period Mean (complement) [Watt m-2] |
Benchmark Period Mean (intersection) [Watt m-2] |
Benchmark Period Mean (complement) [Watt m-2] |
Bias [Watt m-2] |
RMSE [Watt m-2] |
Phase Shift [months] |
Bias Score [1] |
RMSE Score [1] |
Seasonal Cycle Score [1] |
Spatial Distribution Score [1] |
Interannual Variability Score [1] |
Overall Score [1] |
|||
|---|---|---|---|---|---|---|---|---|---|---|---|---|---|---|---|---|---|
| Benchmark | [-] | 179. | |||||||||||||||
| CLM4 | [-] | 182. | 182. | 177. | 216. | 5.16 | 16.6 | 0.531 | 0.637 | 0.523 | 0.933 | 0.915 | 0.727 | 0.710 | |||
| CLM4.5 | [-] | 183. | 183. | 177. | 216. | 5.50 | 16.8 | 0.545 | 0.623 | 0.522 | 0.931 | 0.928 | 0.729 | 0.709 | |||
| CLM5 | [-] | 183. | 183. | 177. | 216. | 5.83 | 16.7 | 0.533 | 0.627 | 0.521 | 0.930 | 0.936 | 0.731 | 0.711 |
Download Data |
Period Mean (original grids) [Watt m-2] |
Model Period Mean (intersection) [Watt m-2] |
Model Period Mean (complement) [Watt m-2] |
Benchmark Period Mean (intersection) [Watt m-2] |
Benchmark Period Mean (complement) [Watt m-2] |
Bias [Watt m-2] |
RMSE [Watt m-2] |
Phase Shift [months] |
Bias Score [1] |
RMSE Score [1] |
Seasonal Cycle Score [1] |
Spatial Distribution Score [1] |
Interannual Variability Score [1] |
Overall Score [1] |
|||
|---|---|---|---|---|---|---|---|---|---|---|---|---|---|---|---|---|---|
| Benchmark | [-] | 189. | |||||||||||||||
| CLM4 | [-] | 193. | 193. | 188. | 224. | 5.16 | 15.8 | 0.379 | 0.697 | 0.536 | 0.971 | 0.999 | 0.785 | 0.754 | |||
| CLM4.5 | [-] | 194. | 194. | 188. | 224. | 6.02 | 16.3 | 0.394 | 0.677 | 0.534 | 0.968 | 0.999 | 0.787 | 0.750 | |||
| CLM5 | [-] | 195. | 195. | 188. | 224. | 6.89 | 16.6 | 0.458 | 0.662 | 0.533 | 0.955 | 0.998 | 0.783 | 0.744 |
Download Data |
Period Mean (original grids) [Watt m-2] |
Model Period Mean (intersection) [Watt m-2] |
Model Period Mean (complement) [Watt m-2] |
Benchmark Period Mean (intersection) [Watt m-2] |
Benchmark Period Mean (complement) [Watt m-2] |
Bias [Watt m-2] |
RMSE [Watt m-2] |
Phase Shift [months] |
Bias Score [1] |
RMSE Score [1] |
Seasonal Cycle Score [1] |
Spatial Distribution Score [1] |
Interannual Variability Score [1] |
Overall Score [1] |
|||
|---|---|---|---|---|---|---|---|---|---|---|---|---|---|---|---|---|---|
| Benchmark | [-] | 194. | |||||||||||||||
| CLM4 | [-] | 196. | 196. | 192. | 221. | 3.08 | 18.5 | 0.555 | 0.733 | 0.562 | 0.925 | 0.957 | 0.669 | 0.735 | |||
| CLM4.5 | [-] | 196. | 196. | 192. | 221. | 3.59 | 18.8 | 0.575 | 0.720 | 0.560 | 0.923 | 0.956 | 0.671 | 0.732 | |||
| CLM5 | [-] | 197. | 197. | 192. | 221. | 3.85 | 18.7 | 0.529 | 0.718 | 0.563 | 0.926 | 0.960 | 0.668 | 0.733 |
Download Data |
Period Mean (original grids) [Watt m-2] |
Model Period Mean (intersection) [Watt m-2] |
Model Period Mean (complement) [Watt m-2] |
Benchmark Period Mean (intersection) [Watt m-2] |
Benchmark Period Mean (complement) [Watt m-2] |
Bias [Watt m-2] |
RMSE [Watt m-2] |
Phase Shift [months] |
Bias Score [1] |
RMSE Score [1] |
Seasonal Cycle Score [1] |
Spatial Distribution Score [1] |
Interannual Variability Score [1] |
Overall Score [1] |
|||
|---|---|---|---|---|---|---|---|---|---|---|---|---|---|---|---|---|---|
| Benchmark | [-] | 81.3 | |||||||||||||||
| CLM4 | [-] | 66.3 | 66.4 | 80.9 | 86.2 | -14.7 | 25.3 | 0.338 | 0.805 | 0.717 | 0.978 | 0.944 | 0.768 | 0.822 | |||
| CLM4.5 | [-] | 71.3 | 71.4 | 80.9 | 86.2 | -10.5 | 21.0 | 0.213 | 0.853 | 0.749 | 0.986 | 0.893 | 0.707 | 0.823 | |||
| CLM5 | [-] | 72.8 | 72.9 | 80.9 | 86.2 | -9.00 | 20.1 | 0.218 | 0.871 | 0.754 | 0.986 | 0.924 | 0.696 | 0.831 |
Download Data |
Period Mean (original grids) [Watt m-2] |
Model Period Mean (intersection) [Watt m-2] |
Model Period Mean (complement) [Watt m-2] |
Benchmark Period Mean (intersection) [Watt m-2] |
Benchmark Period Mean (complement) [Watt m-2] |
Bias [Watt m-2] |
RMSE [Watt m-2] |
Phase Shift [months] |
Bias Score [1] |
RMSE Score [1] |
Seasonal Cycle Score [1] |
Spatial Distribution Score [1] |
Interannual Variability Score [1] |
Overall Score [1] |
|||
|---|---|---|---|---|---|---|---|---|---|---|---|---|---|---|---|---|---|
| Benchmark | [-] | 189. | |||||||||||||||
| CLM4 | [-] | 177. | 177. | 183. | 210. | -1.97 | 20.6 | 0.688 | 0.610 | 0.454 | 0.905 | 0.720 | 0.711 | 0.642 | |||
| CLM4.5 | [-] | 178. | 177. | 183. | 210. | -1.82 | 20.6 | 0.686 | 0.607 | 0.454 | 0.906 | 0.714 | 0.712 | 0.641 | |||
| CLM5 | [-] | 177. | 177. | 183. | 210. | -2.07 | 20.5 | 0.665 | 0.611 | 0.455 | 0.909 | 0.728 | 0.713 | 0.645 |
Download Data |
Period Mean (original grids) [Watt m-2] |
Model Period Mean (intersection) [Watt m-2] |
Model Period Mean (complement) [Watt m-2] |
Benchmark Period Mean (intersection) [Watt m-2] |
Benchmark Period Mean (complement) [Watt m-2] |
Bias [Watt m-2] |
RMSE [Watt m-2] |
Phase Shift [months] |
Bias Score [1] |
RMSE Score [1] |
Seasonal Cycle Score [1] |
Spatial Distribution Score [1] |
Interannual Variability Score [1] |
Overall Score [1] |
|||
|---|---|---|---|---|---|---|---|---|---|---|---|---|---|---|---|---|---|
| Benchmark | [-] | 105. | |||||||||||||||
| CLM4 | [-] | 102. | 102. | 104. | 127. | -2.21 | 15.7 | 0.0825 | 0.938 | 0.807 | 0.995 | 0.982 | 0.648 | 0.863 | |||
| CLM4.5 | [-] | 99.6 | 99.6 | 104. | 127. | -4.37 | 17.6 | 0.0854 | 0.919 | 0.792 | 0.994 | 0.984 | 0.650 | 0.855 | |||
| CLM5 | [-] | 100. | 100. | 104. | 127. | -3.81 | 16.7 | 0.0856 | 0.929 | 0.798 | 0.994 | 0.998 | 0.644 | 0.860 |
Download Data |
Period Mean (original grids) [Watt m-2] |
Model Period Mean (intersection) [Watt m-2] |
Model Period Mean (complement) [Watt m-2] |
Benchmark Period Mean (intersection) [Watt m-2] |
Benchmark Period Mean (complement) [Watt m-2] |
Bias [Watt m-2] |
RMSE [Watt m-2] |
Phase Shift [months] |
Bias Score [1] |
RMSE Score [1] |
Seasonal Cycle Score [1] |
Spatial Distribution Score [1] |
Interannual Variability Score [1] |
Overall Score [1] |
|||
|---|---|---|---|---|---|---|---|---|---|---|---|---|---|---|---|---|---|
| Benchmark | [-] | 140. | |||||||||||||||
| CLM4 | [-] | 135. | 134. | 139. | 154. | -4.57 | 17.4 | 0.219 | 0.878 | 0.744 | 0.981 | 0.992 | 0.624 | 0.827 | |||
| CLM4.5 | [-] | 134. | 134. | 139. | 154. | -5.35 | 17.6 | 0.209 | 0.869 | 0.745 | 0.983 | 0.995 | 0.621 | 0.826 | |||
| CLM5 | [-] | 136. | 135. | 139. | 154. | -3.72 | 16.9 | 0.242 | 0.891 | 0.744 | 0.980 | 0.998 | 0.623 | 0.830 |
Download Data |
Period Mean (original grids) [Watt m-2] |
Model Period Mean (intersection) [Watt m-2] |
Model Period Mean (complement) [Watt m-2] |
Benchmark Period Mean (intersection) [Watt m-2] |
Benchmark Period Mean (complement) [Watt m-2] |
Bias [Watt m-2] |
RMSE [Watt m-2] |
Phase Shift [months] |
Bias Score [1] |
RMSE Score [1] |
Seasonal Cycle Score [1] |
Spatial Distribution Score [1] |
Interannual Variability Score [1] |
Overall Score [1] |
|||
|---|---|---|---|---|---|---|---|---|---|---|---|---|---|---|---|---|---|
| Benchmark | [-] | 180. | |||||||||||||||
| CLM4 | [-] | 174. | 174. | 178. | 210. | -2.65 | 19.1 | 0.305 | 0.800 | 0.618 | 0.979 | 0.961 | 0.645 | 0.770 | |||
| CLM4.5 | [-] | 174. | 174. | 178. | 210. | -2.23 | 19.1 | 0.279 | 0.796 | 0.618 | 0.981 | 0.947 | 0.638 | 0.767 | |||
| CLM5 | [-] | 175. | 175. | 178. | 210. | -1.80 | 18.7 | 0.253 | 0.806 | 0.620 | 0.983 | 0.920 | 0.634 | 0.764 |
Download Data |
Period Mean (original grids) [Watt m-2] |
Model Period Mean (intersection) [Watt m-2] |
Model Period Mean (complement) [Watt m-2] |
Benchmark Period Mean (intersection) [Watt m-2] |
Benchmark Period Mean (complement) [Watt m-2] |
Bias [Watt m-2] |
RMSE [Watt m-2] |
Phase Shift [months] |
Bias Score [1] |
RMSE Score [1] |
Seasonal Cycle Score [1] |
Spatial Distribution Score [1] |
Interannual Variability Score [1] |
Overall Score [1] |
|||
|---|---|---|---|---|---|---|---|---|---|---|---|---|---|---|---|---|---|
| Benchmark | [-] | 74.6 | |||||||||||||||
| CLM4 | [-] | 58.5 | 58.9 | 74.6 | 74.8 | -16.2 | 22.4 | 0.224 | 0.780 | 0.722 | 0.985 | 0.928 | 0.717 | 0.809 | |||
| CLM4.5 | [-] | 61.2 | 61.6 | 74.6 | 74.8 | -13.8 | 20.5 | 0.265 | 0.811 | 0.735 | 0.982 | 0.916 | 0.677 | 0.809 | |||
| CLM5 | [-] | 64.0 | 64.4 | 74.6 | 74.8 | -11.2 | 19.0 | 0.311 | 0.844 | 0.742 | 0.979 | 0.929 | 0.675 | 0.819 |
Download Data |
Period Mean (original grids) [Watt m-2] |
Model Period Mean (intersection) [Watt m-2] |
Model Period Mean (complement) [Watt m-2] |
Benchmark Period Mean (intersection) [Watt m-2] |
Benchmark Period Mean (complement) [Watt m-2] |
Bias [Watt m-2] |
RMSE [Watt m-2] |
Phase Shift [months] |
Bias Score [1] |
RMSE Score [1] |
Seasonal Cycle Score [1] |
Spatial Distribution Score [1] |
Interannual Variability Score [1] |
Overall Score [1] |
|||
|---|---|---|---|---|---|---|---|---|---|---|---|---|---|---|---|---|---|
| Benchmark | [-] | 193. | |||||||||||||||
| CLM4 | [-] | 191. | 191. | 193. | 202. | -3.08 | 17.9 | 0.169 | 0.858 | 0.708 | 0.987 | 0.998 | 0.614 | 0.812 | |||
| CLM4.5 | [-] | 191. | 191. | 193. | 202. | -3.11 | 17.9 | 0.154 | 0.859 | 0.708 | 0.989 | 0.997 | 0.615 | 0.813 | |||
| CLM5 | [-] | 192. | 192. | 193. | 202. | -1.99 | 18.1 | 0.222 | 0.852 | 0.704 | 0.983 | 0.999 | 0.615 | 0.809 |
Download Data |
Period Mean (original grids) [Watt m-2] |
Model Period Mean (intersection) [Watt m-2] |
Model Period Mean (complement) [Watt m-2] |
Benchmark Period Mean (intersection) [Watt m-2] |
Benchmark Period Mean (complement) [Watt m-2] |
Bias [Watt m-2] |
RMSE [Watt m-2] |
Phase Shift [months] |
Bias Score [1] |
RMSE Score [1] |
Seasonal Cycle Score [1] |
Spatial Distribution Score [1] |
Interannual Variability Score [1] |
Overall Score [1] |
|||
|---|---|---|---|---|---|---|---|---|---|---|---|---|---|---|---|---|---|
| Benchmark | [-] | 120. | |||||||||||||||
| CLM4 | [-] | 112. | 112. | 117. | 151. | -2.82 | 17.7 | 0.335 | 0.894 | 0.790 | 0.977 | 0.990 | 0.642 | 0.847 | |||
| CLM4.5 | [-] | 113. | 113. | 117. | 151. | -1.86 | 16.6 | 0.303 | 0.905 | 0.798 | 0.979 | 0.998 | 0.629 | 0.851 | |||
| CLM5 | [-] | 113. | 113. | 117. | 151. | -1.95 | 16.4 | 0.358 | 0.908 | 0.800 | 0.975 | 0.998 | 0.623 | 0.851 |
Download Data |
Period Mean (original grids) [Watt m-2] |
Model Period Mean (intersection) [Watt m-2] |
Model Period Mean (complement) [Watt m-2] |
Benchmark Period Mean (intersection) [Watt m-2] |
Benchmark Period Mean (complement) [Watt m-2] |
Bias [Watt m-2] |
RMSE [Watt m-2] |
Phase Shift [months] |
Bias Score [1] |
RMSE Score [1] |
Seasonal Cycle Score [1] |
Spatial Distribution Score [1] |
Interannual Variability Score [1] |
Overall Score [1] |
|||
|---|---|---|---|---|---|---|---|---|---|---|---|---|---|---|---|---|---|
| Benchmark | [-] | 168. | |||||||||||||||
| CLM4 | [-] | 135. | 135. | 143. | 180. | -6.91 | 19.6 | 0.271 | 0.779 | 0.669 | 0.973 | 0.965 | 0.631 | 0.781 | |||
| CLM4.5 | [-] | 136. | 136. | 143. | 180. | -6.33 | 19.0 | 0.272 | 0.785 | 0.672 | 0.973 | 0.972 | 0.629 | 0.784 | |||
| CLM5 | [-] | 137. | 137. | 143. | 180. | -5.85 | 18.9 | 0.278 | 0.788 | 0.672 | 0.972 | 0.967 | 0.624 | 0.783 |
Download Data |
Period Mean (original grids) [Watt m-2] |
Model Period Mean (intersection) [Watt m-2] |
Model Period Mean (complement) [Watt m-2] |
Benchmark Period Mean (intersection) [Watt m-2] |
Benchmark Period Mean (complement) [Watt m-2] |
Bias [Watt m-2] |
RMSE [Watt m-2] |
Phase Shift [months] |
Bias Score [1] |
RMSE Score [1] |
Seasonal Cycle Score [1] |
Spatial Distribution Score [1] |
Interannual Variability Score [1] |
Overall Score [1] |
|||
|---|---|---|---|---|---|---|---|---|---|---|---|---|---|---|---|---|---|
| Benchmark | [-] | 175. | |||||||||||||||
| CLM4 | [-] | 160. | 160. | 173. | 224. | -12.1 | 20.3 | 0.278 | 0.701 | 0.733 | 0.977 | 0.989 | 0.574 | 0.785 | |||
| CLM4.5 | [-] | 161. | 161. | 173. | 224. | -11.6 | 20.0 | 0.273 | 0.705 | 0.734 | 0.977 | 0.989 | 0.573 | 0.785 | |||
| CLM5 | [-] | 162. | 162. | 173. | 224. | -10.2 | 19.7 | 0.305 | 0.716 | 0.728 | 0.974 | 0.988 | 0.578 | 0.785 |
Download Data |
Period Mean (original grids) [Watt m-2] |
Model Period Mean (intersection) [Watt m-2] |
Model Period Mean (complement) [Watt m-2] |
Benchmark Period Mean (intersection) [Watt m-2] |
Benchmark Period Mean (complement) [Watt m-2] |
Bias [Watt m-2] |
RMSE [Watt m-2] |
Phase Shift [months] |
Bias Score [1] |
RMSE Score [1] |
Seasonal Cycle Score [1] |
Spatial Distribution Score [1] |
Interannual Variability Score [1] |
Overall Score [1] |
|||
|---|---|---|---|---|---|---|---|---|---|---|---|---|---|---|---|---|---|
| Benchmark | [-] | 80.0 | |||||||||||||||
| CLM4 | [-] | 67.4 | 67.3 | 79.8 | 82.9 | -13.6 | 22.1 | 0.118 | 0.812 | 0.746 | 0.992 | 0.903 | 0.772 | 0.829 | |||
| CLM4.5 | [-] | 70.5 | 70.3 | 79.8 | 82.9 | -11.0 | 19.4 | 0.109 | 0.839 | 0.764 | 0.993 | 0.904 | 0.731 | 0.832 | |||
| CLM5 | [-] | 70.5 | 70.4 | 79.8 | 82.9 | -10.9 | 19.6 | 0.0911 | 0.839 | 0.762 | 0.994 | 0.890 | 0.724 | 0.829 |
Download Data |
Period Mean (original grids) [Watt m-2] |
Model Period Mean (intersection) [Watt m-2] |
Model Period Mean (complement) [Watt m-2] |
Benchmark Period Mean (intersection) [Watt m-2] |
Benchmark Period Mean (complement) [Watt m-2] |
Bias [Watt m-2] |
RMSE [Watt m-2] |
Phase Shift [months] |
Bias Score [1] |
RMSE Score [1] |
Seasonal Cycle Score [1] |
Spatial Distribution Score [1] |
Interannual Variability Score [1] |
Overall Score [1] |
|||
|---|---|---|---|---|---|---|---|---|---|---|---|---|---|---|---|---|---|
| Benchmark | [-] | 205. | |||||||||||||||
| CLM4 | [-] | 192. | 192. | 200. | 227. | -6.15 | 20.3 | 0.271 | 0.759 | 0.637 | 0.970 | 0.901 | 0.625 | 0.755 | |||
| CLM4.5 | [-] | 191. | 192. | 200. | 227. | -6.61 | 20.3 | 0.298 | 0.766 | 0.636 | 0.967 | 0.898 | 0.627 | 0.755 | |||
| CLM5 | [-] | 192. | 192. | 200. | 227. | -6.23 | 20.2 | 0.250 | 0.768 | 0.638 | 0.975 | 0.895 | 0.627 | 0.757 |
Download Data |
Period Mean (original grids) [Watt m-2] |
Model Period Mean (intersection) [Watt m-2] |
Model Period Mean (complement) [Watt m-2] |
Benchmark Period Mean (intersection) [Watt m-2] |
Benchmark Period Mean (complement) [Watt m-2] |
Bias [Watt m-2] |
RMSE [Watt m-2] |
Phase Shift [months] |
Bias Score [1] |
RMSE Score [1] |
Seasonal Cycle Score [1] |
Spatial Distribution Score [1] |
Interannual Variability Score [1] |
Overall Score [1] |
|||
|---|---|---|---|---|---|---|---|---|---|---|---|---|---|---|---|---|---|
| Benchmark | [-] | 153. | |||||||||||||||
| CLM4 | [-] | 146. | 146. | 151. | 194. | -3.56 | 15.8 | 0.146 | 0.929 | 0.769 | 0.990 | 0.999 | 0.621 | 0.846 | |||
| CLM4.5 | [-] | 145. | 145. | 151. | 194. | -4.37 | 15.8 | 0.143 | 0.917 | 0.770 | 0.990 | 1.00 | 0.622 | 0.845 | |||
| CLM5 | [-] | 144. | 144. | 151. | 194. | -5.31 | 16.1 | 0.154 | 0.907 | 0.770 | 0.990 | 1.00 | 0.618 | 0.842 |
Download Data |
Period Mean (original grids) [Watt m-2] |
Model Period Mean (intersection) [Watt m-2] |
Model Period Mean (complement) [Watt m-2] |
Benchmark Period Mean (intersection) [Watt m-2] |
Benchmark Period Mean (complement) [Watt m-2] |
Bias [Watt m-2] |
RMSE [Watt m-2] |
Phase Shift [months] |
Bias Score [1] |
RMSE Score [1] |
Seasonal Cycle Score [1] |
Spatial Distribution Score [1] |
Interannual Variability Score [1] |
Overall Score [1] |
|||
|---|---|---|---|---|---|---|---|---|---|---|---|---|---|---|---|---|---|
| Benchmark | [-] | 115. | |||||||||||||||
| CLM4 | [-] | 111. | 111. | 114. | 123. | -3.01 | 15.2 | 0.0925 | 0.918 | 0.823 | 0.994 | 0.981 | 0.651 | 0.865 | |||
| CLM4.5 | [-] | 112. | 112. | 114. | 123. | -2.43 | 14.6 | 0.0955 | 0.925 | 0.826 | 0.994 | 0.996 | 0.628 | 0.866 | |||
| CLM5 | [-] | 111. | 112. | 114. | 123. | -2.98 | 14.7 | 0.0893 | 0.924 | 0.826 | 0.994 | 0.999 | 0.636 | 0.867 |
Download Data |
Period Mean (original grids) [Watt m-2] |
Model Period Mean (intersection) [Watt m-2] |
Model Period Mean (complement) [Watt m-2] |
Benchmark Period Mean (intersection) [Watt m-2] |
Benchmark Period Mean (complement) [Watt m-2] |
Bias [Watt m-2] |
RMSE [Watt m-2] |
Phase Shift [months] |
Bias Score [1] |
RMSE Score [1] |
Seasonal Cycle Score [1] |
Spatial Distribution Score [1] |
Interannual Variability Score [1] |
Overall Score [1] |
|||
|---|---|---|---|---|---|---|---|---|---|---|---|---|---|---|---|---|---|
| Benchmark | [-] | 162. | |||||||||||||||
| CLM4 | [-] | 157. | 157. | 162. | 171. | -4.35 | 15.9 | 0.143 | 0.916 | 0.805 | 0.991 | 0.999 | 0.648 | 0.861 | |||
| CLM4.5 | [-] | 156. | 156. | 162. | 171. | -5.47 | 15.9 | 0.139 | 0.903 | 0.810 | 0.991 | 1.00 | 0.655 | 0.862 | |||
| CLM5 | [-] | 159. | 159. | 162. | 171. | -2.78 | 15.1 | 0.159 | 0.930 | 0.810 | 0.989 | 1.00 | 0.648 | 0.865 |
Download Data |
Period Mean (original grids) [Watt m-2] |
Model Period Mean (intersection) [Watt m-2] |
Model Period Mean (complement) [Watt m-2] |
Benchmark Period Mean (intersection) [Watt m-2] |
Benchmark Period Mean (complement) [Watt m-2] |
Bias [Watt m-2] |
RMSE [Watt m-2] |
Phase Shift [months] |
Bias Score [1] |
RMSE Score [1] |
Seasonal Cycle Score [1] |
Spatial Distribution Score [1] |
Interannual Variability Score [1] |
Overall Score [1] |
|||
|---|---|---|---|---|---|---|---|---|---|---|---|---|---|---|---|---|---|
| Benchmark | [-] | 176. | |||||||||||||||
| CLM4 | [-] | 174. | 174. | 174. | 226. | 0.0995 | 17.1 | 0.485 | 0.825 | 0.468 | 0.939 | 0.951 | 0.645 | 0.716 | |||
| CLM4.5 | [-] | 174. | 174. | 174. | 226. | 0.344 | 17.2 | 0.512 | 0.828 | 0.467 | 0.935 | 0.945 | 0.645 | 0.714 | |||
| CLM5 | [-] | 174. | 174. | 174. | 226. | 0.173 | 17.1 | 0.479 | 0.828 | 0.468 | 0.940 | 0.943 | 0.645 | 0.715 |
Download Data |
Period Mean (original grids) [Watt m-2] |
Model Period Mean (intersection) [Watt m-2] |
Model Period Mean (complement) [Watt m-2] |
Benchmark Period Mean (intersection) [Watt m-2] |
Benchmark Period Mean (complement) [Watt m-2] |
Bias [Watt m-2] |
RMSE [Watt m-2] |
Phase Shift [months] |
Bias Score [1] |
RMSE Score [1] |
Seasonal Cycle Score [1] |
Spatial Distribution Score [1] |
Interannual Variability Score [1] |
Overall Score [1] |
|||
|---|---|---|---|---|---|---|---|---|---|---|---|---|---|---|---|---|---|
| Benchmark | [-] | 182. | |||||||||||||||
| CLM4 | [-] | 181. | 181. | 181. | 201. | -0.244 | 19.2 | 0.361 | 0.883 | 0.570 | 0.957 | 0.996 | 0.616 | 0.765 | |||
| CLM4.5 | [-] | 181. | 181. | 181. | 201. | -0.363 | 19.2 | 0.395 | 0.888 | 0.569 | 0.950 | 0.995 | 0.616 | 0.765 | |||
| CLM5 | [-] | 180. | 181. | 181. | 201. | -0.876 | 19.1 | 0.319 | 0.886 | 0.572 | 0.959 | 0.999 | 0.614 | 0.767 |
Download Data |
Period Mean (original grids) [Watt m-2] |
Model Period Mean (intersection) [Watt m-2] |
Model Period Mean (complement) [Watt m-2] |
Benchmark Period Mean (intersection) [Watt m-2] |
Benchmark Period Mean (complement) [Watt m-2] |
Bias [Watt m-2] |
RMSE [Watt m-2] |
Phase Shift [months] |
Bias Score [1] |
RMSE Score [1] |
Seasonal Cycle Score [1] |
Spatial Distribution Score [1] |
Interannual Variability Score [1] |
Overall Score [1] |
|||
|---|---|---|---|---|---|---|---|---|---|---|---|---|---|---|---|---|---|
| Benchmark | [-] | 176. | |||||||||||||||
| CLM4 | [-] | 174. | 173. | 176. | 178. | -5.68 | 21.2 | 0.306 | 0.837 | 0.697 | 0.970 | 0.998 | 0.607 | 0.801 | |||
| CLM4.5 | [-] | 175. | 174. | 176. | 178. | -5.09 | 20.9 | 0.287 | 0.841 | 0.698 | 0.972 | 0.999 | 0.604 | 0.802 | |||
| CLM5 | [-] | 176. | 175. | 176. | 178. | -3.76 | 20.8 | 0.301 | 0.842 | 0.697 | 0.970 | 0.999 | 0.603 | 0.801 |
Temporally integrated period mean