Mean State
Download Data |
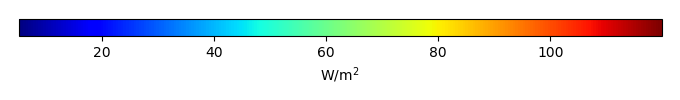
Period Mean (original grids) [W/m2] |
Model Period Mean (intersection) [W/m2] |
Model Period Mean (complement) [W/m2] |
Benchmark Period Mean (intersection) [W/m2] |
Benchmark Period Mean (complement) [W/m2] |
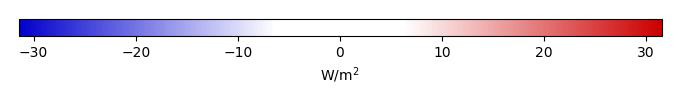
Bias [W/m2] |
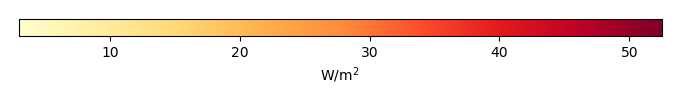
RMSE [W/m2] |
Phase Shift [months] |
Bias Score [1] |
RMSE Score [1] |
Seasonal Cycle Score [1] |
Spatial Distribution Score [1] |
Interannual Variability Score [1] |
Overall Score [1] |
|||
|---|---|---|---|---|---|---|---|---|---|---|---|---|---|---|---|---|---|
| Benchmark | [-] | 31.3 | |||||||||||||||
| CLM4 | [-] | 34.4 | 34.1 | 32.3 | 12.4 | 2.42 | 7.66 | 1.86 | 0.391 | 0.326 | 0.735 | 0.962 | 0.715 | 0.576 | |||
| CLM4.5 | [-] | 34.0 | 33.7 | 32.3 | 12.4 | 2.14 | 7.88 | 1.89 | 0.408 | 0.316 | 0.728 | 0.959 | 0.717 | 0.574 | |||
| CLM5 | [-] | 33.7 | 33.4 | 32.3 | 12.4 | 1.78 | 7.73 | 1.92 | 0.394 | 0.331 | 0.721 | 0.925 | 0.696 | 0.566 |
Download Data |
Period Mean (original grids) [W/m2] |
Model Period Mean (intersection) [W/m2] |
Model Period Mean (complement) [W/m2] |
Benchmark Period Mean (intersection) [W/m2] |
Benchmark Period Mean (complement) [W/m2] |
Bias [W/m2] |
RMSE [W/m2] |
Phase Shift [months] |
Bias Score [1] |
RMSE Score [1] |
Seasonal Cycle Score [1] |
Spatial Distribution Score [1] |
Interannual Variability Score [1] |
Overall Score [1] |
|||
|---|---|---|---|---|---|---|---|---|---|---|---|---|---|---|---|---|---|
| Benchmark | [-] | 44.7 | |||||||||||||||
| CLM4 | [-] | 47.1 | 47.6 | 45.1 | 13.9 | 2.21 | 8.75 | 1.09 | 0.493 | 0.336 | 0.865 | 0.987 | 0.787 | 0.634 | |||
| CLM4.5 | [-] | 46.1 | 46.6 | 45.1 | 13.9 | 1.26 | 8.86 | 0.943 | 0.528 | 0.332 | 0.884 | 0.982 | 0.800 | 0.643 | |||
| CLM5 | [-] | 45.2 | 45.7 | 45.1 | 13.9 | 0.386 | 8.71 | 0.894 | 0.533 | 0.344 | 0.891 | 0.972 | 0.720 | 0.634 |
Download Data |
Period Mean (original grids) [W/m2] |
Model Period Mean (intersection) [W/m2] |
Model Period Mean (complement) [W/m2] |
Benchmark Period Mean (intersection) [W/m2] |
Benchmark Period Mean (complement) [W/m2] |
Bias [W/m2] |
RMSE [W/m2] |
Phase Shift [months] |
Bias Score [1] |
RMSE Score [1] |
Seasonal Cycle Score [1] |
Spatial Distribution Score [1] |
Interannual Variability Score [1] |
Overall Score [1] |
|||
|---|---|---|---|---|---|---|---|---|---|---|---|---|---|---|---|---|---|
| Benchmark | [-] | 33.4 | |||||||||||||||
| CLM4 | [-] | 37.1 | 37.1 | 34.3 | 15.0 | 2.98 | 8.69 | 1.50 | 0.544 | 0.393 | 0.791 | 0.917 | 0.752 | 0.632 | |||
| CLM4.5 | [-] | 36.6 | 36.6 | 34.3 | 15.0 | 2.52 | 8.73 | 1.50 | 0.579 | 0.383 | 0.789 | 0.929 | 0.751 | 0.636 | |||
| CLM5 | [-] | 36.3 | 36.3 | 34.3 | 15.0 | 2.16 | 8.43 | 1.35 | 0.555 | 0.413 | 0.815 | 0.902 | 0.712 | 0.635 |
Download Data |
Period Mean (original grids) [W/m2] |
Model Period Mean (intersection) [W/m2] |
Model Period Mean (complement) [W/m2] |
Benchmark Period Mean (intersection) [W/m2] |
Benchmark Period Mean (complement) [W/m2] |
Bias [W/m2] |
RMSE [W/m2] |
Phase Shift [months] |
Bias Score [1] |
RMSE Score [1] |
Seasonal Cycle Score [1] |
Spatial Distribution Score [1] |
Interannual Variability Score [1] |
Overall Score [1] |
|||
|---|---|---|---|---|---|---|---|---|---|---|---|---|---|---|---|---|---|
| Benchmark | [-] | 40.8 | |||||||||||||||
| CLM4 | [-] | 39.6 | 39.5 | 41.2 | 35.6 | -1.61 | 19.9 | 0.301 | 0.852 | 0.679 | 0.980 | 0.905 | 0.770 | 0.811 | |||
| CLM4.5 | [-] | 34.8 | 34.7 | 41.2 | 35.6 | -5.76 | 22.4 | 0.186 | 0.823 | 0.651 | 0.988 | 0.918 | 0.677 | 0.785 | |||
| CLM5 | [-] | 33.3 | 33.3 | 41.2 | 35.6 | -7.13 | 23.8 | 0.214 | 0.810 | 0.637 | 0.986 | 0.925 | 0.656 | 0.775 |
Download Data |
Period Mean (original grids) [W/m2] |
Model Period Mean (intersection) [W/m2] |
Model Period Mean (complement) [W/m2] |
Benchmark Period Mean (intersection) [W/m2] |
Benchmark Period Mean (complement) [W/m2] |
Bias [W/m2] |
RMSE [W/m2] |
Phase Shift [months] |
Bias Score [1] |
RMSE Score [1] |
Seasonal Cycle Score [1] |
Spatial Distribution Score [1] |
Interannual Variability Score [1] |
Overall Score [1] |
|||
|---|---|---|---|---|---|---|---|---|---|---|---|---|---|---|---|---|---|
| Benchmark | [-] | 17.7 | |||||||||||||||
| CLM4 | [-] | 27.3 | 27.3 | 19.3 | 12.3 | 8.65 | 10.4 | 1.56 | 0.282 | 0.350 | 0.762 | 0.406 | 0.693 | 0.474 | |||
| CLM4.5 | [-] | 27.2 | 27.2 | 19.3 | 12.3 | 8.59 | 10.4 | 1.55 | 0.282 | 0.355 | 0.764 | 0.432 | 0.692 | 0.480 | |||
| CLM5 | [-] | 27.5 | 27.5 | 19.3 | 12.3 | 8.88 | 10.5 | 1.50 | 0.280 | 0.368 | 0.770 | 0.361 | 0.693 | 0.473 |
Download Data |
Period Mean (original grids) [W/m2] |
Model Period Mean (intersection) [W/m2] |
Model Period Mean (complement) [W/m2] |
Benchmark Period Mean (intersection) [W/m2] |
Benchmark Period Mean (complement) [W/m2] |
Bias [W/m2] |
RMSE [W/m2] |
Phase Shift [months] |
Bias Score [1] |
RMSE Score [1] |
Seasonal Cycle Score [1] |
Spatial Distribution Score [1] |
Interannual Variability Score [1] |
Overall Score [1] |
|||
|---|---|---|---|---|---|---|---|---|---|---|---|---|---|---|---|---|---|
| Benchmark | [-] | 28.1 | |||||||||||||||
| CLM4 | [-] | 23.7 | 23.6 | 28.2 | 21.3 | -4.55 | 13.2 | 0.391 | 0.752 | 0.591 | 0.962 | 0.962 | 0.675 | 0.755 | |||
| CLM4.5 | [-] | 25.9 | 25.8 | 28.2 | 21.3 | -2.38 | 12.9 | 0.335 | 0.775 | 0.591 | 0.974 | 0.984 | 0.684 | 0.766 | |||
| CLM5 | [-] | 25.2 | 25.1 | 28.2 | 21.3 | -3.04 | 11.8 | 0.270 | 0.789 | 0.621 | 0.982 | 0.977 | 0.695 | 0.781 |
Download Data |
Period Mean (original grids) [W/m2] |
Model Period Mean (intersection) [W/m2] |
Model Period Mean (complement) [W/m2] |
Benchmark Period Mean (intersection) [W/m2] |
Benchmark Period Mean (complement) [W/m2] |
Bias [W/m2] |
RMSE [W/m2] |
Phase Shift [months] |
Bias Score [1] |
RMSE Score [1] |
Seasonal Cycle Score [1] |
Spatial Distribution Score [1] |
Interannual Variability Score [1] |
Overall Score [1] |
|||
|---|---|---|---|---|---|---|---|---|---|---|---|---|---|---|---|---|---|
| Benchmark | [-] | 35.8 | |||||||||||||||
| CLM4 | [-] | 36.0 | 35.9 | 36.5 | 15.2 | -1.18 | 11.1 | 0.965 | 0.703 | 0.533 | 0.878 | 0.961 | 0.670 | 0.713 | |||
| CLM4.5 | [-] | 36.8 | 36.8 | 36.5 | 15.2 | -0.454 | 10.8 | 0.911 | 0.709 | 0.536 | 0.887 | 0.959 | 0.677 | 0.717 | |||
| CLM5 | [-] | 35.1 | 35.1 | 36.5 | 15.2 | -2.09 | 11.0 | 0.920 | 0.688 | 0.543 | 0.883 | 0.887 | 0.684 | 0.705 |
Download Data |
Period Mean (original grids) [W/m2] |
Model Period Mean (intersection) [W/m2] |
Model Period Mean (complement) [W/m2] |
Benchmark Period Mean (intersection) [W/m2] |
Benchmark Period Mean (complement) [W/m2] |
Bias [W/m2] |
RMSE [W/m2] |
Phase Shift [months] |
Bias Score [1] |
RMSE Score [1] |
Seasonal Cycle Score [1] |
Spatial Distribution Score [1] |
Interannual Variability Score [1] |
Overall Score [1] |
|||
|---|---|---|---|---|---|---|---|---|---|---|---|---|---|---|---|---|---|
| Benchmark | [-] | 29.2 | |||||||||||||||
| CLM4 | [-] | 34.1 | 34.0 | 30.4 | 12.7 | 3.10 | 9.80 | 1.04 | 0.546 | 0.399 | 0.875 | 0.914 | 0.731 | 0.644 | |||
| CLM4.5 | [-] | 33.7 | 33.6 | 30.4 | 12.7 | 2.73 | 9.84 | 1.07 | 0.530 | 0.403 | 0.870 | 0.900 | 0.711 | 0.636 | |||
| CLM5 | [-] | 33.2 | 33.2 | 30.4 | 12.7 | 2.27 | 9.43 | 1.13 | 0.551 | 0.431 | 0.866 | 0.800 | 0.671 | 0.625 |
Download Data |
Period Mean (original grids) [W/m2] |
Model Period Mean (intersection) [W/m2] |
Model Period Mean (complement) [W/m2] |
Benchmark Period Mean (intersection) [W/m2] |
Benchmark Period Mean (complement) [W/m2] |
Bias [W/m2] |
RMSE [W/m2] |
Phase Shift [months] |
Bias Score [1] |
RMSE Score [1] |
Seasonal Cycle Score [1] |
Spatial Distribution Score [1] |
Interannual Variability Score [1] |
Overall Score [1] |
|||
|---|---|---|---|---|---|---|---|---|---|---|---|---|---|---|---|---|---|
| Benchmark | [-] | 36.1 | |||||||||||||||
| CLM4 | [-] | 36.7 | 36.5 | 36.1 | 36.1 | 0.559 | 17.4 | 0.155 | 0.880 | 0.703 | 0.989 | 0.827 | 0.766 | 0.811 | |||
| CLM4.5 | [-] | 34.1 | 33.9 | 36.1 | 36.1 | -1.71 | 19.3 | 0.197 | 0.878 | 0.681 | 0.987 | 0.912 | 0.719 | 0.810 | |||
| CLM5 | [-] | 31.4 | 31.3 | 36.1 | 36.1 | -4.28 | 20.1 | 0.202 | 0.869 | 0.678 | 0.986 | 0.863 | 0.703 | 0.796 |
Download Data |
Period Mean (original grids) [W/m2] |
Model Period Mean (intersection) [W/m2] |
Model Period Mean (complement) [W/m2] |
Benchmark Period Mean (intersection) [W/m2] |
Benchmark Period Mean (complement) [W/m2] |
Bias [W/m2] |
RMSE [W/m2] |
Phase Shift [months] |
Bias Score [1] |
RMSE Score [1] |
Seasonal Cycle Score [1] |
Spatial Distribution Score [1] |
Interannual Variability Score [1] |
Overall Score [1] |
|||
|---|---|---|---|---|---|---|---|---|---|---|---|---|---|---|---|---|---|
| Benchmark | [-] | 36.6 | |||||||||||||||
| CLM4 | [-] | 40.7 | 40.8 | 38.5 | 12.8 | 1.26 | 8.64 | 0.678 | 0.642 | 0.569 | 0.936 | 0.848 | 0.655 | 0.703 | |||
| CLM4.5 | [-] | 40.8 | 40.8 | 38.5 | 12.8 | 1.31 | 8.75 | 0.696 | 0.639 | 0.564 | 0.935 | 0.869 | 0.640 | 0.702 | |||
| CLM5 | [-] | 39.4 | 39.4 | 38.5 | 12.8 | 0.0558 | 9.10 | 0.622 | 0.616 | 0.565 | 0.942 | 0.799 | 0.693 | 0.696 |
Download Data |
Period Mean (original grids) [W/m2] |
Model Period Mean (intersection) [W/m2] |
Model Period Mean (complement) [W/m2] |
Benchmark Period Mean (intersection) [W/m2] |
Benchmark Period Mean (complement) [W/m2] |
Bias [W/m2] |
RMSE [W/m2] |
Phase Shift [months] |
Bias Score [1] |
RMSE Score [1] |
Seasonal Cycle Score [1] |
Spatial Distribution Score [1] |
Interannual Variability Score [1] |
Overall Score [1] |
|||
|---|---|---|---|---|---|---|---|---|---|---|---|---|---|---|---|---|---|
| Benchmark | [-] | 19.6 | |||||||||||||||
| CLM4 | [-] | 23.2 | 23.3 | 20.5 | 10.1 | 2.55 | 9.87 | 0.680 | 0.658 | 0.548 | 0.920 | 0.967 | 0.680 | 0.720 | |||
| CLM4.5 | [-] | 22.2 | 22.2 | 20.5 | 10.1 | 1.64 | 9.17 | 0.877 | 0.688 | 0.550 | 0.889 | 0.869 | 0.689 | 0.706 | |||
| CLM5 | [-] | 22.3 | 22.3 | 20.5 | 10.1 | 1.68 | 8.97 | 0.854 | 0.691 | 0.559 | 0.896 | 0.842 | 0.668 | 0.703 |
Download Data |
Period Mean (original grids) [W/m2] |
Model Period Mean (intersection) [W/m2] |
Model Period Mean (complement) [W/m2] |
Benchmark Period Mean (intersection) [W/m2] |
Benchmark Period Mean (complement) [W/m2] |
Bias [W/m2] |
RMSE [W/m2] |
Phase Shift [months] |
Bias Score [1] |
RMSE Score [1] |
Seasonal Cycle Score [1] |
Spatial Distribution Score [1] |
Interannual Variability Score [1] |
Overall Score [1] |
|||
|---|---|---|---|---|---|---|---|---|---|---|---|---|---|---|---|---|---|
| Benchmark | [-] | 24.0 | |||||||||||||||
| CLM4 | [-] | 46.2 | 46.2 | 44.8 | 14.0 | 0.337 | 12.4 | 0.791 | 0.648 | 0.544 | 0.902 | 0.991 | 0.700 | 0.721 | |||
| CLM4.5 | [-] | 45.5 | 45.5 | 44.8 | 14.0 | -0.238 | 12.8 | 0.782 | 0.653 | 0.540 | 0.903 | 0.989 | 0.698 | 0.721 | |||
| CLM5 | [-] | 44.9 | 44.9 | 44.8 | 14.0 | -0.748 | 12.7 | 0.768 | 0.650 | 0.548 | 0.906 | 0.990 | 0.686 | 0.722 |
Download Data |
Period Mean (original grids) [W/m2] |
Model Period Mean (intersection) [W/m2] |
Model Period Mean (complement) [W/m2] |
Benchmark Period Mean (intersection) [W/m2] |
Benchmark Period Mean (complement) [W/m2] |
Bias [W/m2] |
RMSE [W/m2] |
Phase Shift [months] |
Bias Score [1] |
RMSE Score [1] |
Seasonal Cycle Score [1] |
Spatial Distribution Score [1] |
Interannual Variability Score [1] |
Overall Score [1] |
|||
|---|---|---|---|---|---|---|---|---|---|---|---|---|---|---|---|---|---|
| Benchmark | [-] | 72.5 | |||||||||||||||
| CLM4 | [-] | 80.3 | 80.1 | 74.7 | 16.4 | 3.59 | 13.8 | 0.668 | 0.595 | 0.577 | 0.932 | 0.977 | 0.653 | 0.718 | |||
| CLM4.5 | [-] | 79.8 | 79.6 | 74.7 | 16.4 | 3.06 | 13.6 | 0.665 | 0.594 | 0.581 | 0.933 | 0.978 | 0.650 | 0.719 | |||
| CLM5 | [-] | 78.5 | 78.3 | 74.7 | 16.4 | 1.75 | 14.0 | 0.756 | 0.590 | 0.558 | 0.923 | 0.980 | 0.705 | 0.719 |
Download Data |
Period Mean (original grids) [W/m2] |
Model Period Mean (intersection) [W/m2] |
Model Period Mean (complement) [W/m2] |
Benchmark Period Mean (intersection) [W/m2] |
Benchmark Period Mean (complement) [W/m2] |
Bias [W/m2] |
RMSE [W/m2] |
Phase Shift [months] |
Bias Score [1] |
RMSE Score [1] |
Seasonal Cycle Score [1] |
Spatial Distribution Score [1] |
Interannual Variability Score [1] |
Overall Score [1] |
|||
|---|---|---|---|---|---|---|---|---|---|---|---|---|---|---|---|---|---|
| Benchmark | [-] | 46.1 | |||||||||||||||
| CLM4 | [-] | 40.4 | 40.4 | 46.3 | 43.2 | -5.17 | 22.8 | 0.197 | 0.850 | 0.669 | 0.985 | 0.934 | 0.727 | 0.806 | |||
| CLM4.5 | [-] | 37.3 | 37.3 | 46.3 | 43.2 | -7.80 | 24.6 | 0.180 | 0.833 | 0.650 | 0.986 | 0.936 | 0.681 | 0.789 | |||
| CLM5 | [-] | 37.3 | 37.3 | 46.3 | 43.2 | -7.82 | 24.1 | 0.184 | 0.830 | 0.656 | 0.986 | 0.956 | 0.672 | 0.793 |
Download Data |
Period Mean (original grids) [W/m2] |
Model Period Mean (intersection) [W/m2] |
Model Period Mean (complement) [W/m2] |
Benchmark Period Mean (intersection) [W/m2] |
Benchmark Period Mean (complement) [W/m2] |
Bias [W/m2] |
RMSE [W/m2] |
Phase Shift [months] |
Bias Score [1] |
RMSE Score [1] |
Seasonal Cycle Score [1] |
Spatial Distribution Score [1] |
Interannual Variability Score [1] |
Overall Score [1] |
|||
|---|---|---|---|---|---|---|---|---|---|---|---|---|---|---|---|---|---|
| Benchmark | [-] | 26.3 | |||||||||||||||
| CLM4 | [-] | 34.1 | 34.1 | 28.9 | 13.2 | 4.42 | 10.3 | 0.779 | 0.449 | 0.467 | 0.901 | 0.763 | 0.699 | 0.624 | |||
| CLM4.5 | [-] | 34.4 | 34.3 | 28.9 | 13.2 | 4.92 | 10.7 | 0.802 | 0.446 | 0.458 | 0.900 | 0.692 | 0.685 | 0.606 | |||
| CLM5 | [-] | 33.9 | 33.9 | 28.9 | 13.2 | 4.55 | 10.7 | 0.760 | 0.435 | 0.490 | 0.907 | 0.620 | 0.695 | 0.606 |
Download Data |
Period Mean (original grids) [W/m2] |
Model Period Mean (intersection) [W/m2] |
Model Period Mean (complement) [W/m2] |
Benchmark Period Mean (intersection) [W/m2] |
Benchmark Period Mean (complement) [W/m2] |
Bias [W/m2] |
RMSE [W/m2] |
Phase Shift [months] |
Bias Score [1] |
RMSE Score [1] |
Seasonal Cycle Score [1] |
Spatial Distribution Score [1] |
Interannual Variability Score [1] |
Overall Score [1] |
|||
|---|---|---|---|---|---|---|---|---|---|---|---|---|---|---|---|---|---|
| Benchmark | [-] | 26.9 | |||||||||||||||
| CLM4 | [-] | 25.9 | 25.7 | 27.6 | 12.3 | -2.01 | 8.83 | 0.764 | 0.630 | 0.551 | 0.903 | 0.721 | 0.658 | 0.669 | |||
| CLM4.5 | [-] | 26.7 | 26.6 | 27.6 | 12.3 | -1.13 | 8.43 | 1.00 | 0.674 | 0.541 | 0.857 | 0.816 | 0.708 | 0.690 | |||
| CLM5 | [-] | 27.6 | 27.5 | 27.6 | 12.3 | -0.305 | 8.02 | 1.11 | 0.718 | 0.551 | 0.839 | 0.834 | 0.673 | 0.694 |
Download Data |
Period Mean (original grids) [W/m2] |
Model Period Mean (intersection) [W/m2] |
Model Period Mean (complement) [W/m2] |
Benchmark Period Mean (intersection) [W/m2] |
Benchmark Period Mean (complement) [W/m2] |
Bias [W/m2] |
RMSE [W/m2] |
Phase Shift [months] |
Bias Score [1] |
RMSE Score [1] |
Seasonal Cycle Score [1] |
Spatial Distribution Score [1] |
Interannual Variability Score [1] |
Overall Score [1] |
|||
|---|---|---|---|---|---|---|---|---|---|---|---|---|---|---|---|---|---|
| Benchmark | [-] | 26.3 | |||||||||||||||
| CLM4 | [-] | 23.7 | 23.8 | 26.9 | 10.9 | -3.25 | 13.6 | 0.678 | 0.700 | 0.546 | 0.908 | 0.974 | 0.615 | 0.715 | |||
| CLM4.5 | [-] | 23.0 | 23.1 | 26.9 | 10.9 | -3.86 | 13.6 | 0.571 | 0.705 | 0.544 | 0.936 | 0.975 | 0.588 | 0.716 | |||
| CLM5 | [-] | 23.6 | 23.7 | 26.9 | 10.9 | -3.27 | 12.6 | 0.410 | 0.720 | 0.564 | 0.955 | 0.970 | 0.611 | 0.731 |
Download Data |
Period Mean (original grids) [W/m2] |
Model Period Mean (intersection) [W/m2] |
Model Period Mean (complement) [W/m2] |
Benchmark Period Mean (intersection) [W/m2] |
Benchmark Period Mean (complement) [W/m2] |
Bias [W/m2] |
RMSE [W/m2] |
Phase Shift [months] |
Bias Score [1] |
RMSE Score [1] |
Seasonal Cycle Score [1] |
Spatial Distribution Score [1] |
Interannual Variability Score [1] |
Overall Score [1] |
|||
|---|---|---|---|---|---|---|---|---|---|---|---|---|---|---|---|---|---|
| Benchmark | [-] | 38.3 | |||||||||||||||
| CLM4 | [-] | 36.2 | 36.1 | 38.7 | 12.8 | -2.97 | 10.4 | 1.04 | 0.714 | 0.560 | 0.834 | 0.994 | 0.661 | 0.720 | |||
| CLM4.5 | [-] | 37.2 | 37.1 | 38.7 | 12.8 | -1.96 | 9.27 | 0.892 | 0.748 | 0.591 | 0.866 | 0.993 | 0.727 | 0.753 | |||
| CLM5 | [-] | 34.6 | 34.6 | 38.7 | 12.8 | -4.44 | 10.2 | 1.05 | 0.683 | 0.577 | 0.846 | 0.967 | 0.725 | 0.729 |
Download Data |
Period Mean (original grids) [W/m2] |
Model Period Mean (intersection) [W/m2] |
Model Period Mean (complement) [W/m2] |
Benchmark Period Mean (intersection) [W/m2] |
Benchmark Period Mean (complement) [W/m2] |
Bias [W/m2] |
RMSE [W/m2] |
Phase Shift [months] |
Bias Score [1] |
RMSE Score [1] |
Seasonal Cycle Score [1] |
Spatial Distribution Score [1] |
Interannual Variability Score [1] |
Overall Score [1] |
|||
|---|---|---|---|---|---|---|---|---|---|---|---|---|---|---|---|---|---|
| Benchmark | [-] | 27.6 | |||||||||||||||
| CLM4 | [-] | 27.1 | 27.1 | 28.0 | 11.7 | -0.712 | 5.13 | 1.20 | 0.556 | 0.435 | 0.849 | 0.767 | 0.656 | 0.616 | |||
| CLM4.5 | [-] | 26.9 | 26.9 | 28.0 | 11.7 | -0.900 | 5.32 | 1.19 | 0.530 | 0.434 | 0.851 | 0.785 | 0.653 | 0.615 | |||
| CLM5 | [-] | 27.1 | 27.1 | 28.0 | 11.7 | -0.726 | 5.09 | 1.15 | 0.546 | 0.448 | 0.858 | 0.746 | 0.627 | 0.612 |
Download Data |
Period Mean (original grids) [W/m2] |
Model Period Mean (intersection) [W/m2] |
Model Period Mean (complement) [W/m2] |
Benchmark Period Mean (intersection) [W/m2] |
Benchmark Period Mean (complement) [W/m2] |
Bias [W/m2] |
RMSE [W/m2] |
Phase Shift [months] |
Bias Score [1] |
RMSE Score [1] |
Seasonal Cycle Score [1] |
Spatial Distribution Score [1] |
Interannual Variability Score [1] |
Overall Score [1] |
|||
|---|---|---|---|---|---|---|---|---|---|---|---|---|---|---|---|---|---|
| Benchmark | [-] | 31.2 | |||||||||||||||
| CLM4 | [-] | 30.8 | 30.9 | 31.8 | 11.7 | -0.945 | 7.13 | 1.24 | 0.622 | 0.469 | 0.837 | 0.879 | 0.795 | 0.679 | |||
| CLM4.5 | [-] | 31.0 | 31.1 | 31.8 | 11.7 | -0.766 | 7.00 | 1.24 | 0.643 | 0.465 | 0.834 | 0.865 | 0.800 | 0.679 | |||
| CLM5 | [-] | 31.6 | 31.6 | 31.8 | 11.7 | -0.285 | 6.44 | 1.08 | 0.672 | 0.494 | 0.855 | 0.802 | 0.725 | 0.674 |
Download Data |
Period Mean (original grids) [W/m2] |
Model Period Mean (intersection) [W/m2] |
Model Period Mean (complement) [W/m2] |
Benchmark Period Mean (intersection) [W/m2] |
Benchmark Period Mean (complement) [W/m2] |
Bias [W/m2] |
RMSE [W/m2] |
Phase Shift [months] |
Bias Score [1] |
RMSE Score [1] |
Seasonal Cycle Score [1] |
Spatial Distribution Score [1] |
Interannual Variability Score [1] |
Overall Score [1] |
|||
|---|---|---|---|---|---|---|---|---|---|---|---|---|---|---|---|---|---|
| Benchmark | [-] | 30.1 | |||||||||||||||
| CLM4 | [-] | 35.2 | 35.2 | 32.0 | 13.9 | 2.67 | 10.1 | 0.784 | 0.562 | 0.525 | 0.909 | 0.977 | 0.672 | 0.695 | |||
| CLM4.5 | [-] | 34.6 | 34.6 | 32.0 | 13.9 | 2.09 | 9.81 | 0.804 | 0.563 | 0.533 | 0.905 | 0.976 | 0.682 | 0.699 | |||
| CLM5 | [-] | 33.2 | 33.2 | 32.0 | 13.9 | 0.808 | 9.75 | 0.826 | 0.568 | 0.532 | 0.908 | 0.961 | 0.697 | 0.700 |
Temporally integrated period mean