
b.e15.B1850.f09_g16.pi_control.39_10_19
and
b.e15.B1850.f09_g16.pi_control.36_10_19
Set 1 Description: Line plots of annual trends in energy balance, soil water/ice and temperature, runoff, snow water/ice, photosynthesis
Lookup Table: Set 1 Variable Definition
| Trend | Difference | Anomaly | |||
|---|---|---|---|---|---|
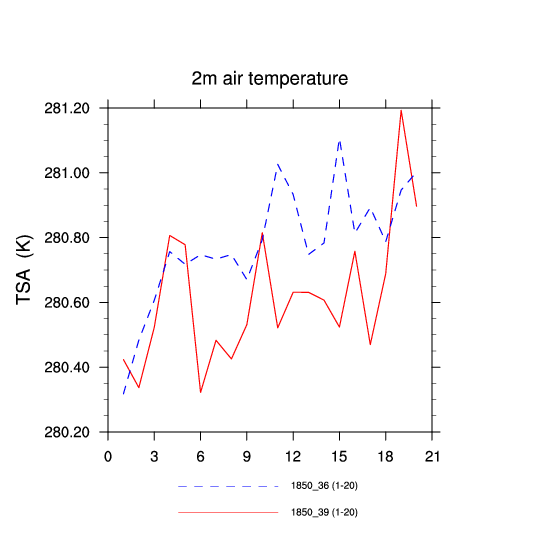
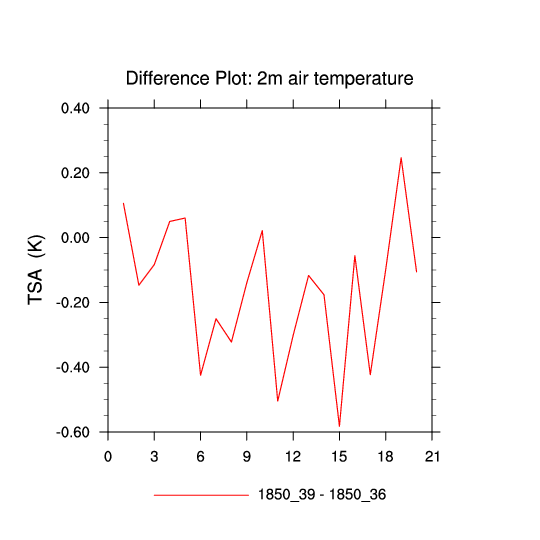
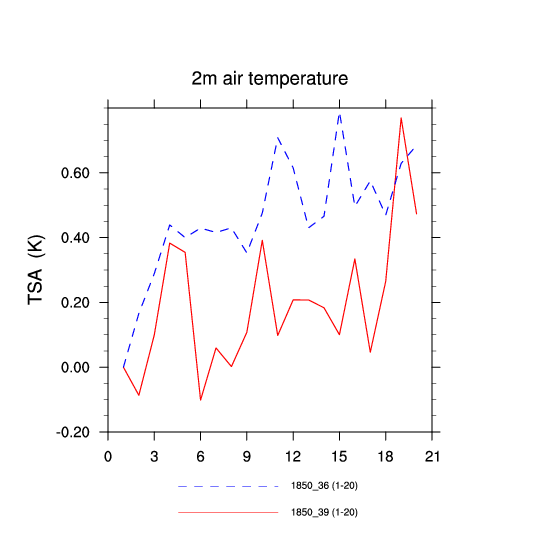
| 2m air temperature (TSA) | TrendPlot | DifferencePlot | AnomalyPlot | ||
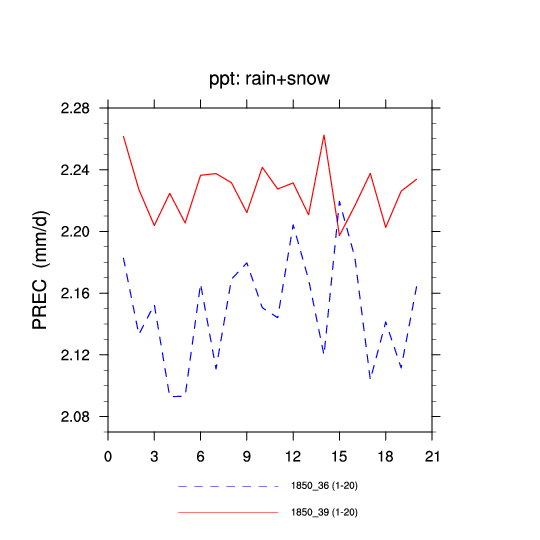
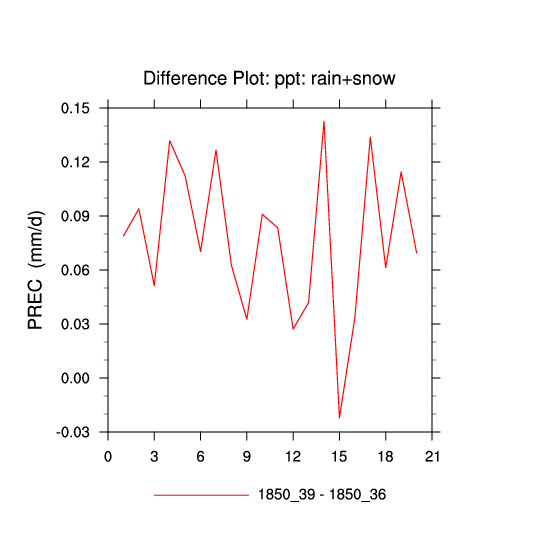
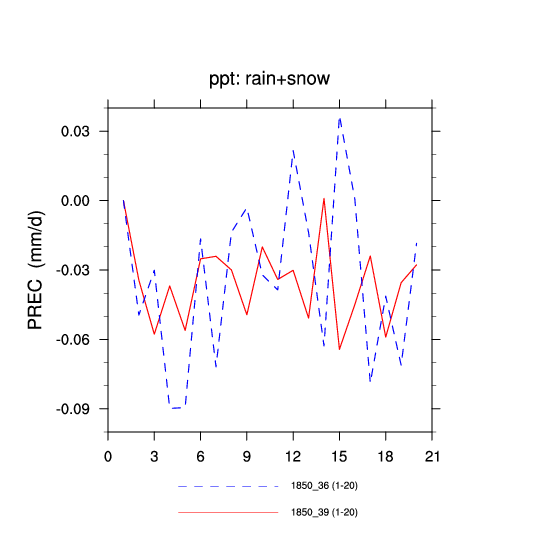
| ppt: rain+snow (PREC) | TrendPlot | DifferencePlot | AnomalyPlot | ||
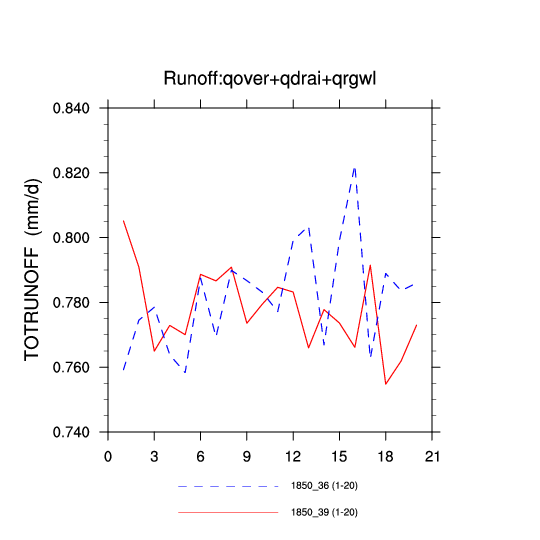
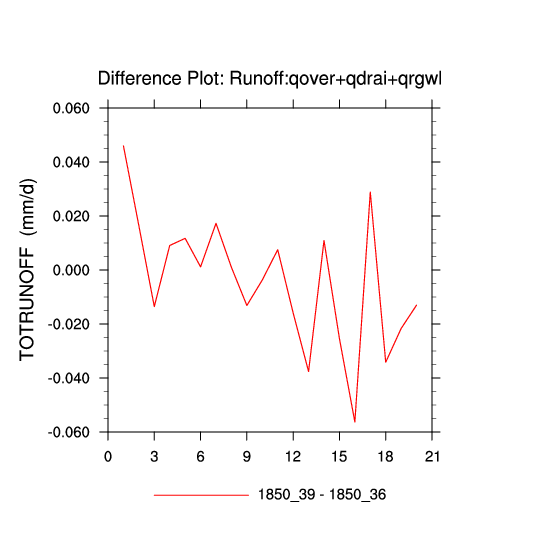
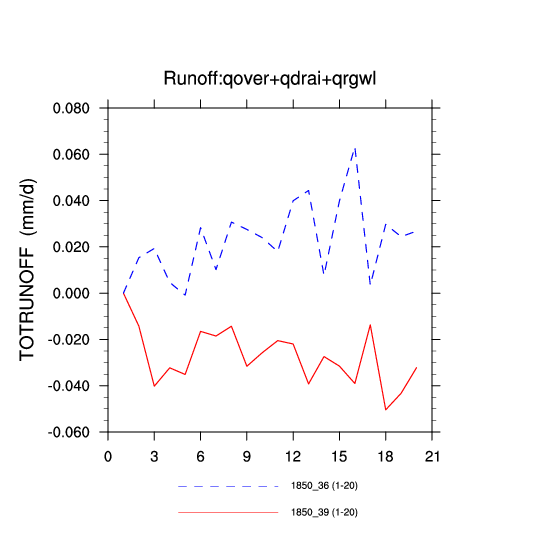
| Runoff:qover+qdrai+qrgwl (TOTRUNOFF) | TrendPlot | DifferencePlot | AnomalyPlot | ||
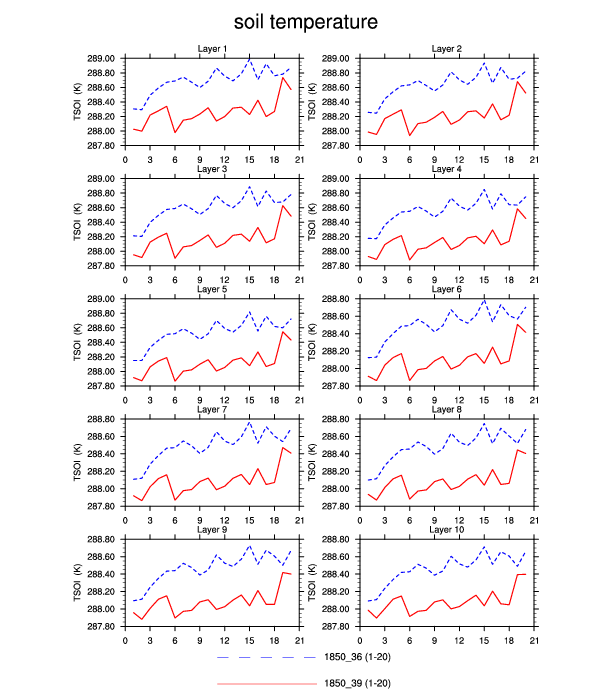
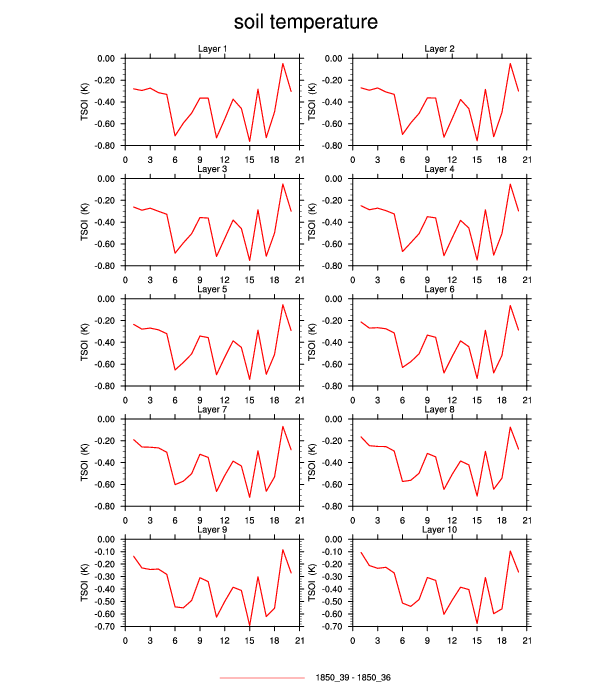
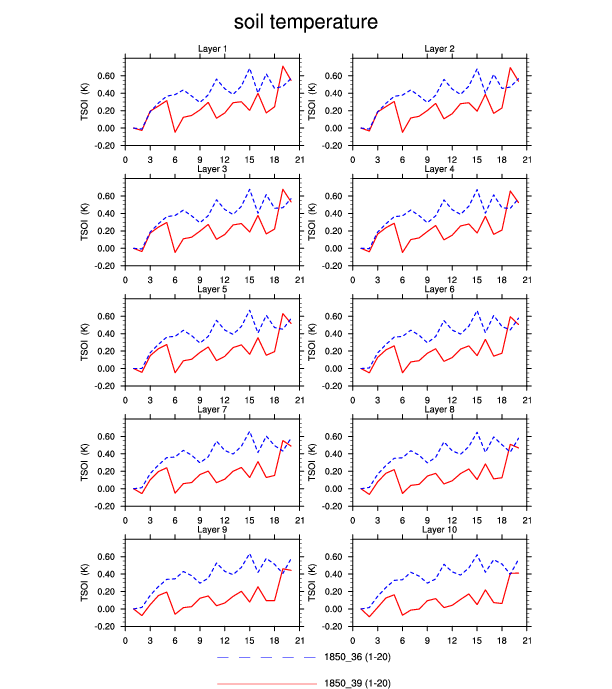
| soil temperature: layers 1,5,10 (TSOI) | TrendPlot | DifferencePlot | AnomalyPlot | ||
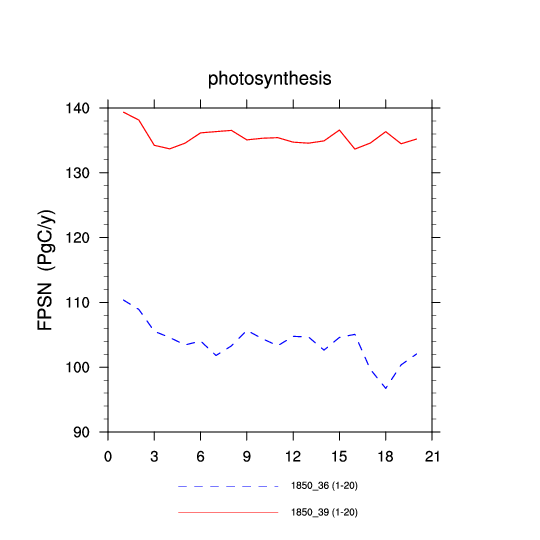
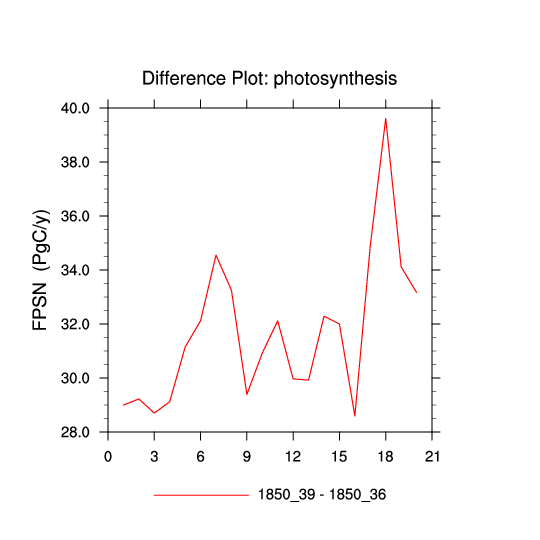
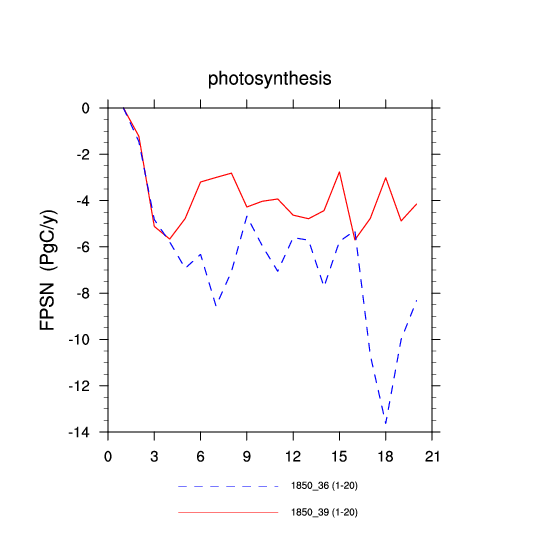
| photosynthesis (FPSN) | TrendPlot | DifferencePlot | AnomalyPlot | ||
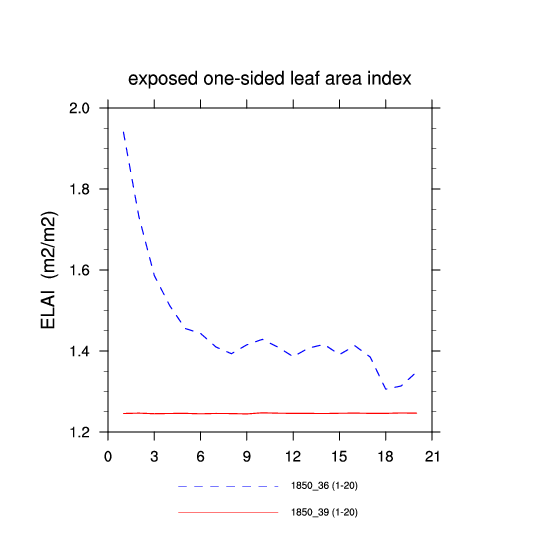
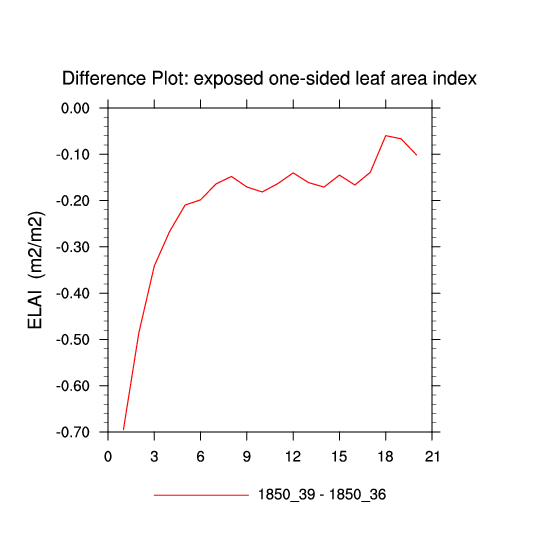
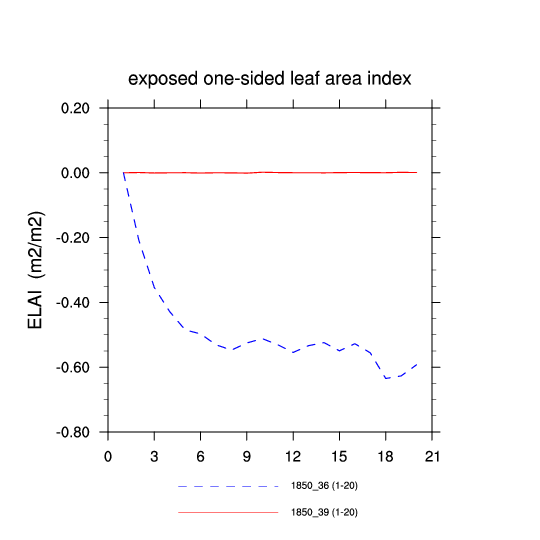
| exposed one-sided leaf area index (ELAI) | TrendPlot | DifferencePlot | AnomalyPlot | ||
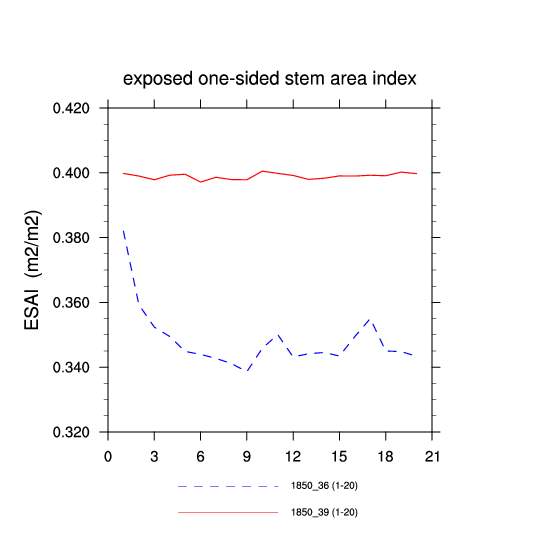
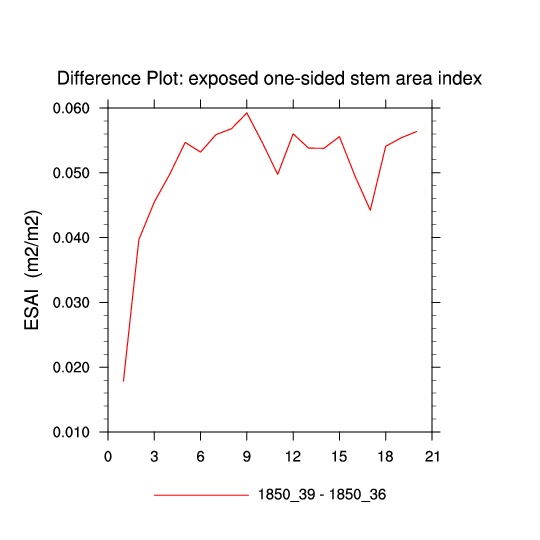
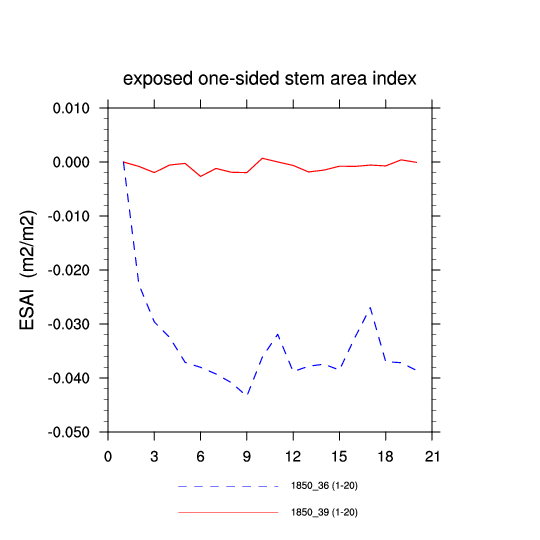
| exposed one-sided stem area index (ESAI) | TrendPlot | DifferencePlot | AnomalyPlot | ||
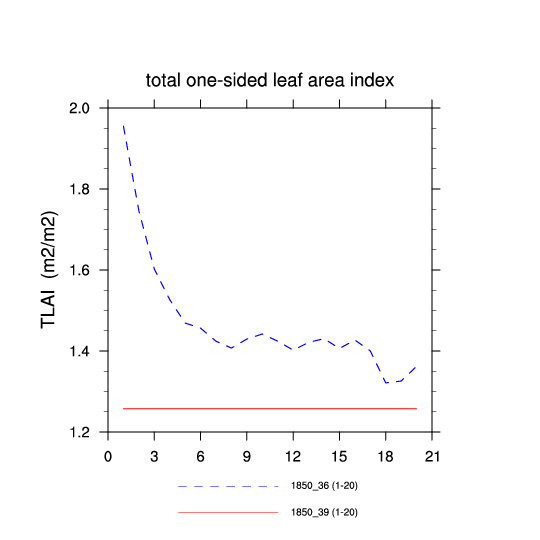
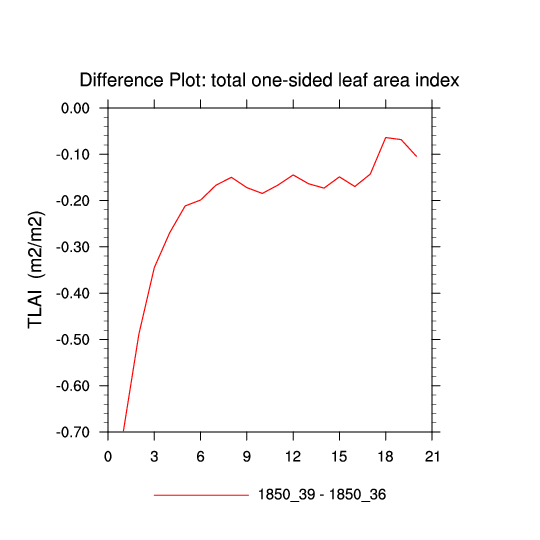
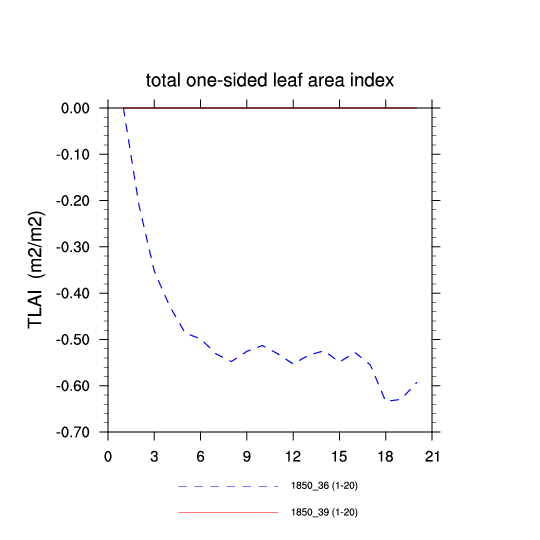
| total one-sided leaf area index (TLAI) | TrendPlot | DifferencePlot | AnomalyPlot | ||
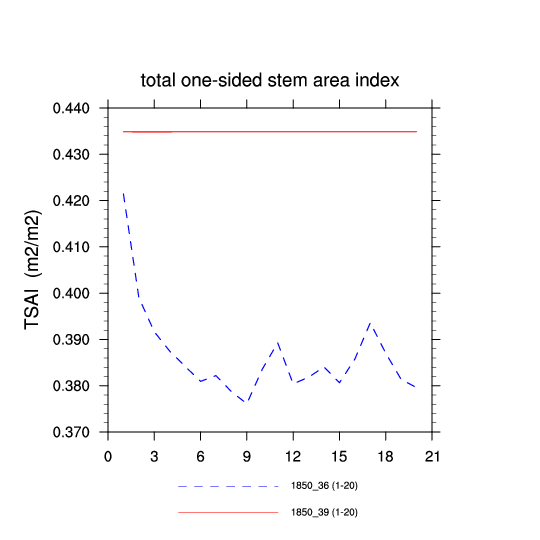
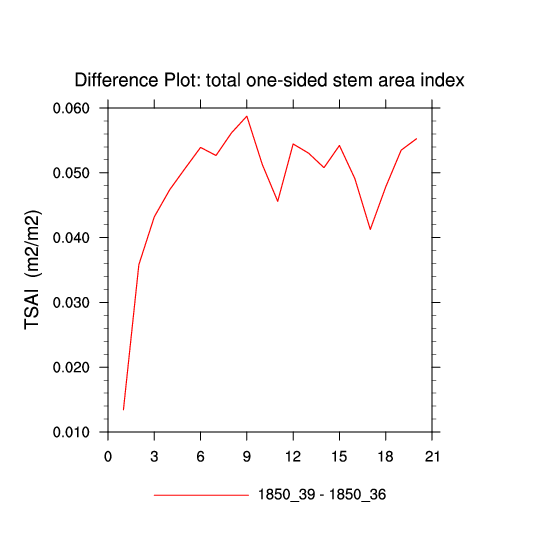
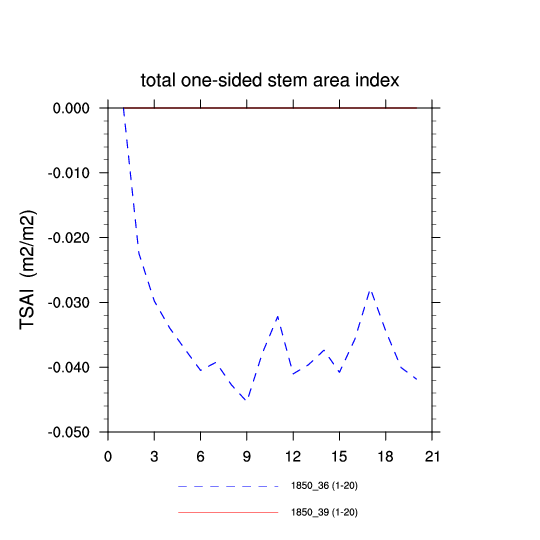
| total one-sided stem area index (TSAI) | TrendPlot | DifferencePlot | AnomalyPlot | ||
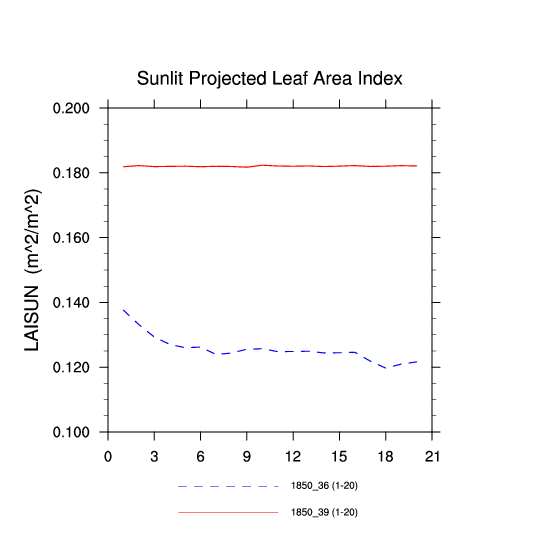
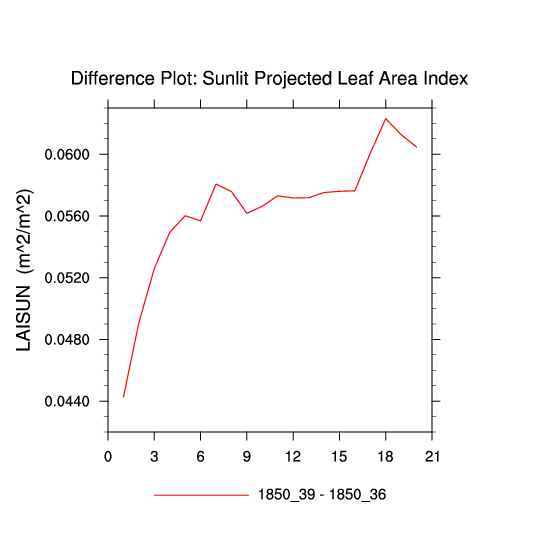
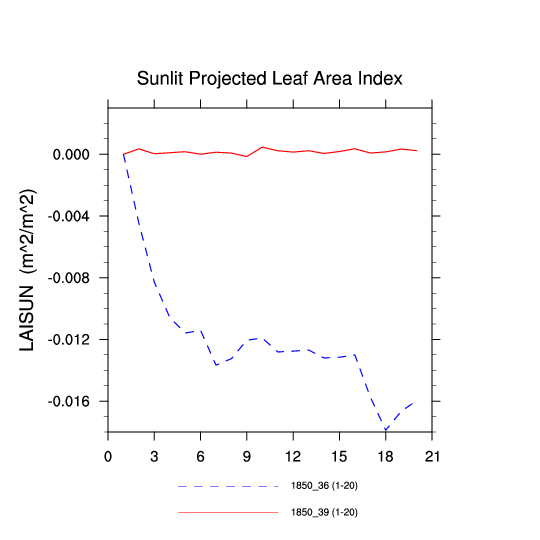
| Sunlit Projected Leaf Area Index (LAISUN) | TrendPlot | DifferencePlot | AnomalyPlot | ||
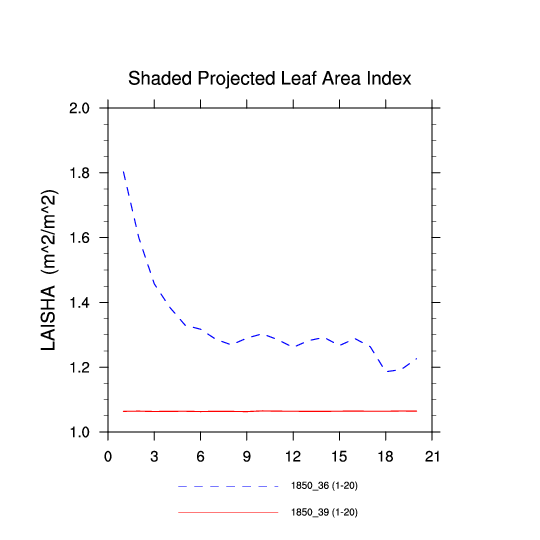
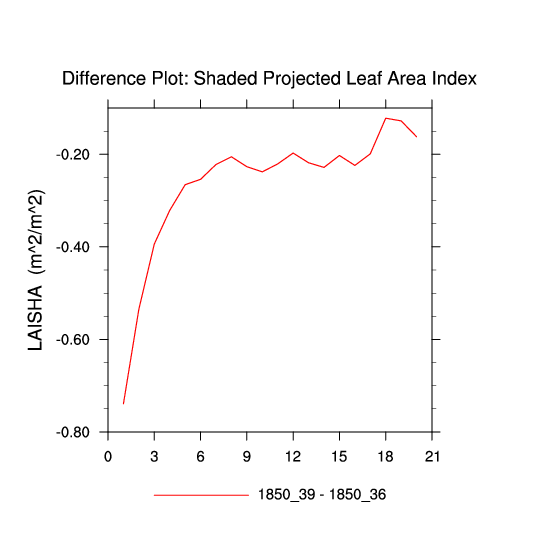
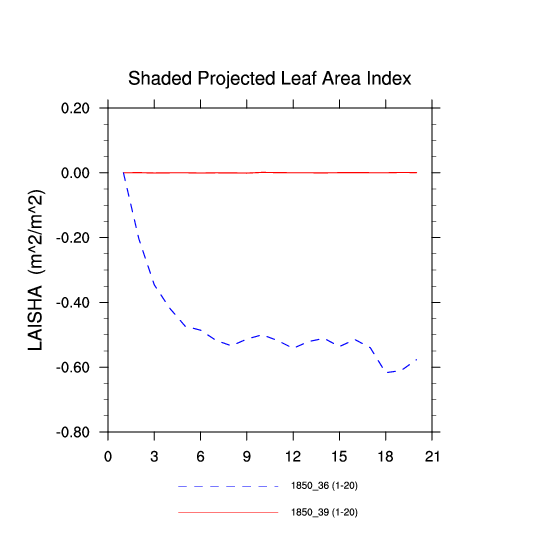
| Shaded Projected Leaf Area Index (LAISHA) | TrendPlot | DifferencePlot | AnomalyPlot | ||
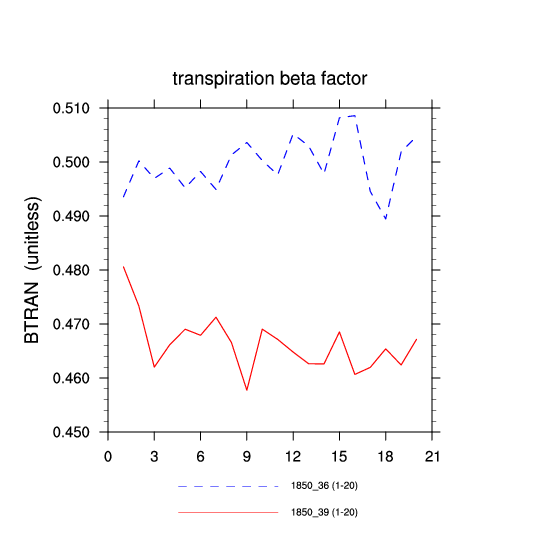
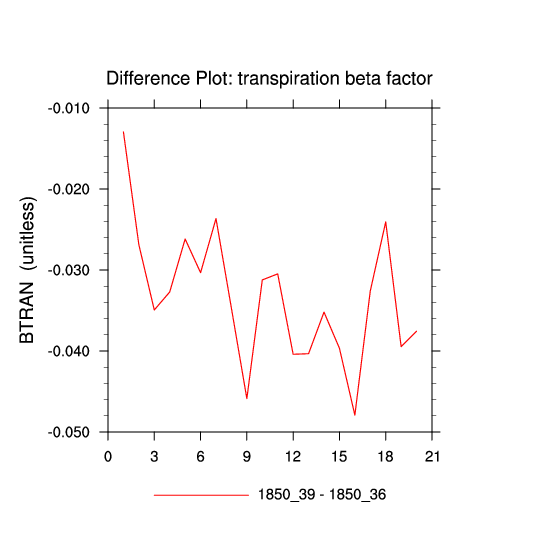
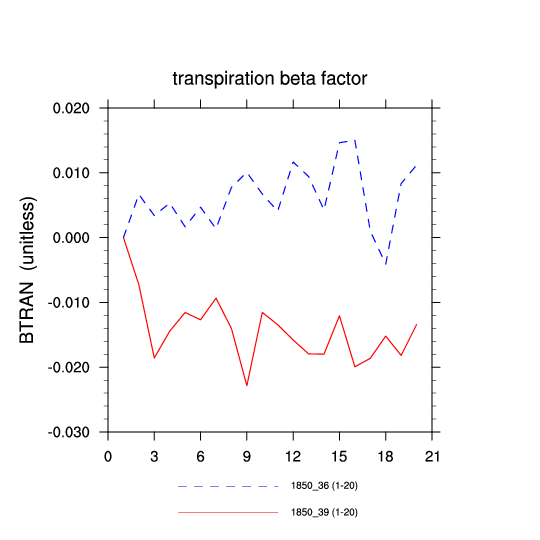
| transpiration beta factor (BTRAN) | TrendPlot | DifferencePlot | AnomalyPlot | ||
| infiltration (QINFL) | TrendPlot | DifferencePlot | AnomalyPlot | ||
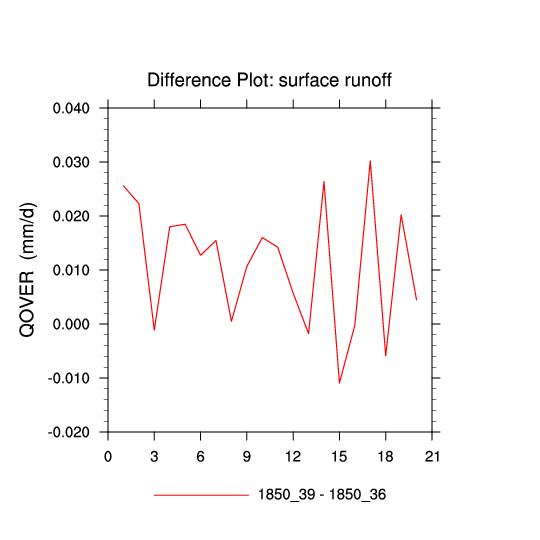
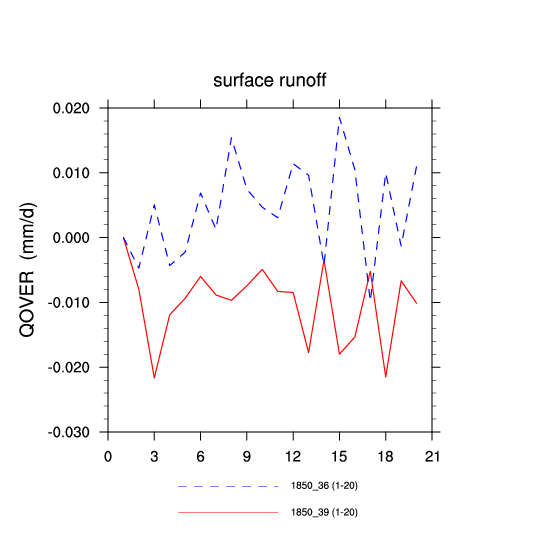
| surface runoff (QOVER) | TrendPlot | DifferencePlot | AnomalyPlot | ||
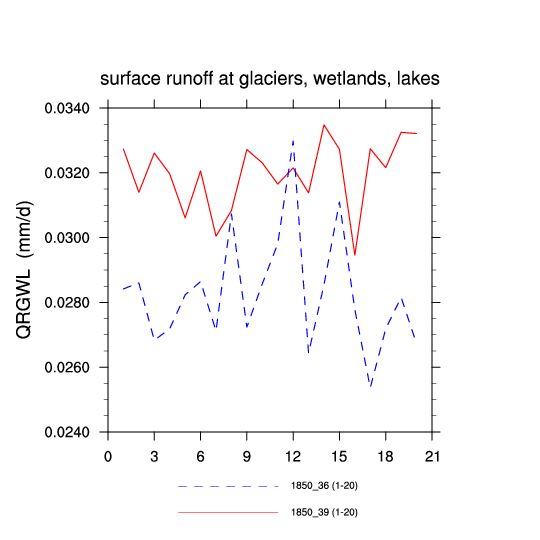
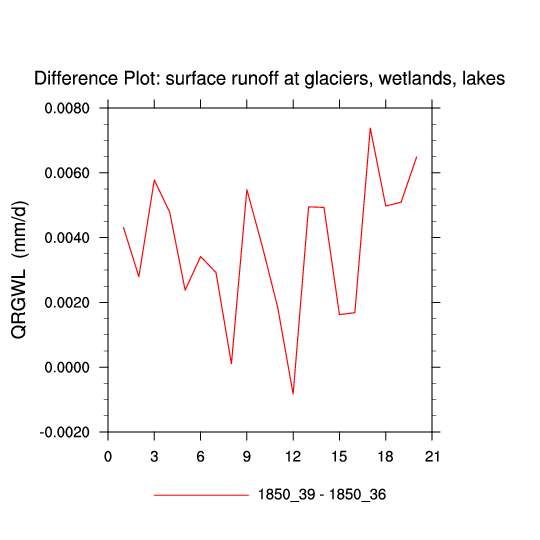
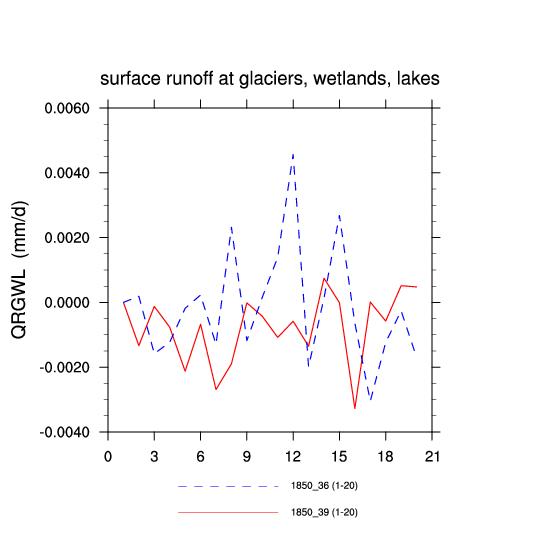
| surface runoff at glaciers, wetlands, lakes (QRGWL) | TrendPlot | DifferencePlot | AnomalyPlot | ||
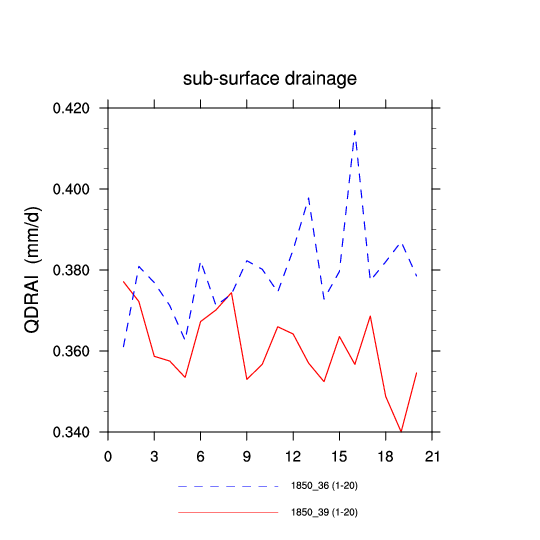
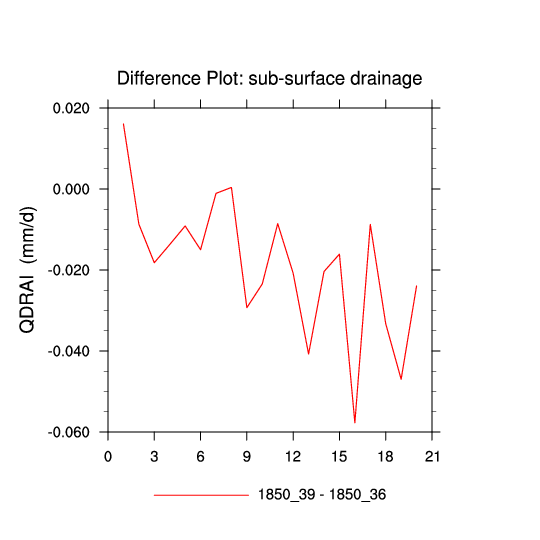
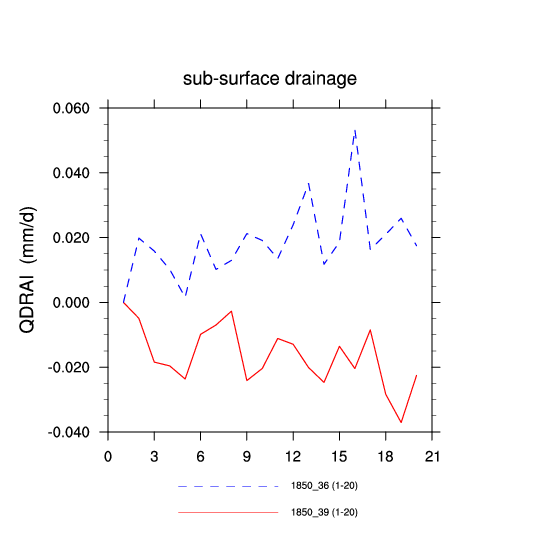
| sub-surface drainage (QDRAI) | TrendPlot | DifferencePlot | AnomalyPlot | ||
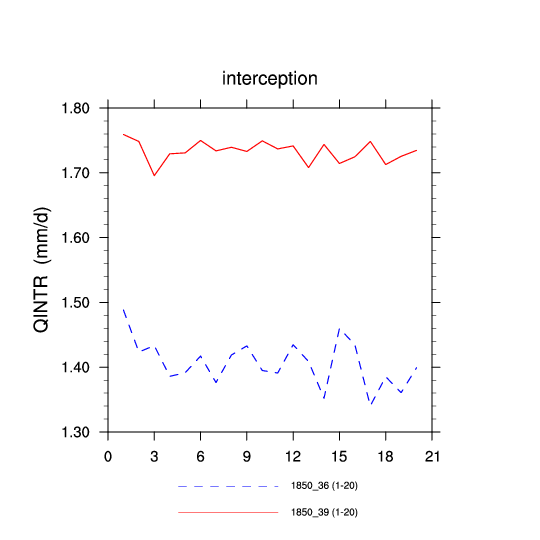
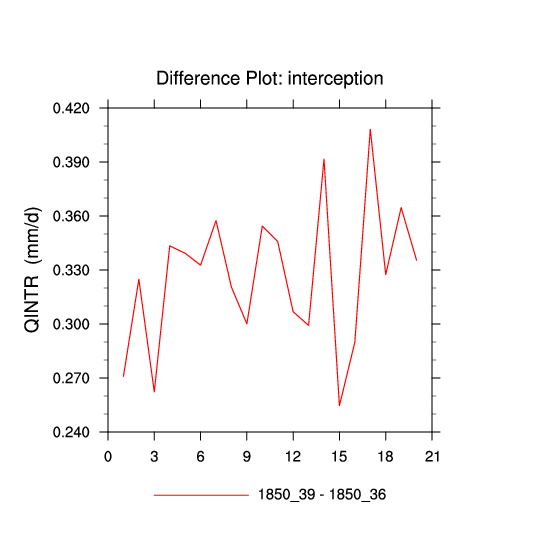
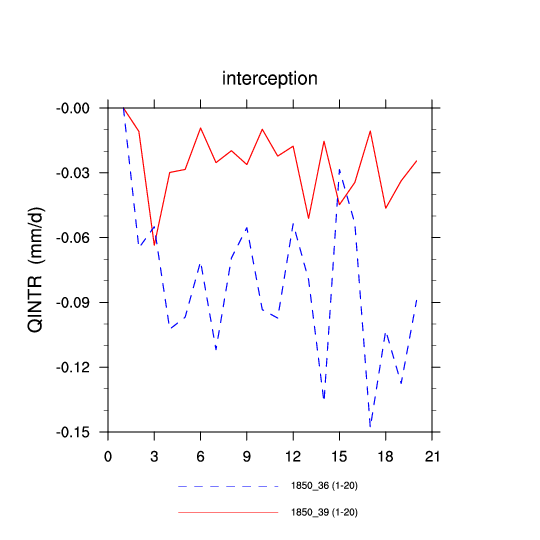
| interception (QINTR) | TrendPlot | DifferencePlot | AnomalyPlot | ||
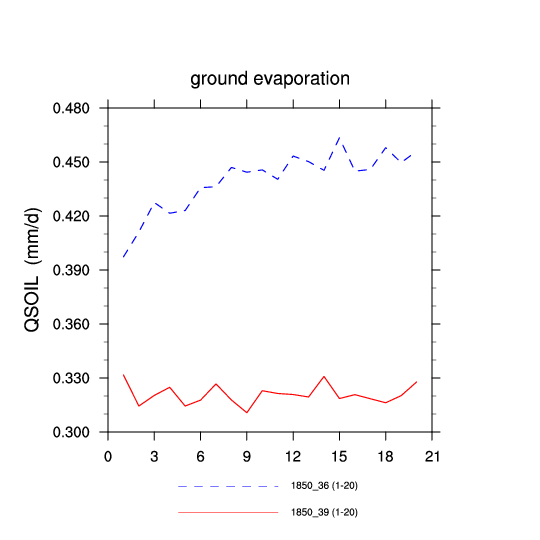
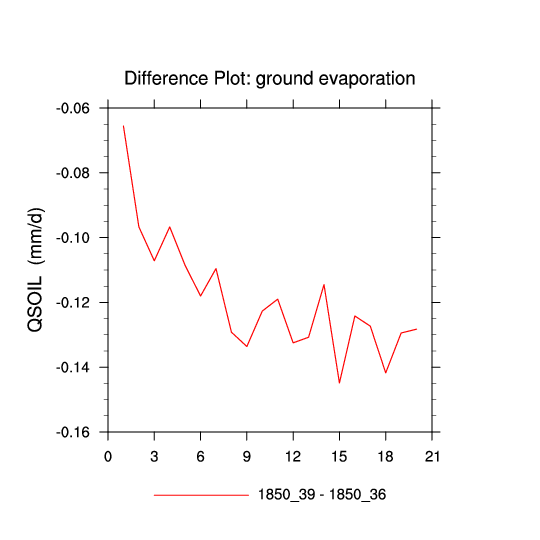
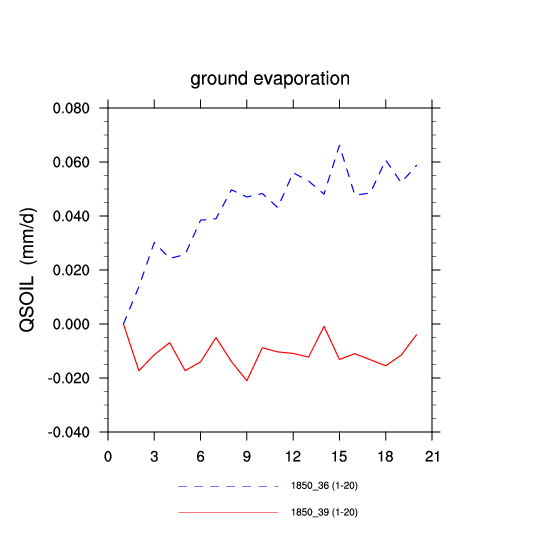
| ground evaporation (QSOIL) | TrendPlot | DifferencePlot | AnomalyPlot | ||
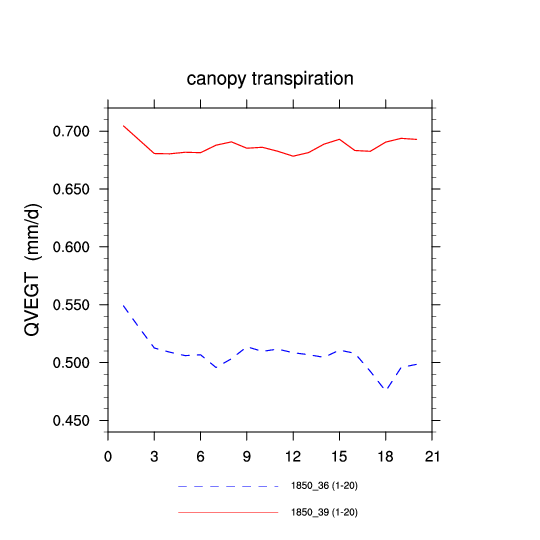
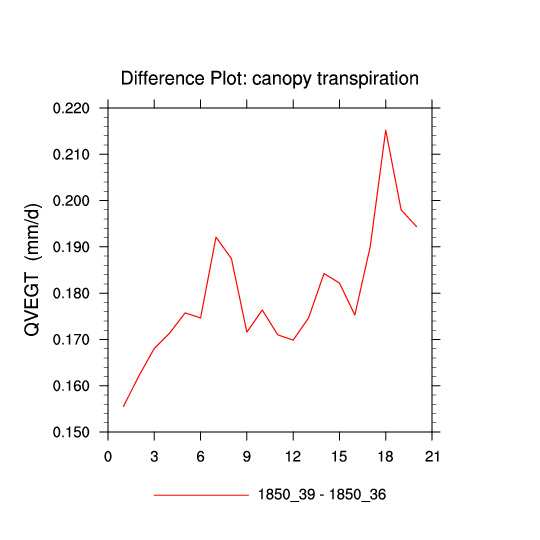
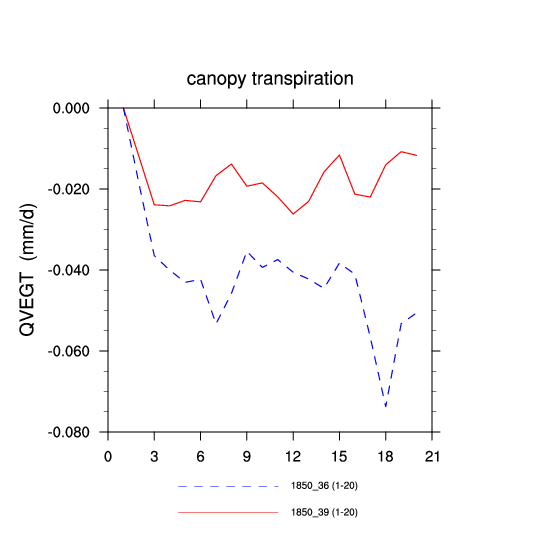
| canopy transpiration (QVEGT) | TrendPlot | DifferencePlot | AnomalyPlot | ||
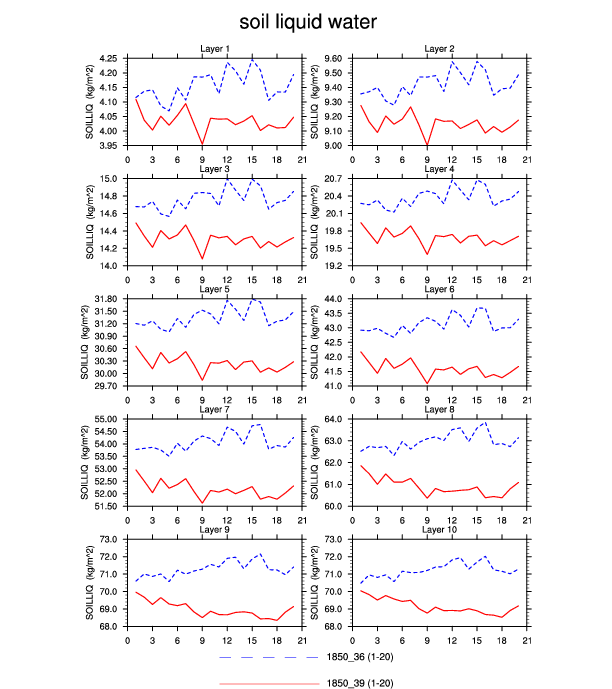
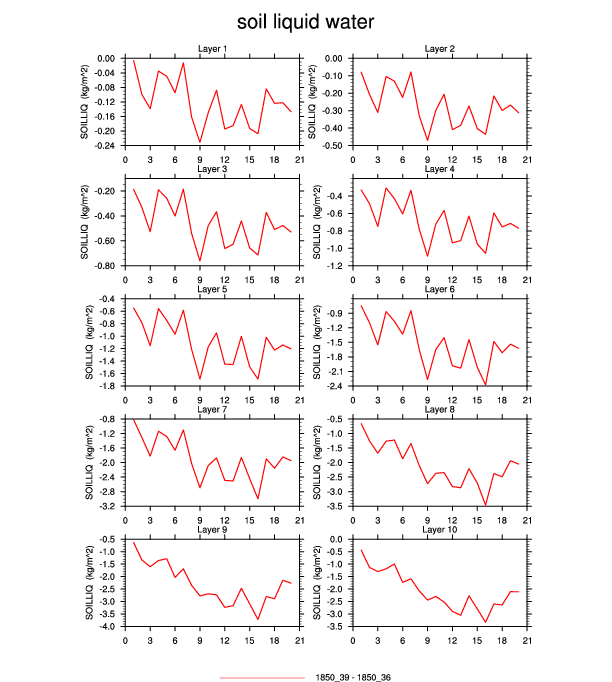
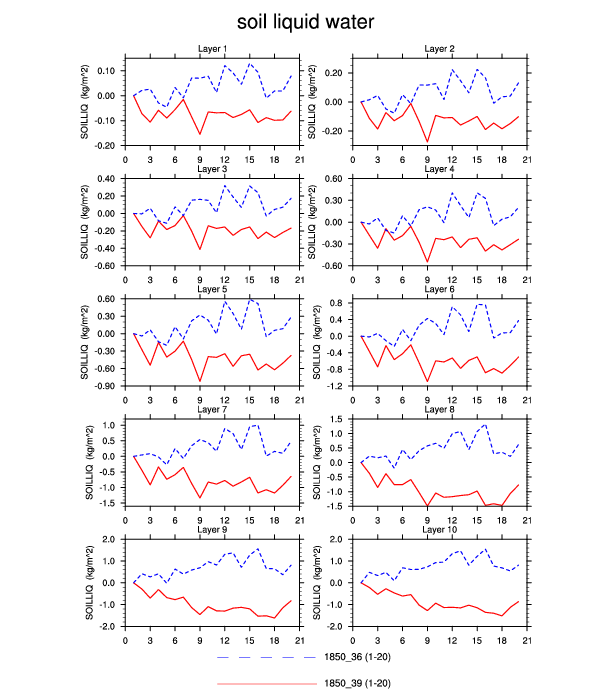
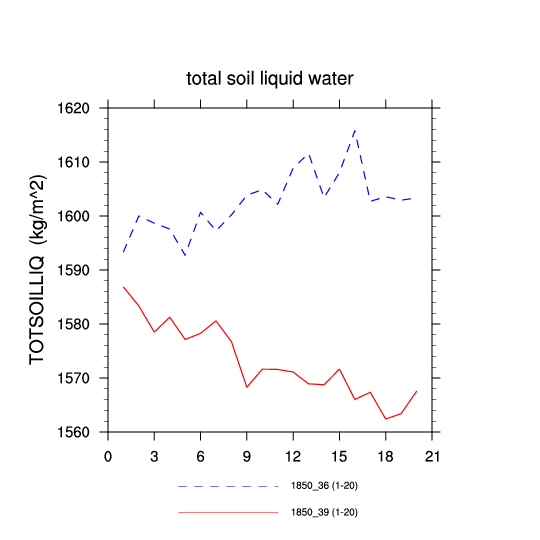
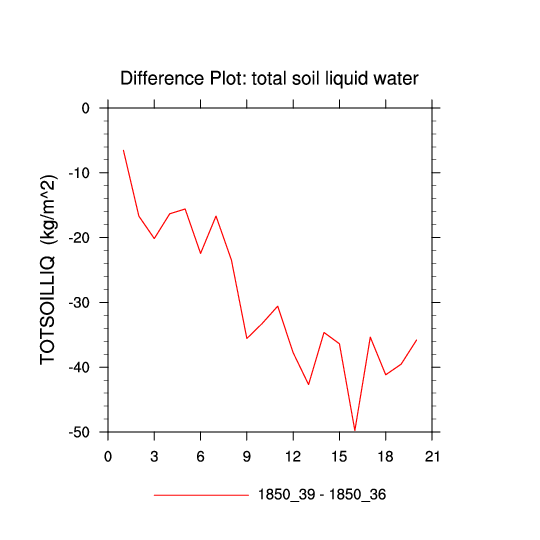
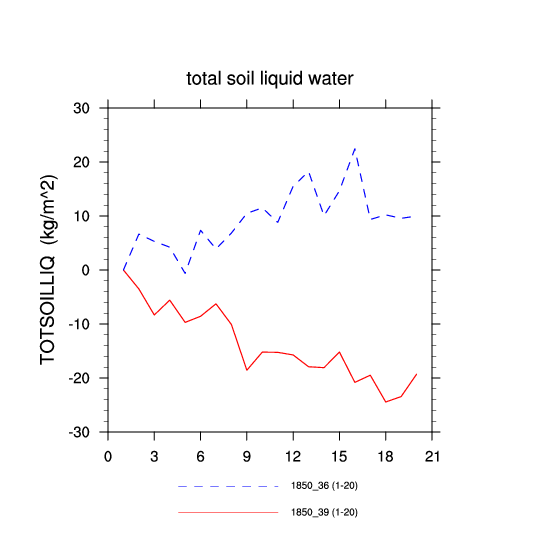
| soil liquid water: layers 1,5,10 (SOILLIQ) | TrendPlot | DifferencePlot | AnomalyPlot | ||
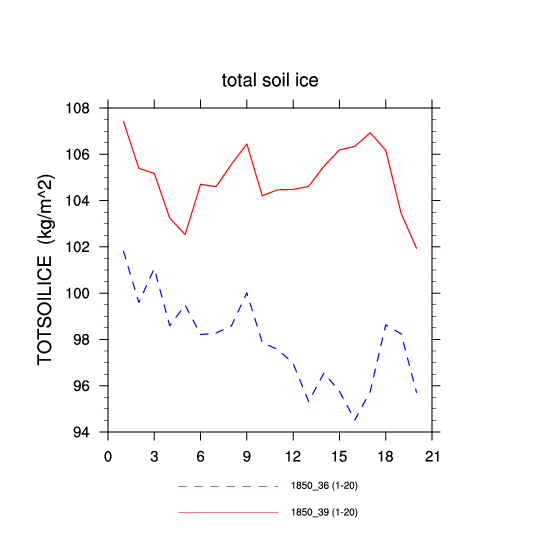
| soil ice: layers 1,5,10 (SOILICE) | TrendPlot | DifferencePlot | AnomalyPlot | ||
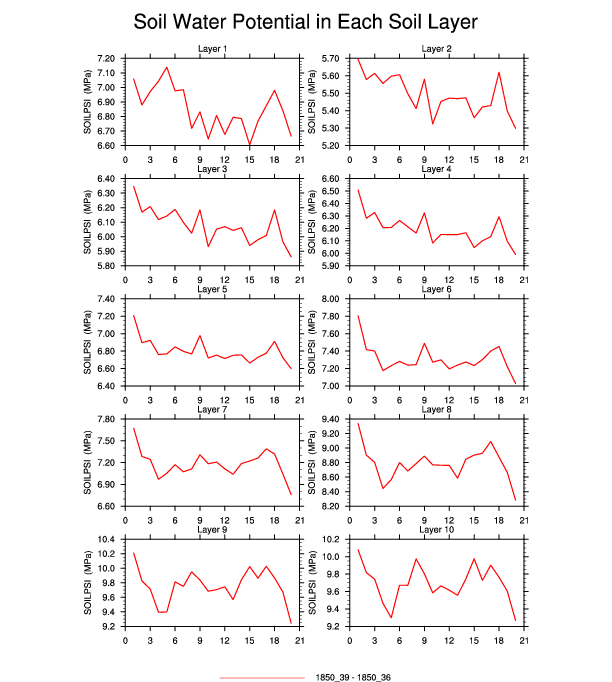
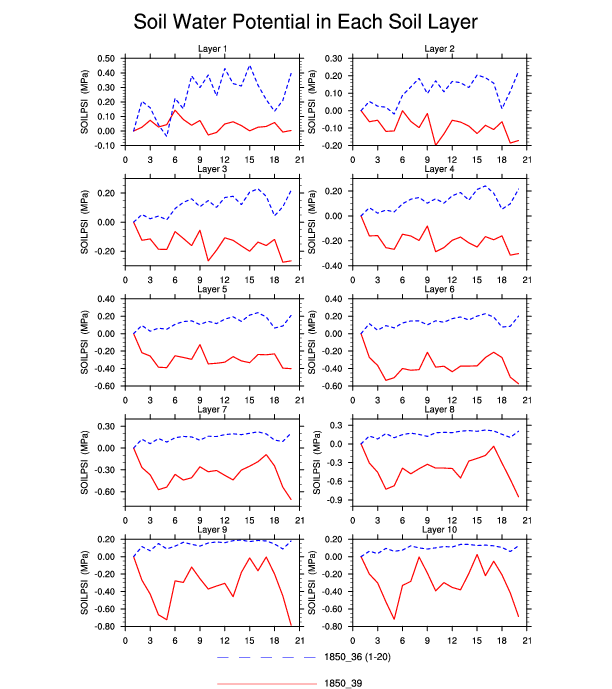
| Soil Water Potential in Each Soil Layer (SOILPSI) | TrendPlot | DifferencePlot | AnomalyPlot | ||
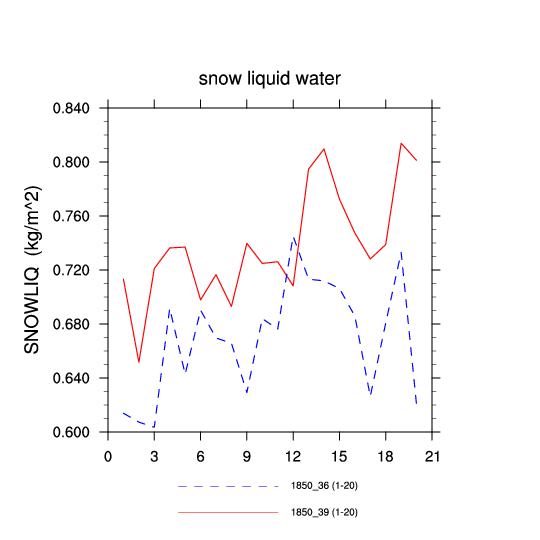
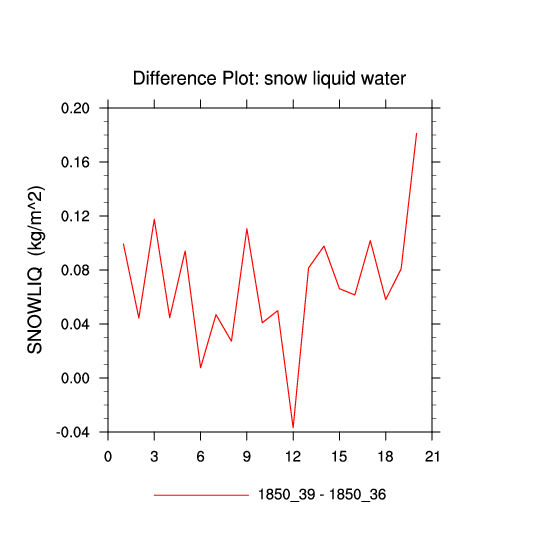
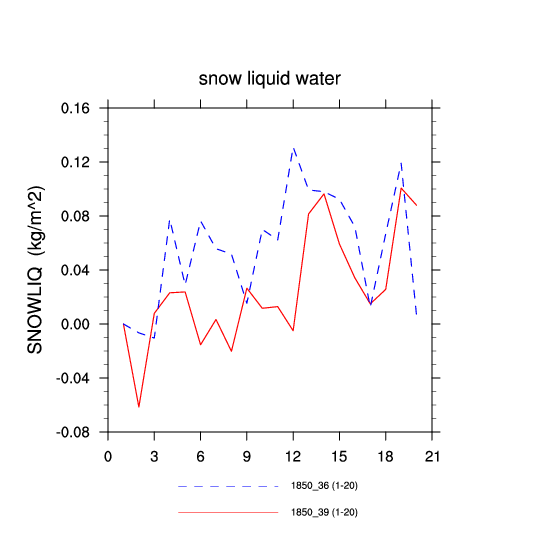
| snow liquid water (SNOWLIQ) | TrendPlot | DifferencePlot | AnomalyPlot | ||
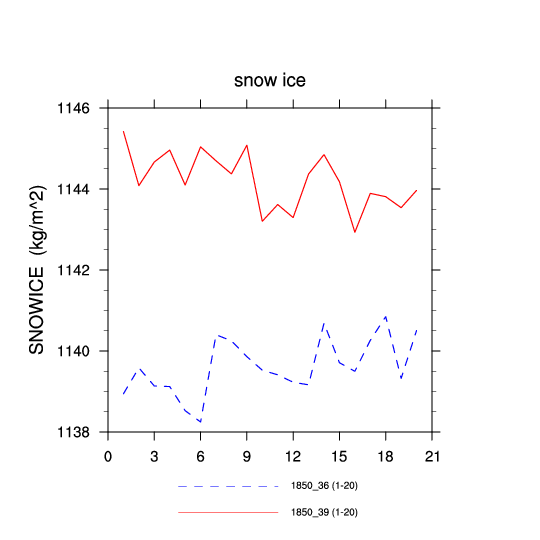
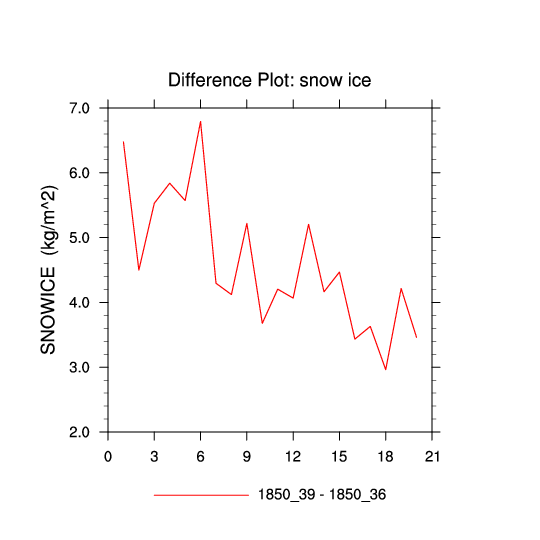
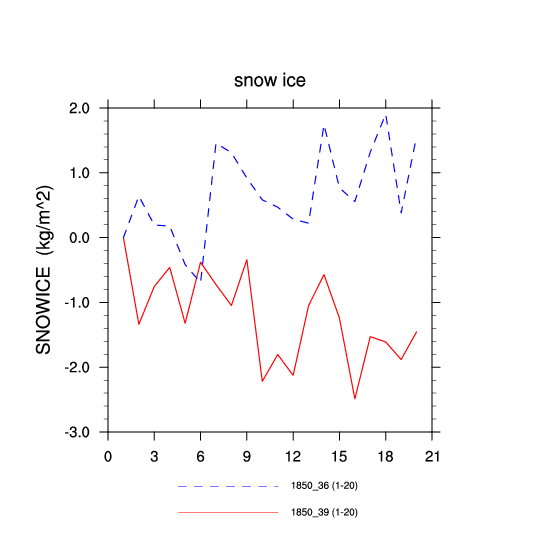
| snow ice (SNOWICE) | TrendPlot | DifferencePlot | AnomalyPlot | ||
| total soil liquid water (TOTSOILLIQ) | TrendPlot | DifferencePlot | AnomalyPlot | ||
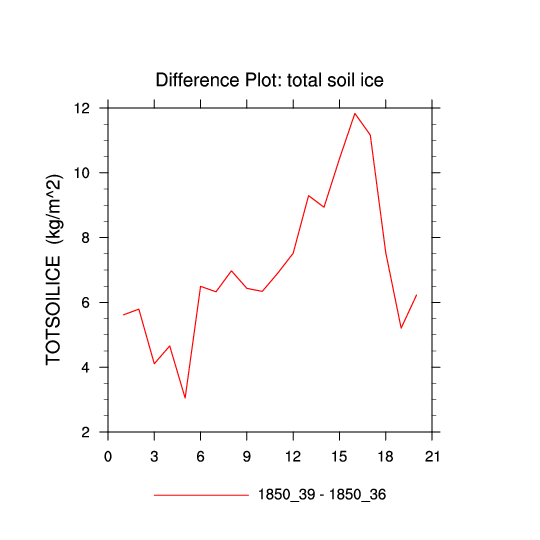
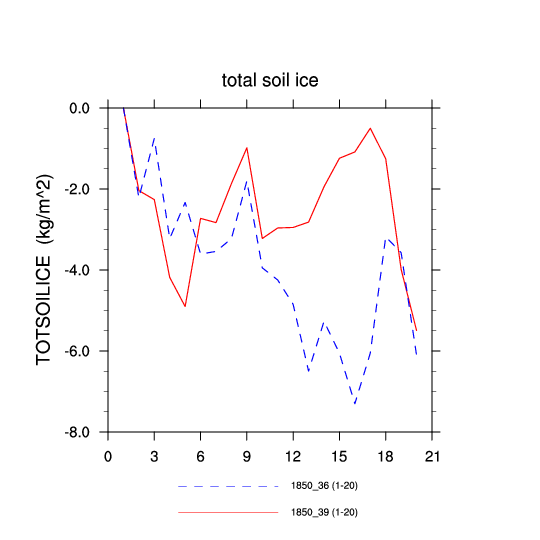
| total soil ice (TOTSOILICE) | TrendPlot | DifferencePlot | AnomalyPlot | ||
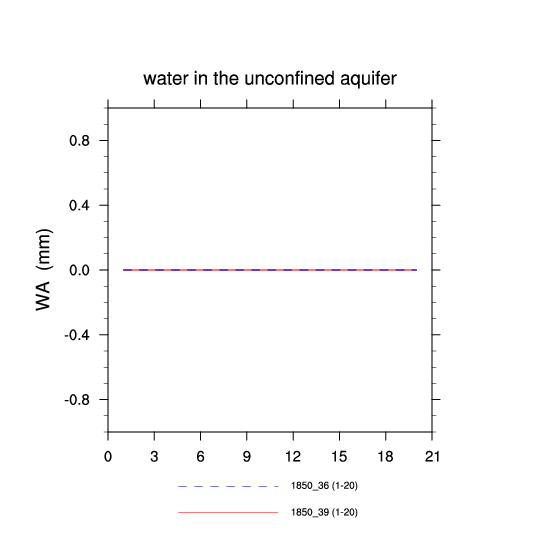
| water in the unconfined aquifer (WA) | TrendPlot | DifferencePlot | AnomalyPlot | ||
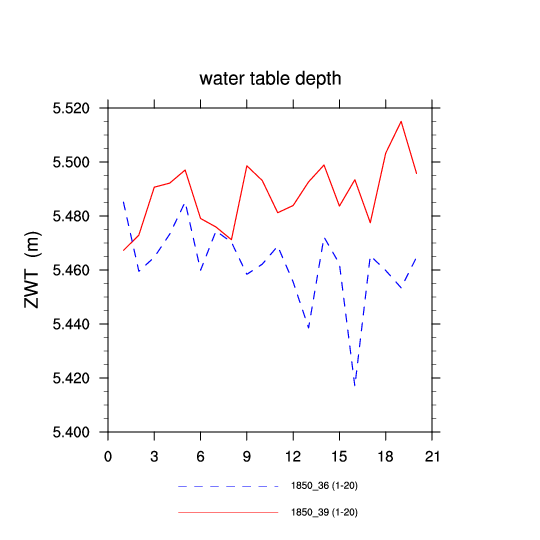
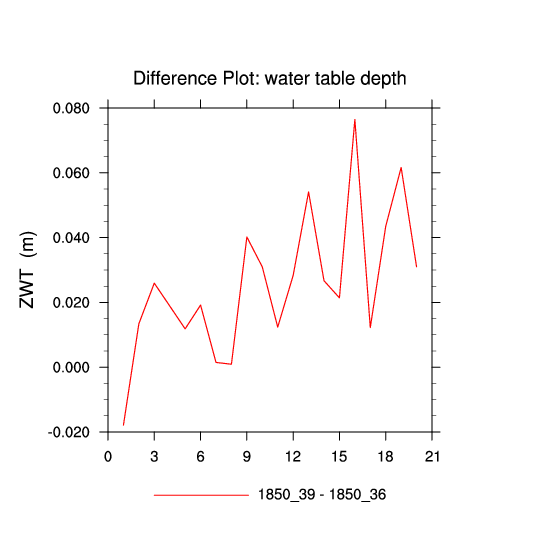
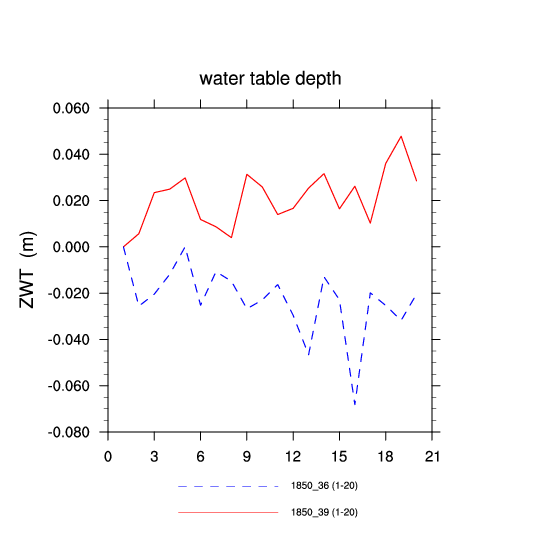
| water table depth (ZWT) | TrendPlot | DifferencePlot | AnomalyPlot | ||
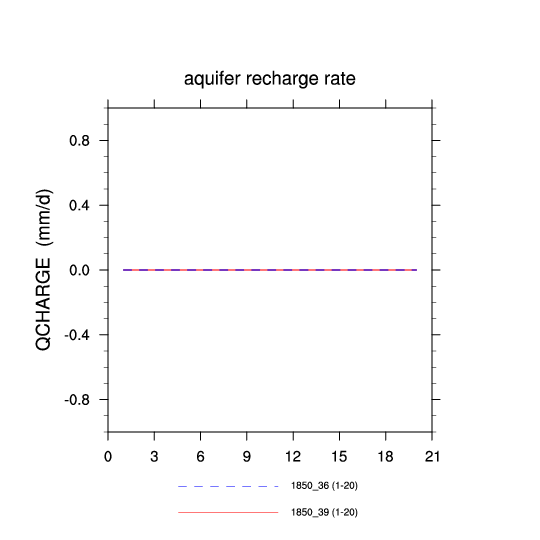
| aquifer recharge rate (QCHARGE) | TrendPlot | DifferencePlot | AnomalyPlot | ||
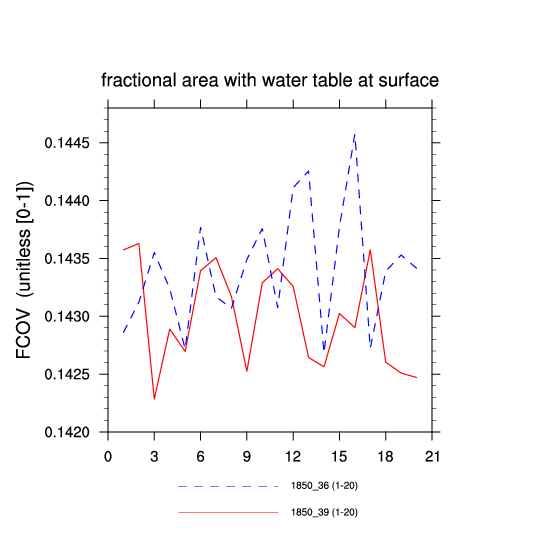
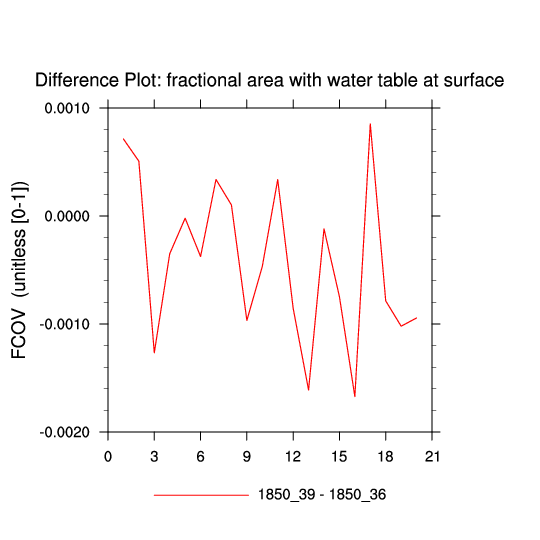
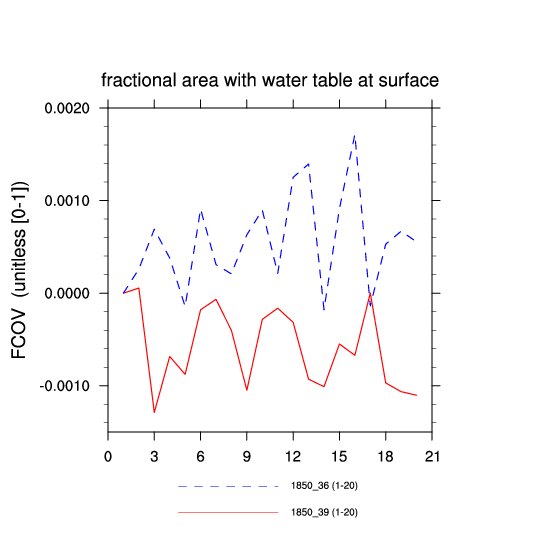
| fractional area with water table at surface (FCOV) | TrendPlot | DifferencePlot | AnomalyPlot | ||
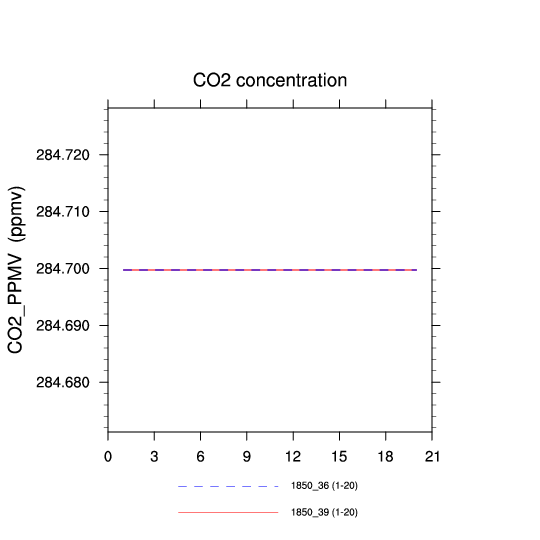
| CO2 concentration (CO2_PPMV) | TrendPlot | DifferencePlot | AnomalyPlot | ||
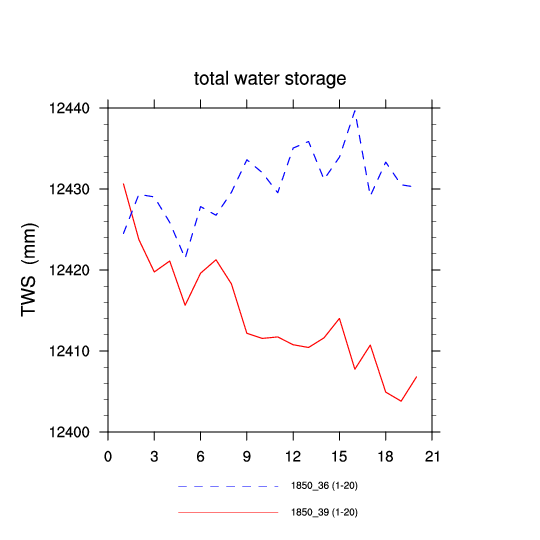
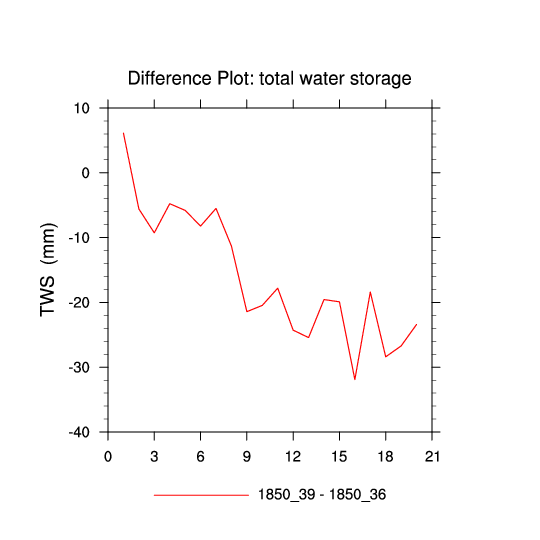
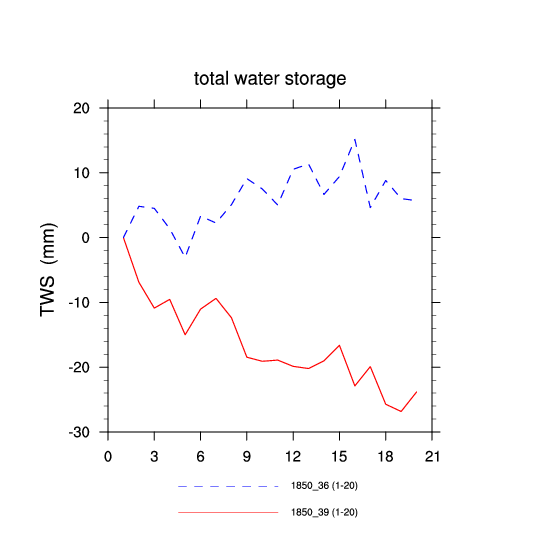
| total water storage (TWS) | TrendPlot | DifferencePlot | AnomalyPlot | ||
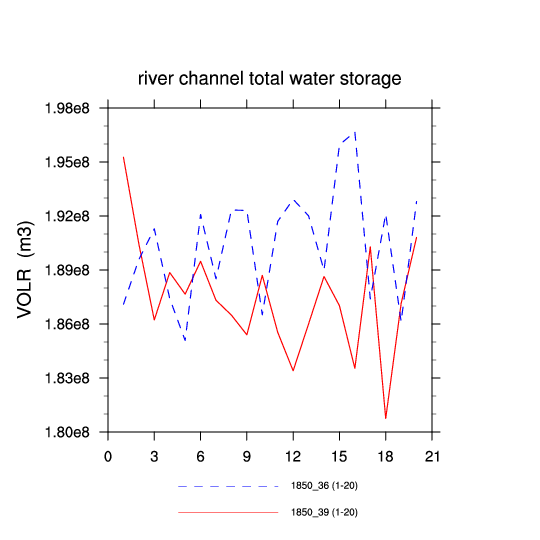
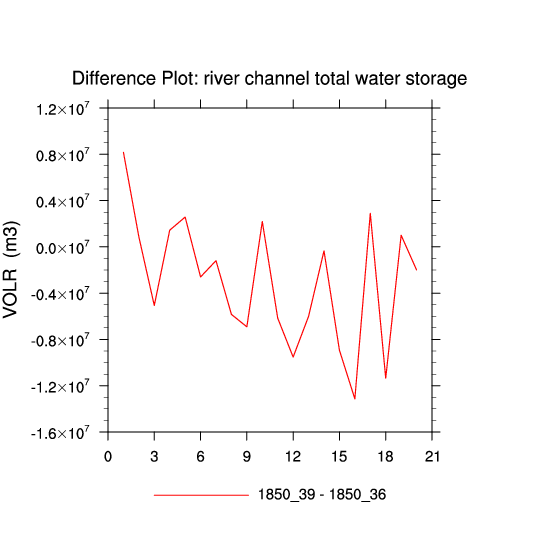
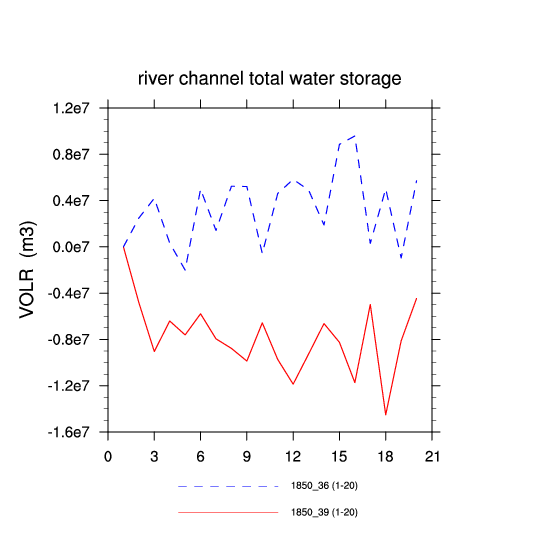
| river channel total water storage (VOLR) | TrendPlot | DifferencePlot | AnomalyPlot | ||
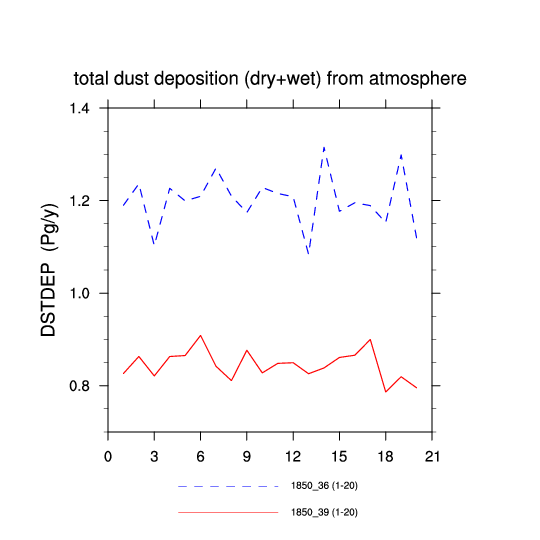
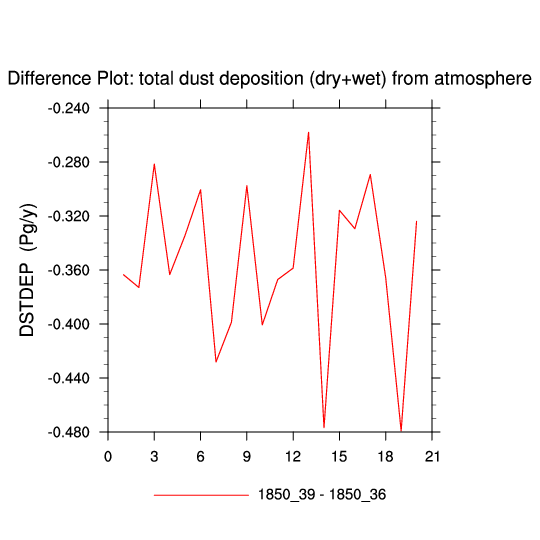
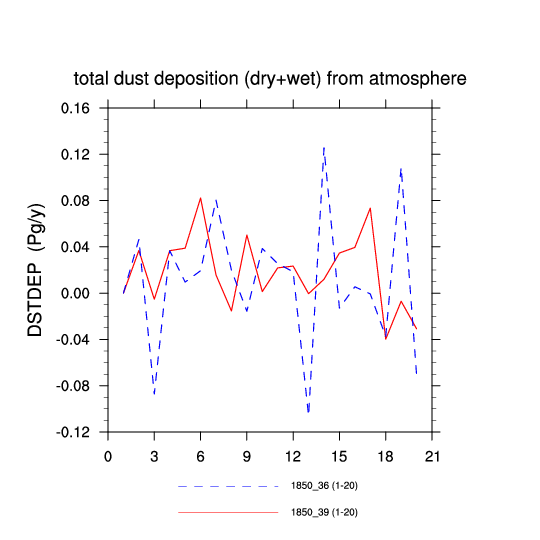
| total dust deposition (dry+wet) from atmosphere (DSTDEP) | TrendPlot | DifferencePlot | AnomalyPlot | ||
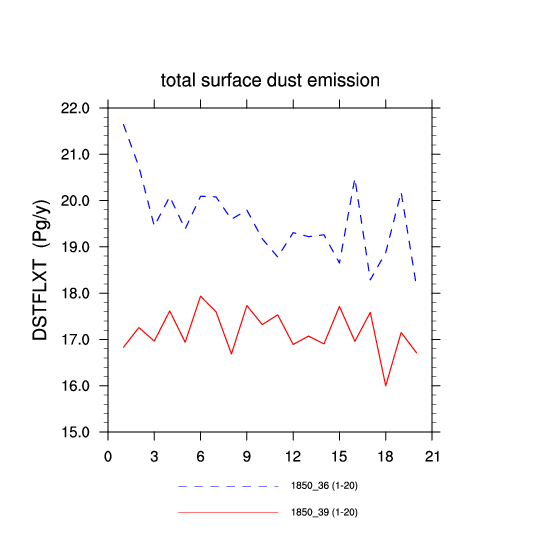
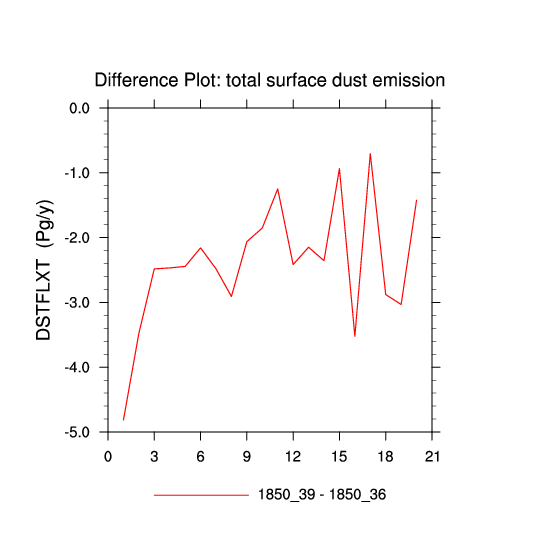
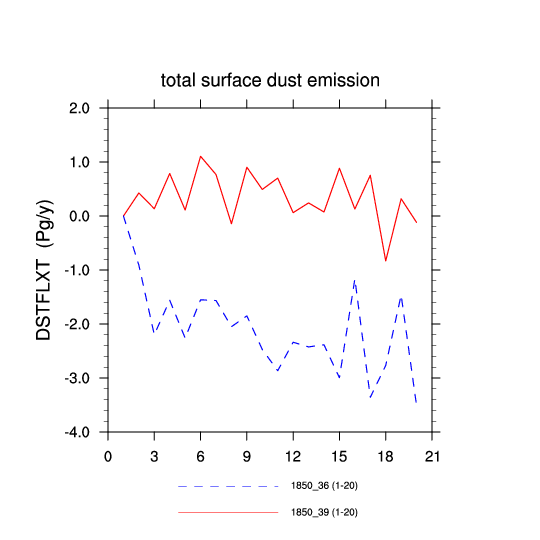
| total surface dust emission (DSTFLXT) | TrendPlot | DifferencePlot | AnomalyPlot | ||
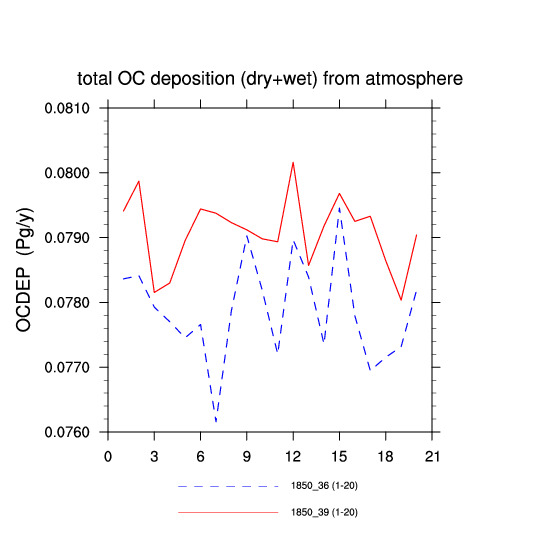
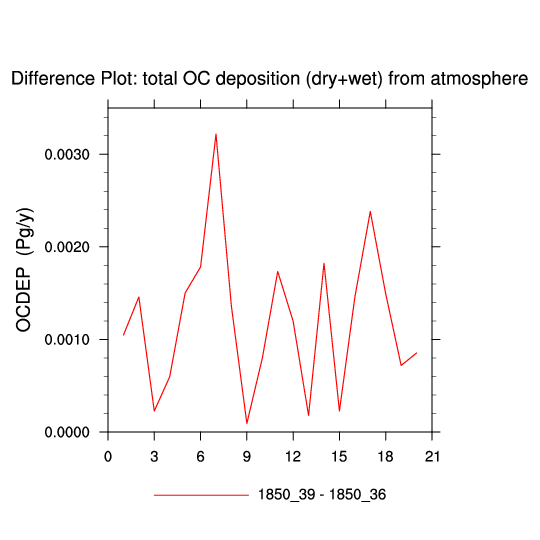
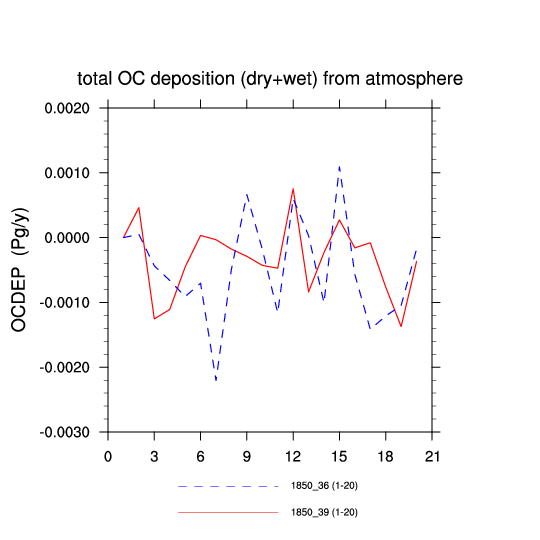
| total OC deposition (dry+wet) from atmosphere (OCDEP) | TrendPlot | DifferencePlot | AnomalyPlot | ||
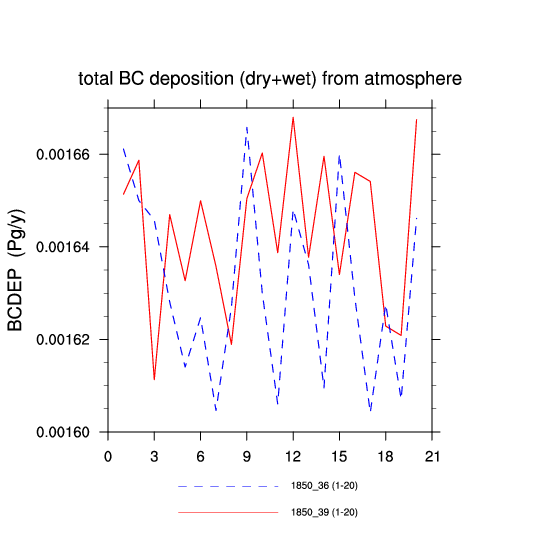
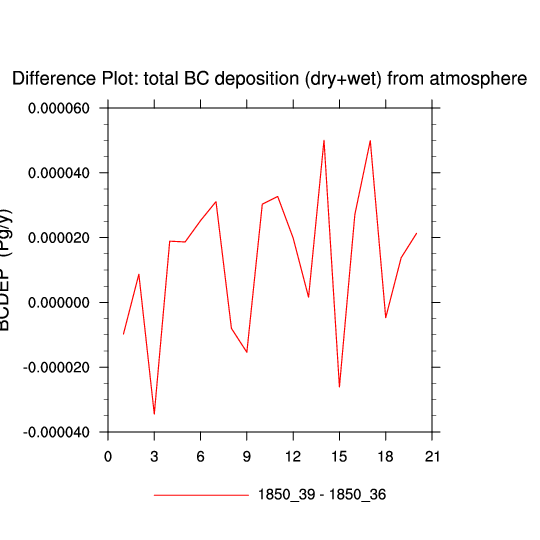
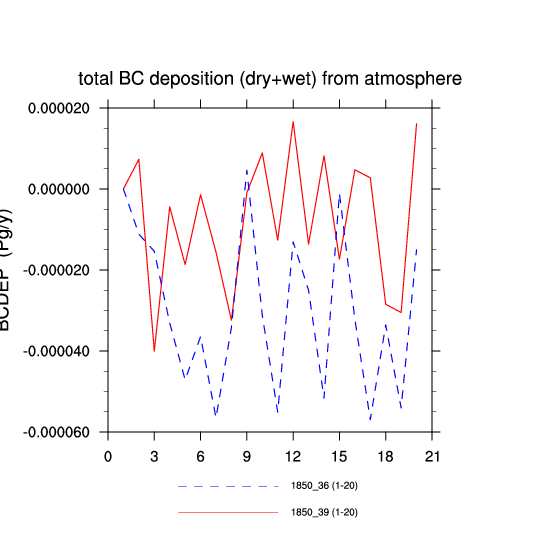
| total BC deposition (dry+wet) from atmosphere (BCDEP) | TrendPlot | DifferencePlot | AnomalyPlot | ||