Fortran code for computing the space-time spectra and the observed OLR dataset
supplied by Matthew Wheeler. See Wheeler and Kiladis, JAS, vol 56, 374-399, 1999.
The observed OLR data is from NOAA polar-orbiting satellites and covers
the period 1979-2000. The CAM3 Amip (t42) and NCEP Reanalysis data are for the
period 1991-2000.
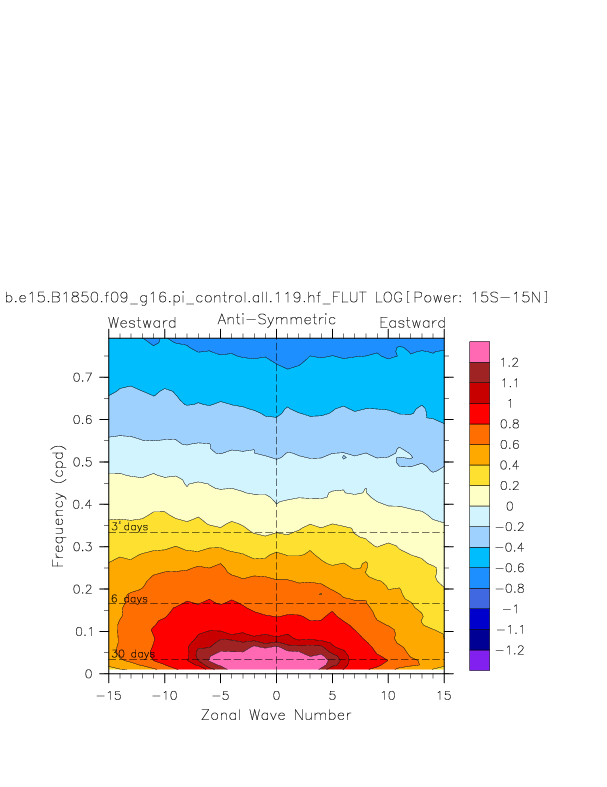
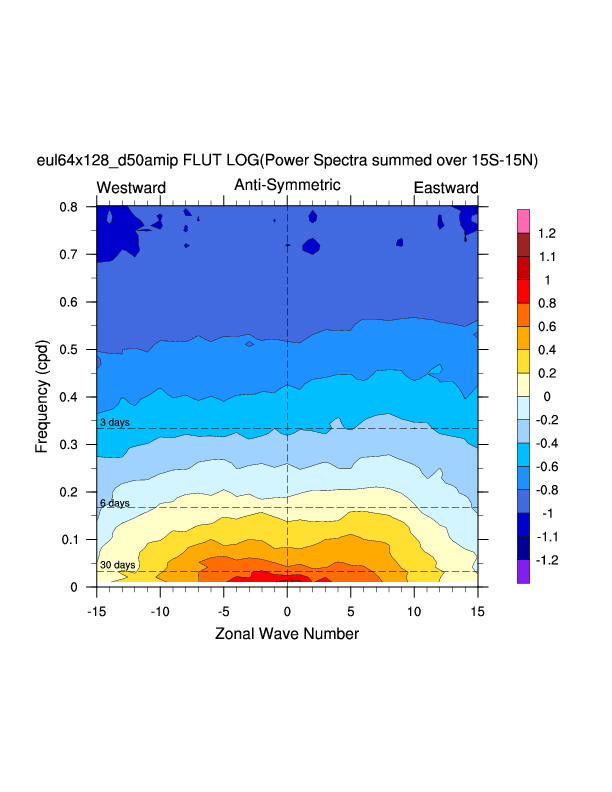
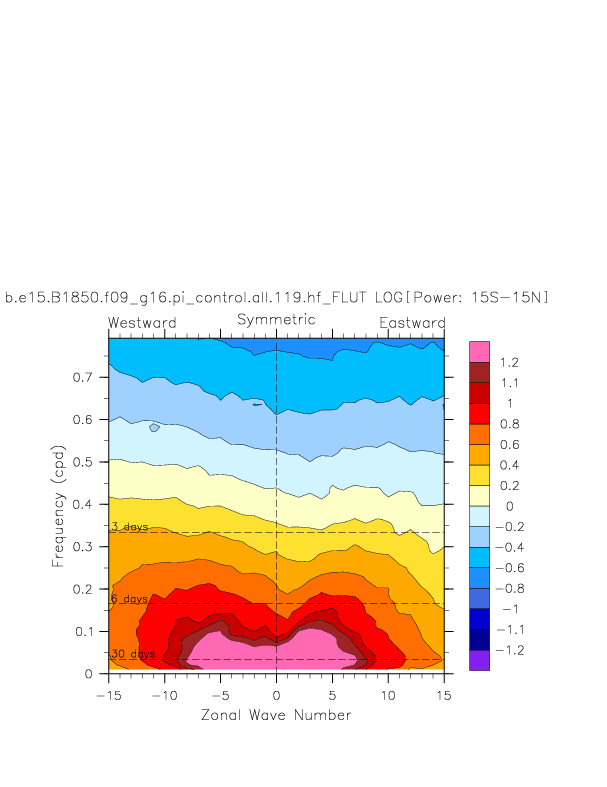
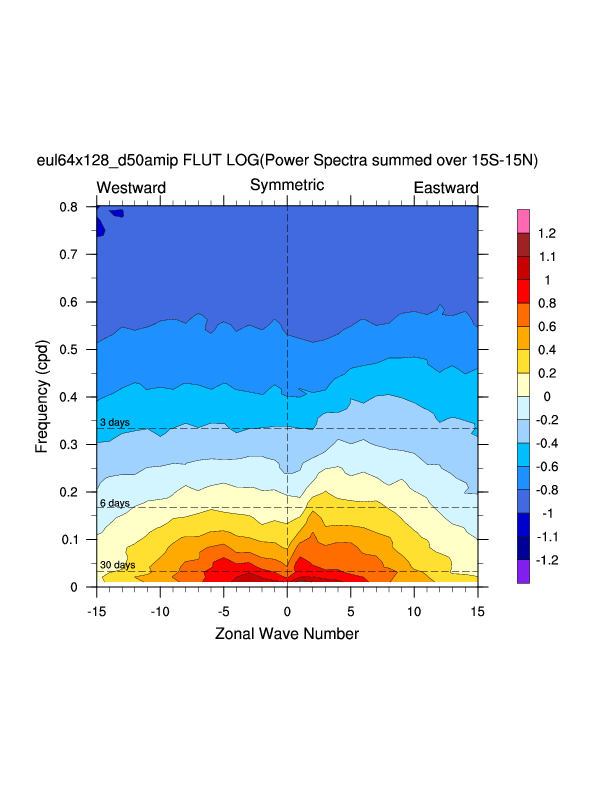
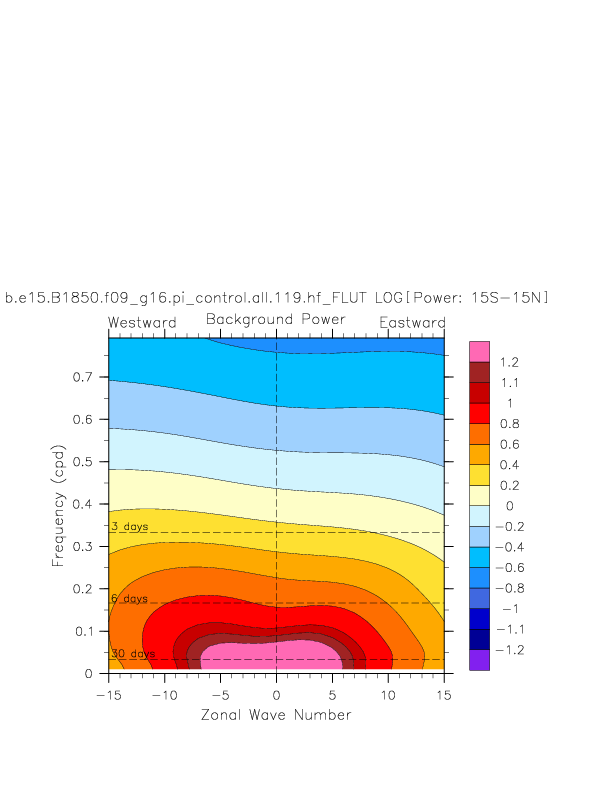
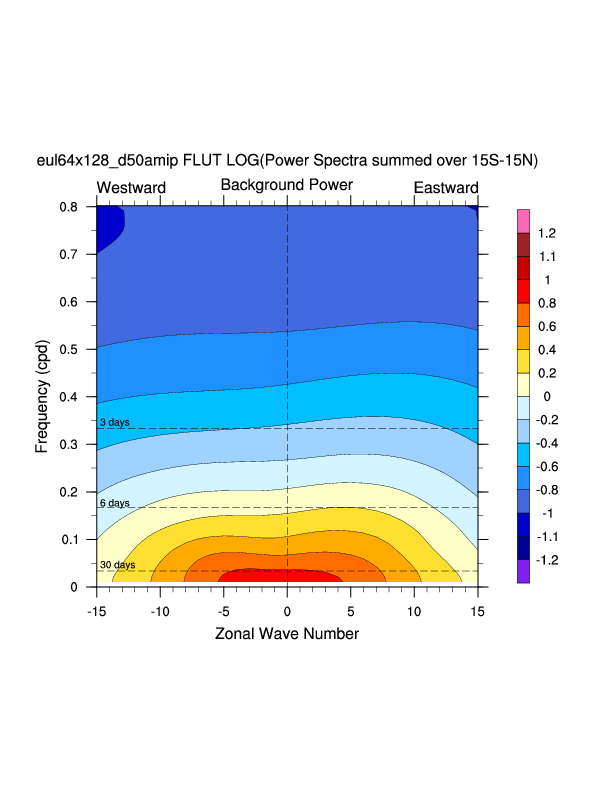
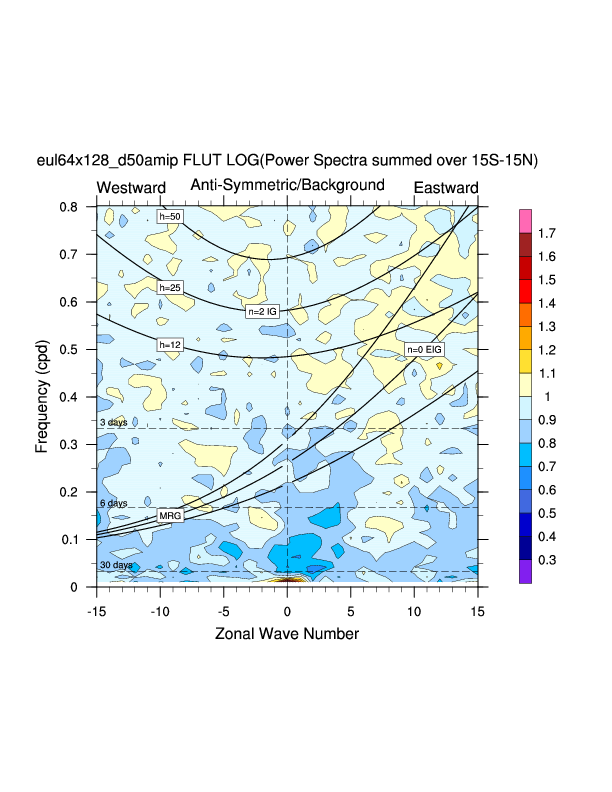
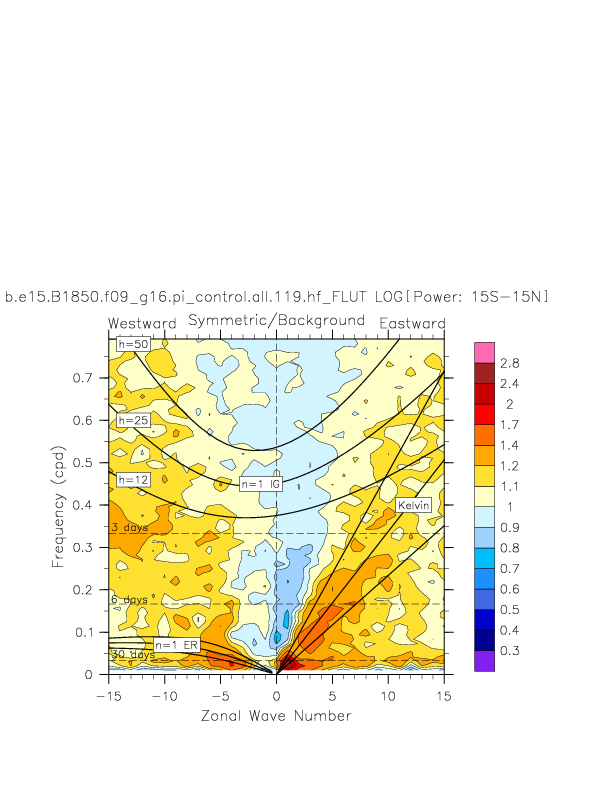
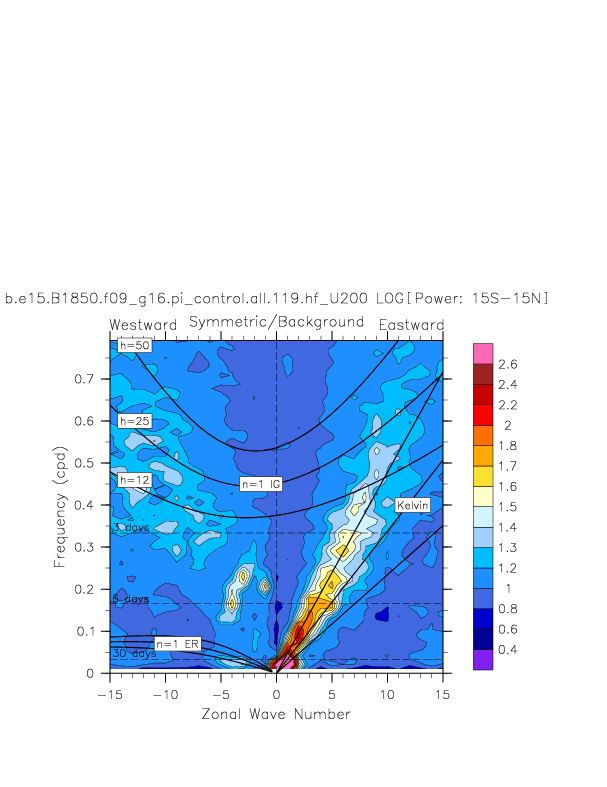
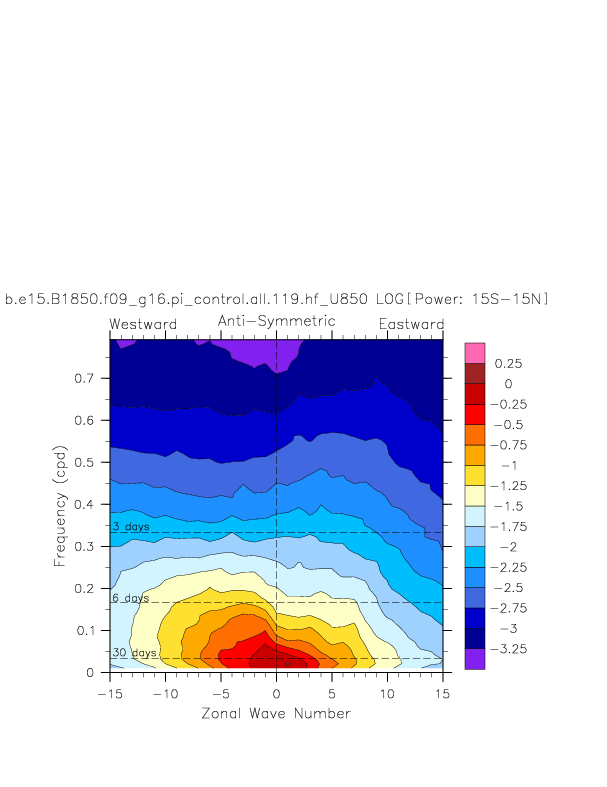
| OLR (outgoing LW radiation) | b.e15.B1850.f09_g16.pi_control.all.119.hf | NOAA | NCEP | CAM3 Amip (T42) |
|---|---|---|---|---|
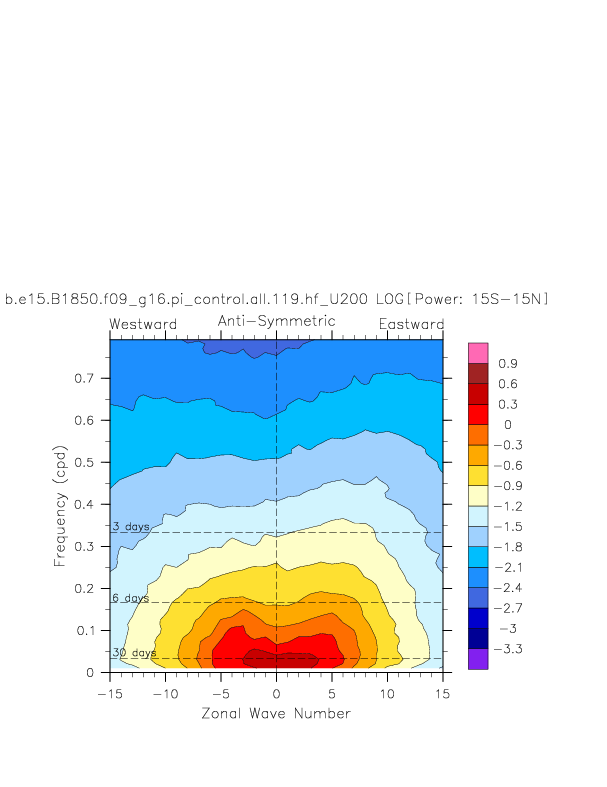
| Anti-symmetric raw power spectra (WK99 Fig. 1a) | plot | plot | plot | plot |
| Symmetric raw power spectra (WK99 Fig. 1b) | plot | plot | plot | plot |
| Background power spectra (WK99 Fig. 2) | plot | plot | plot | plot |
| Anti-symmetric/background power spectra (WK99 Fig. 3a) | plot | plot | plot | plot |
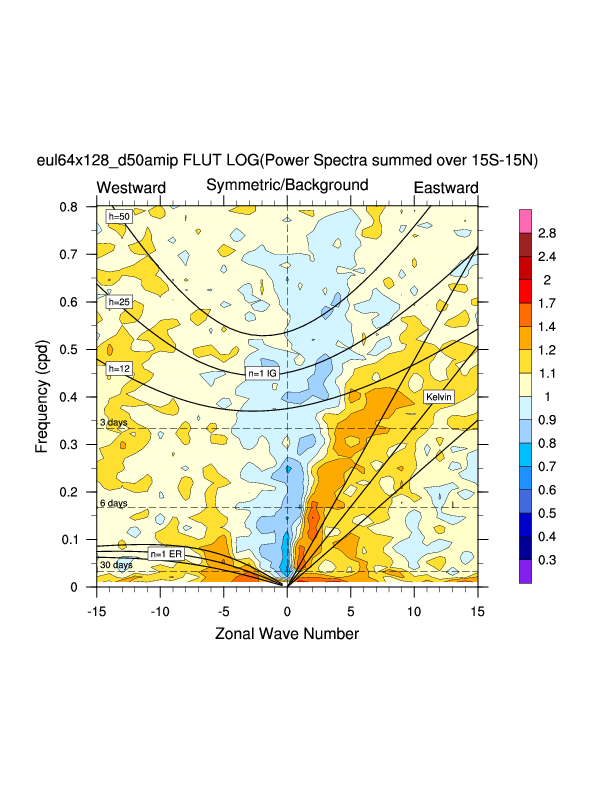
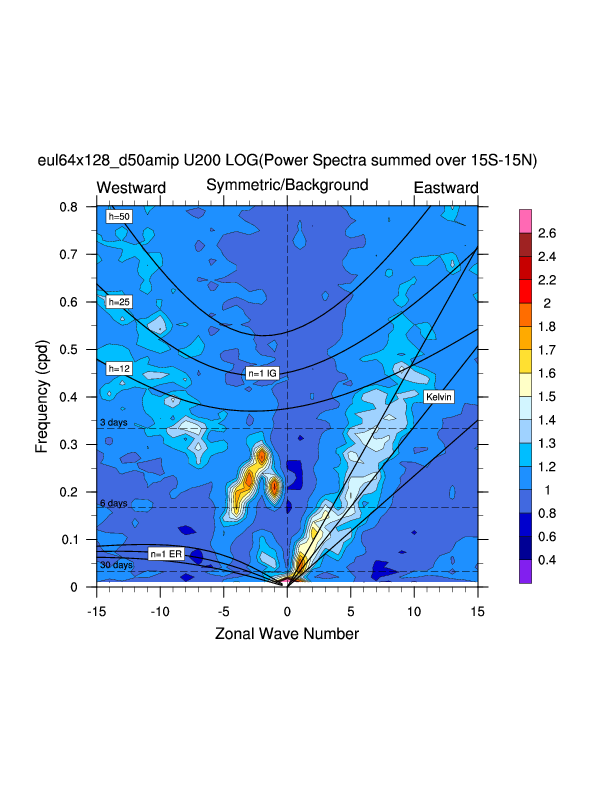
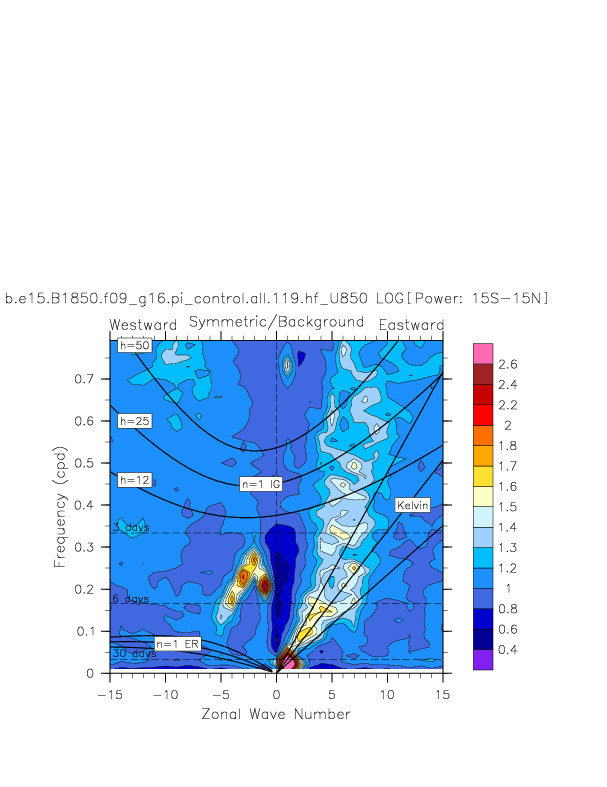
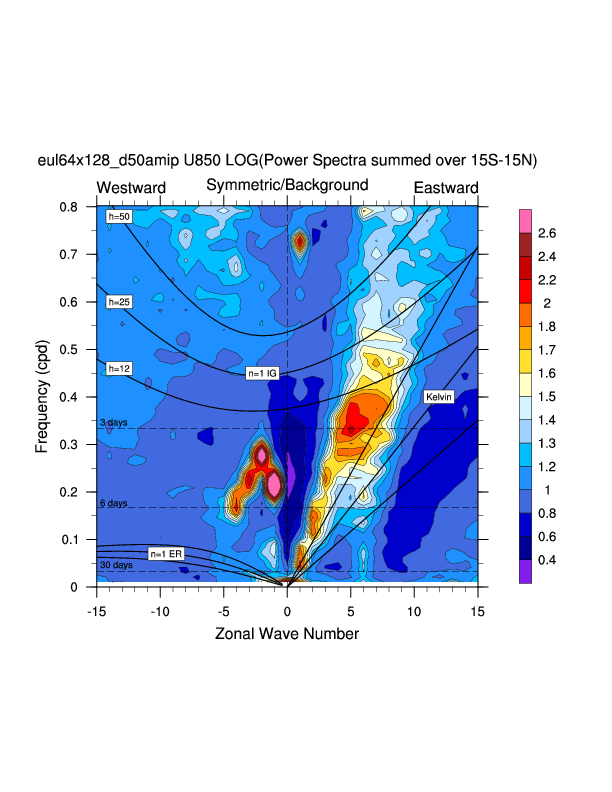
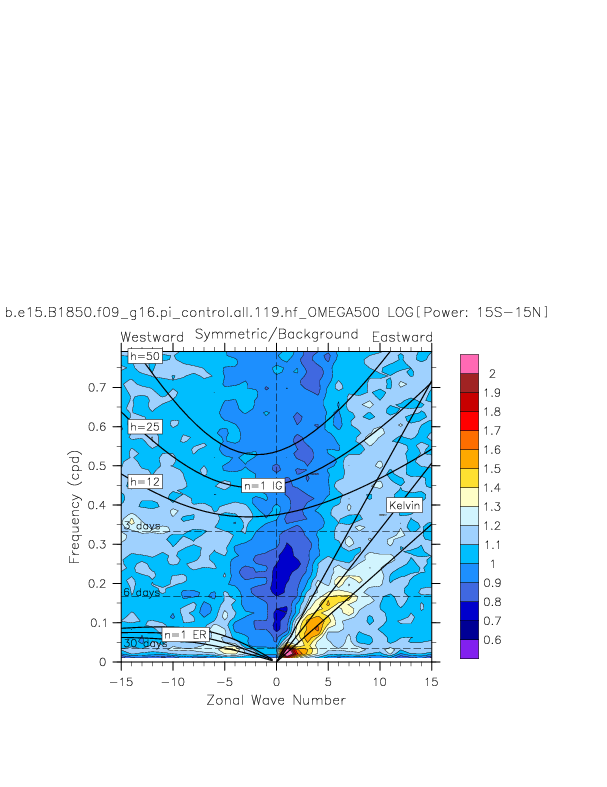
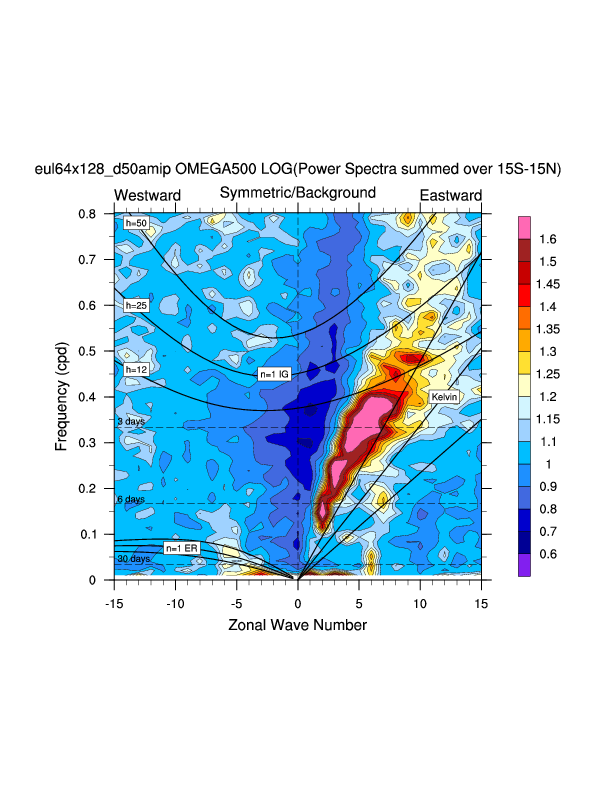
| Symmetric/background power spectra (WK99 Fig. 3b) | plot | plot | plot | plot |
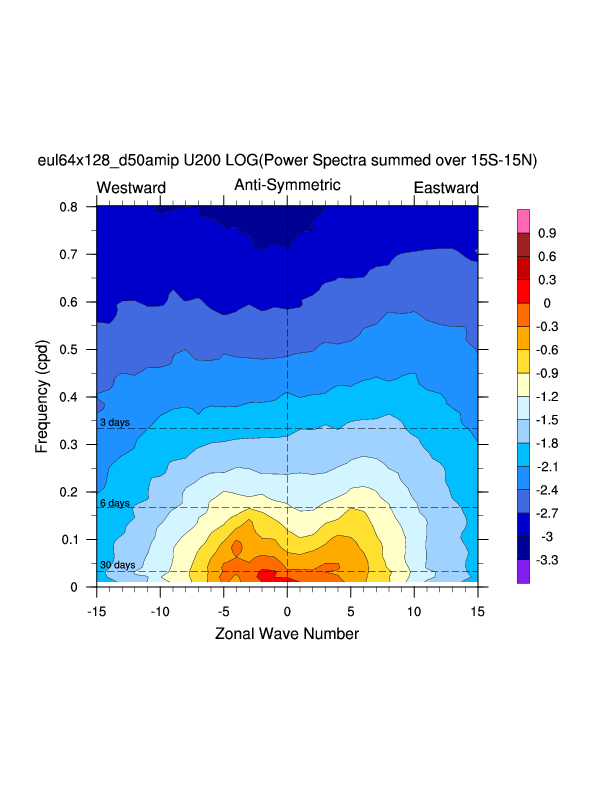
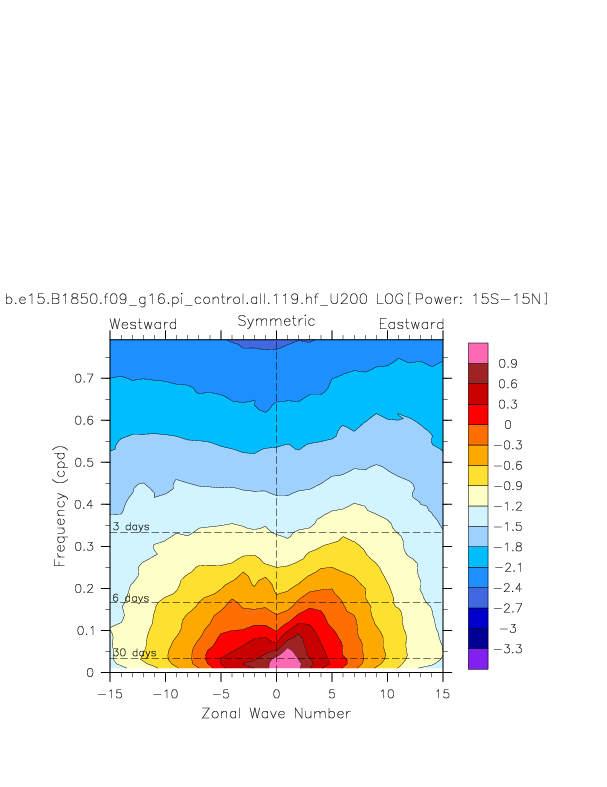
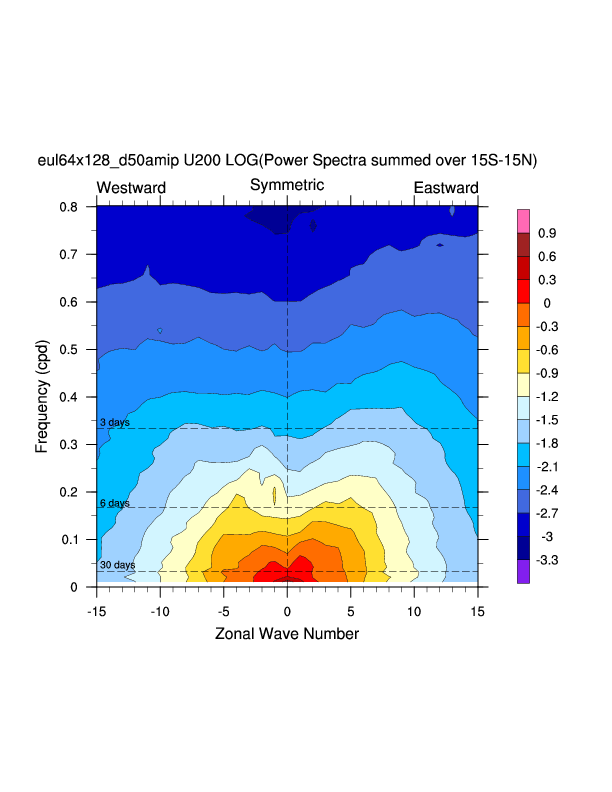
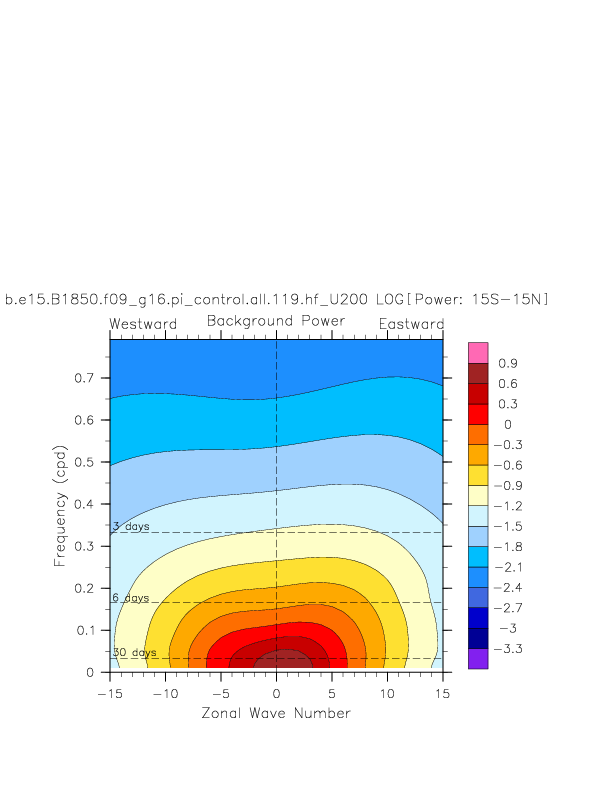
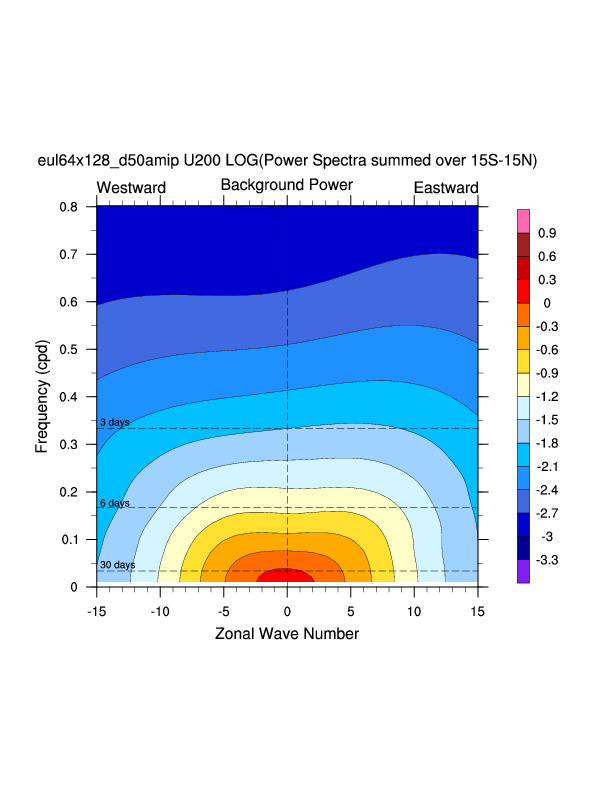
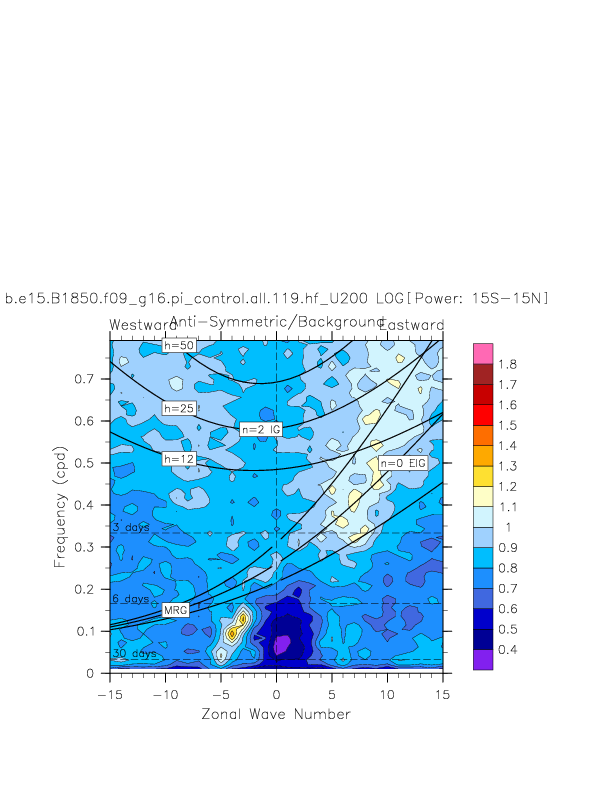
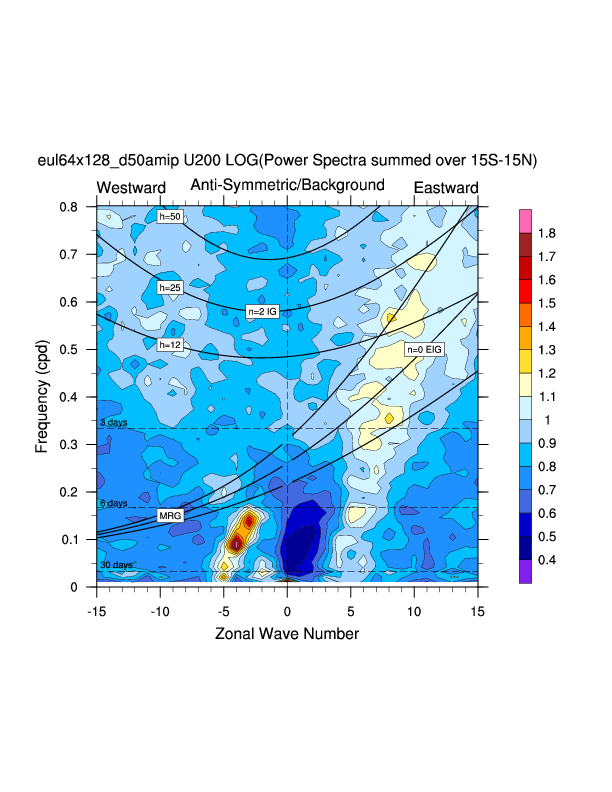
| U200 (200 mb zonal wind) | b.e15.B1850.f09_g16.pi_control.all.119.hf | NCEP | CAM3 Amip (T42) |
|---|---|---|---|
| Anti-symmetric raw power spectra (WK99 Fig. 1a) | plot | plot | plot |
| Symmetric raw power spectra (WK99 Fig. 1b) | plot | plot | plot |
| Background power spectra (WK99 Fig. 2) | plot | plot | plot |
| Anti-symmetric/background power spectra (WK99 Fig. 3a) | plot | plot | plot |
| Symmetric/background power spectra (WK99 Fig. 3b) | plot | plot | plot |
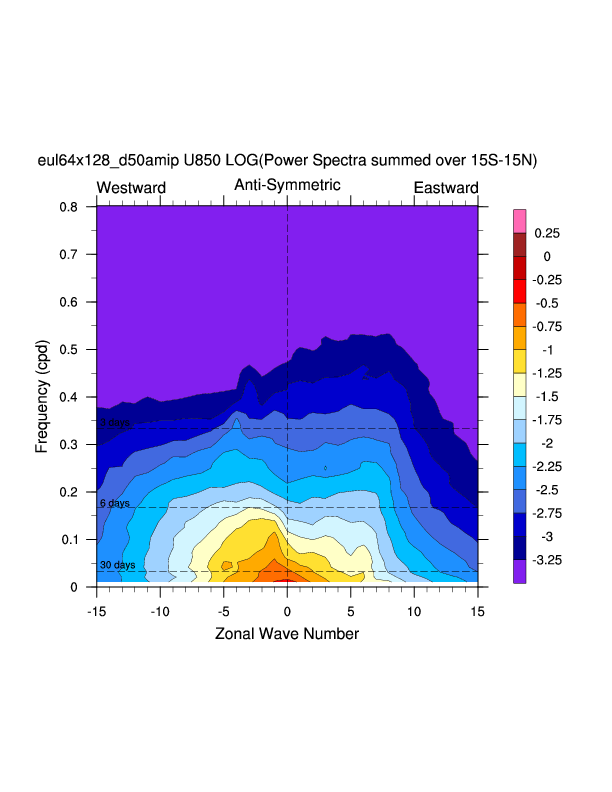
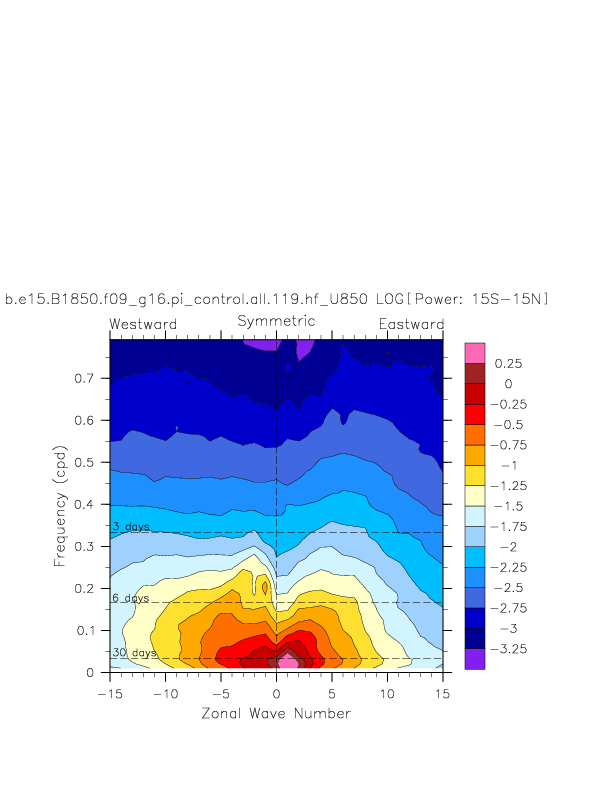
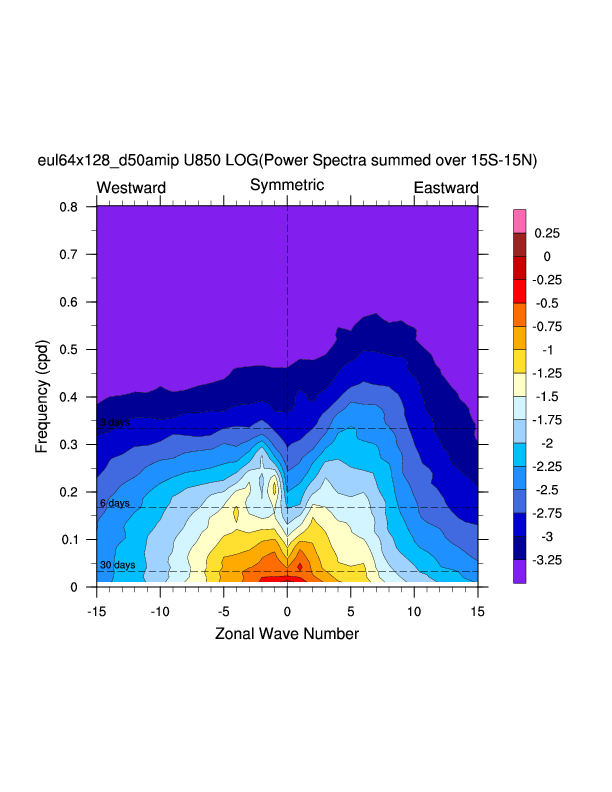
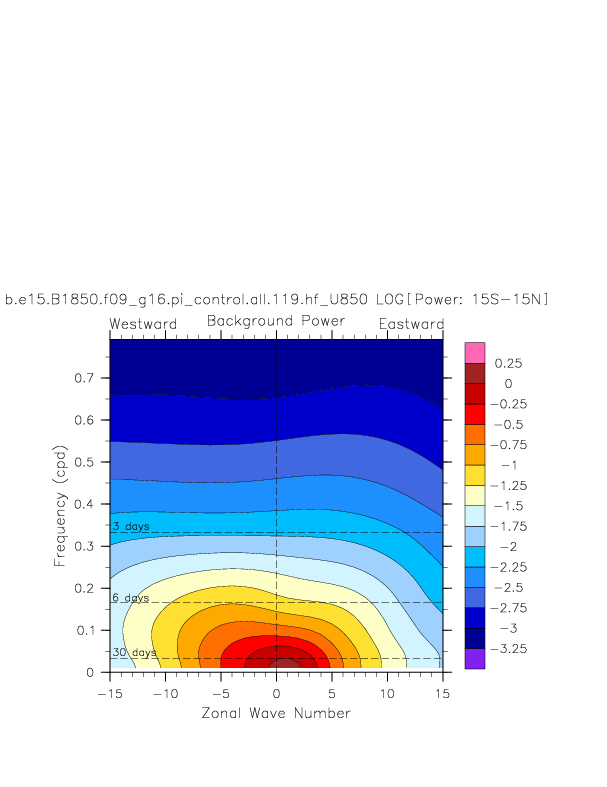
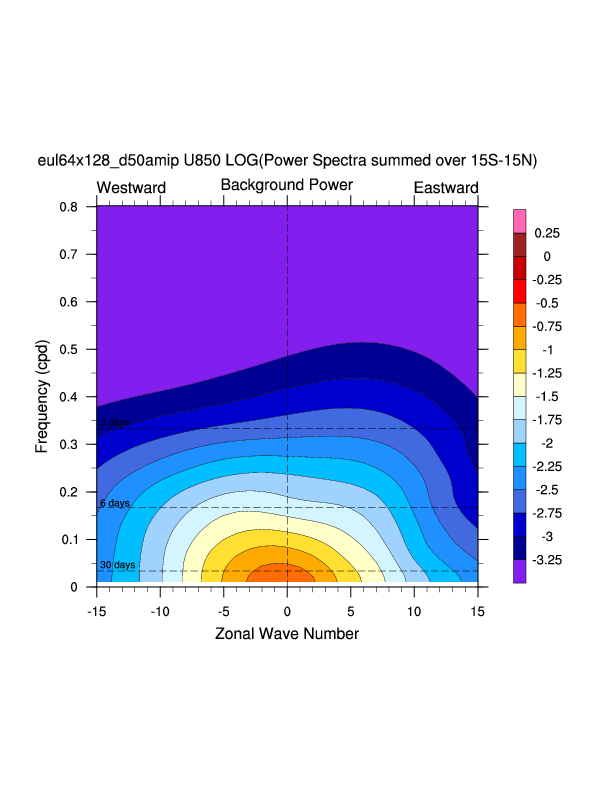
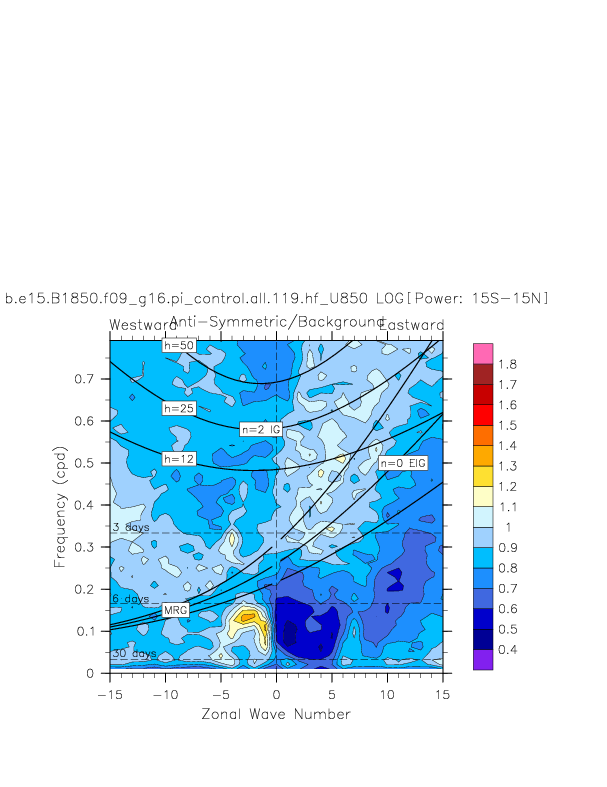
| U850 (850 mb zonal wind) | b.e15.B1850.f09_g16.pi_control.all.119.hf | NCEP | CAM3 Amip (T42) |
|---|---|---|---|
| Anti-symmetric raw power spectra (WK99 Fig. 1a) | plot | plot | plot |
| Symmetric raw power spectra (WK99 Fig. 1b) | plot | plot | plot |
| Background power spectra (WK99 Fig. 2) | plot | plot | plot |
| Anti-symmetric/background power spectra (WK99 Fig. 3a) | plot | plot | plot |
| Symmetric/background power spectra (WK99 Fig. 3b) | plot | plot | plot |
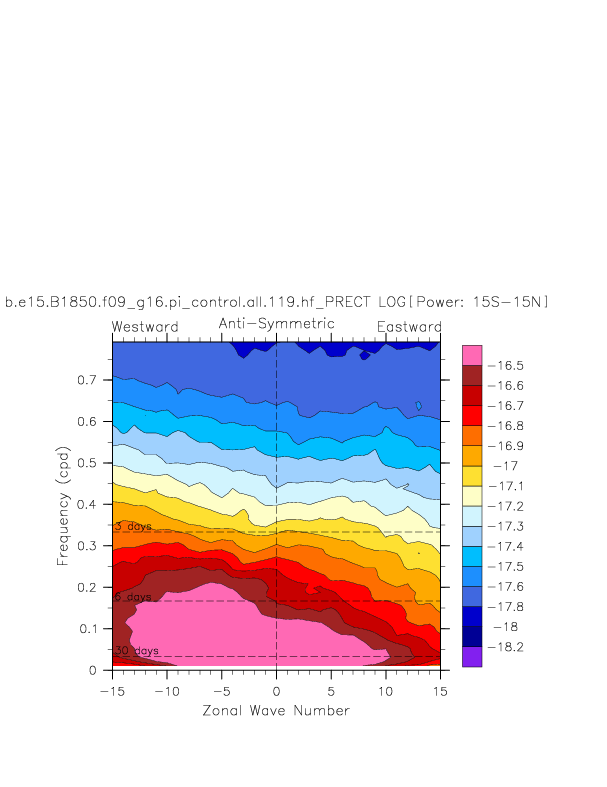
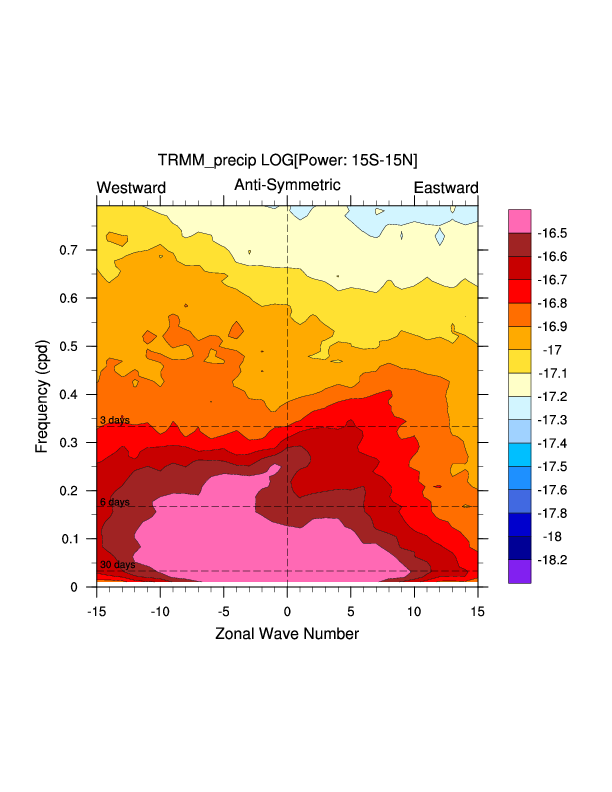
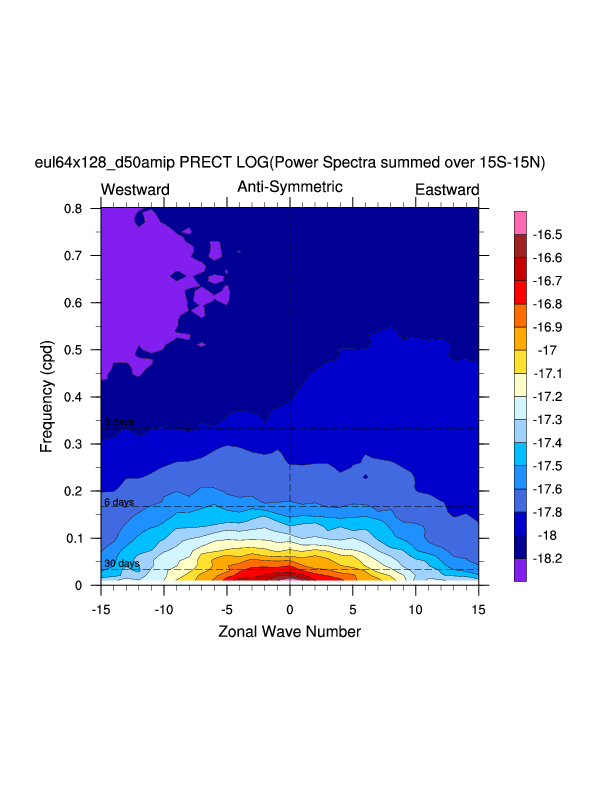
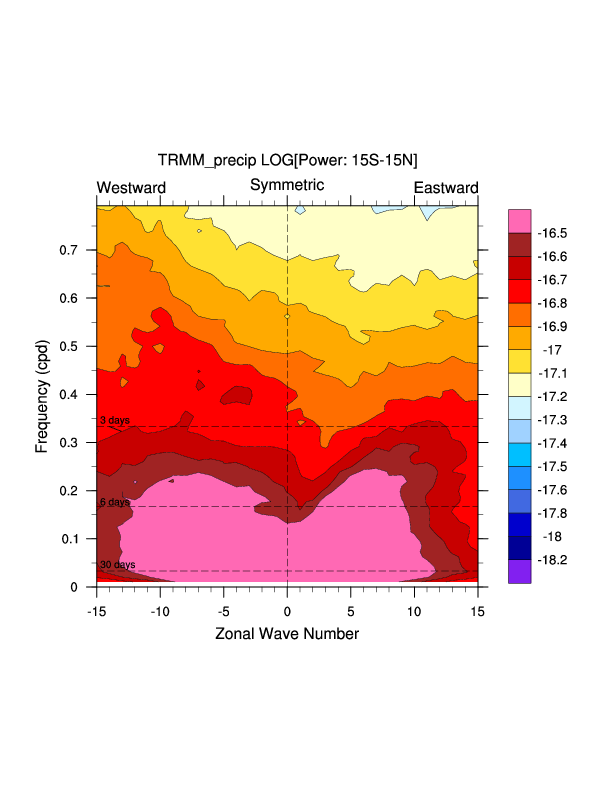
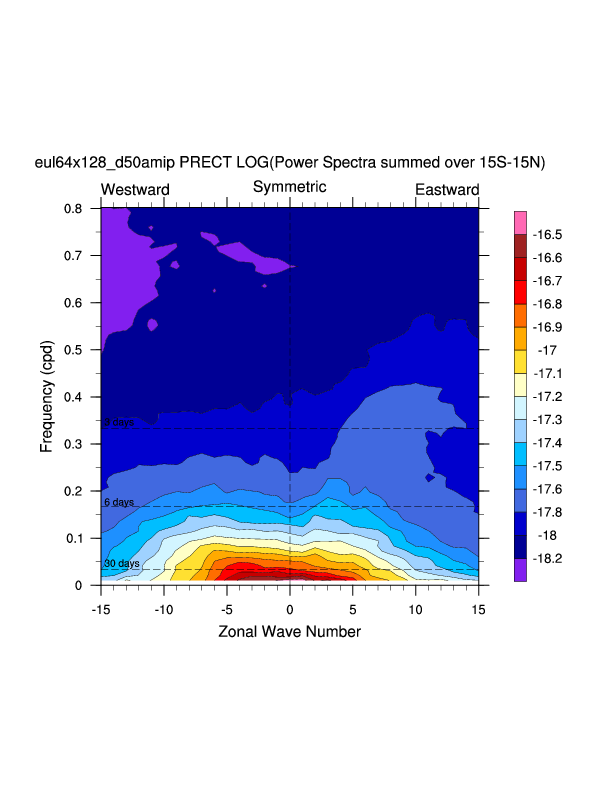
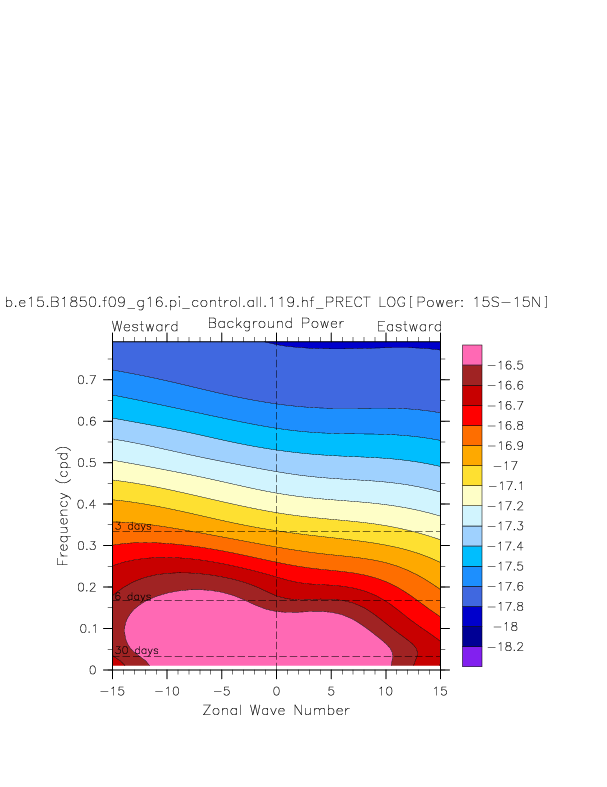
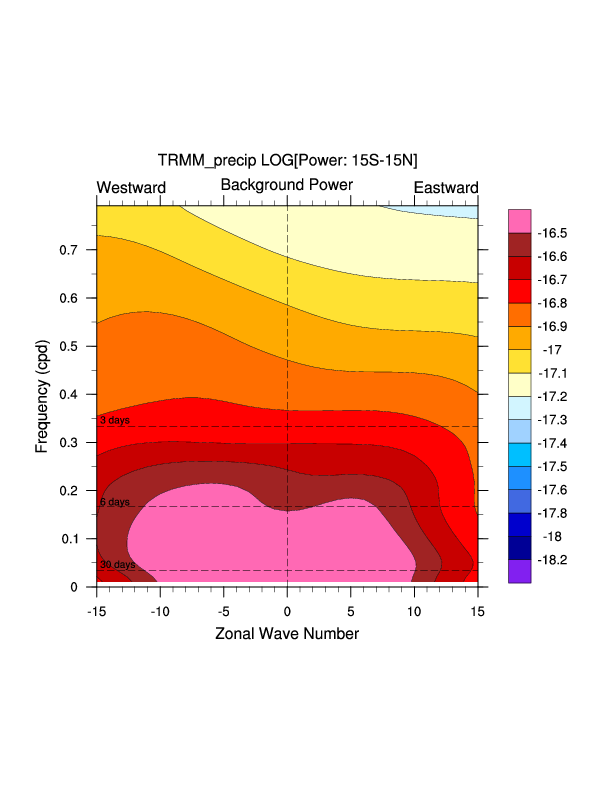
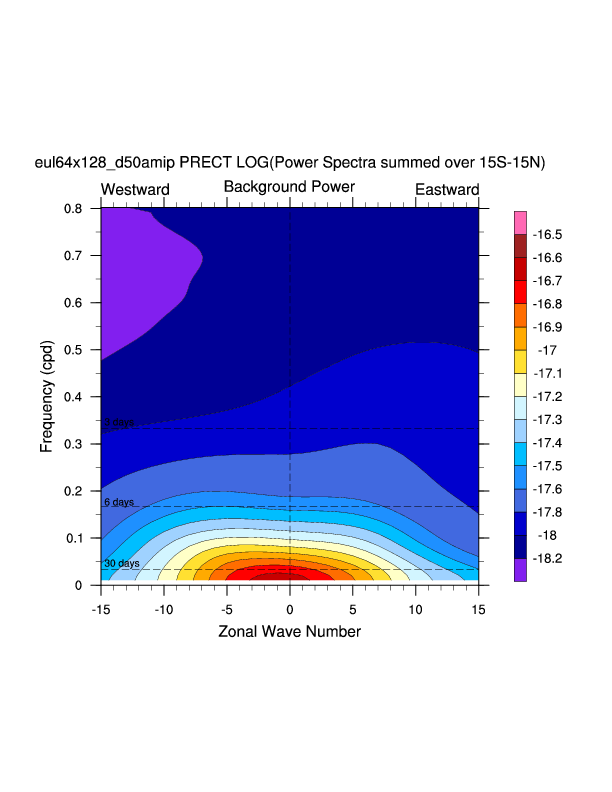
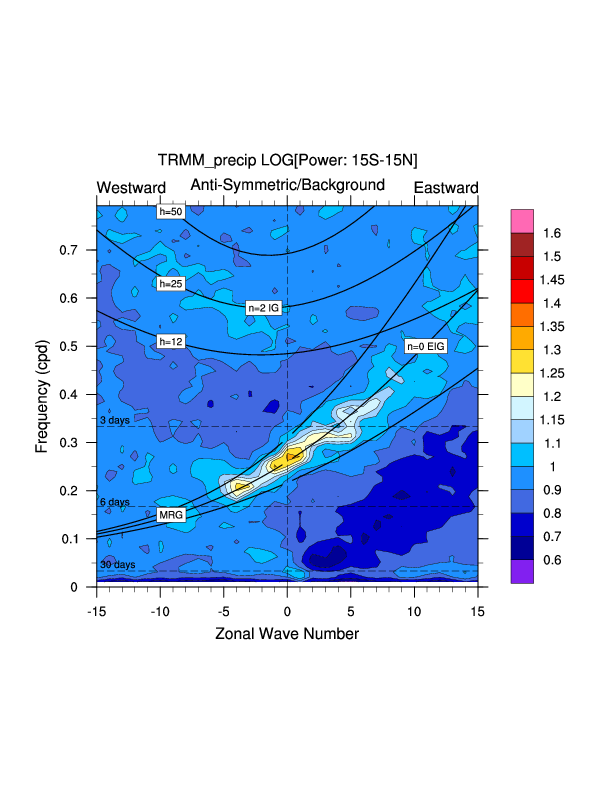
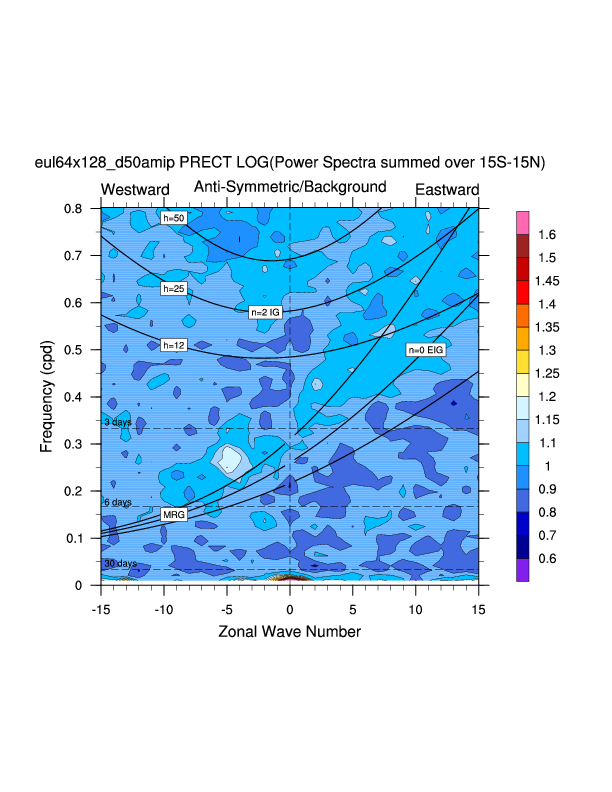
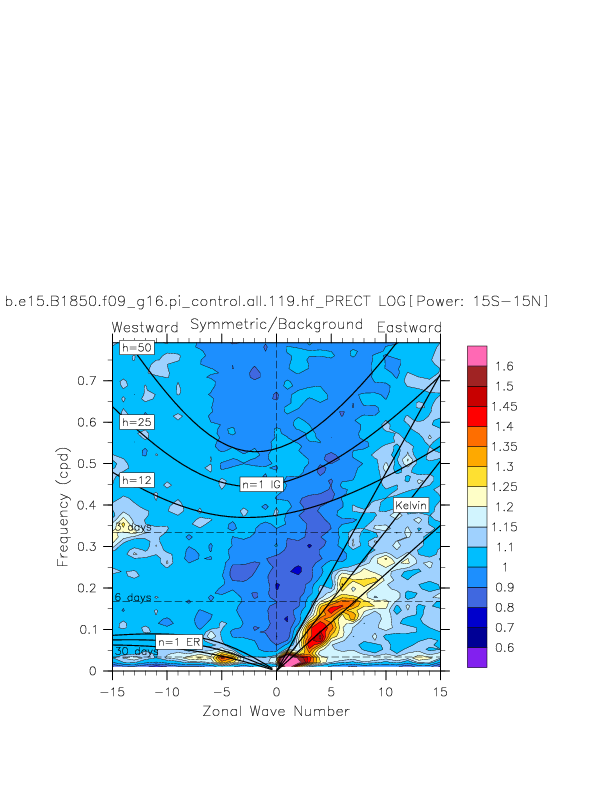
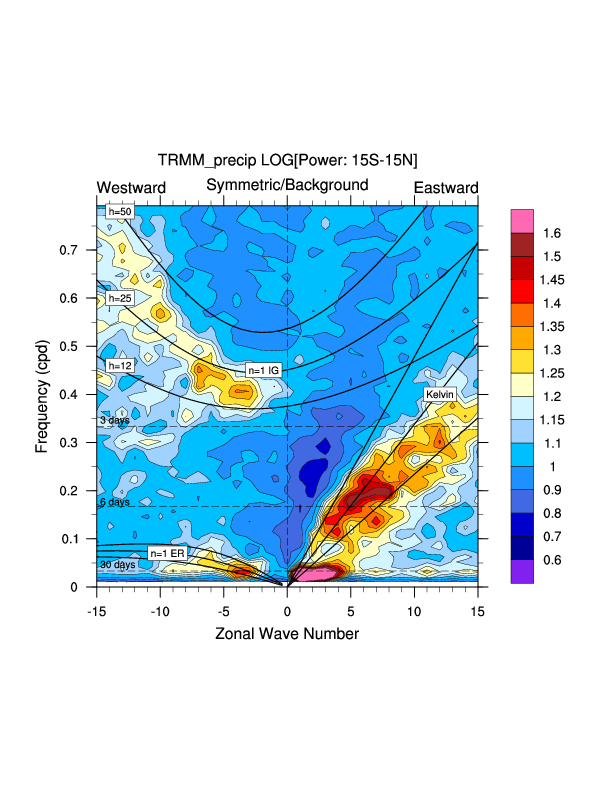
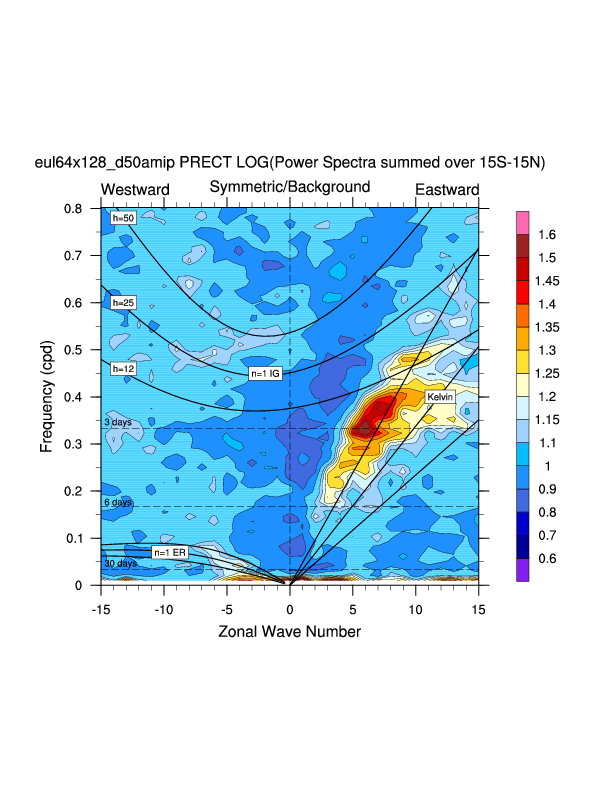
| PRECT (precipitation rate) | b.e15.B1850.f09_g16.pi_control.all.119.hf | TRMM (lat-lon 1-degree) | CAM3 Amip (T42) |
|---|---|---|---|
| Anti-symmetric raw power spectra (WK99 Fig. 1a) | plot | plot | plot |
| Symmetric raw power spectra (WK99 Fig. 1b) | plot | plot | plot |
| Background power spectra (WK99 Fig. 2) | plot | plot | plot |
| Anti-symmetric/background power spectra (WK99 Fig. 3a) | plot | plot | plot |
| Symmetric/background power spectra (WK99 Fig. 3b) | plot | plot | plot |
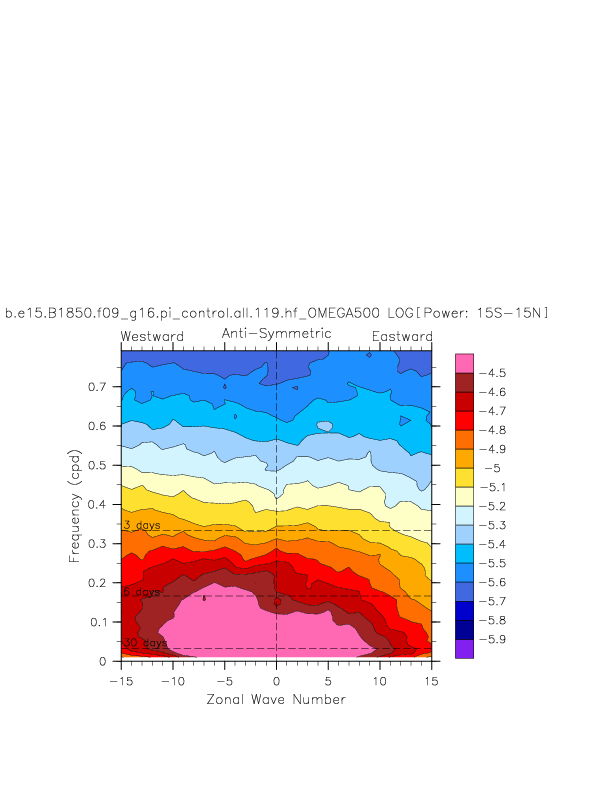
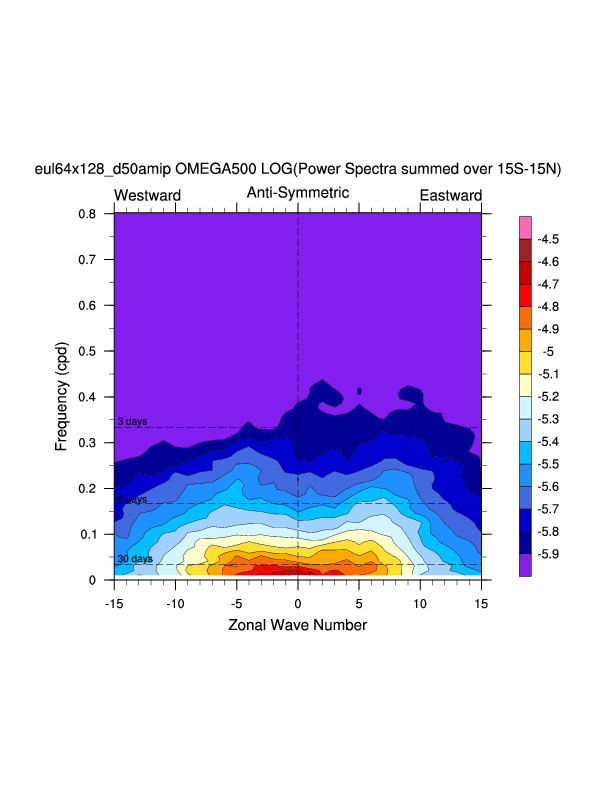
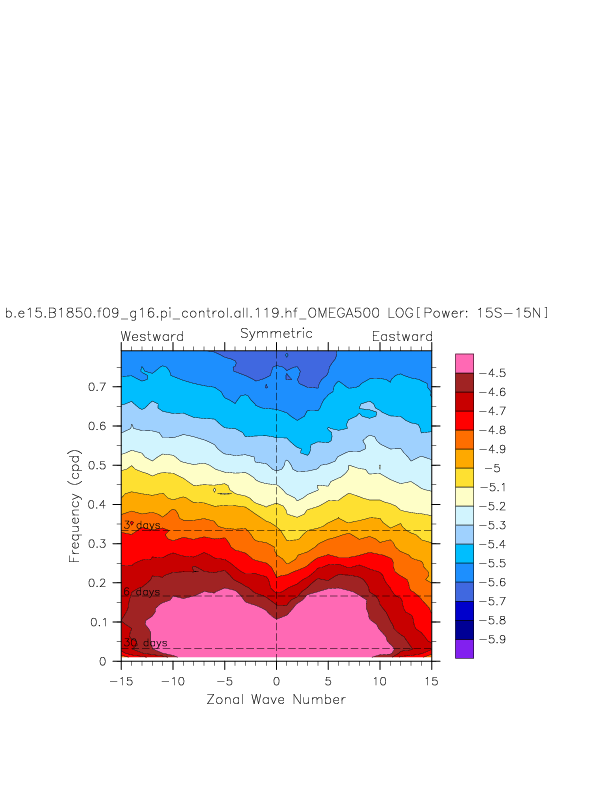
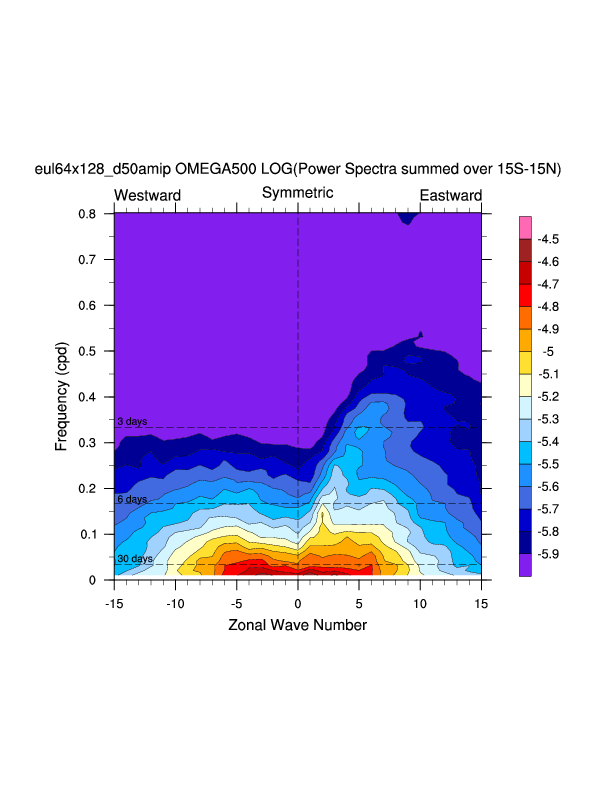
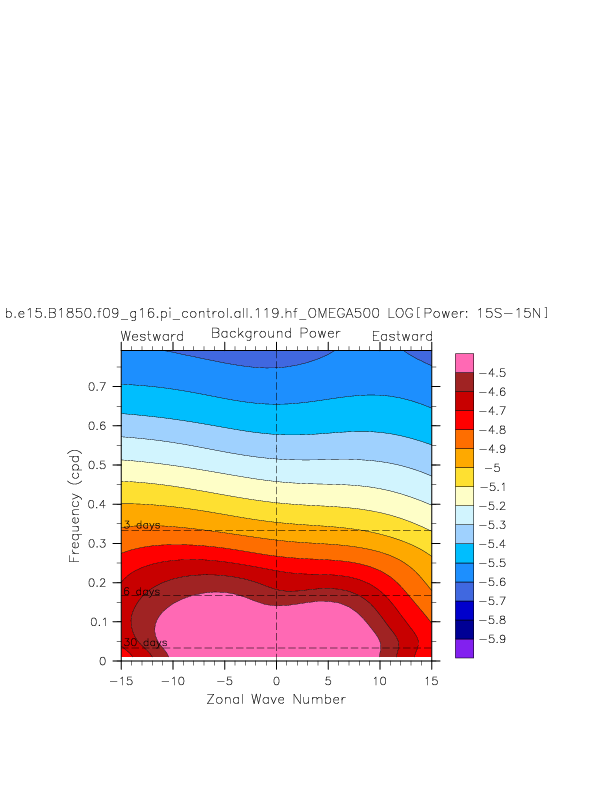
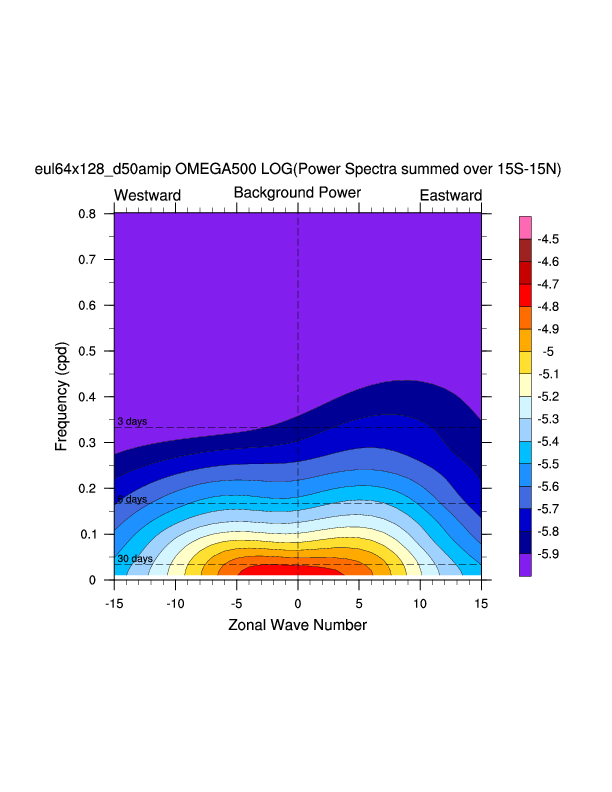
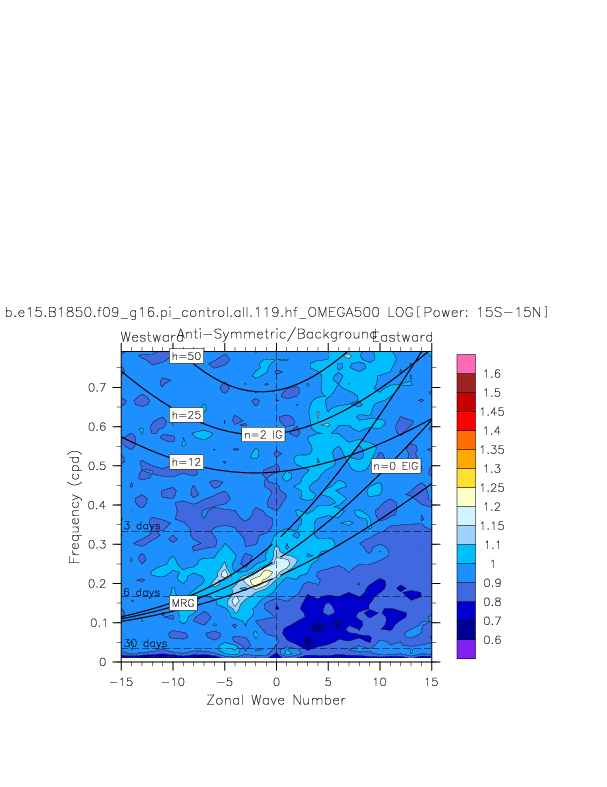
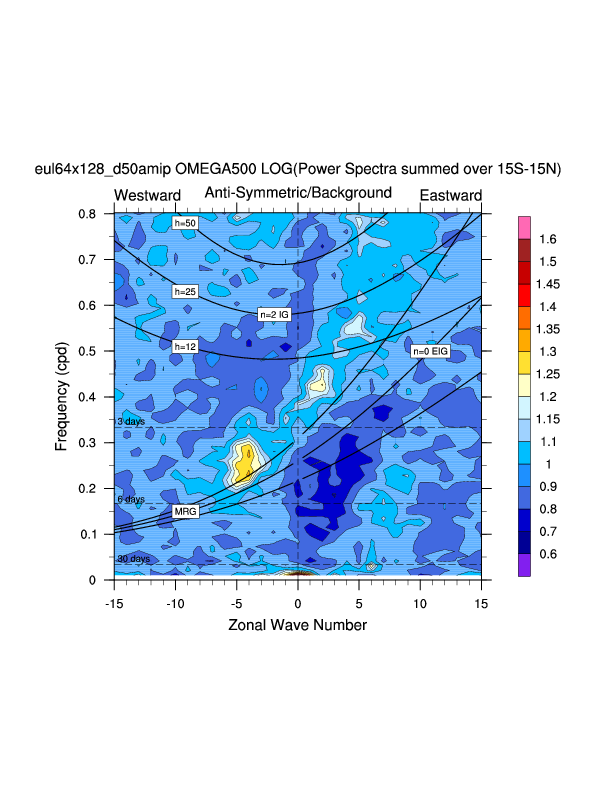
| OMEGA500 (500 mb vertical velocity) | b.e15.B1850.f09_g16.pi_control.all.119.hf | NCEP | CAM3 Amip (T42) |
|---|---|---|---|
| Anti-symmetric raw power spectra (WK99 Fig. 1a) | plot | plot | plot |
| Symmetric raw power spectra (WK99 Fig. 1b) | plot | plot | plot |
| Background power spectra (WK99 Fig. 2) | plot | plot | plot |
| Anti-symmetric/background power spectra (WK99 Fig. 3a) | plot | plot | plot |
| Symmetric/background power spectra (WK99 Fig. 3b) | plot | plot | plot |
OLR:
OLR ANOMALIES:
U200:
U200 ANOMALIES:
U850:
U850 ANOMALIES: