
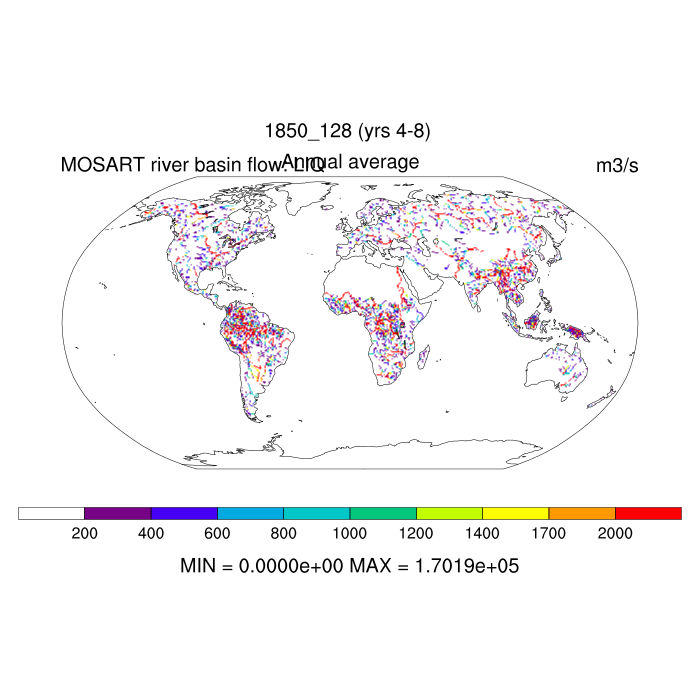
b.e20.B1850.f09_g16.pi_control.all.128
and
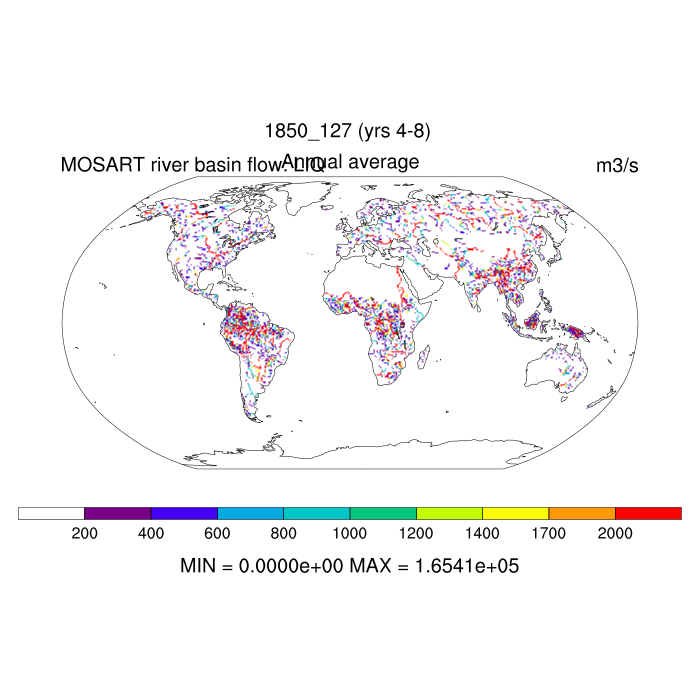
b.e20.B1850.f09_g16.pi_control.all.127
Set 7 Description: Line plots, tables, and maps of RTM river flow and discharge to oceans
| TABLE | ||
|---|---|---|
| RTM flow at station for world's 50 largest rivers | table | |
| SCATTER PLOTS | ||
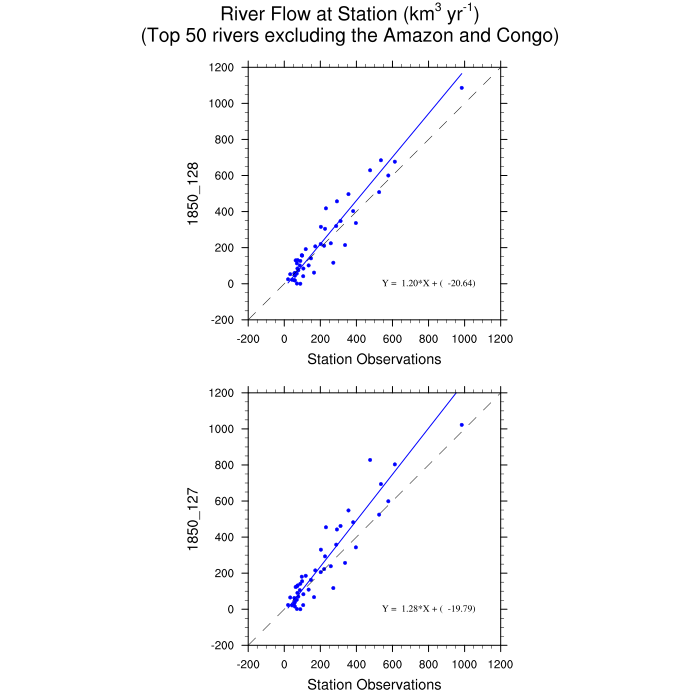
| RTM flow at station versus obs for world's 50 largest rivers (QCHANR) | plot | |
| LINE PLOTS | ||
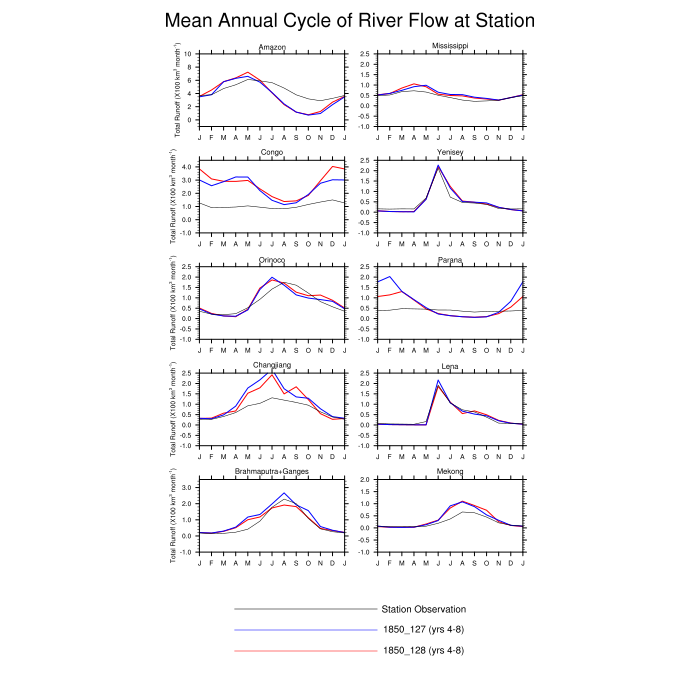
| Mean annual cycle of river flow at station for world's 10 largest rivers (QCHANR) | plot | |
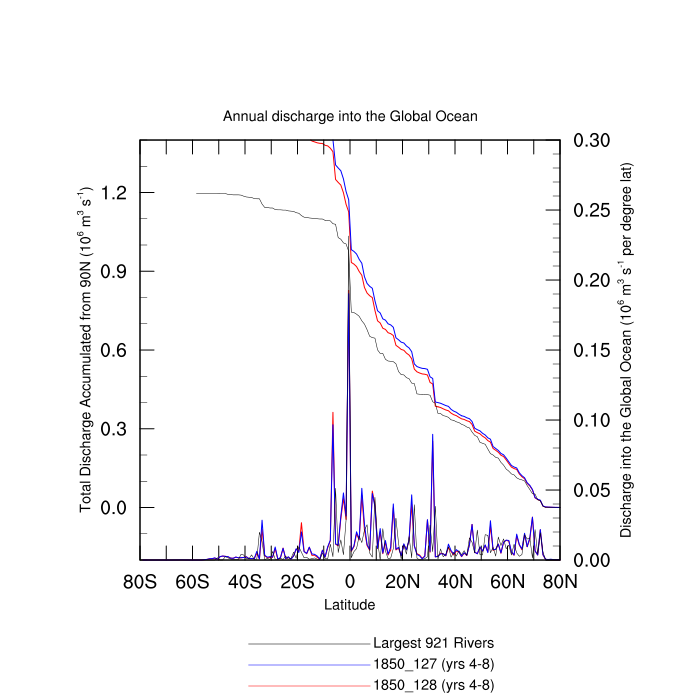
| Annual discharge into the Global Ocean (QCHOCNR) | plot | |
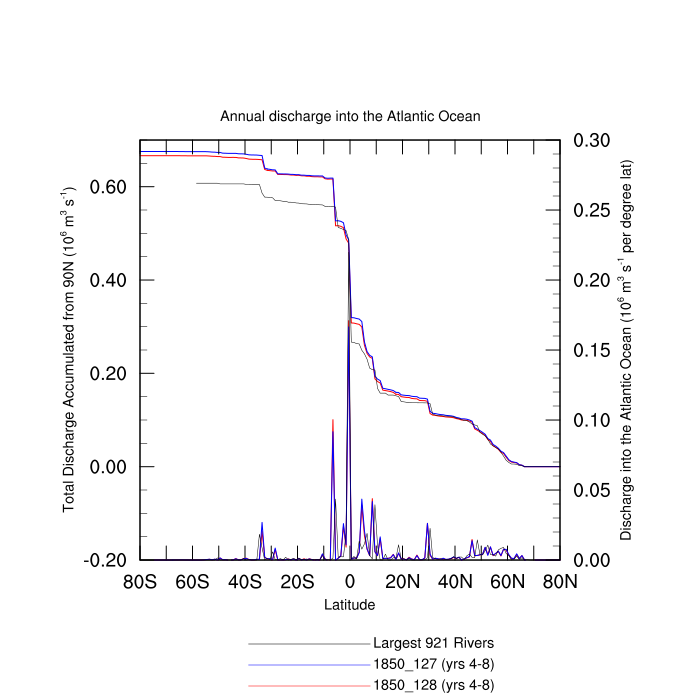
| Annual discharge into the Atlantic Ocean (QCHOCNR) | plot | |
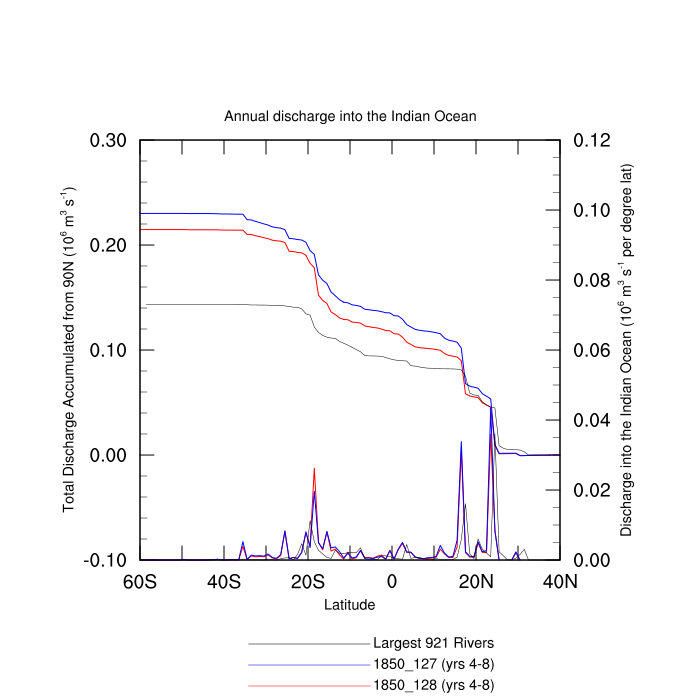
| Annual discharge into the Indian Ocean (QCHOCNR) | plot | |
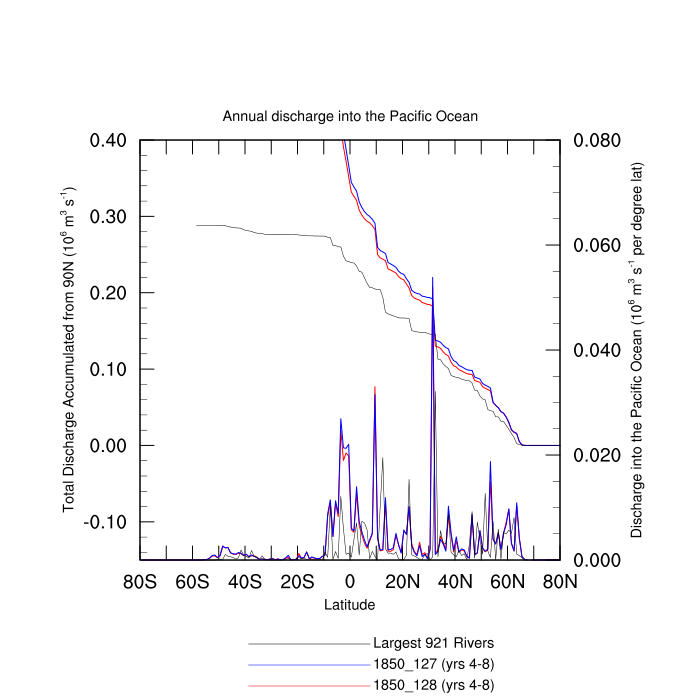
| Annual discharge into the Pacific Ocean (QCHOCNR) | plot | |
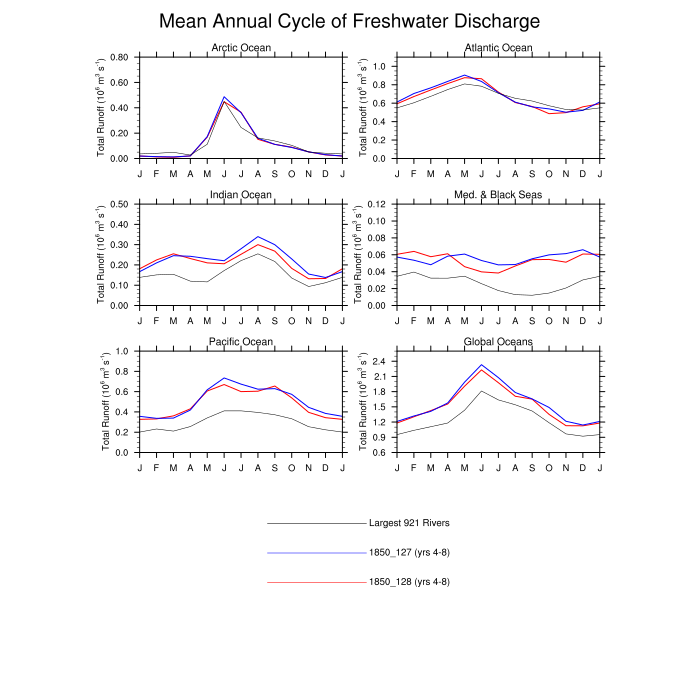
| Mean annual cycle of discharge into the oceans (QCHOCNR) | plot | |
| MAPS | ||
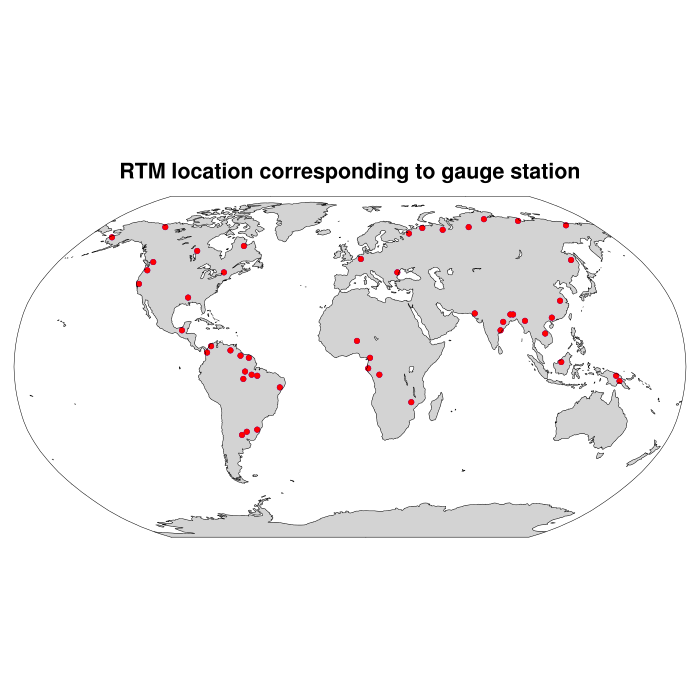
| Station locations (50 largest rivers) | Map | |
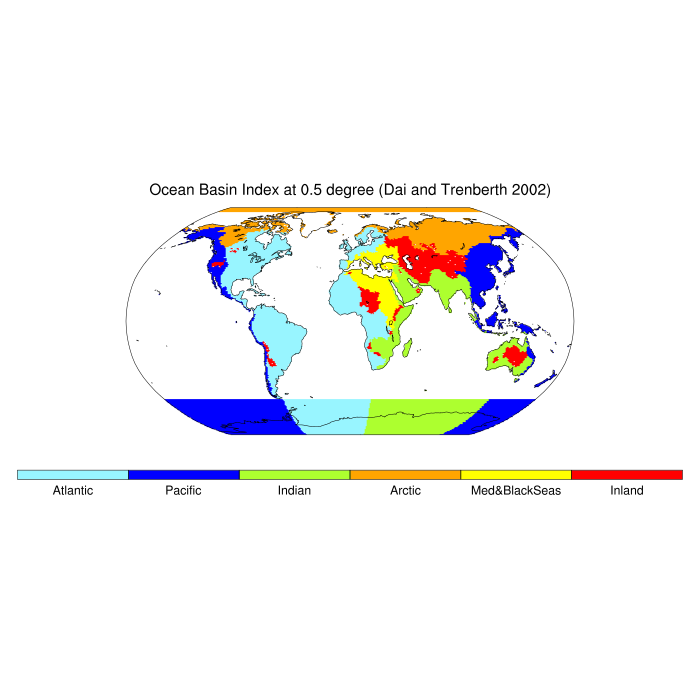
| Ocean Basins | Map | |
| River Flow (QCHANR) | Model1 vs | Model2 |