
b.e20.B1850.f09_g17.pi_control.all.287
and
b.e20.B1850.f09_g17.pi_control.all.286
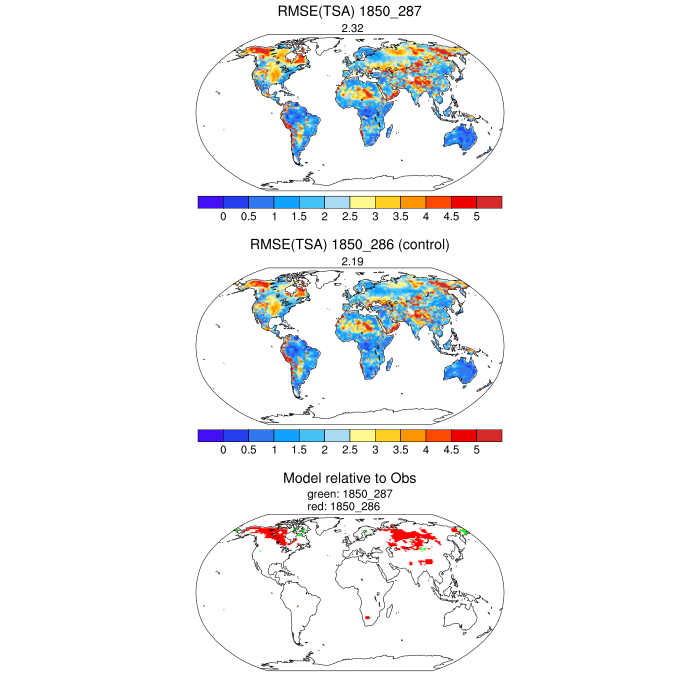
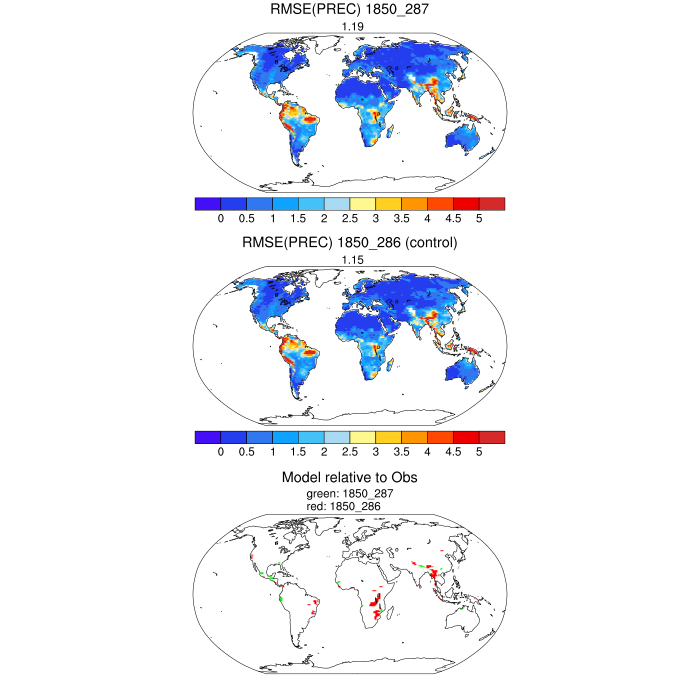
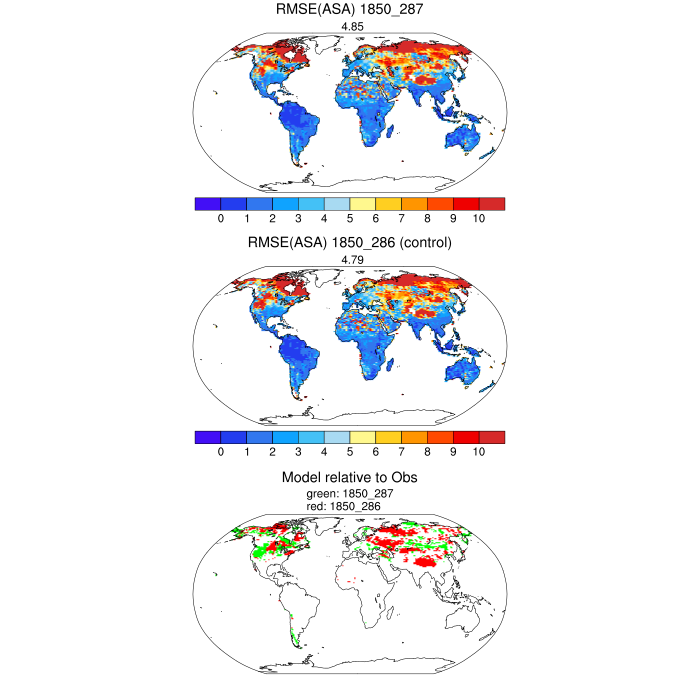
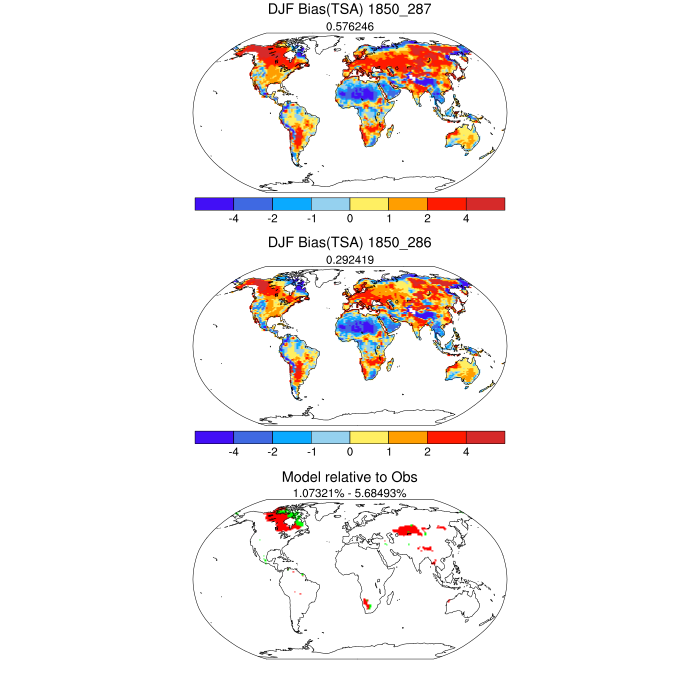
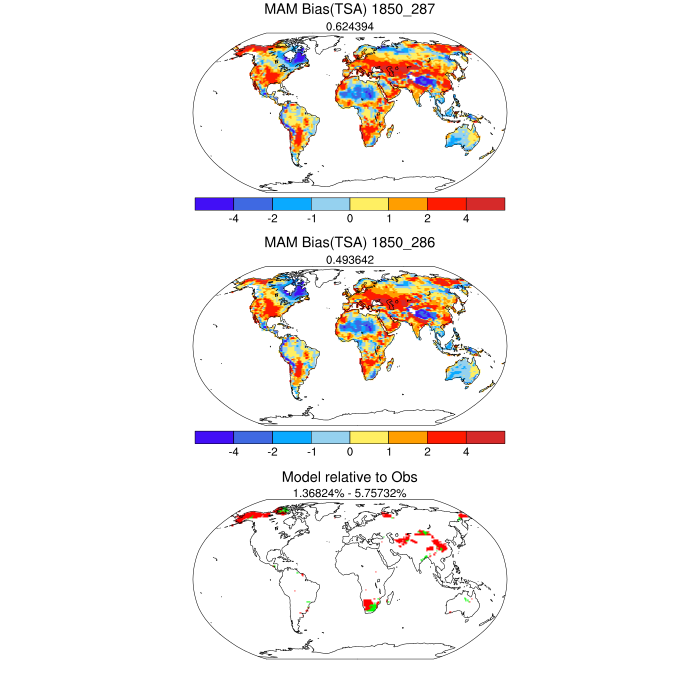
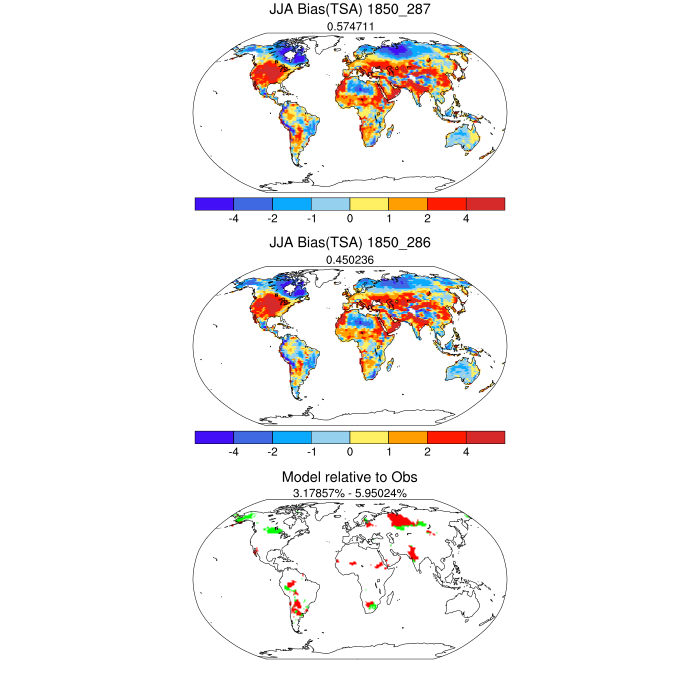
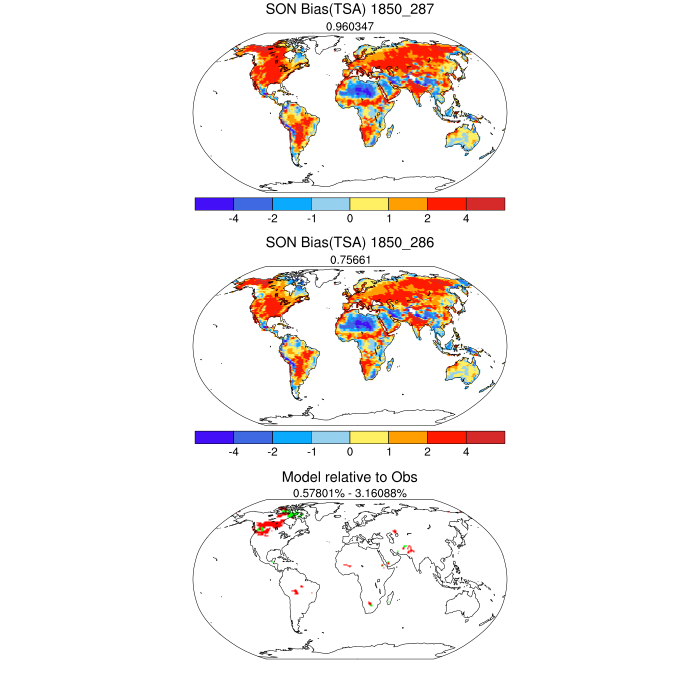
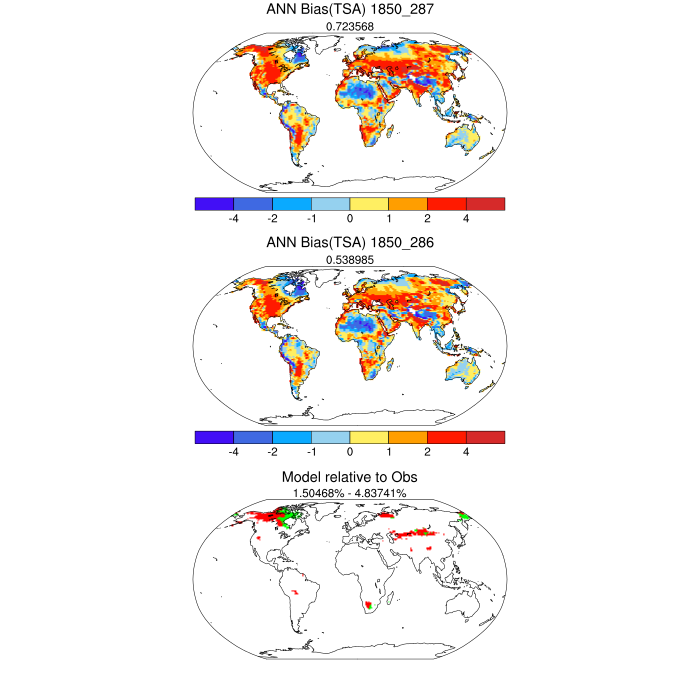
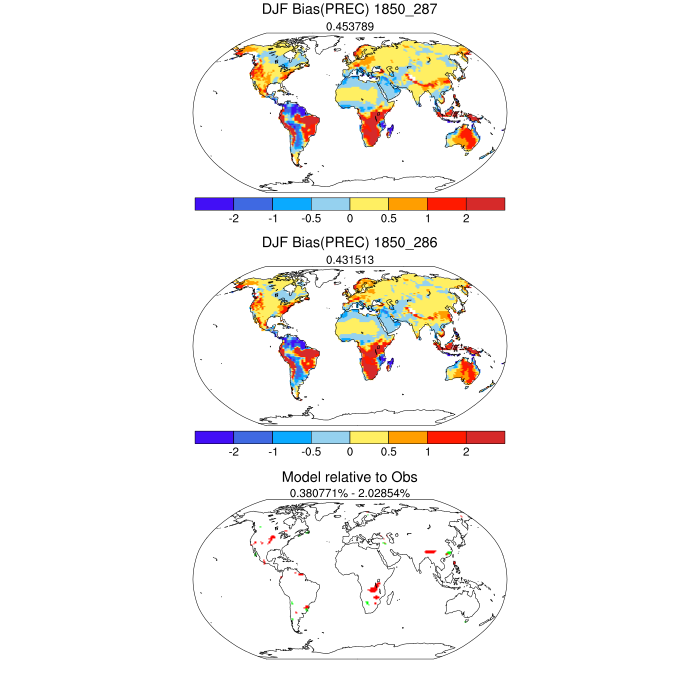
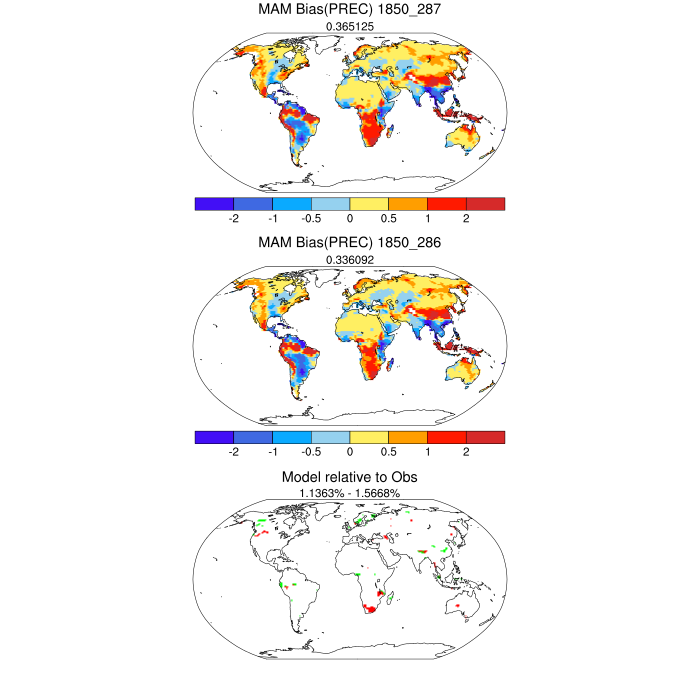
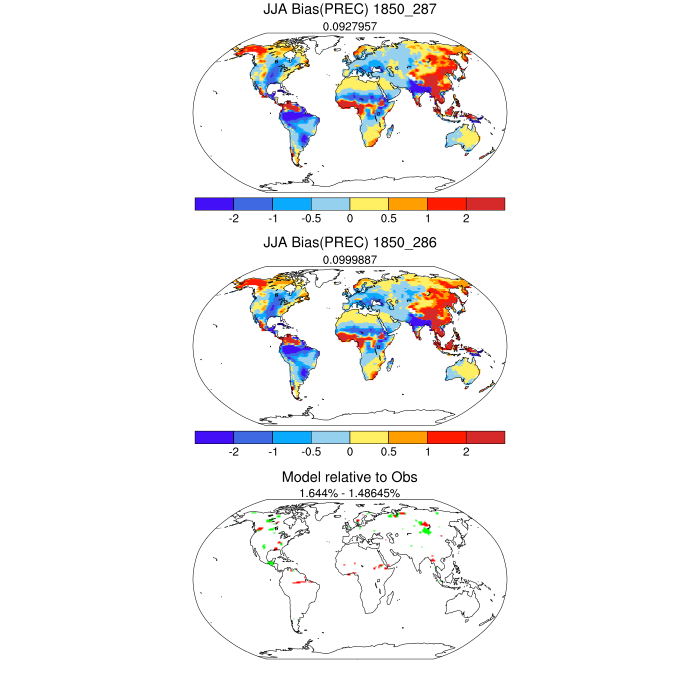
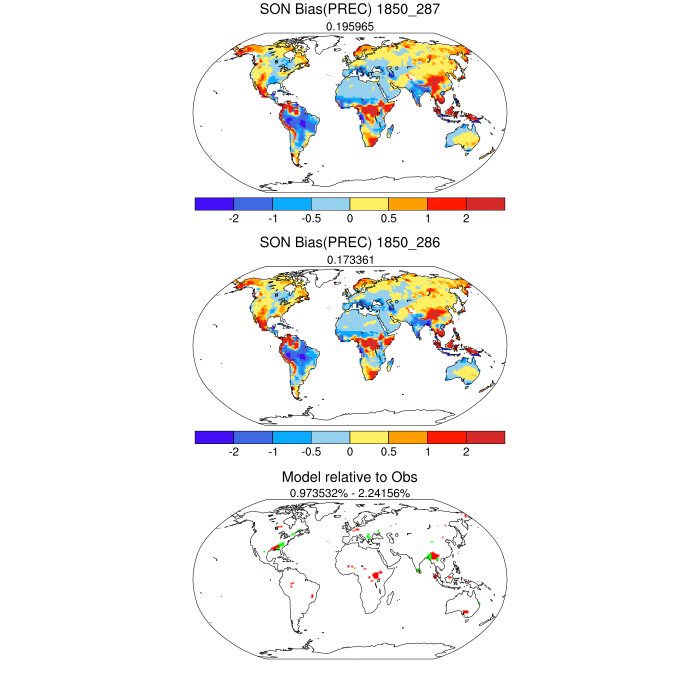
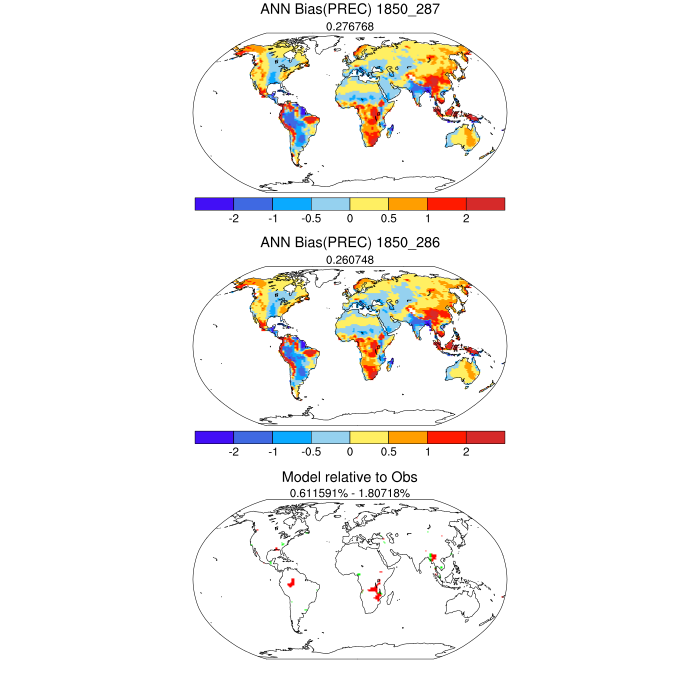
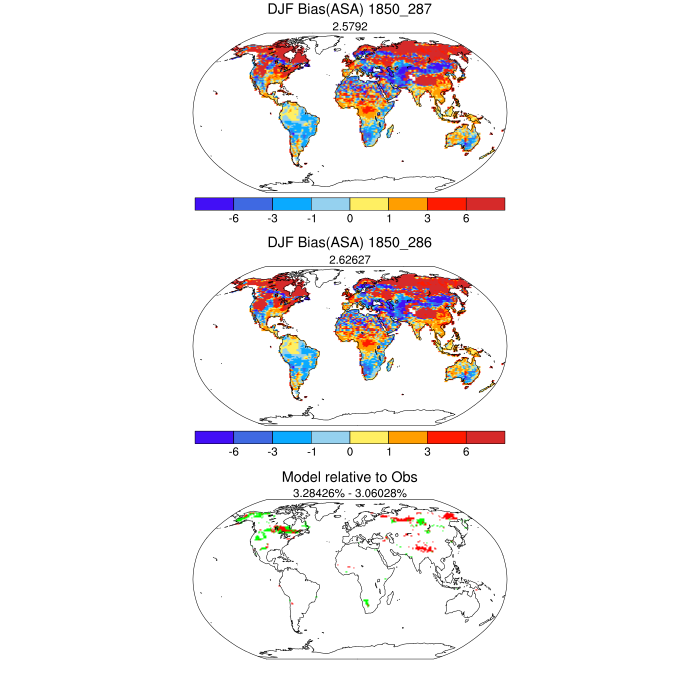
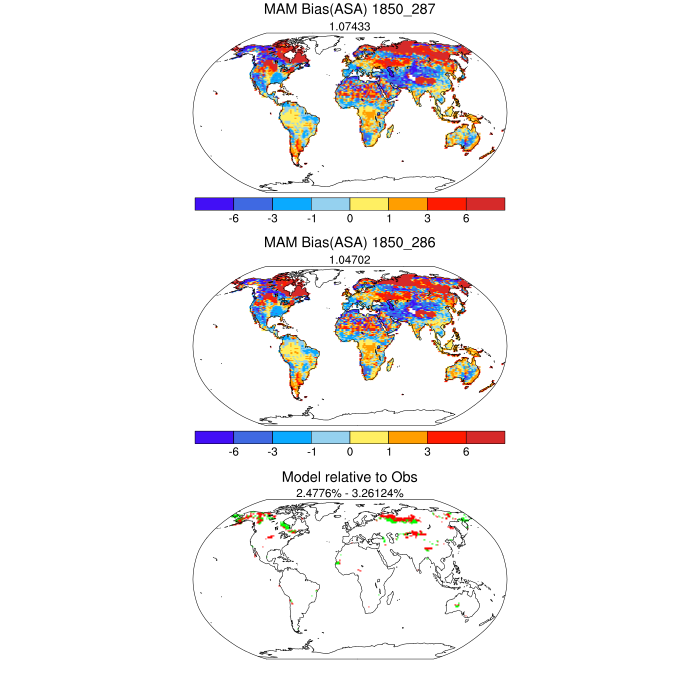
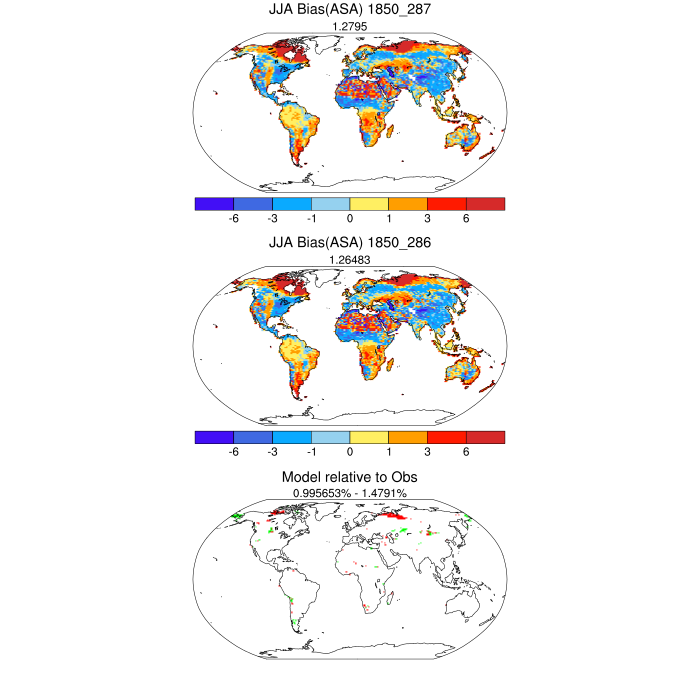
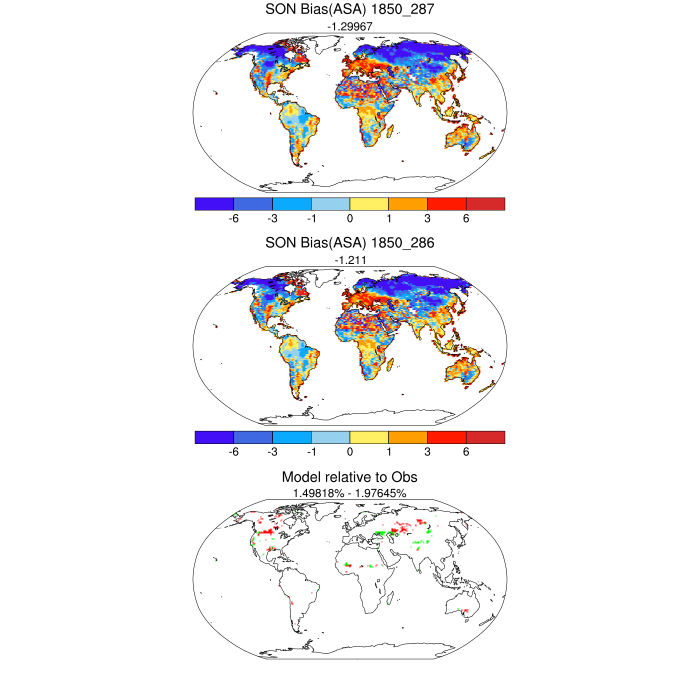
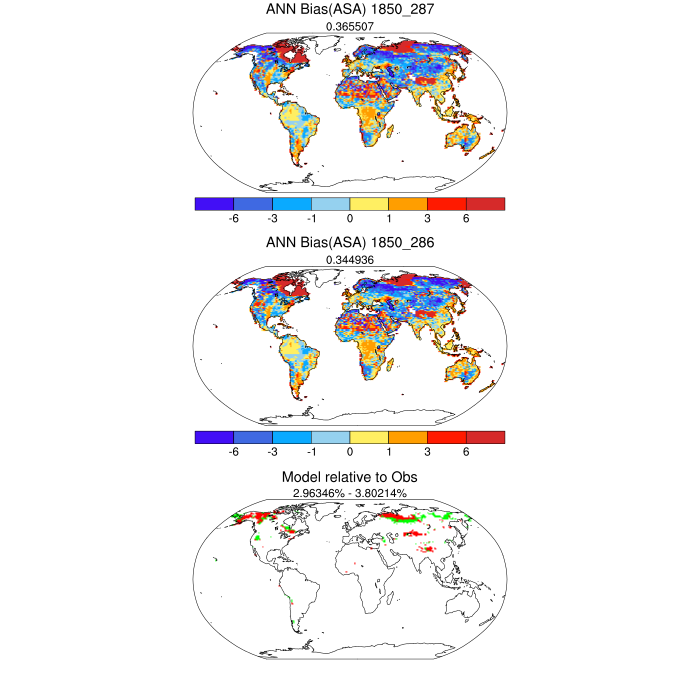
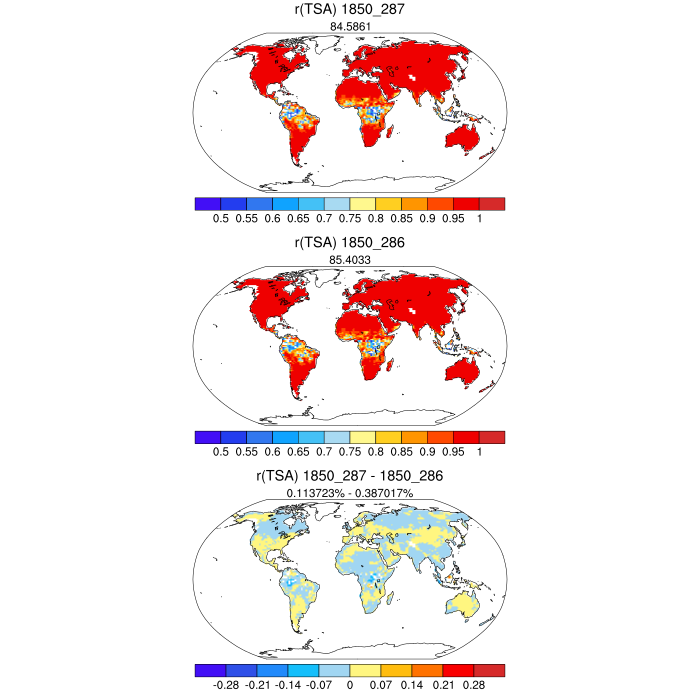
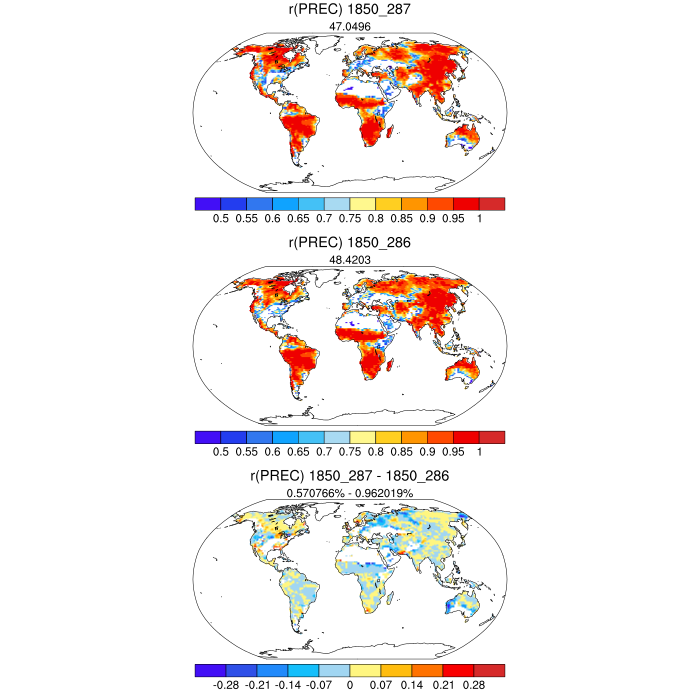
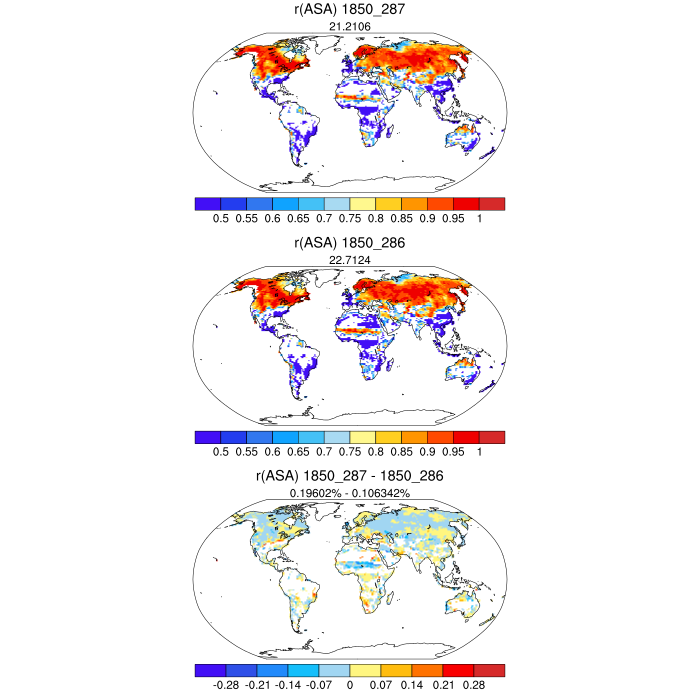
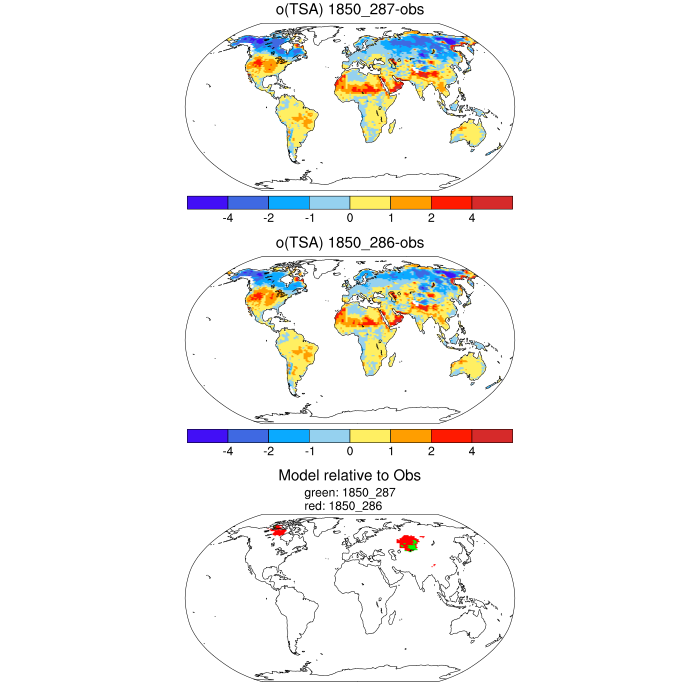
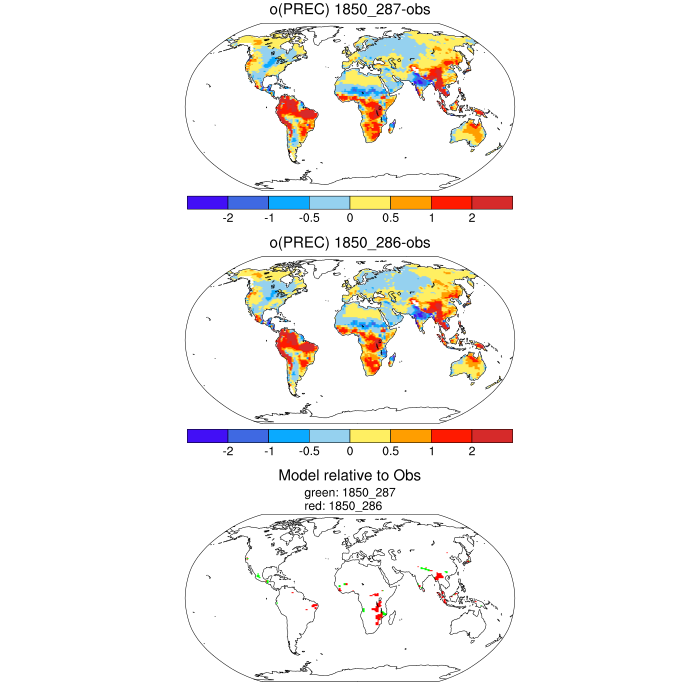
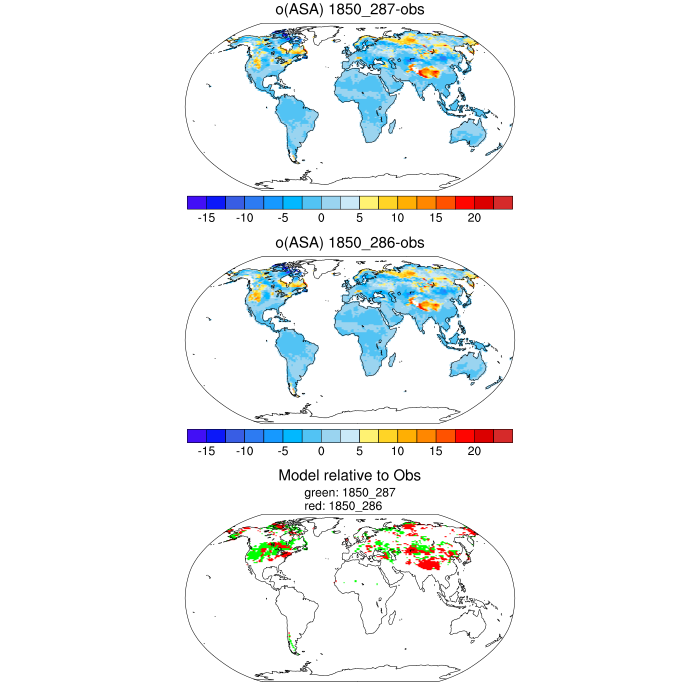
Set 9 Description: Contour plots and statistics for precipitation and temperature. Statistics include DJF, JJA, and ANN biases, and RMSE, correlation and standard deviation of the annual cycle relative to observations
| 1. RMSE | TSA | PREC | ASA | --- | --- | --- |
|---|---|---|---|---|---|---|
| 2. Seasonal bias | ||||||
| TSA | DJF | MAM | JJA | SON | ANN | |
| PREC | DJF | MAM | JJA | SON | ANN | |
| ASA | DJF | MAM | JJA | SON | ANN | |
| LHEAT | --- | --- | --- | --- | --- | |
| GPP | --- | --- | --- | --- | --- | |
| TLAI | --- | --- | --- | --- | --- | |
| 3. Correlation | TSA | PREC | ASA | --- | --- | --- |
| 4. Standard Deviation | TSA | PREC | ASA | --- | --- | --- |
| 5. Tables | --- | |||||