 b30.080_bv_visc
 and
OBS data
b30.080_bv_visc
and
OBS data
DIAG Sets 5 & 6 - Horizontal contour/vector plots of DJF, JJA and ANN means
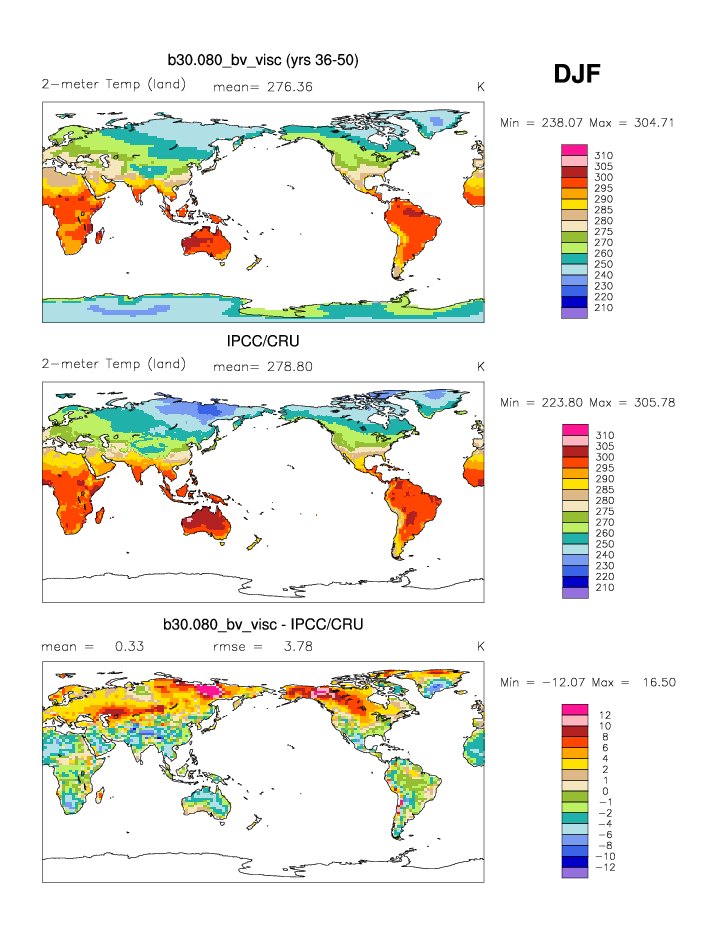
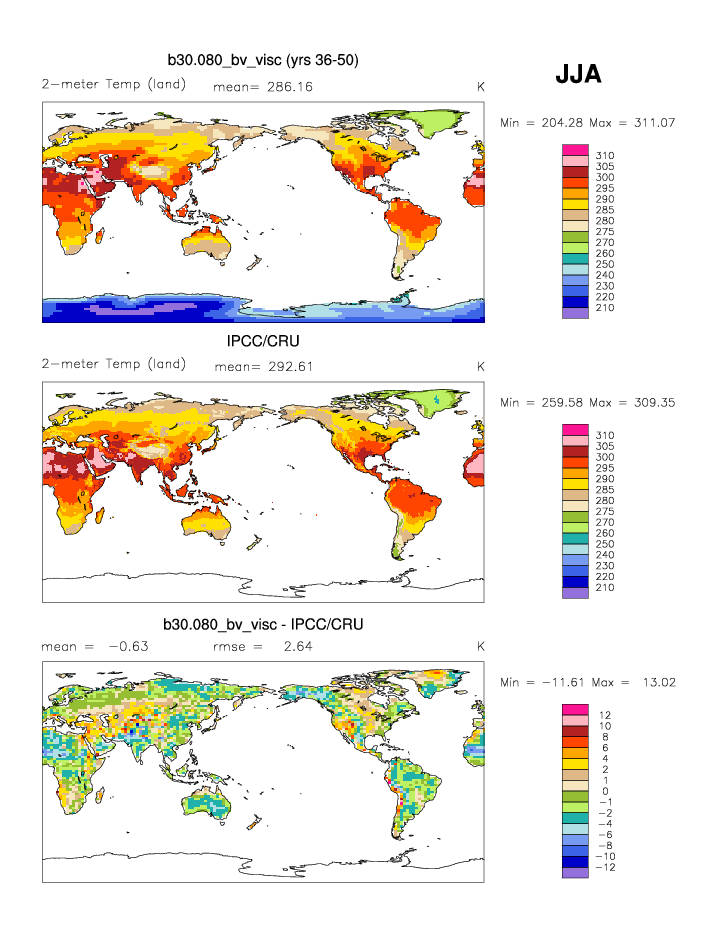
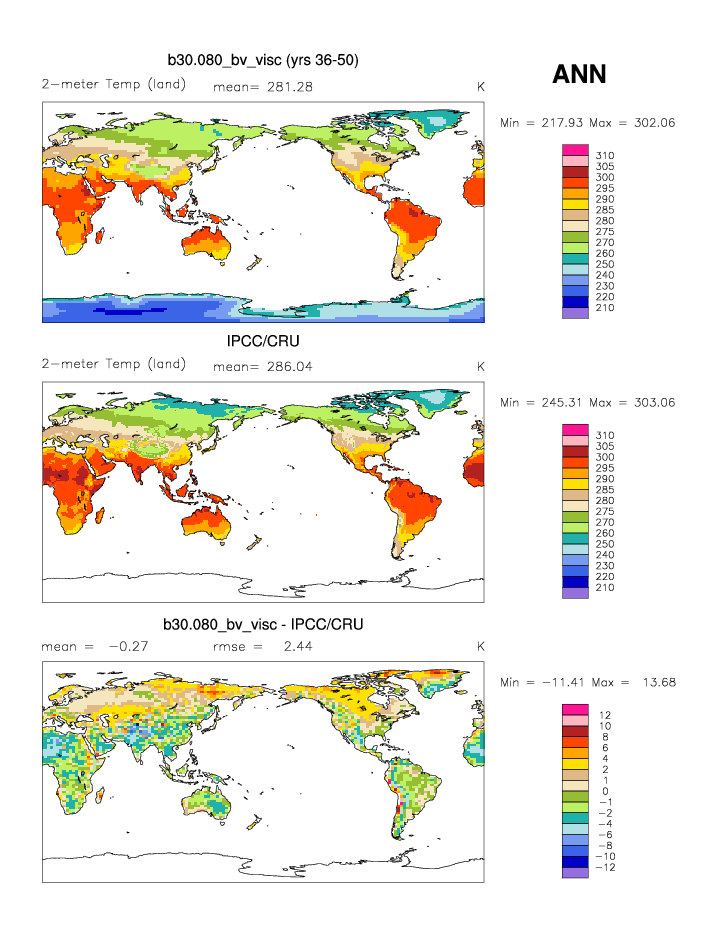
| IPCC/CRU climatology 1961-90 | DJF | JJA | ANN | |
|---|---|---|---|---|
| TREFHT | 2-meter air temperature (land) | plot | plot | plot |
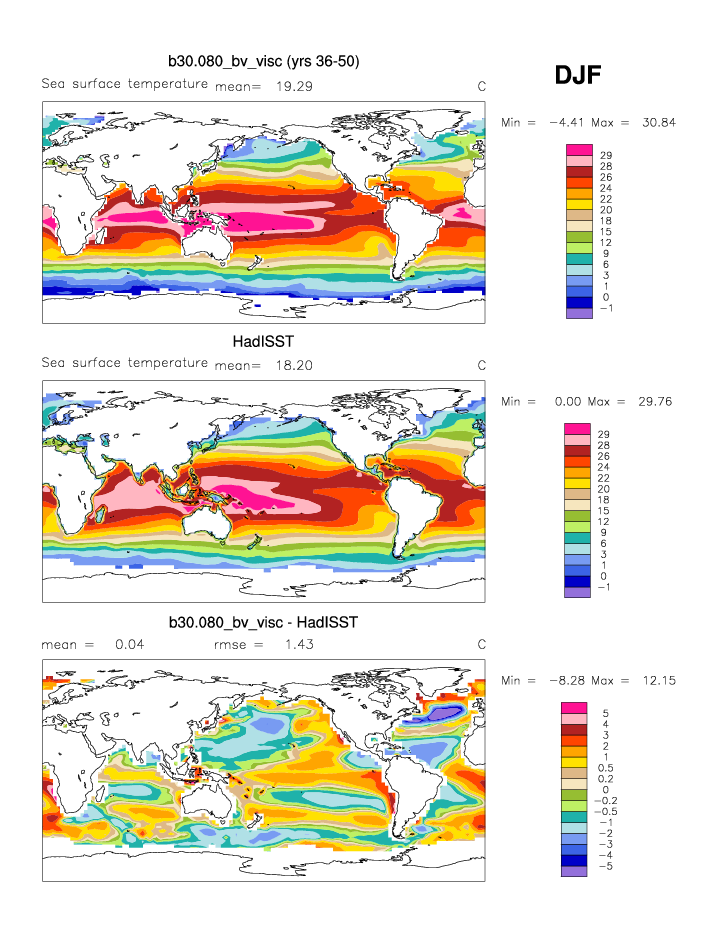
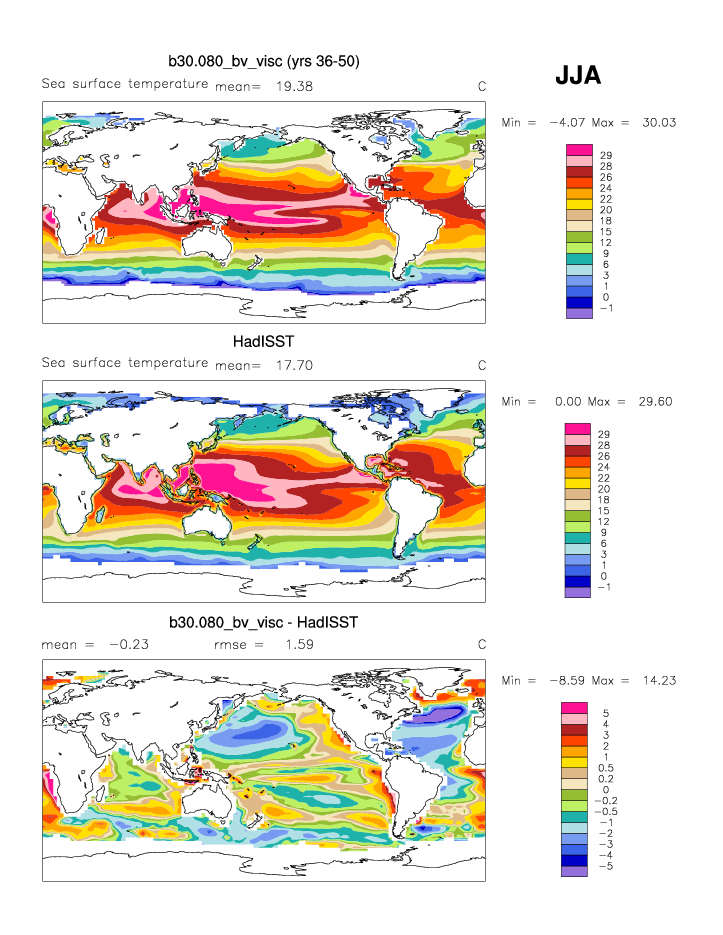
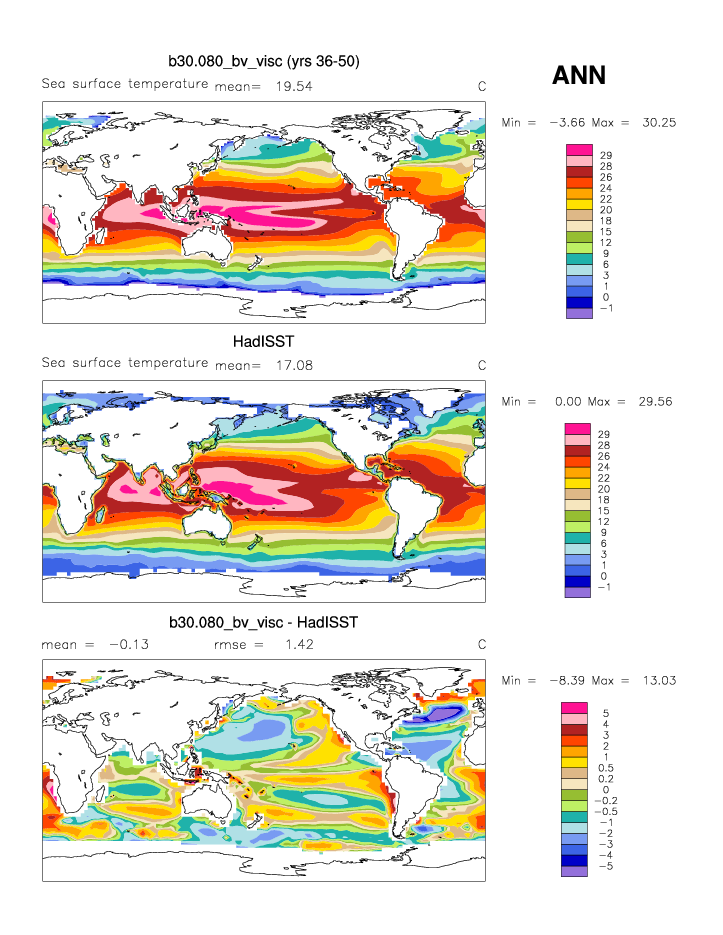
| HadISST/OI.v2 1982-2001 | DJF | JJA | ANN | |
| SST | sea surface temperature | plot | plot | plot |
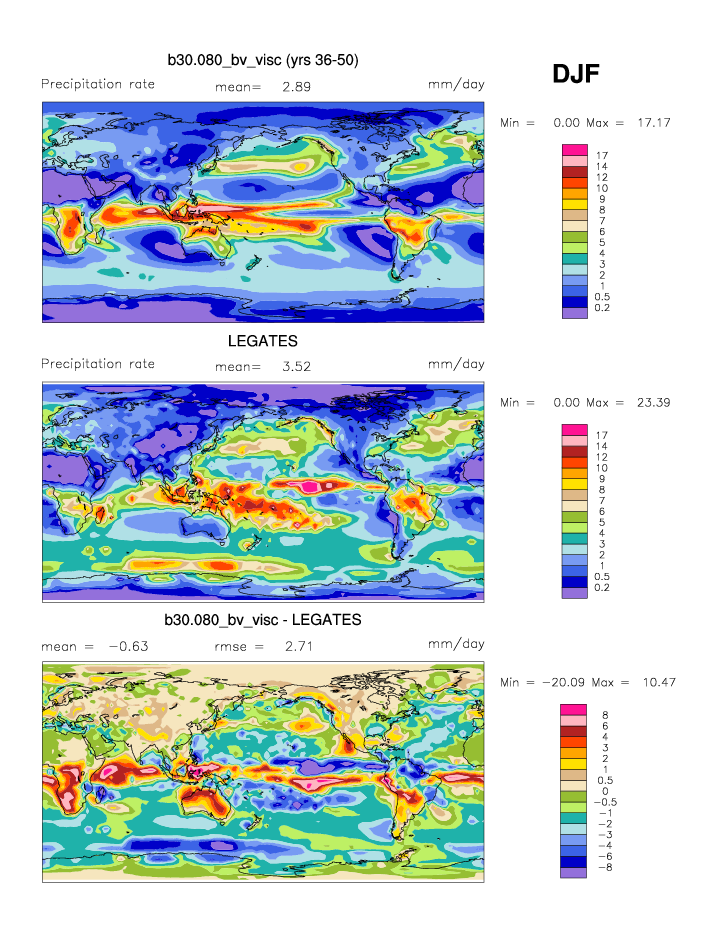
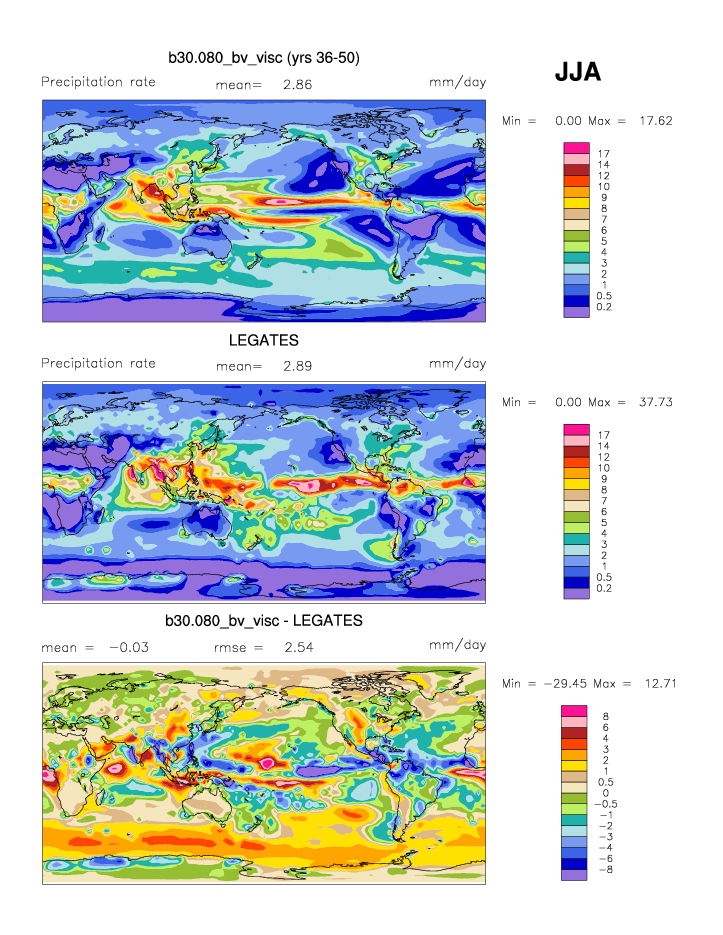
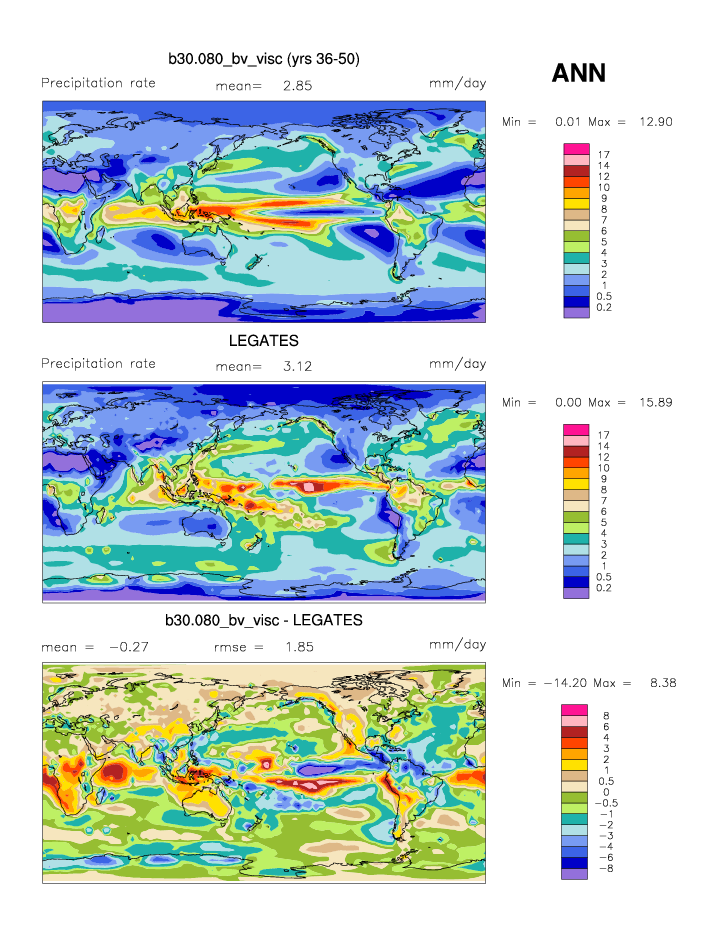
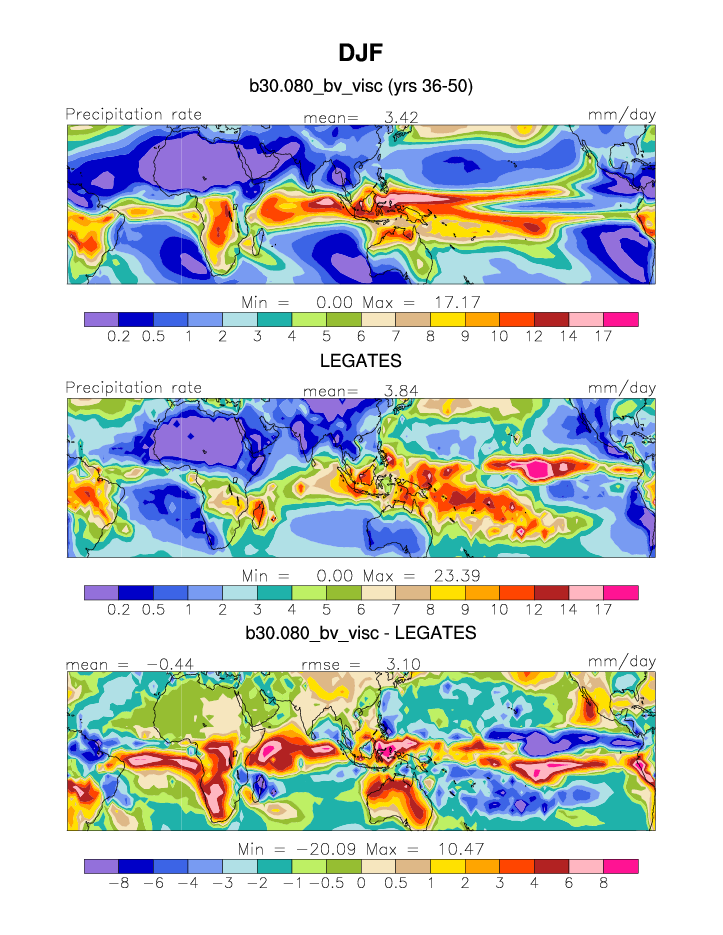
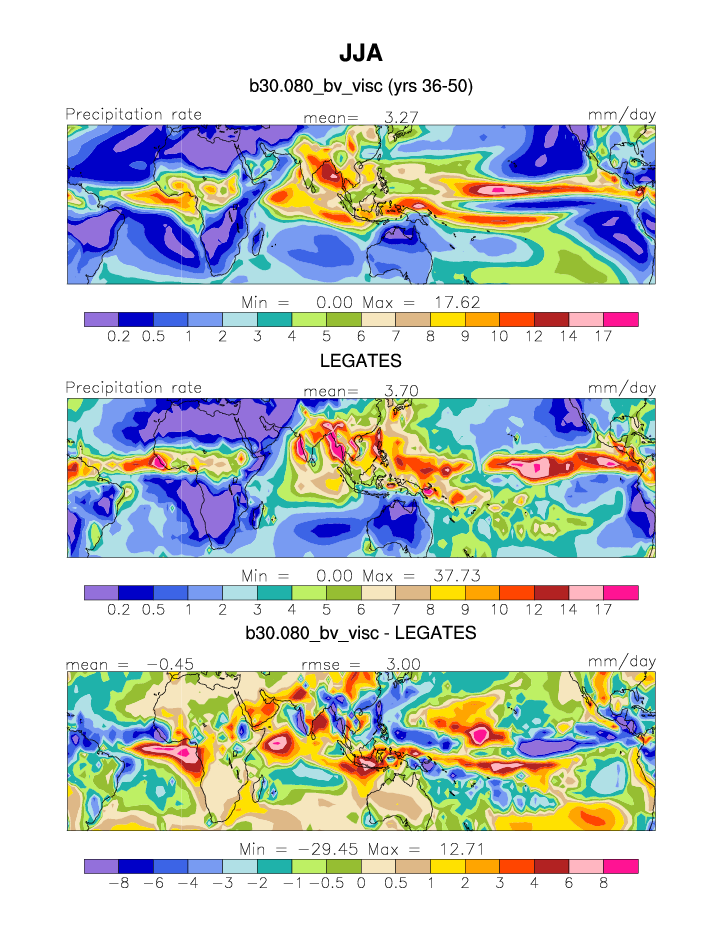
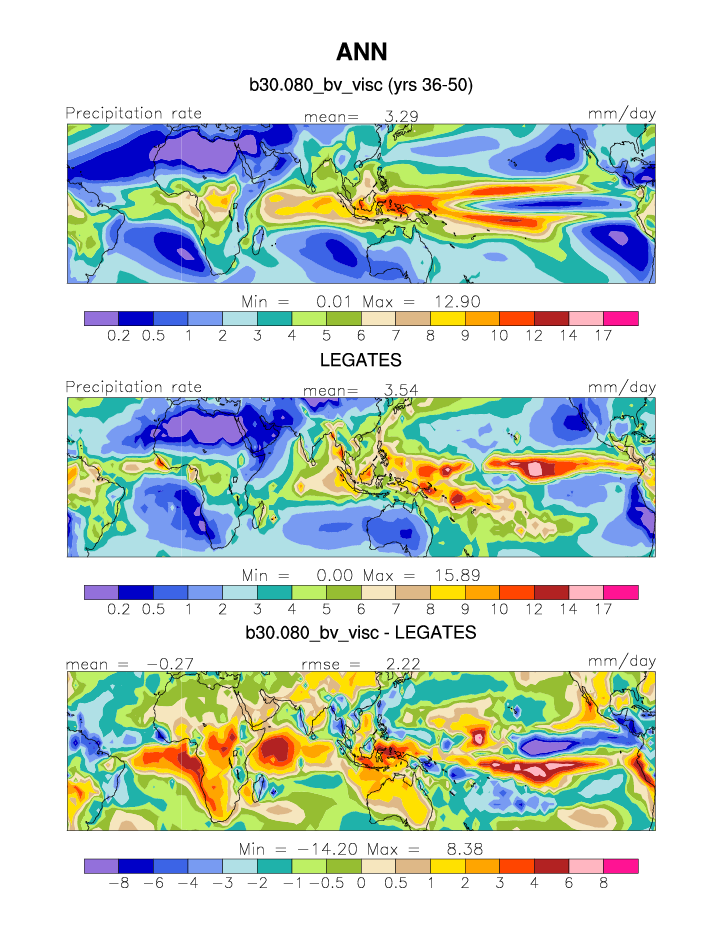
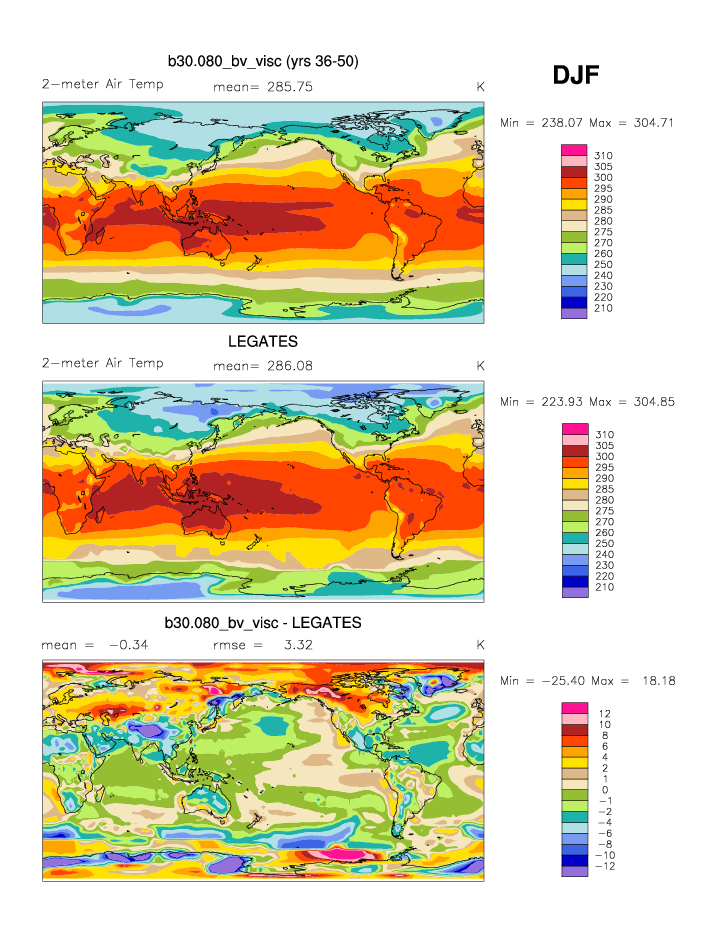
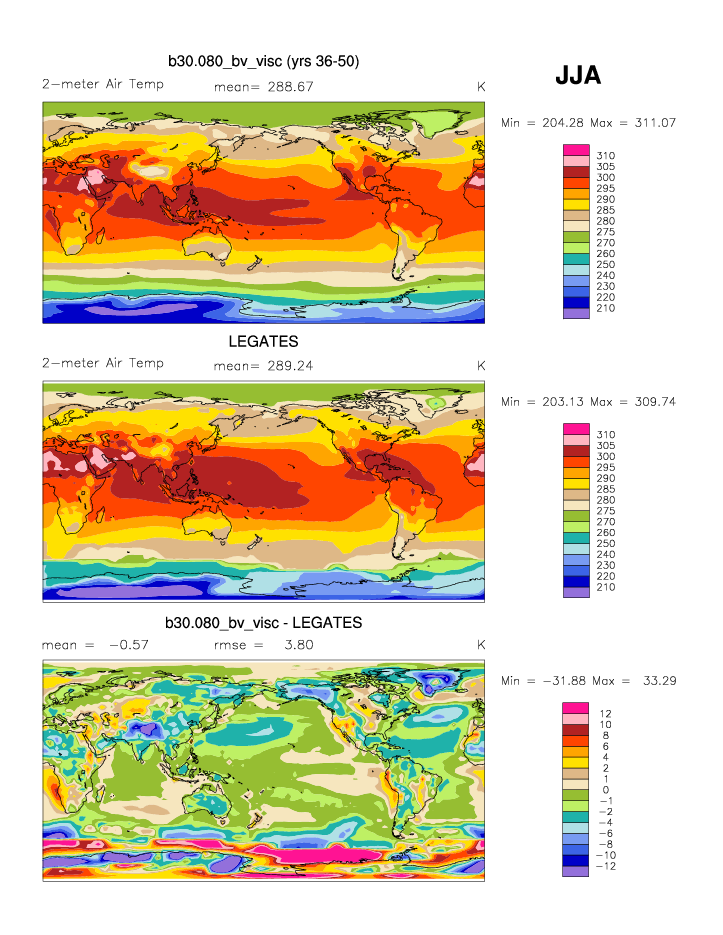
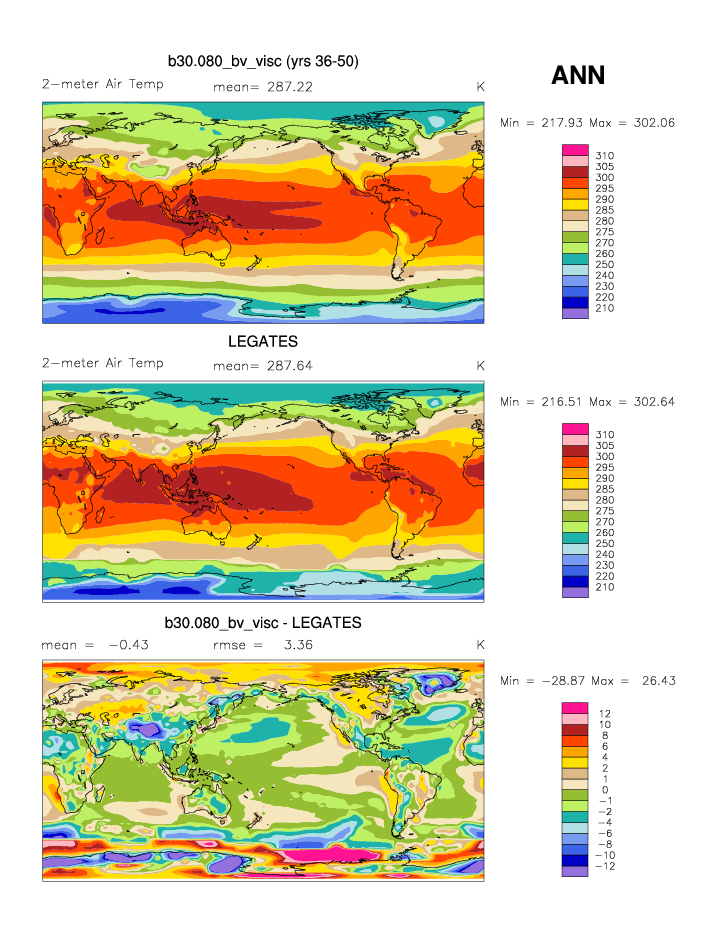
| Legates & Willmott 1920-80 | DJF | JJA | ANN | |
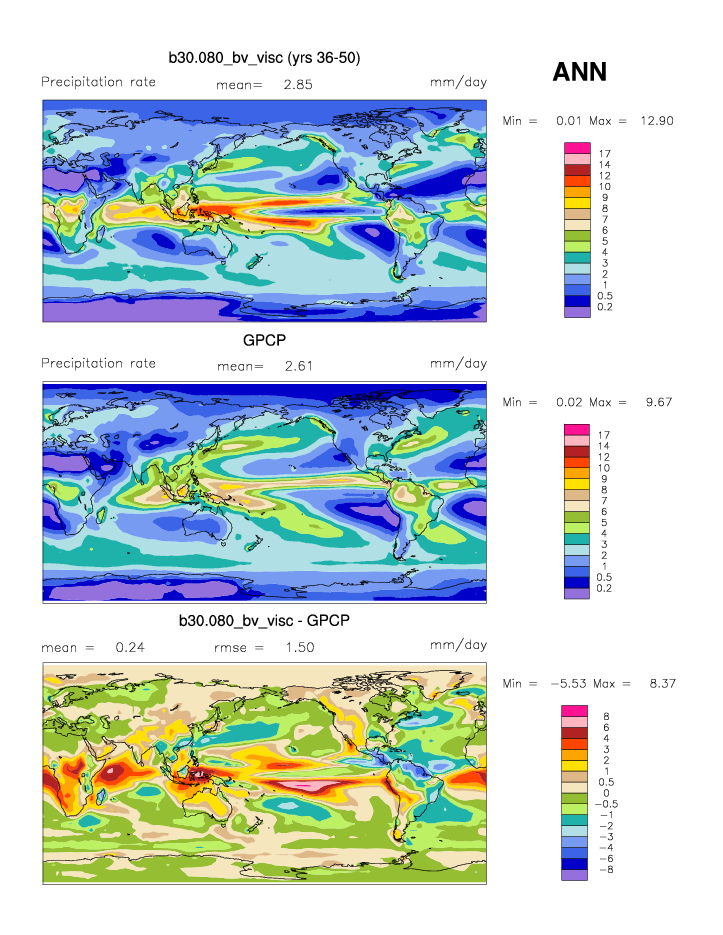
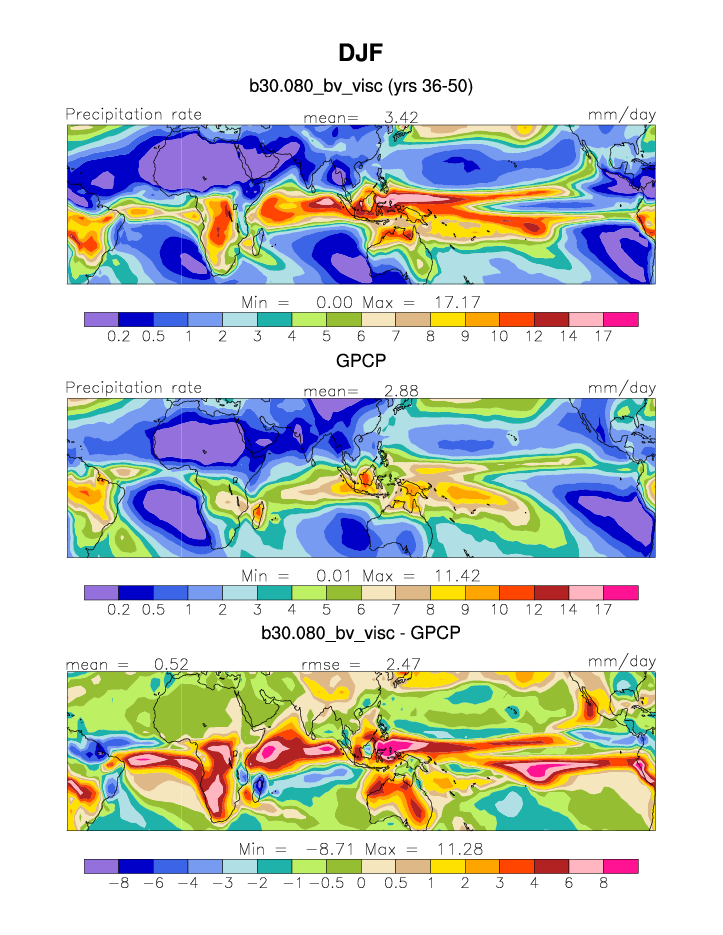
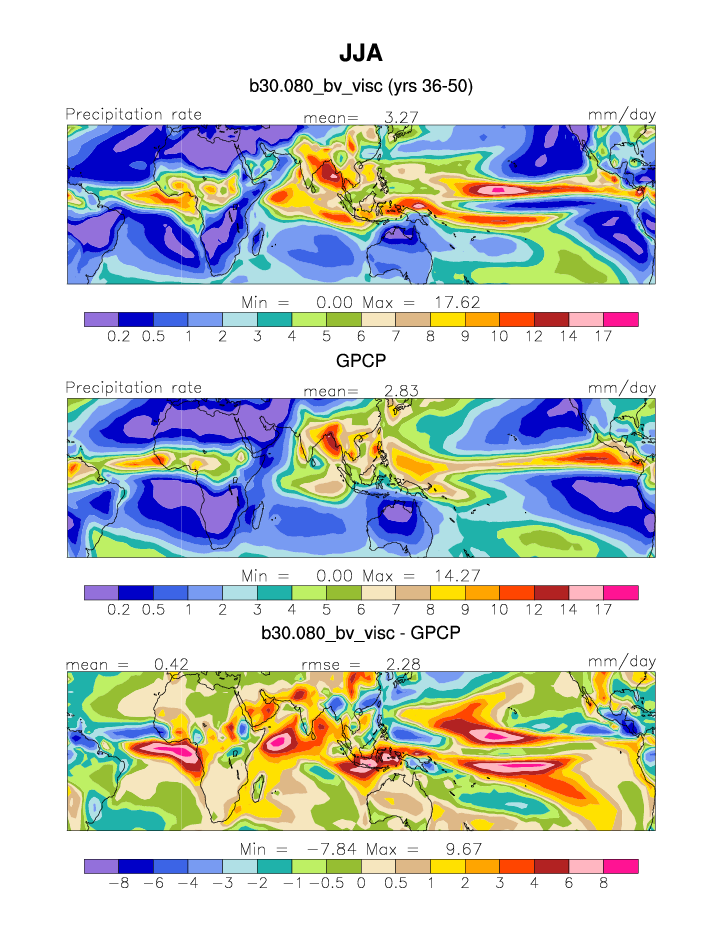
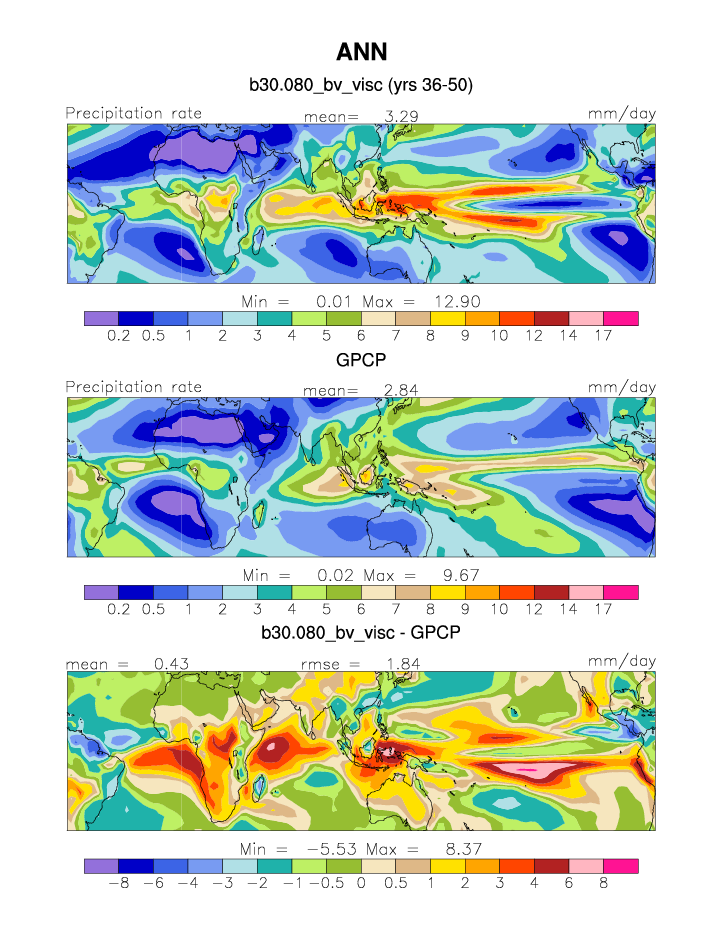
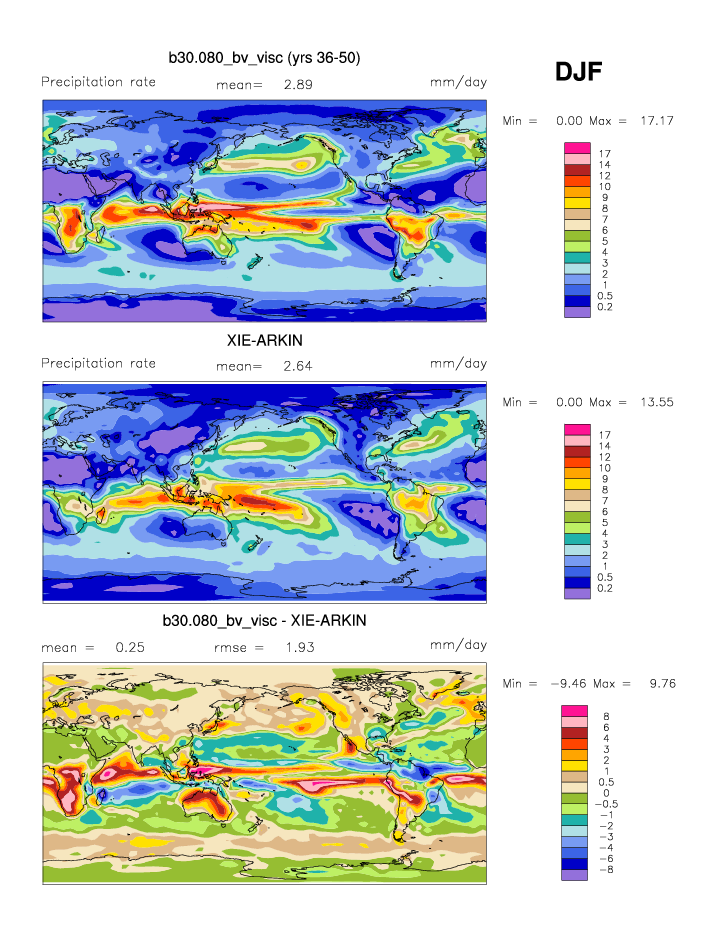
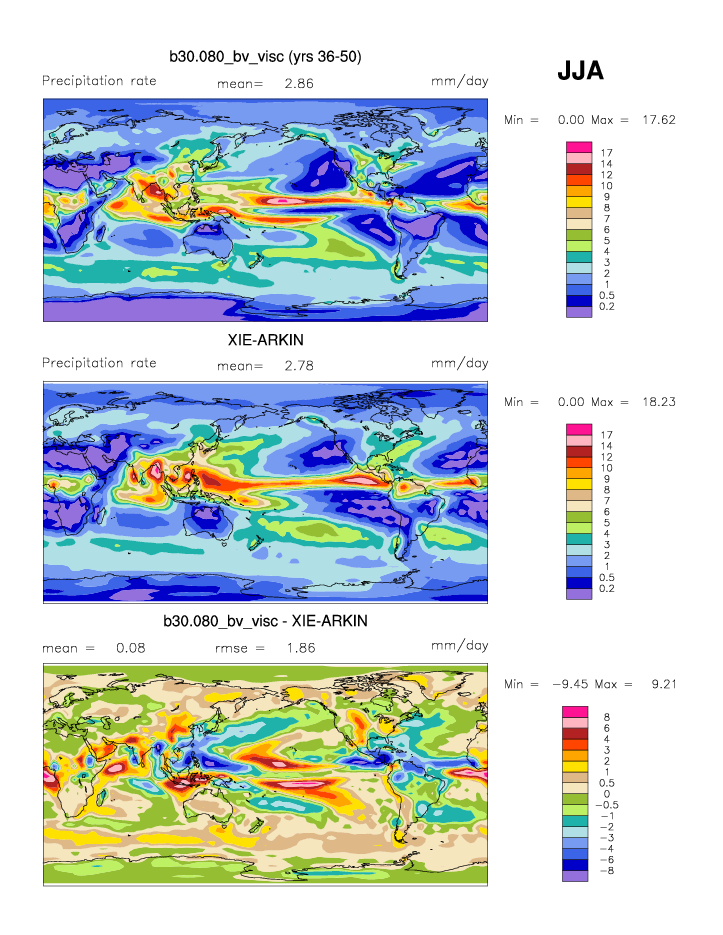
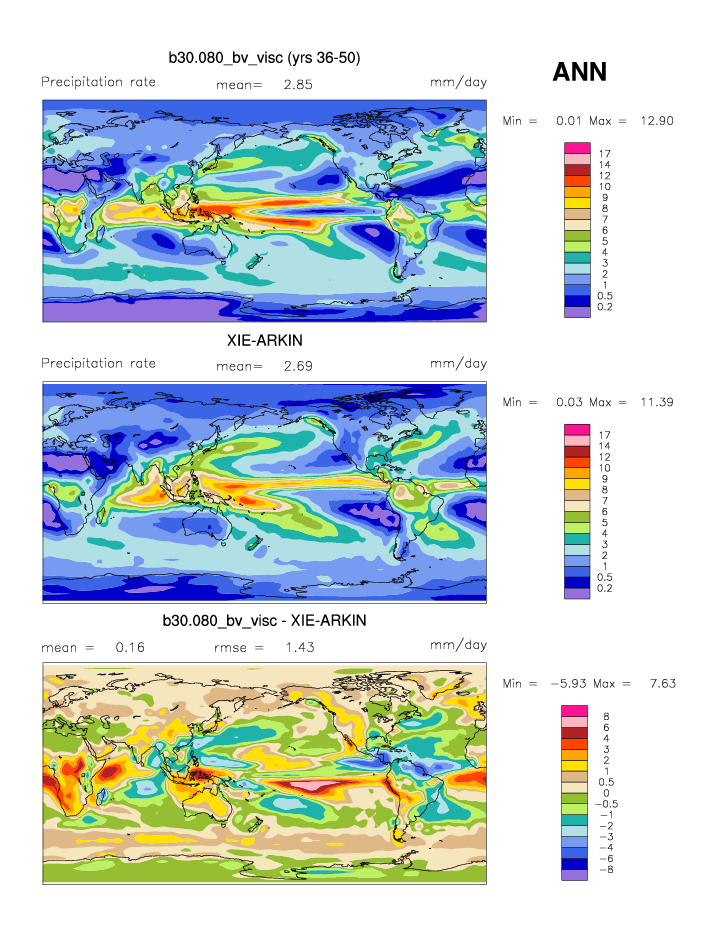
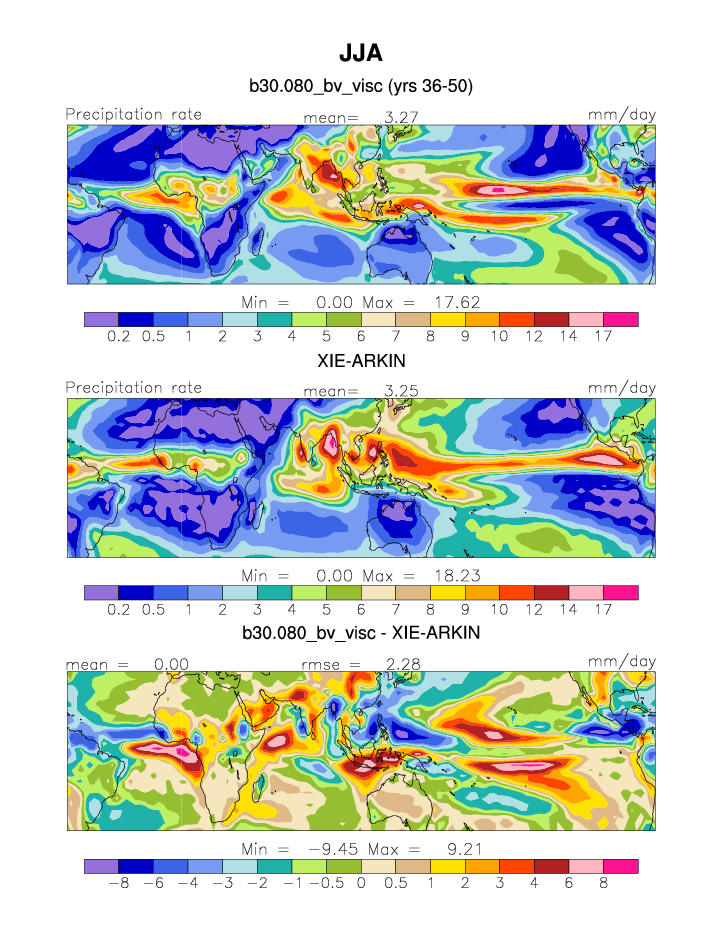
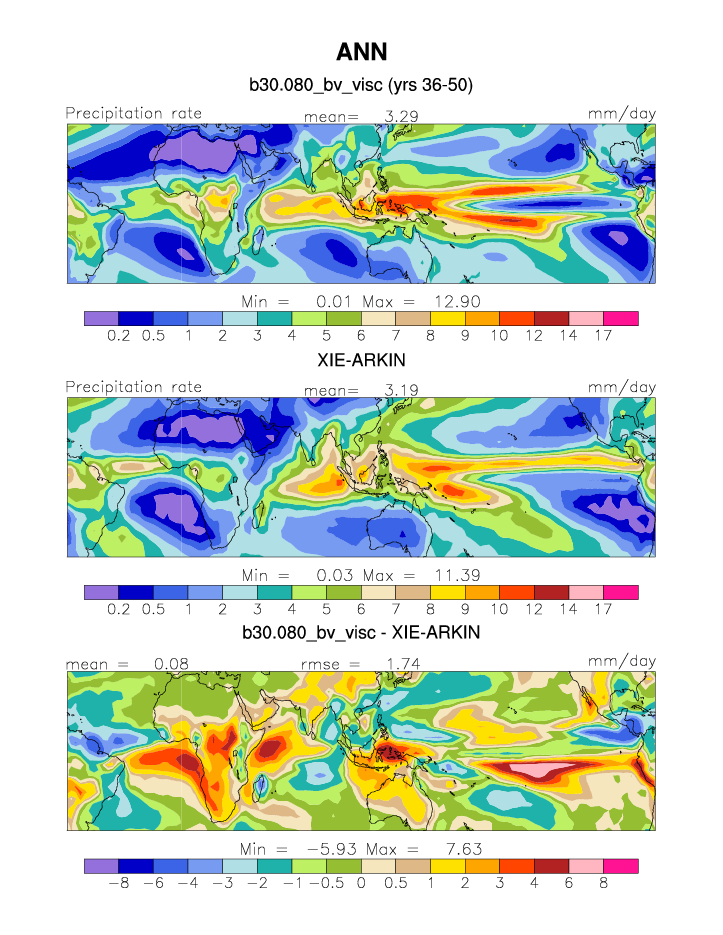
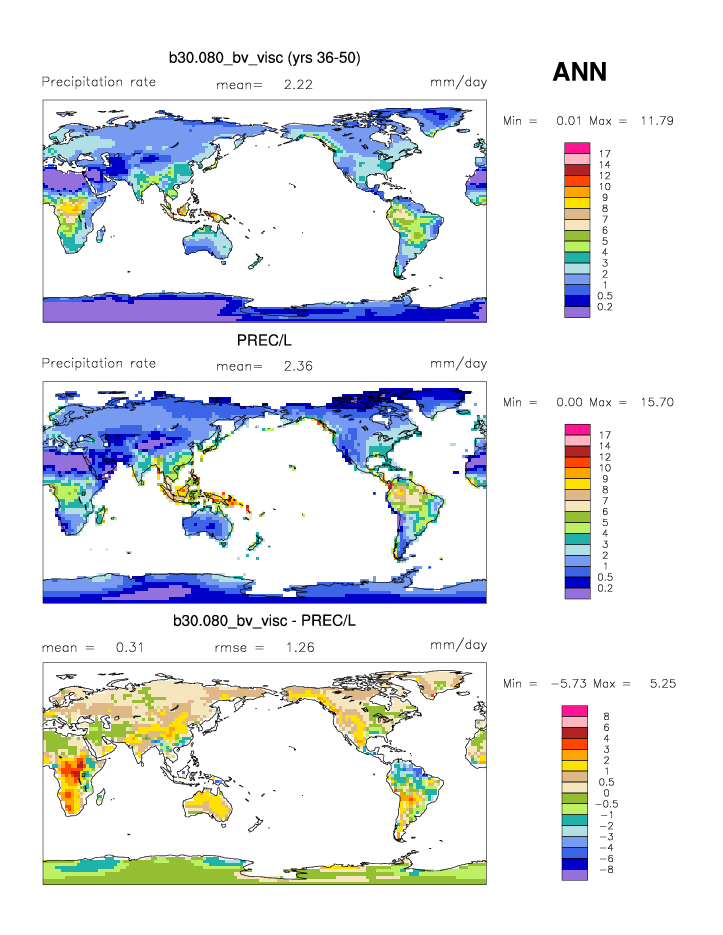
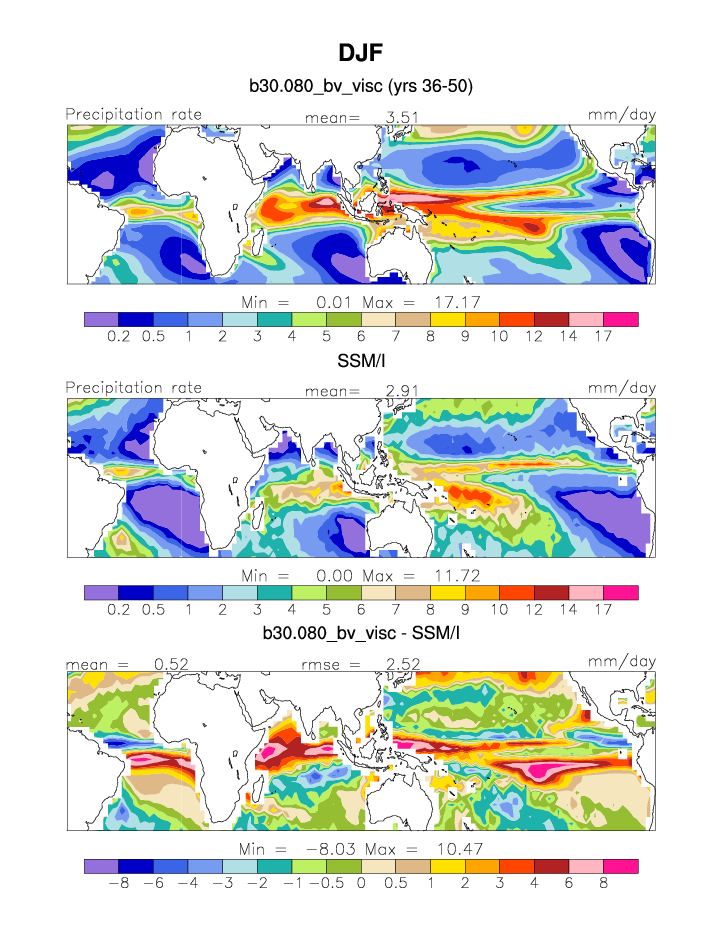
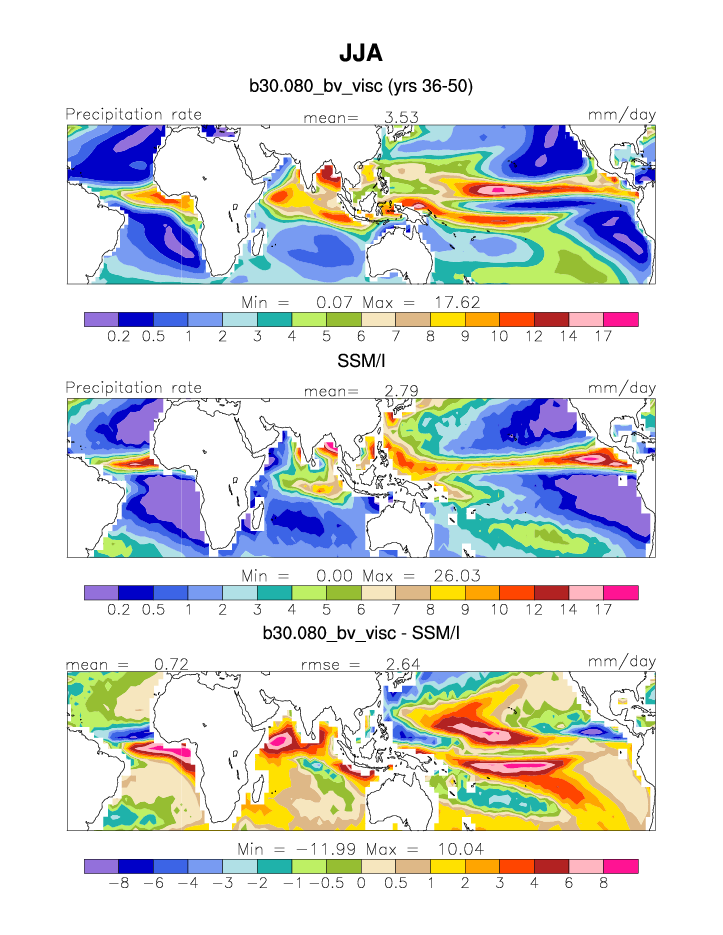
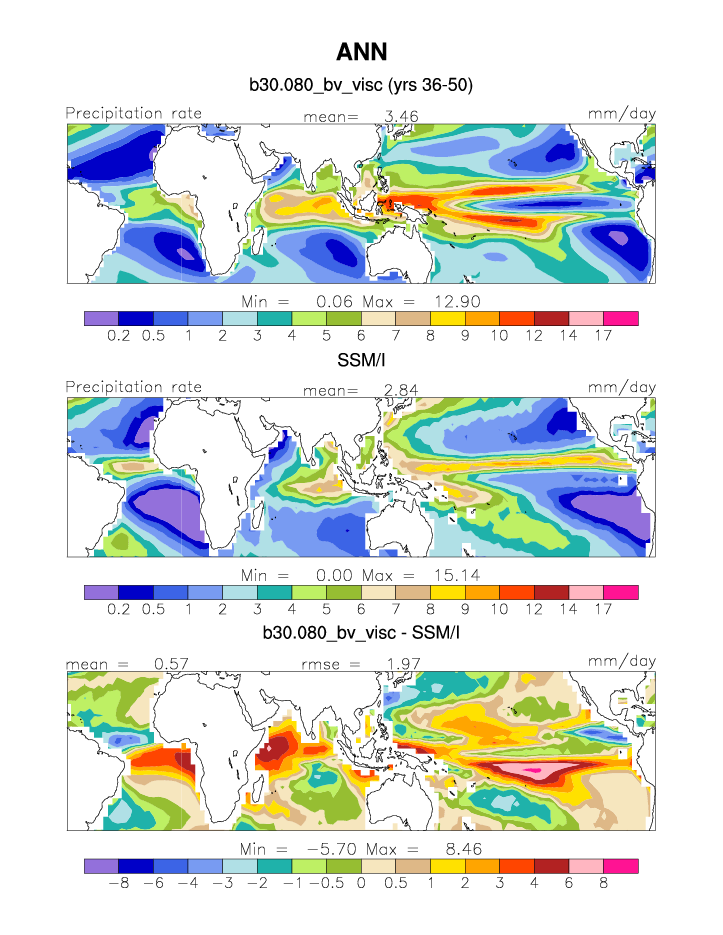
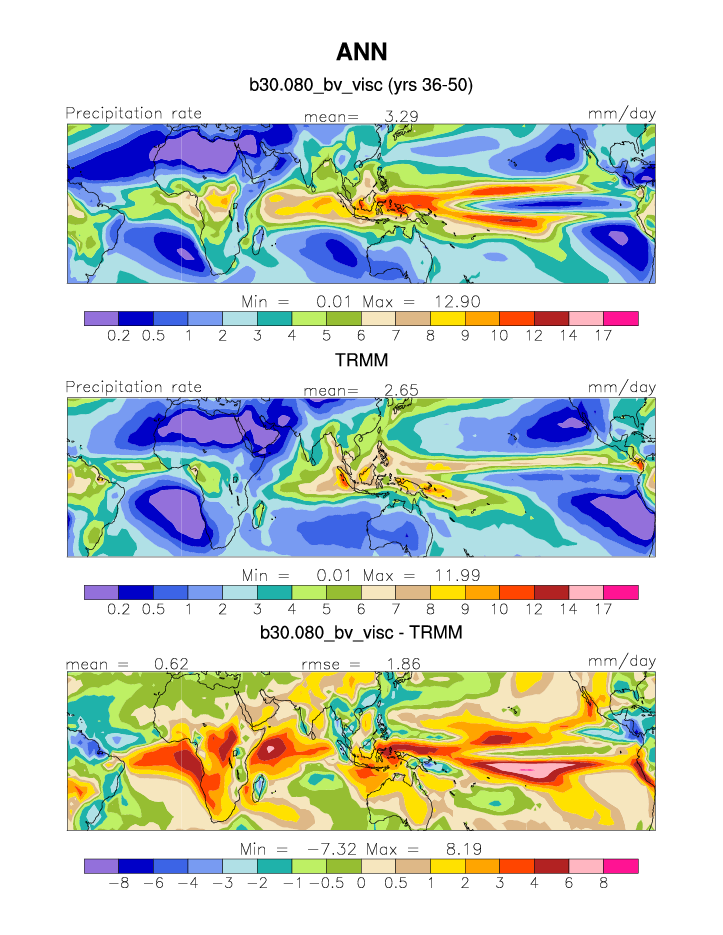
| PRECT * | Precipitation rate | plot | plot | plot |
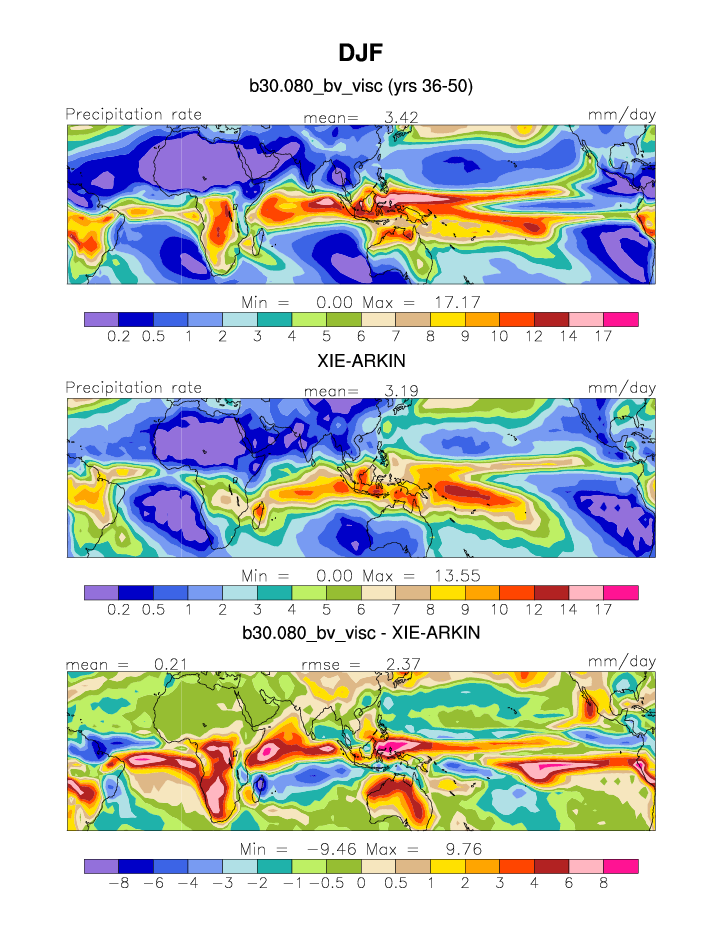
| PRECT TROP | Tropical precipitation rate | plot | plot | plot |
| TREFHT * | 2-meter air temperature | plot | plot | plot |
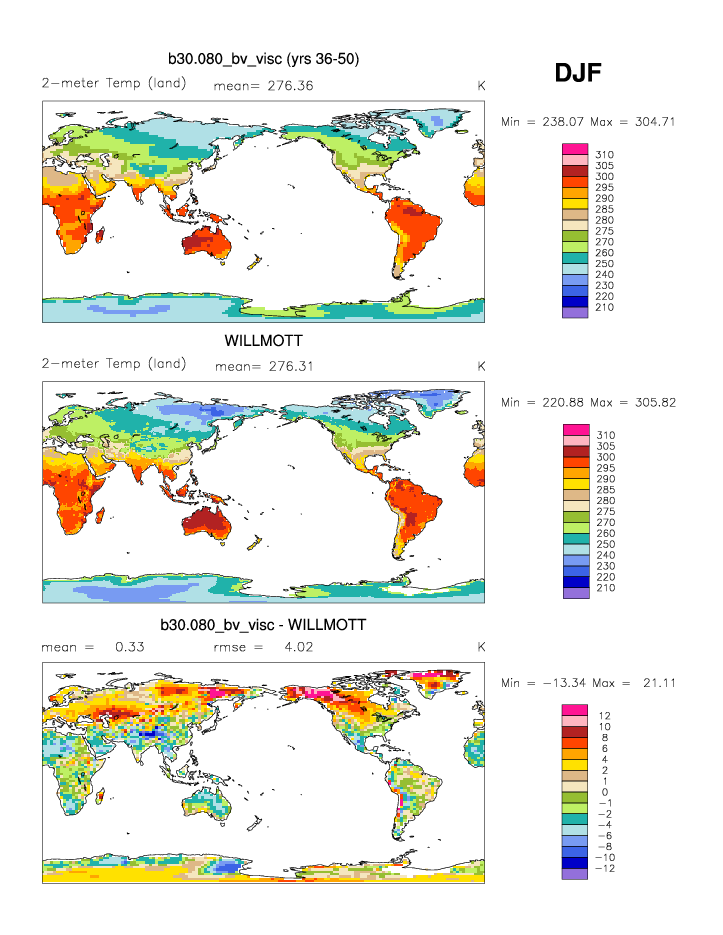
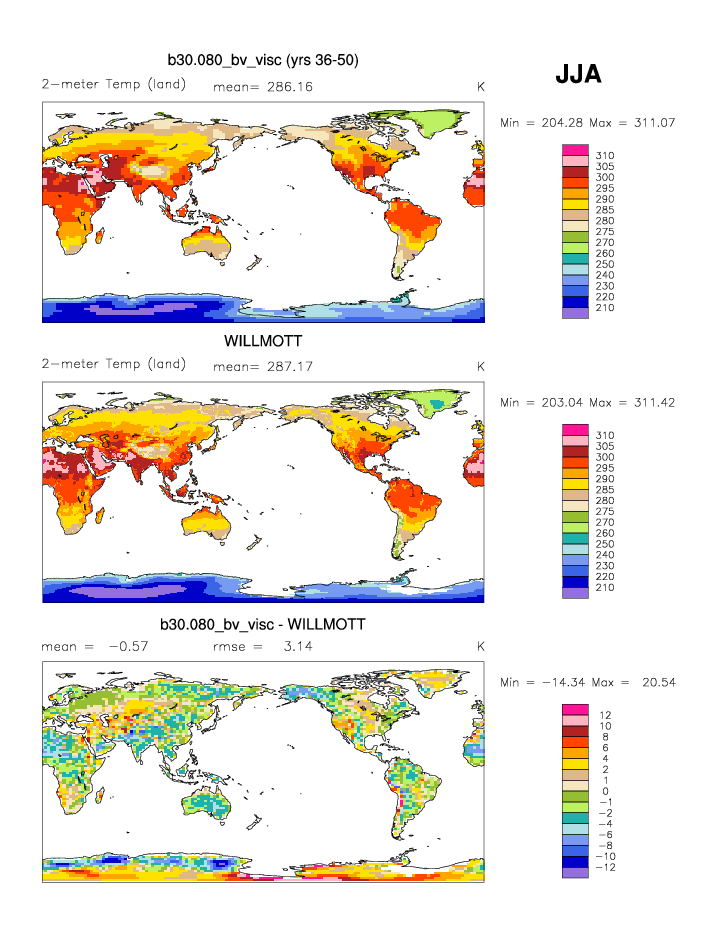
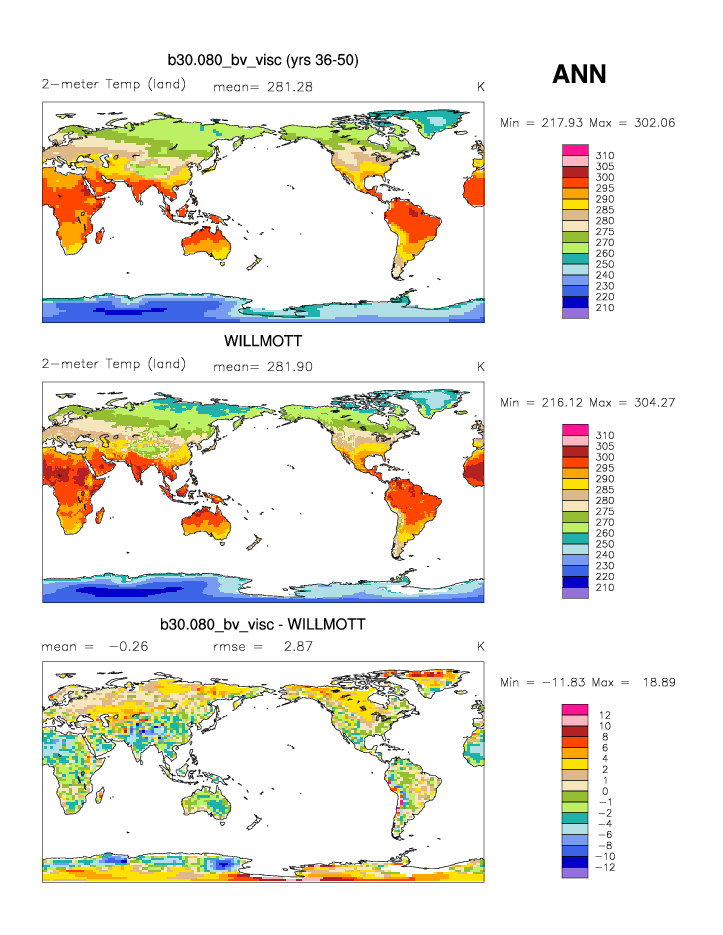
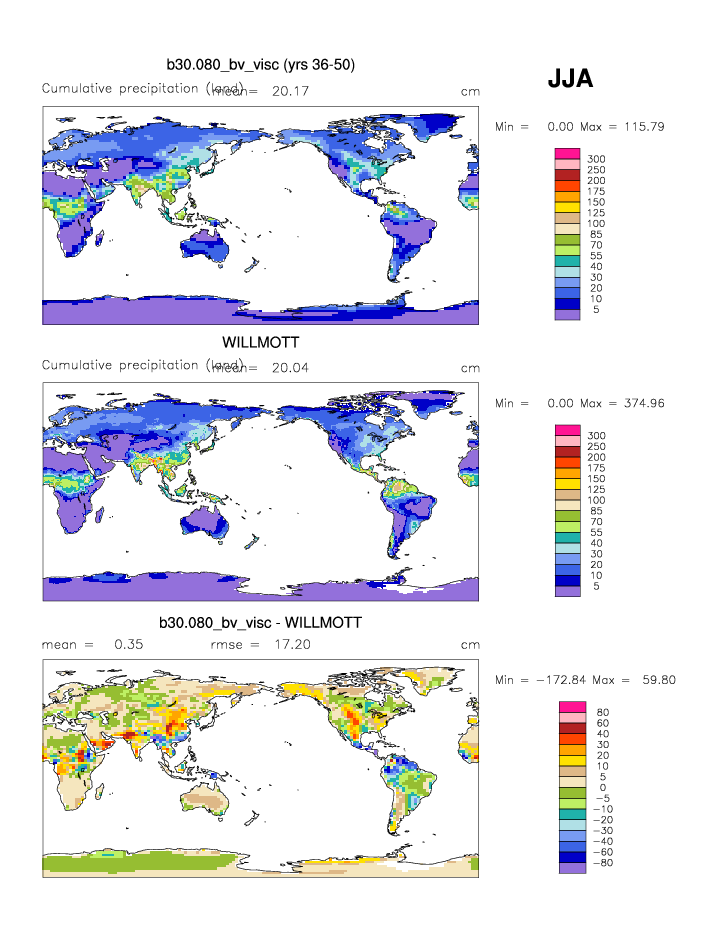
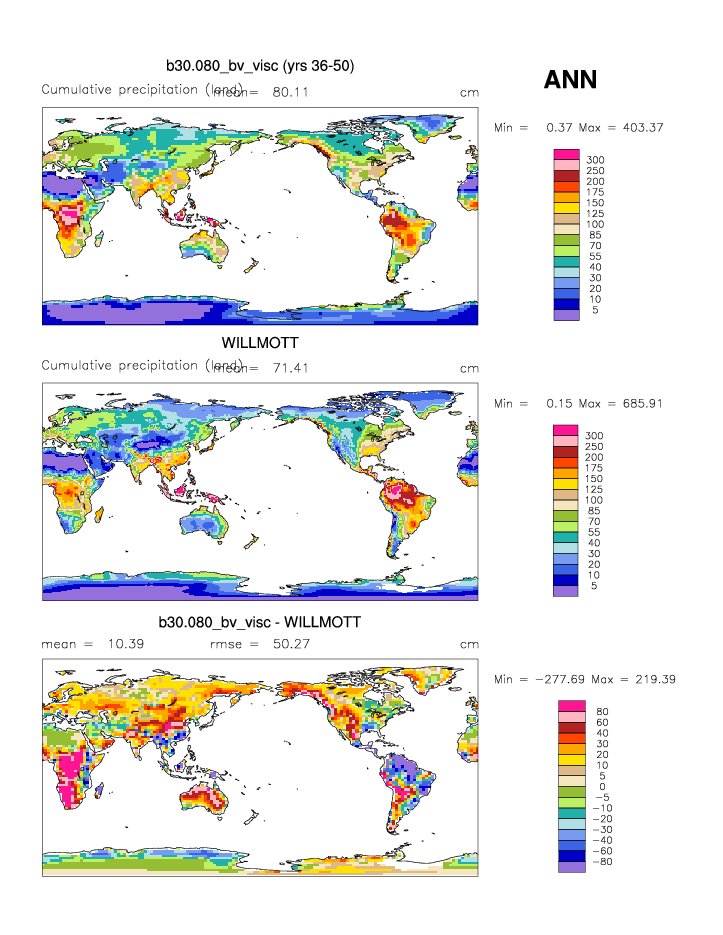
| Willmott & Matsuura 1950-99 | DJF | JJA | ANN | |
| TREFHT | 2-meter air temperature (land) | plot | plot | plot |
| PRECIP | Cumulative precipitation (land) | plot | plot | plot |
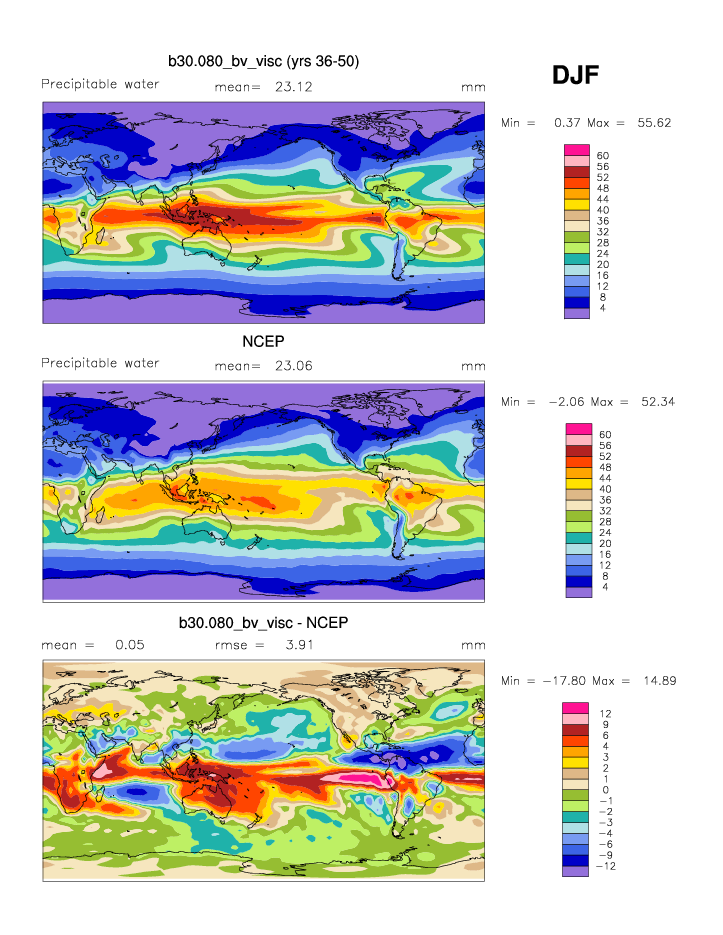
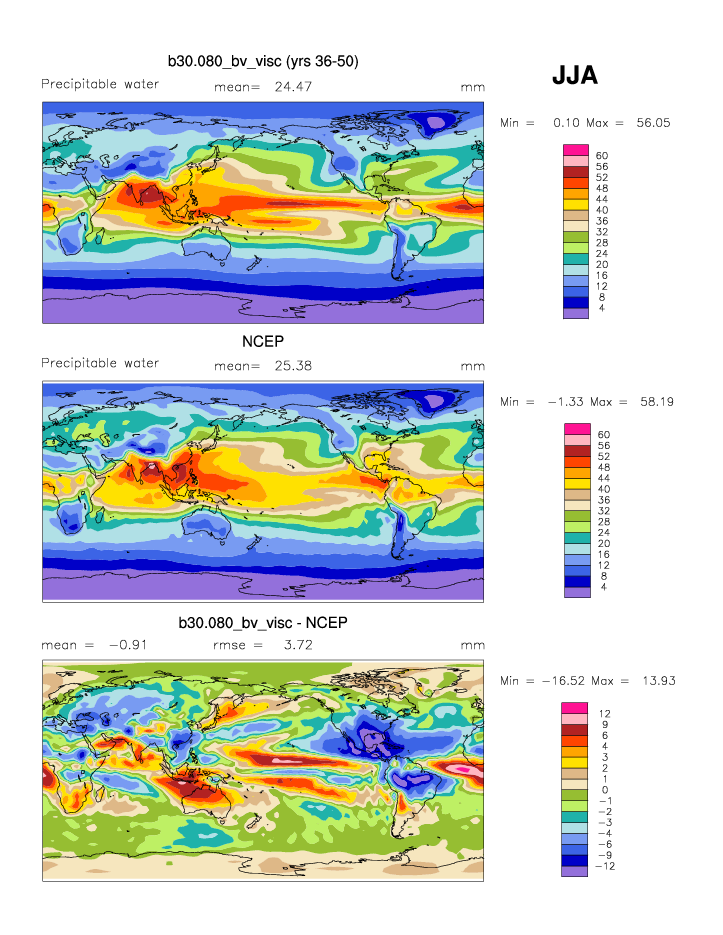
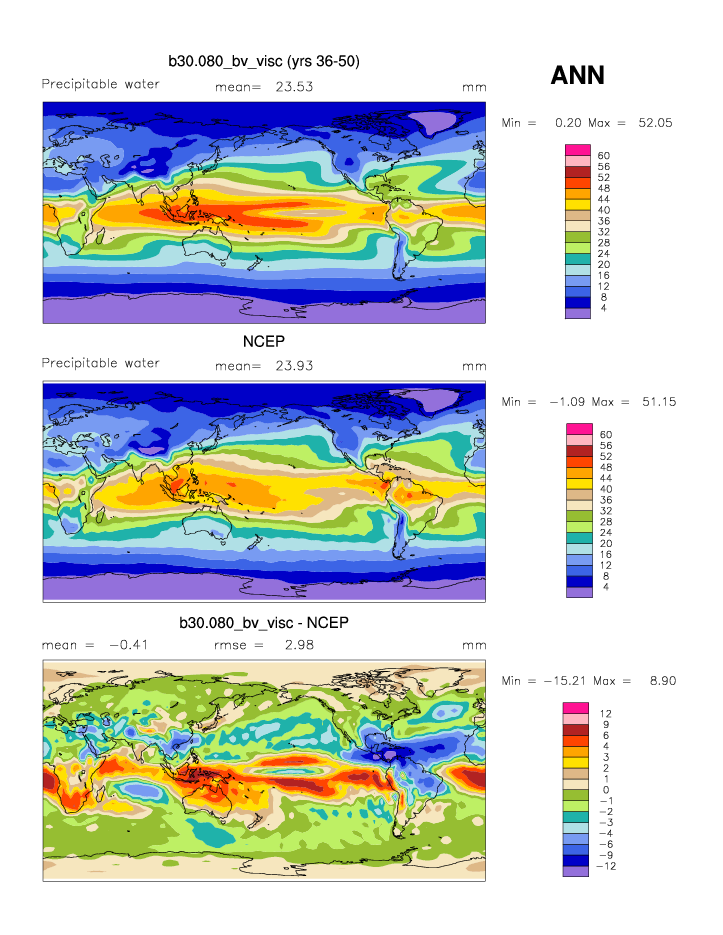
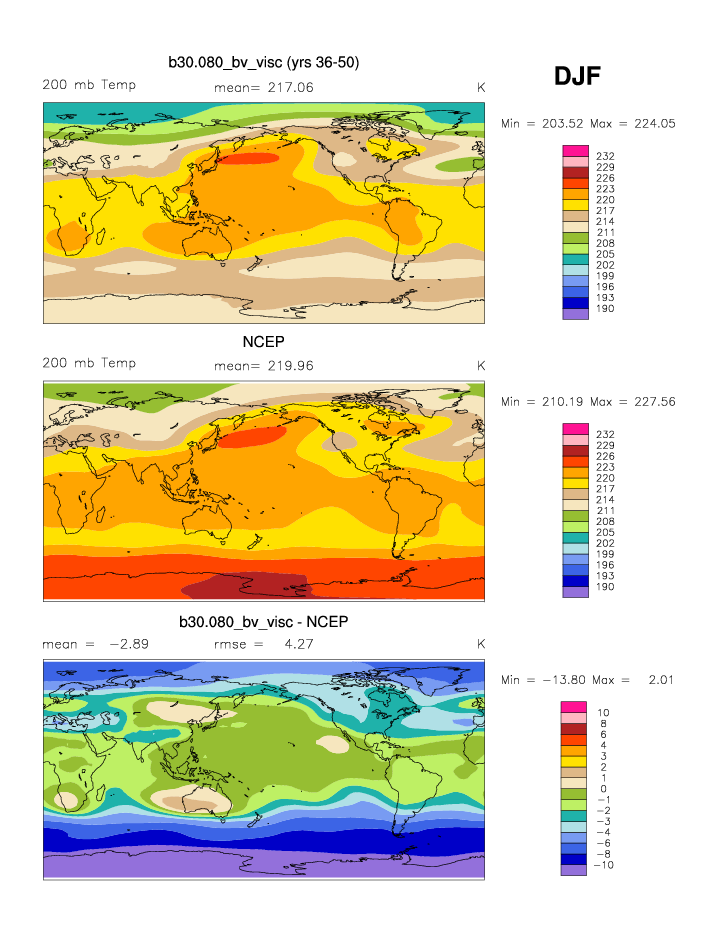
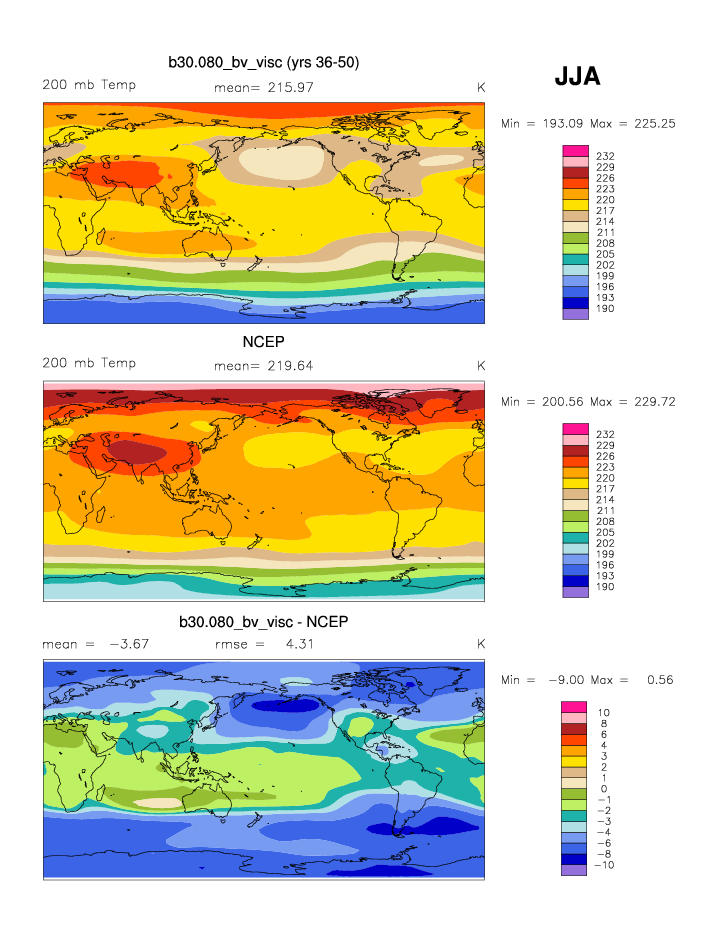
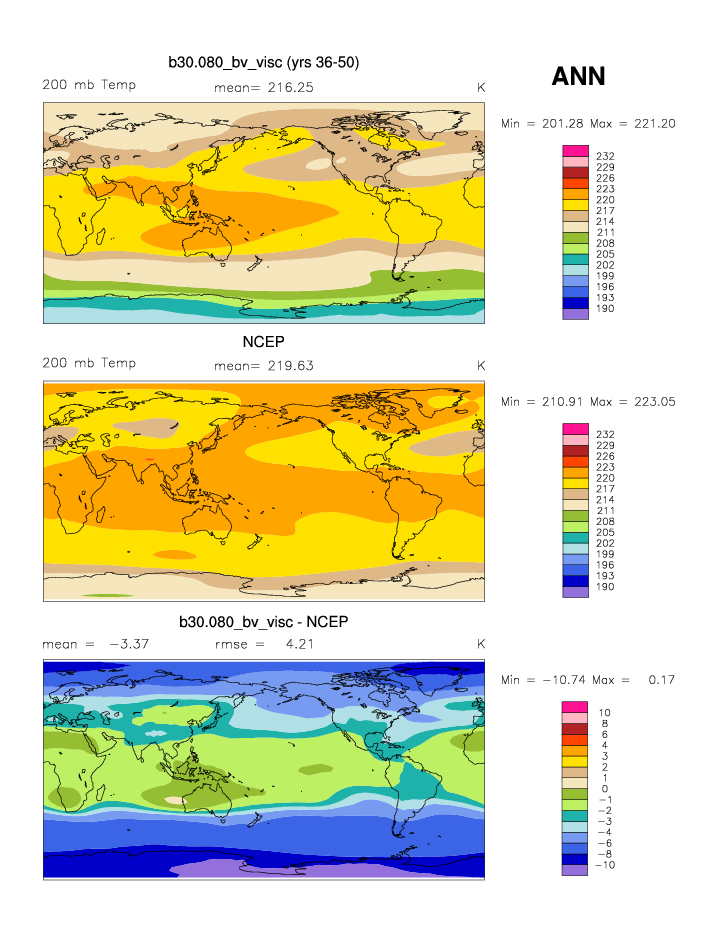
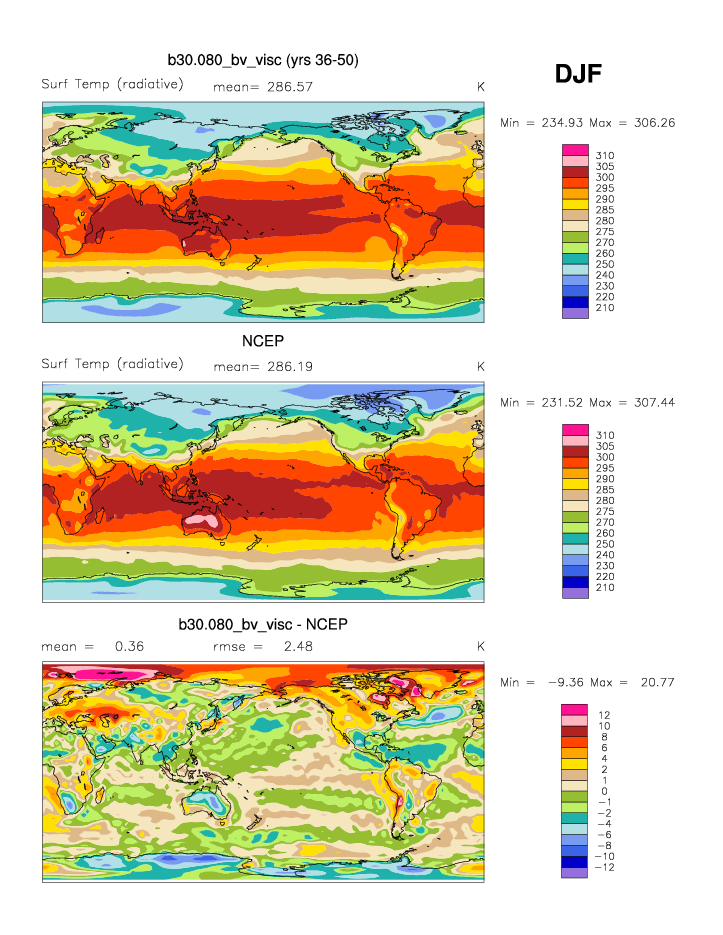
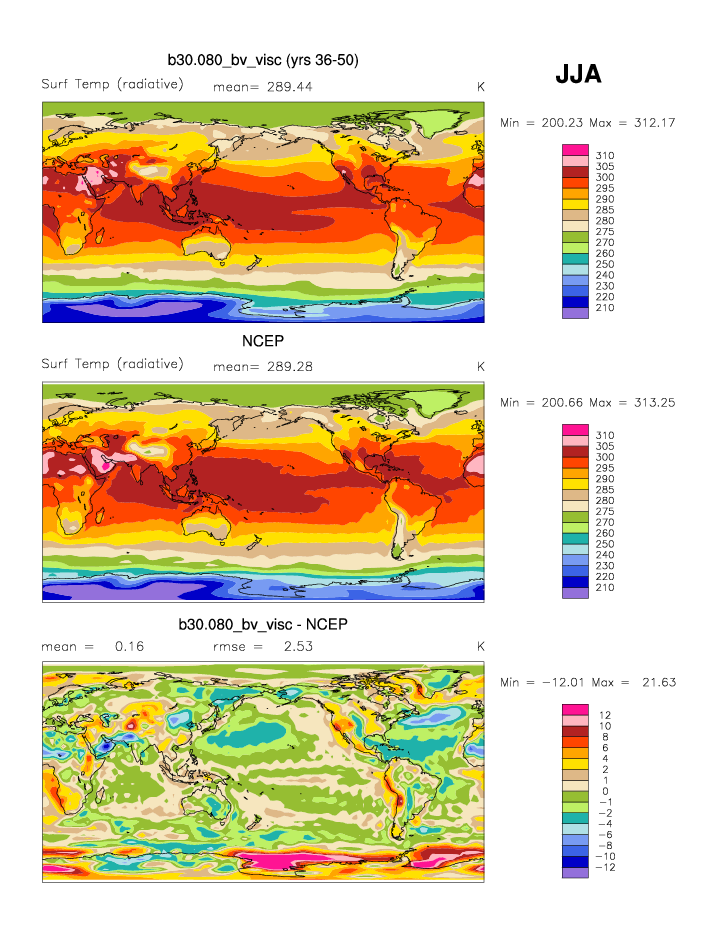
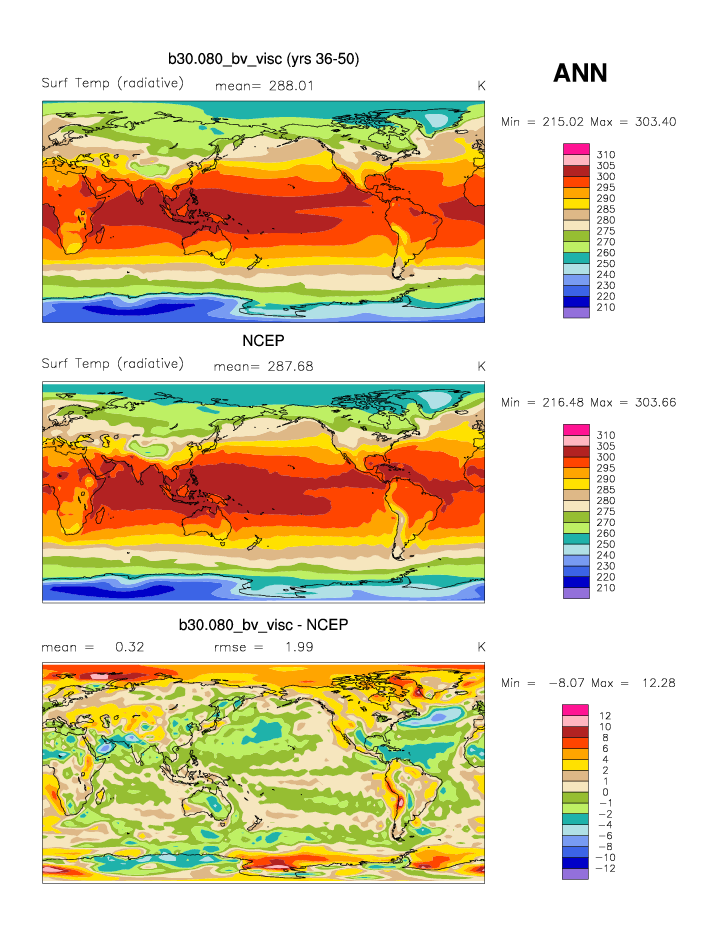
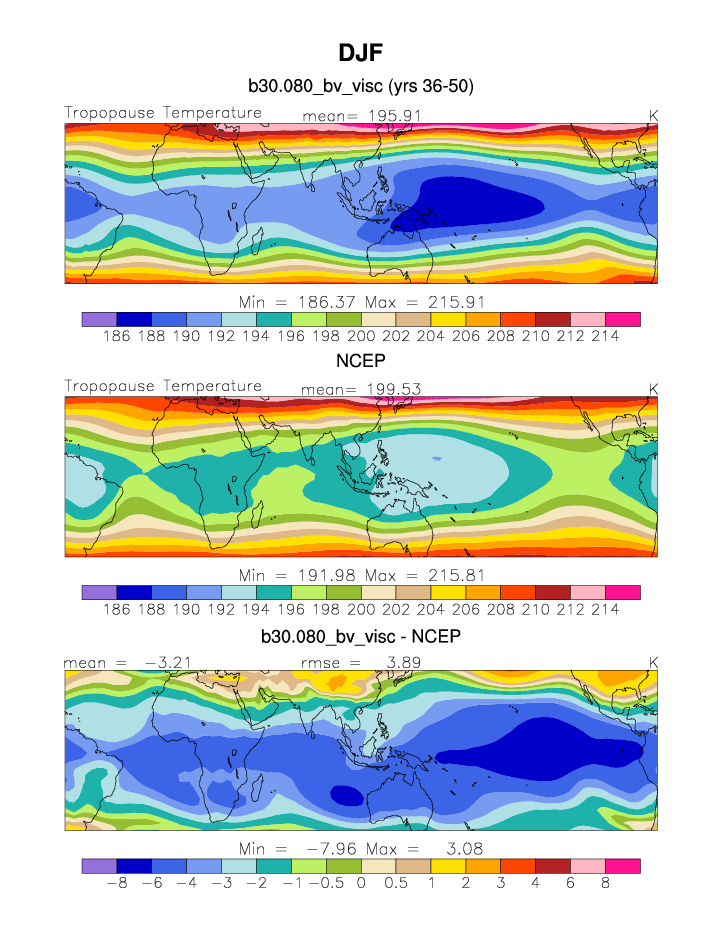
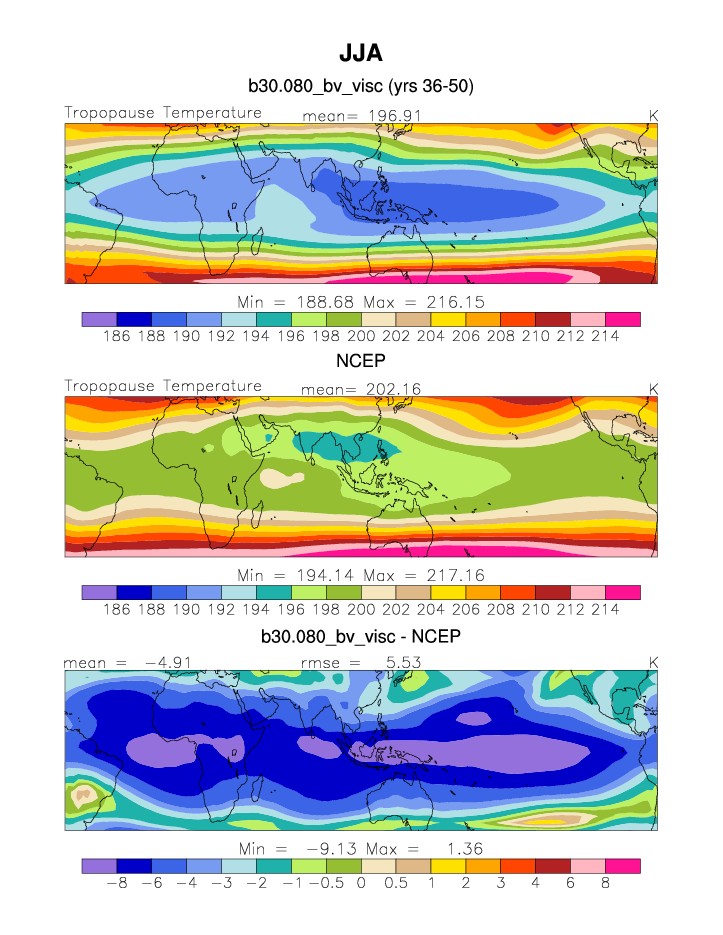
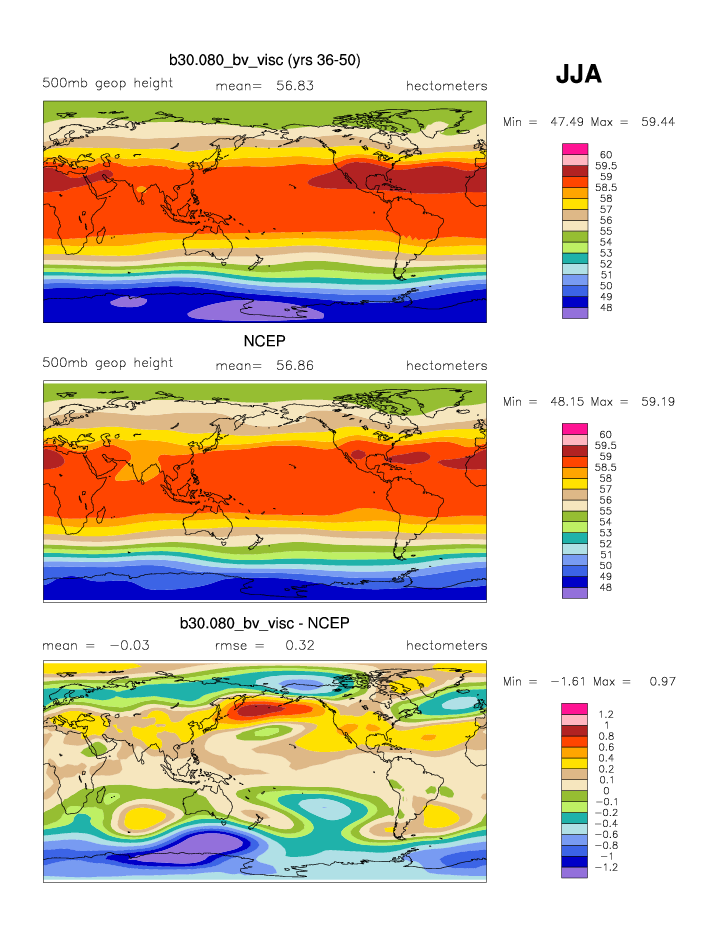
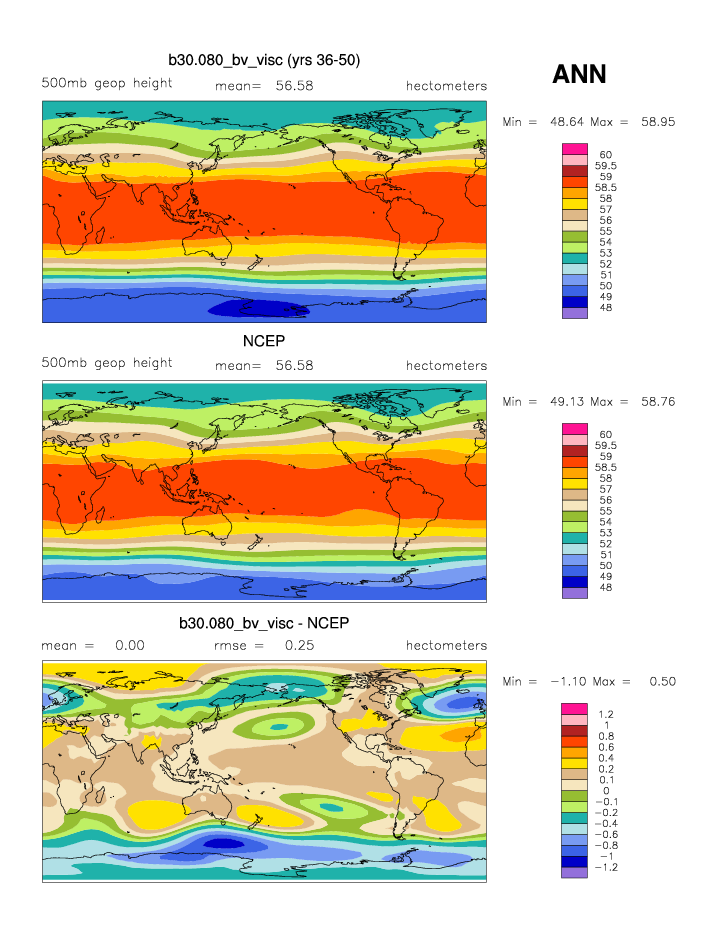
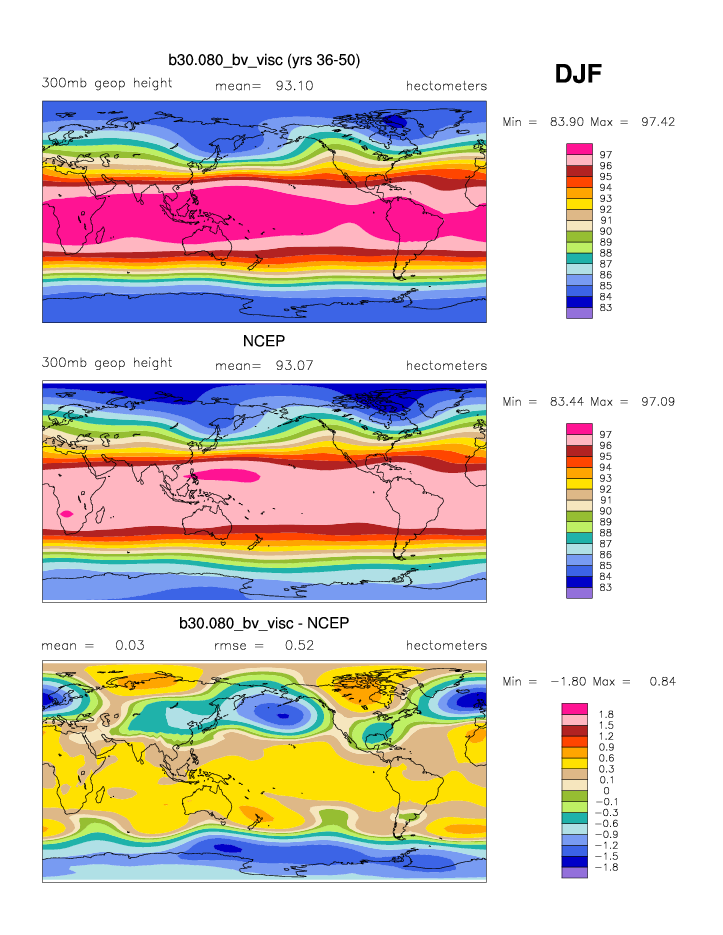
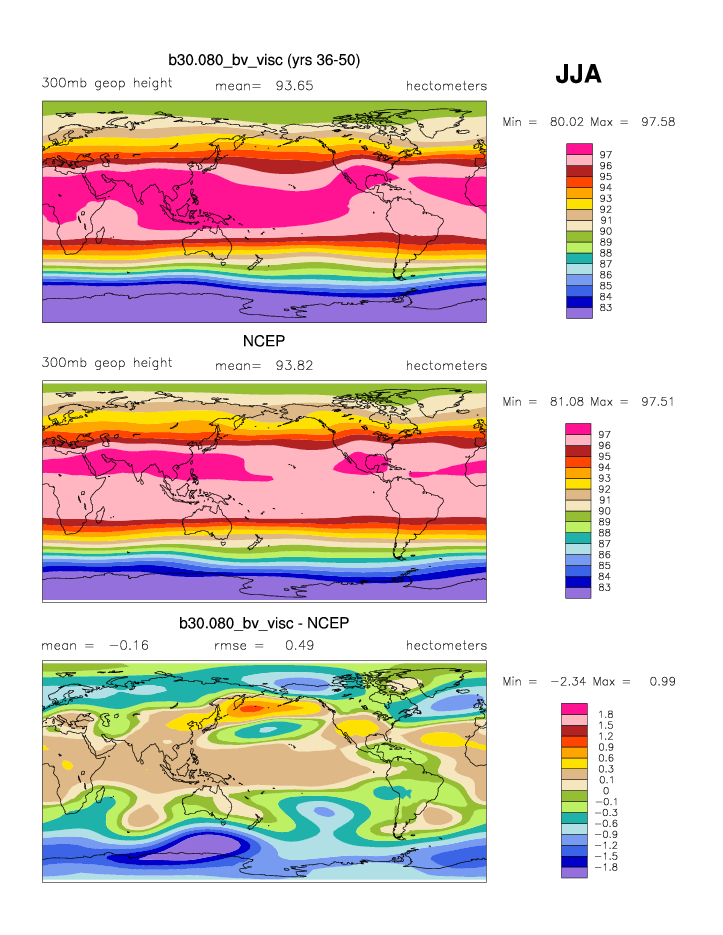
| NCEP Reanalysis 1979-98 | DJF | JJA | ANN | |
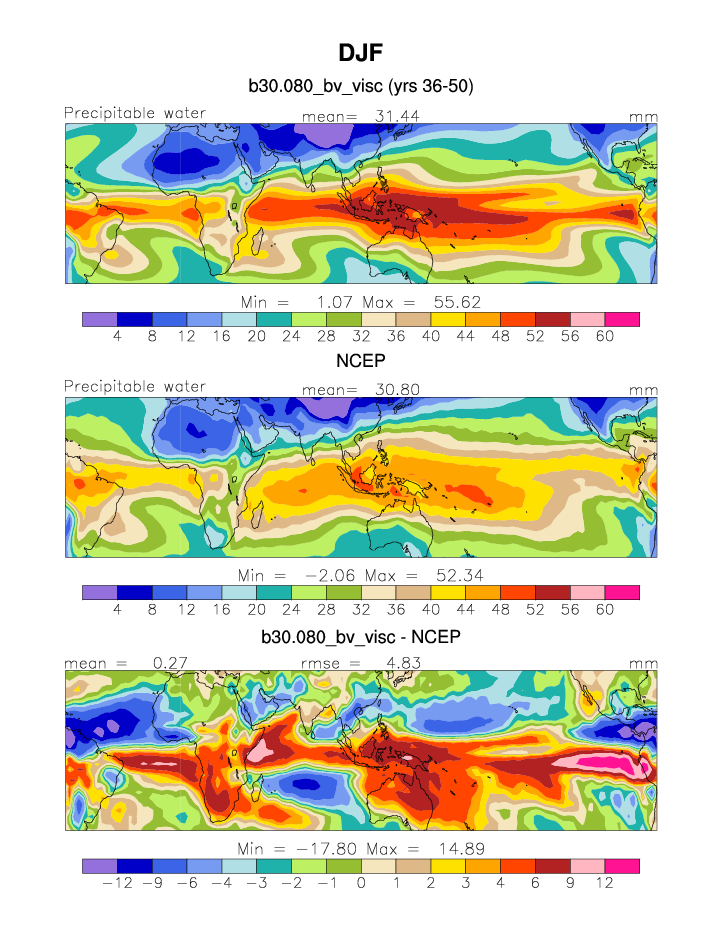
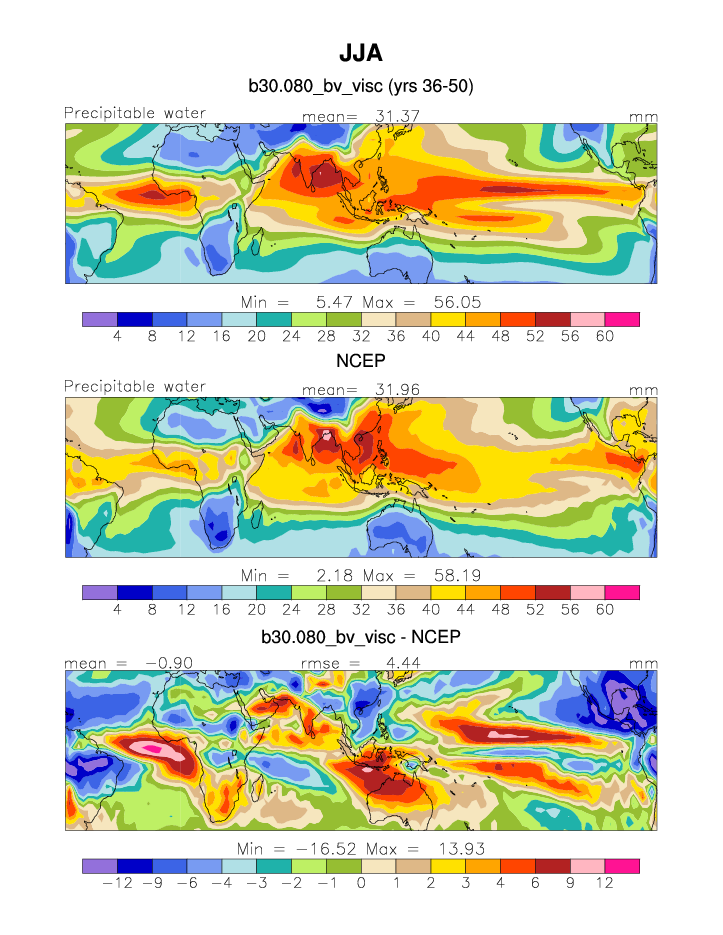
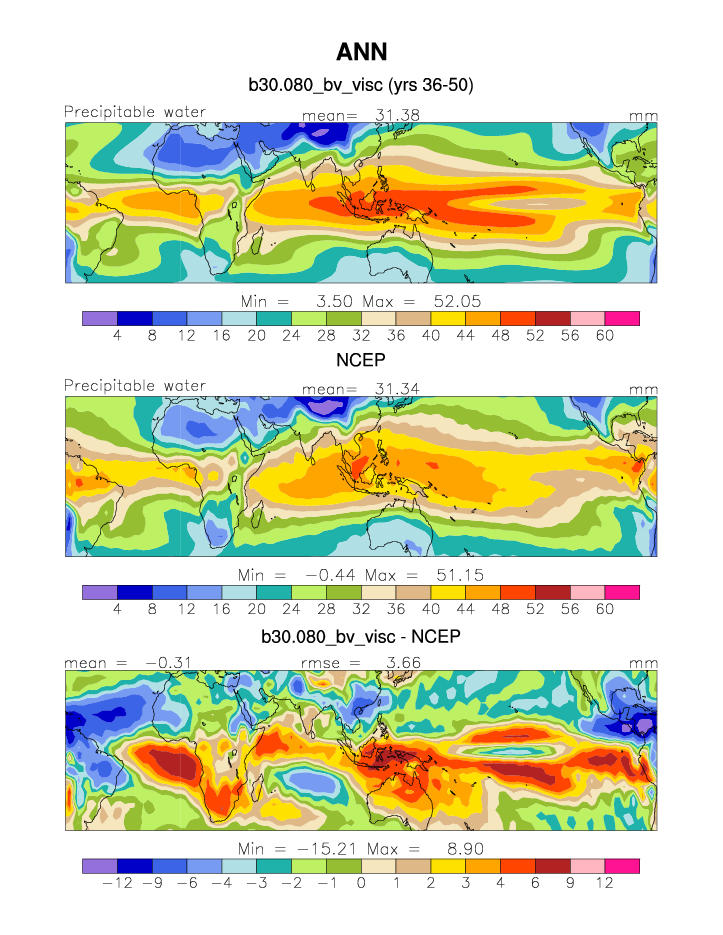
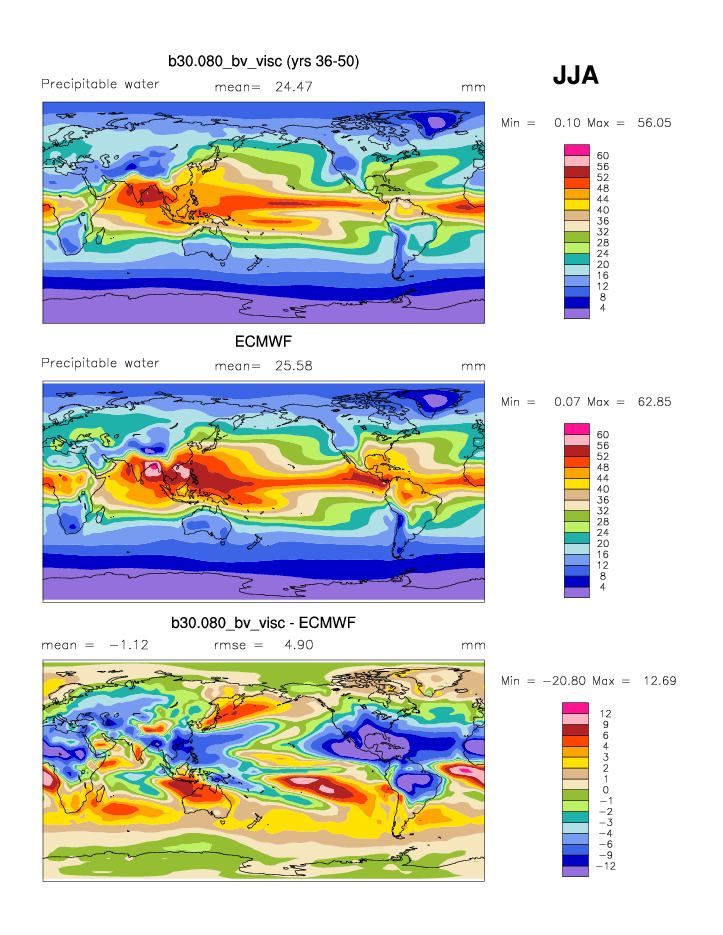
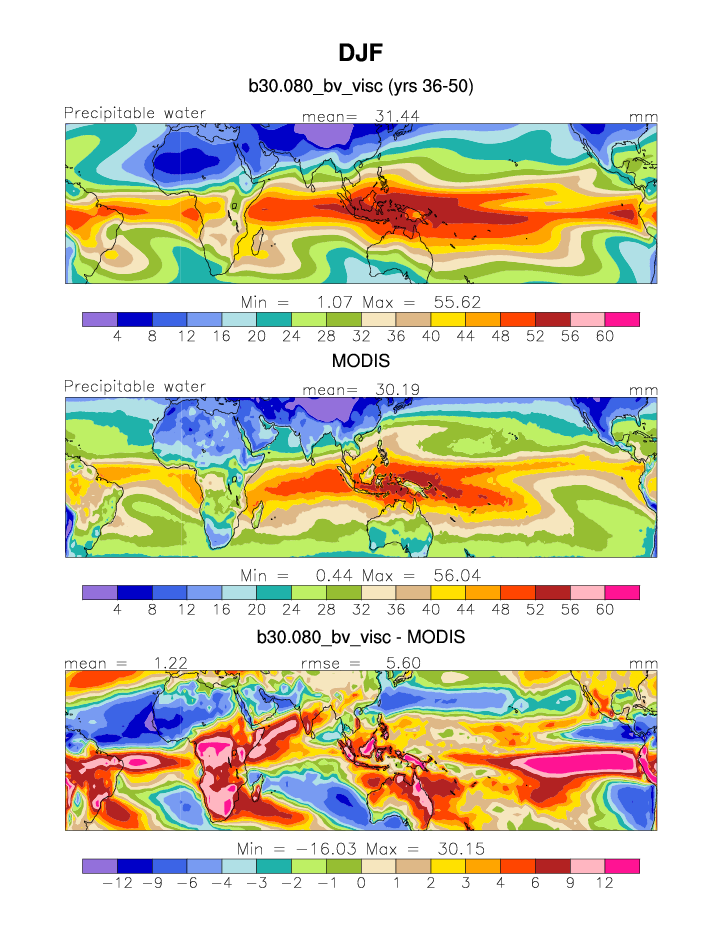
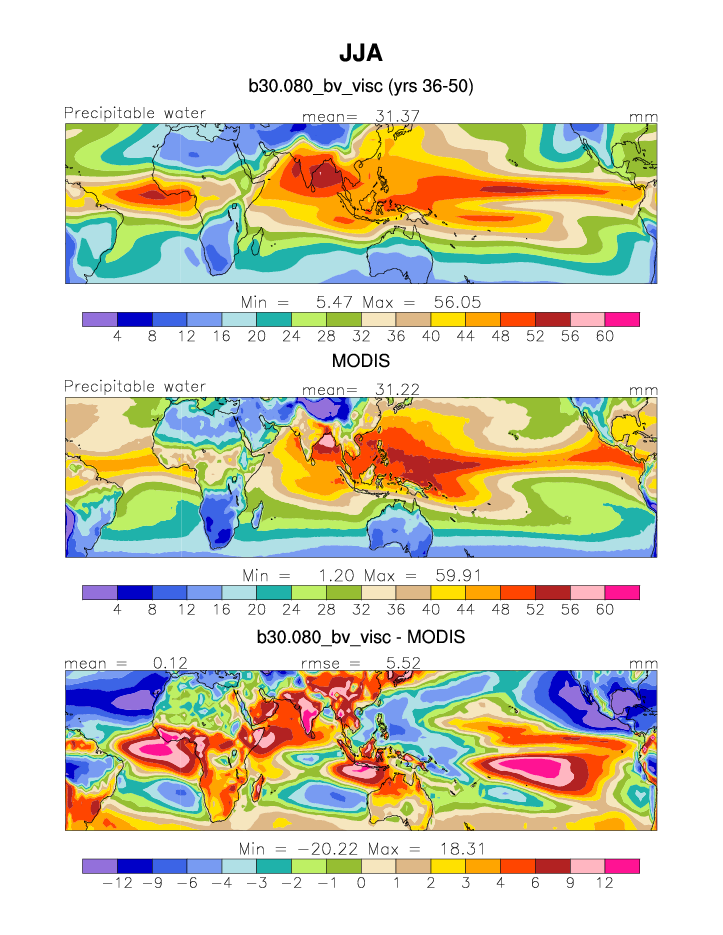
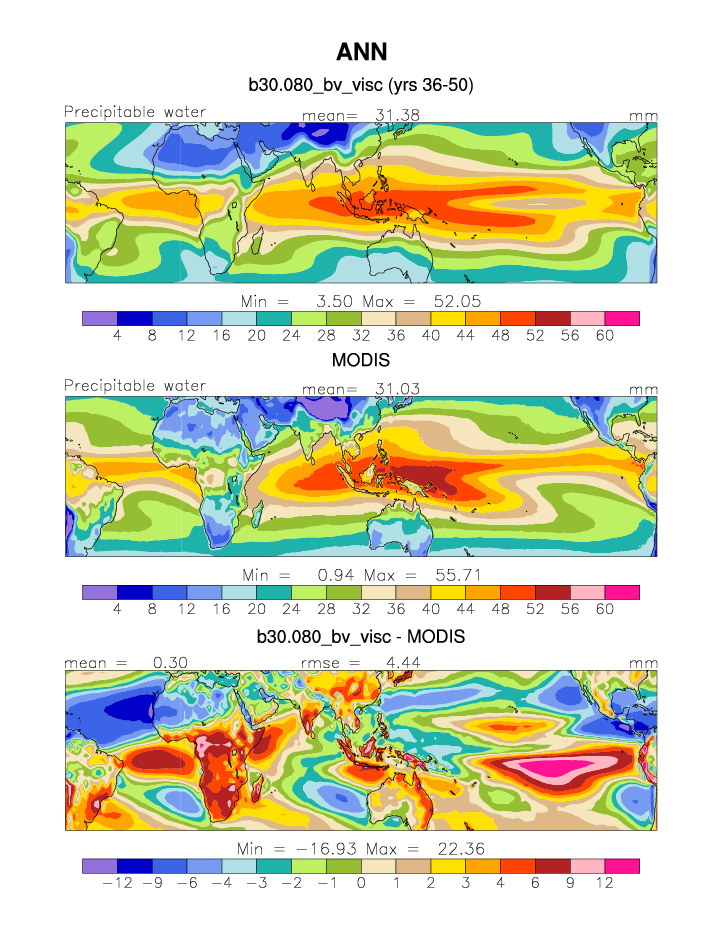
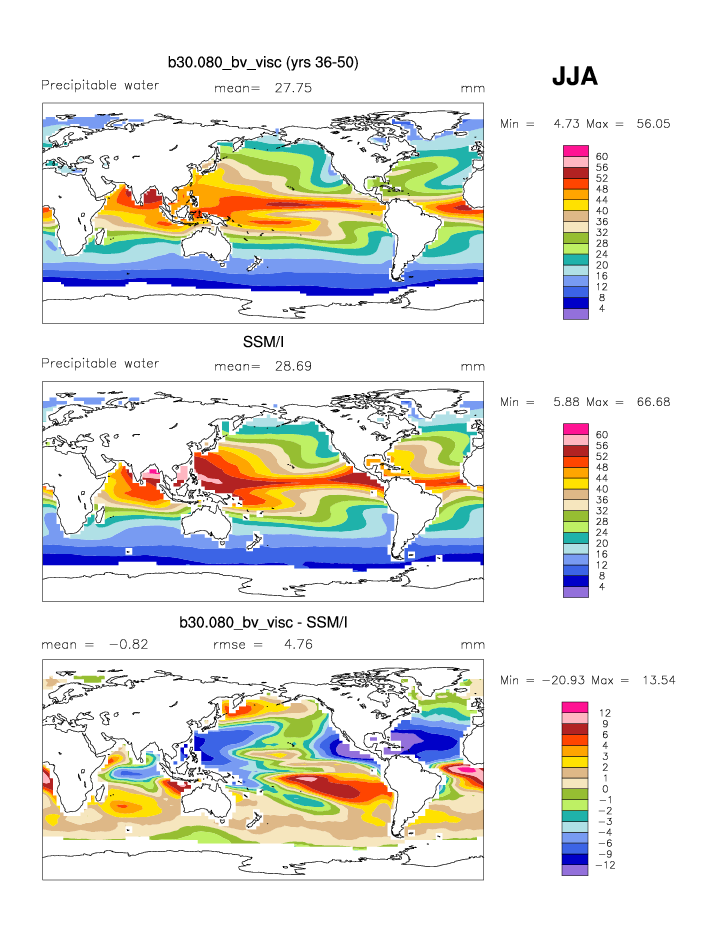
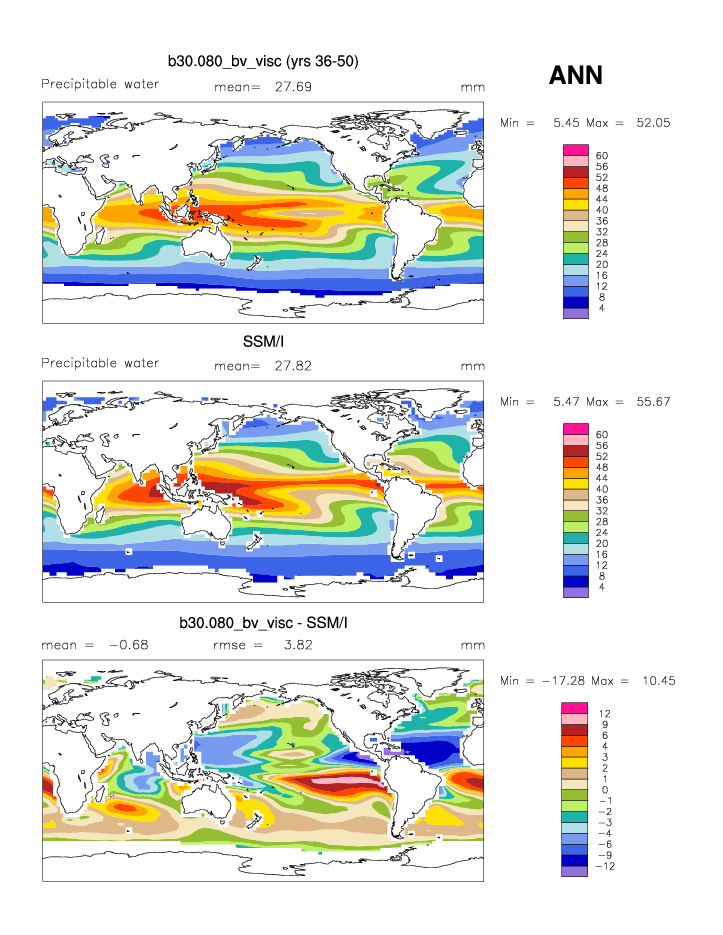
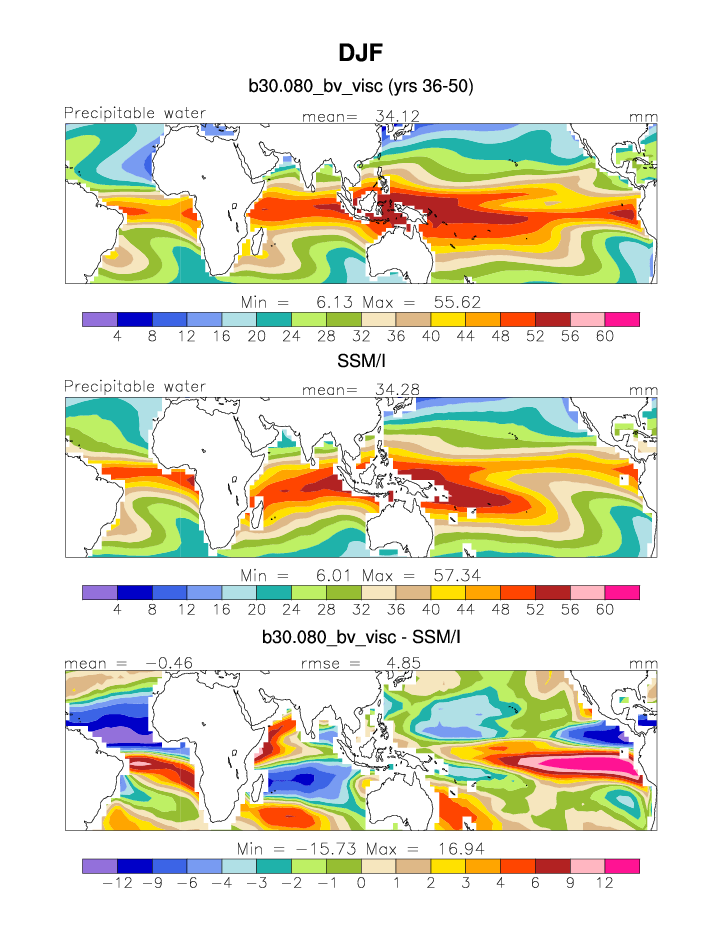
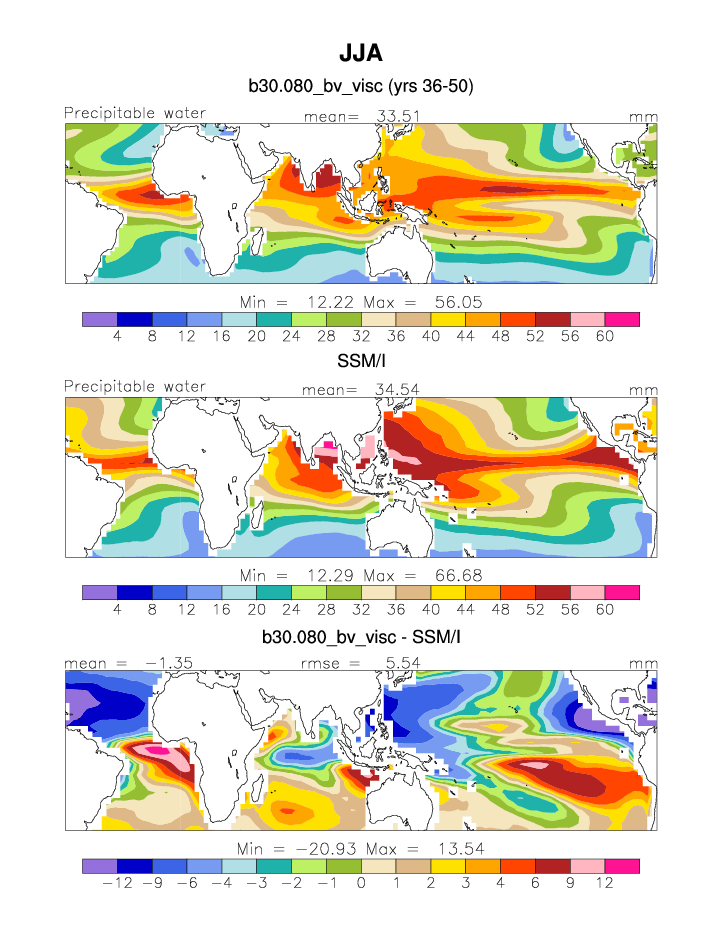
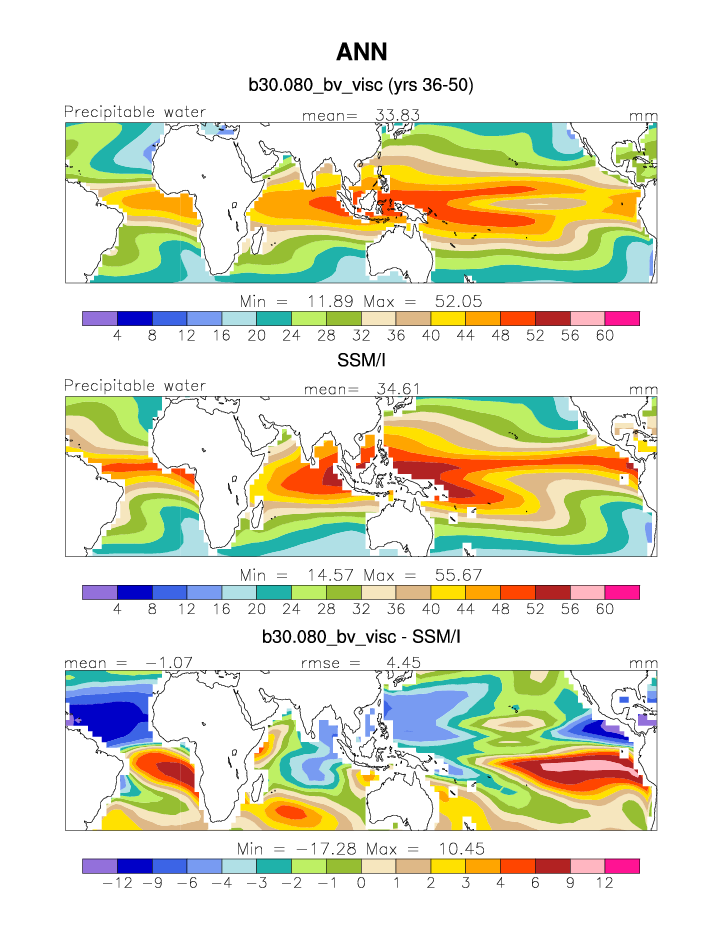
| PREH2O * | Total precipitable water | plot | plot | plot |
| PREH2O TROP | Tropical precipitable water | plot | plot | plot |
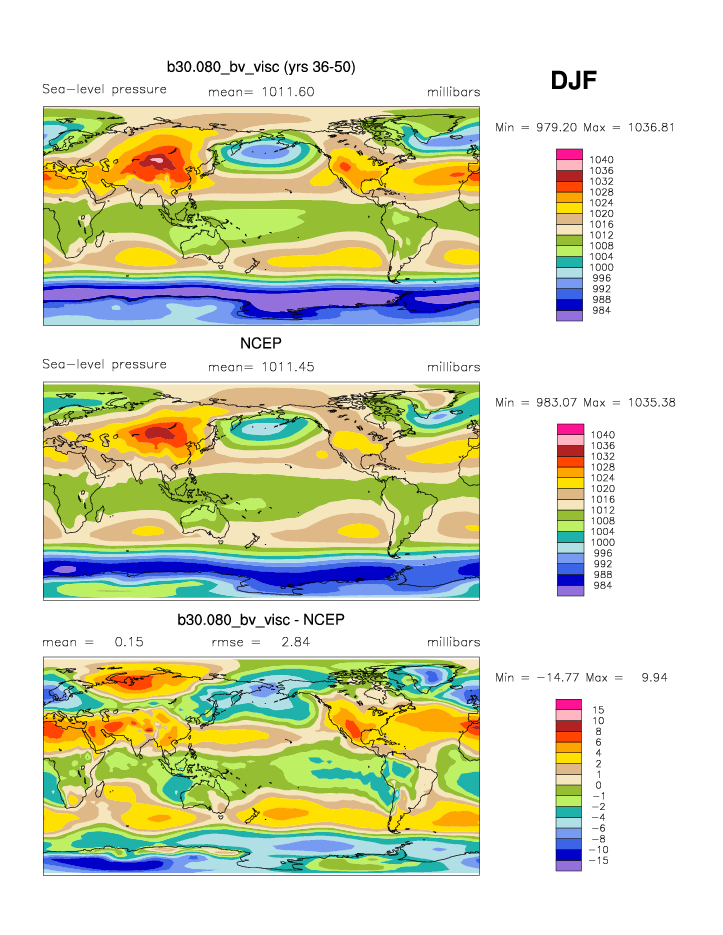
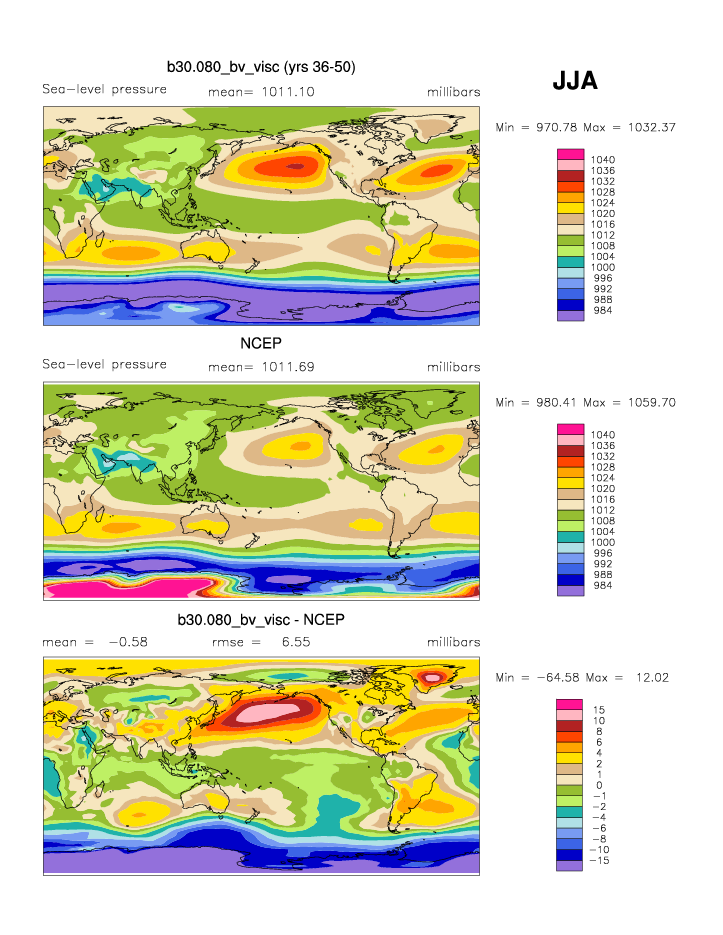
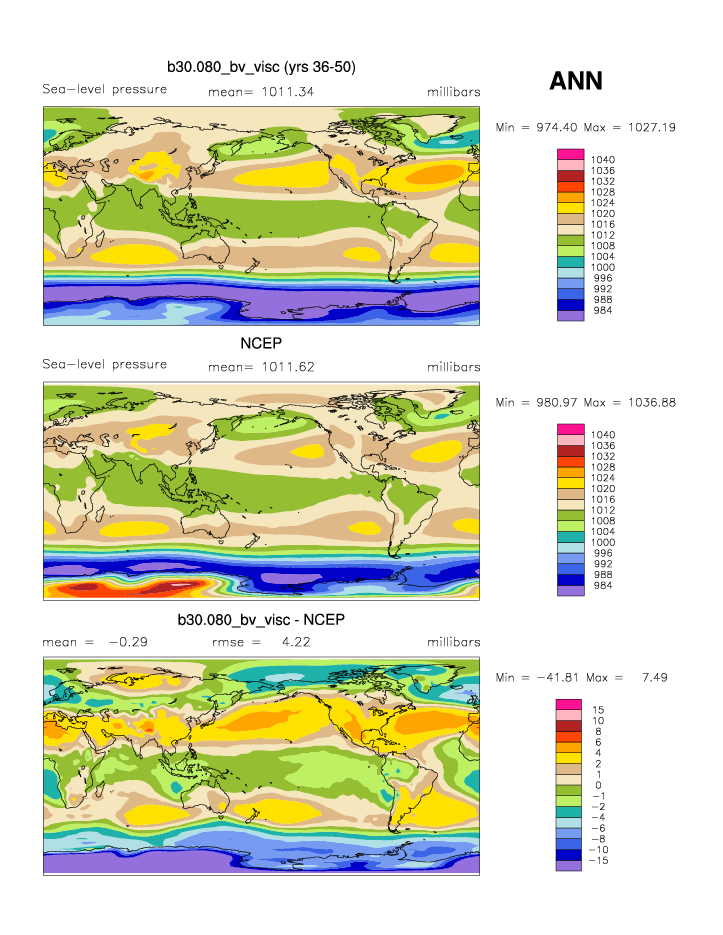
| PSL * | Sea-level pressure | plot | plot | plot |
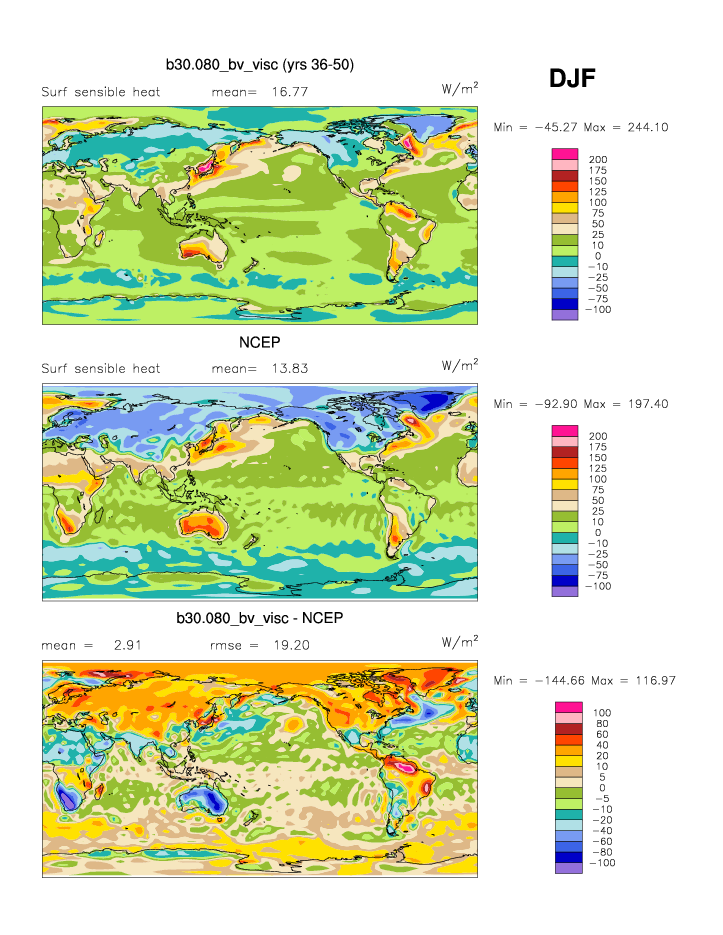
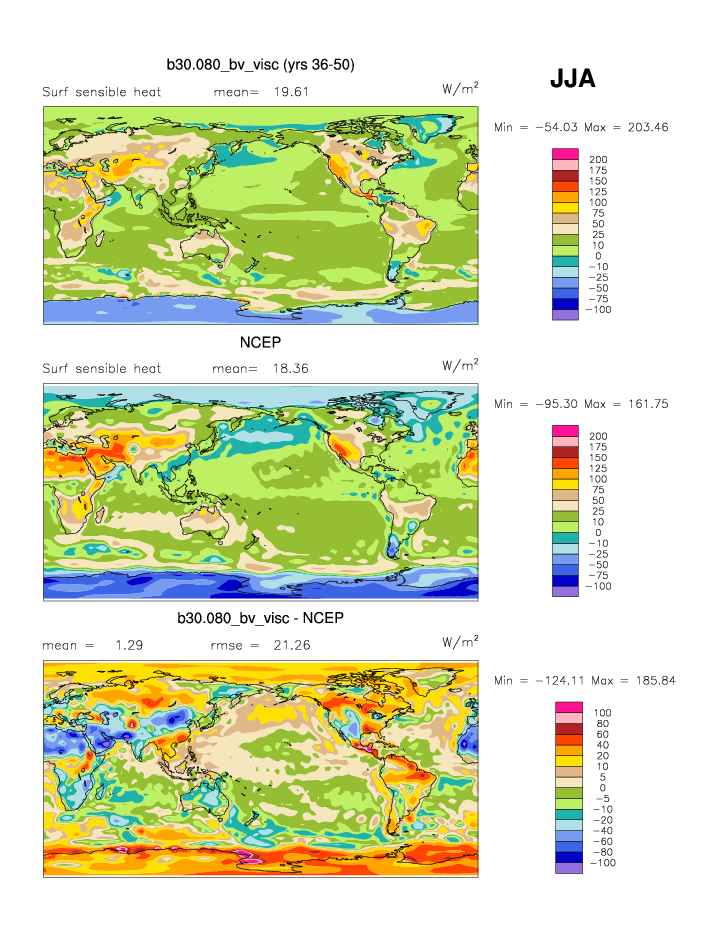
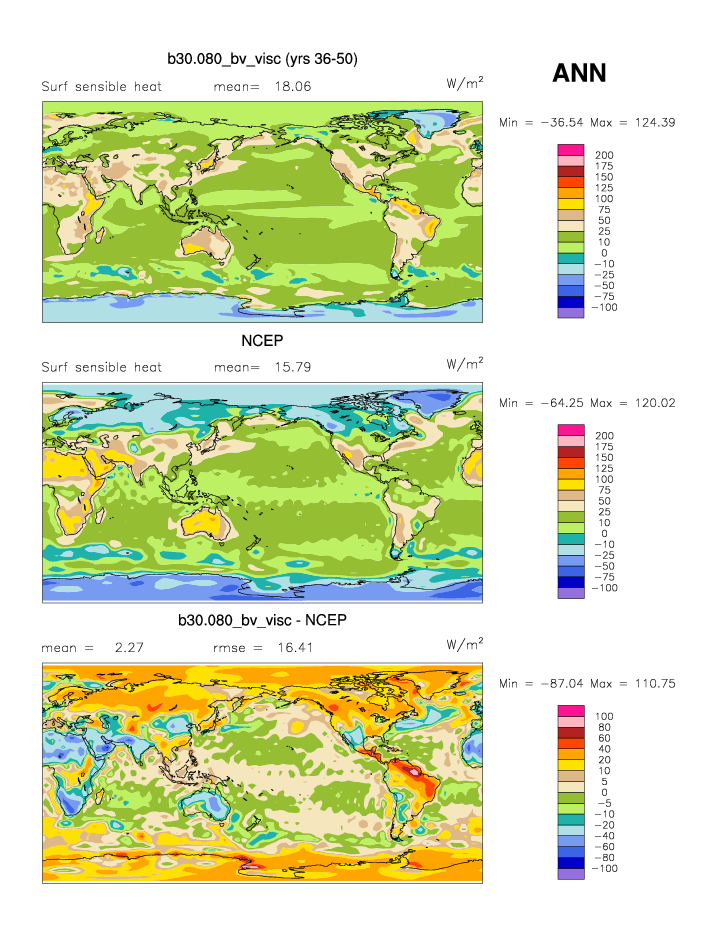
| SHFLX * | Surface sensible heat flux | plot | plot | plot |
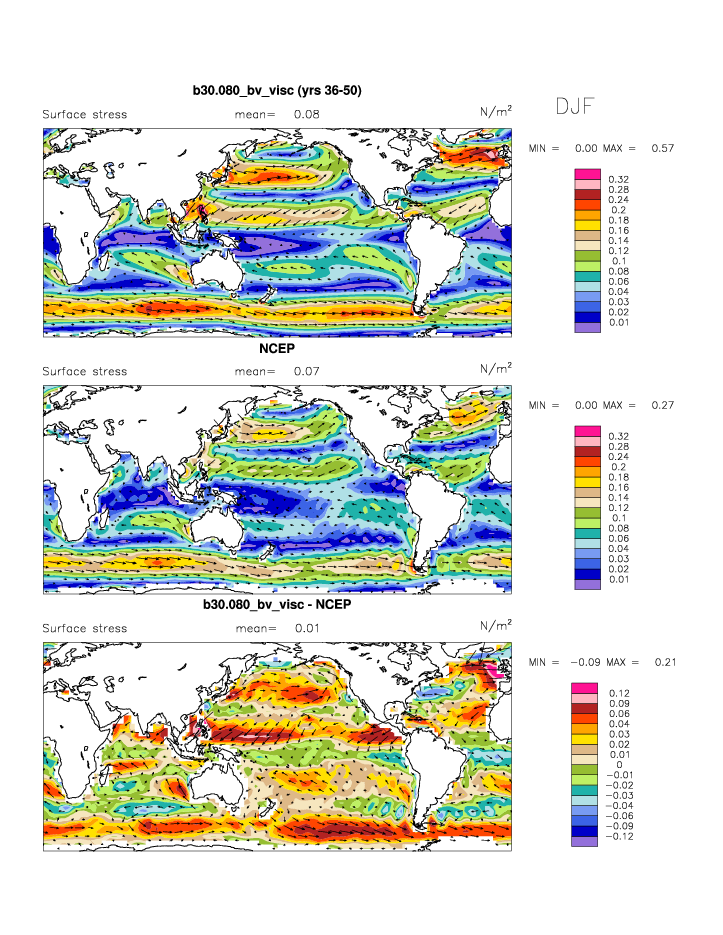
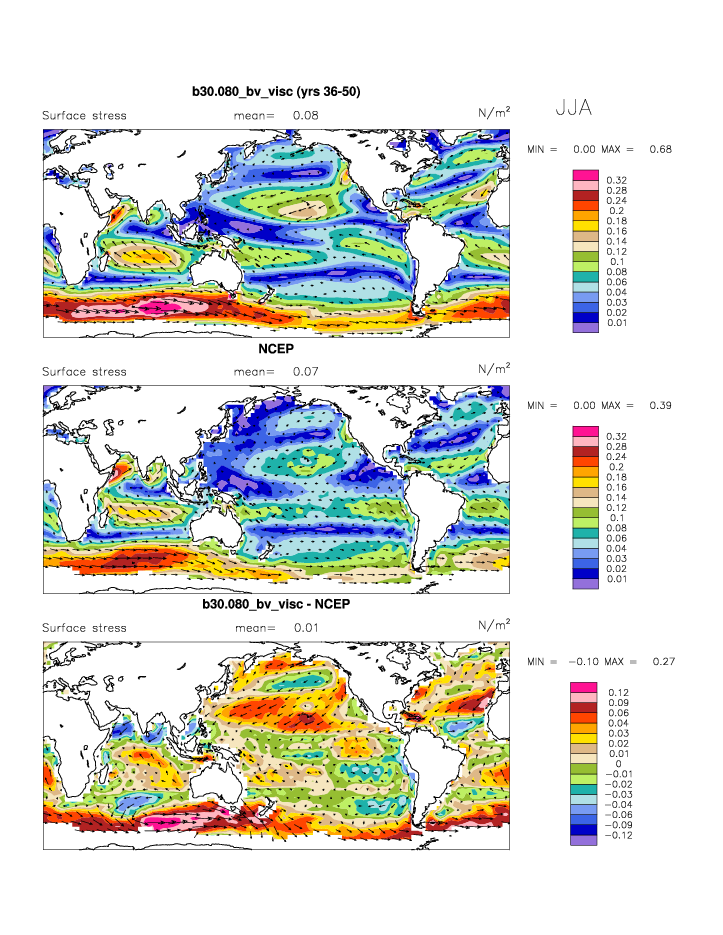
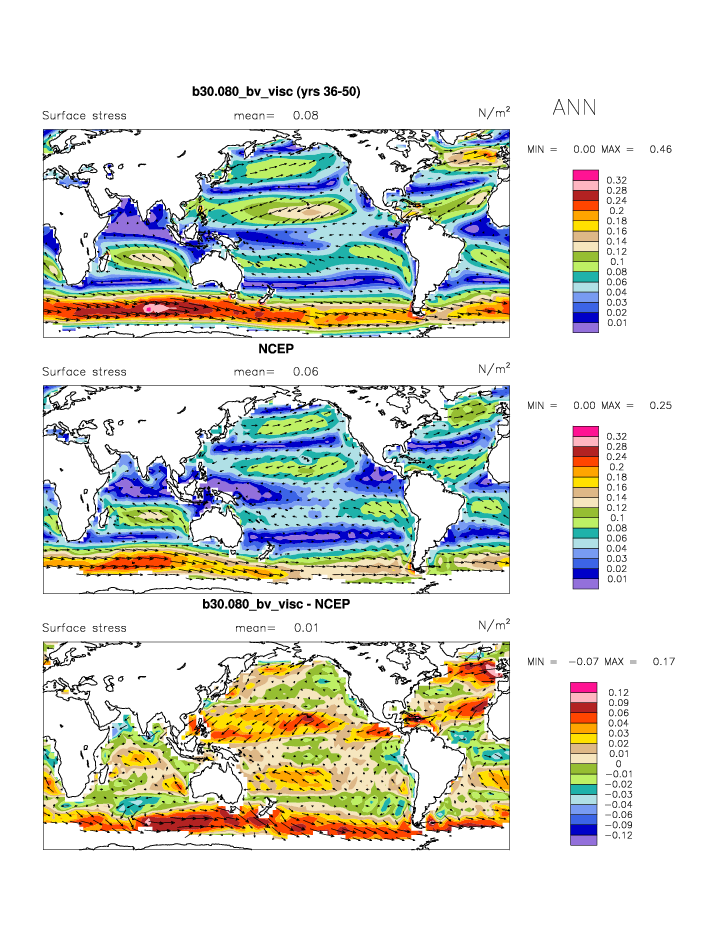
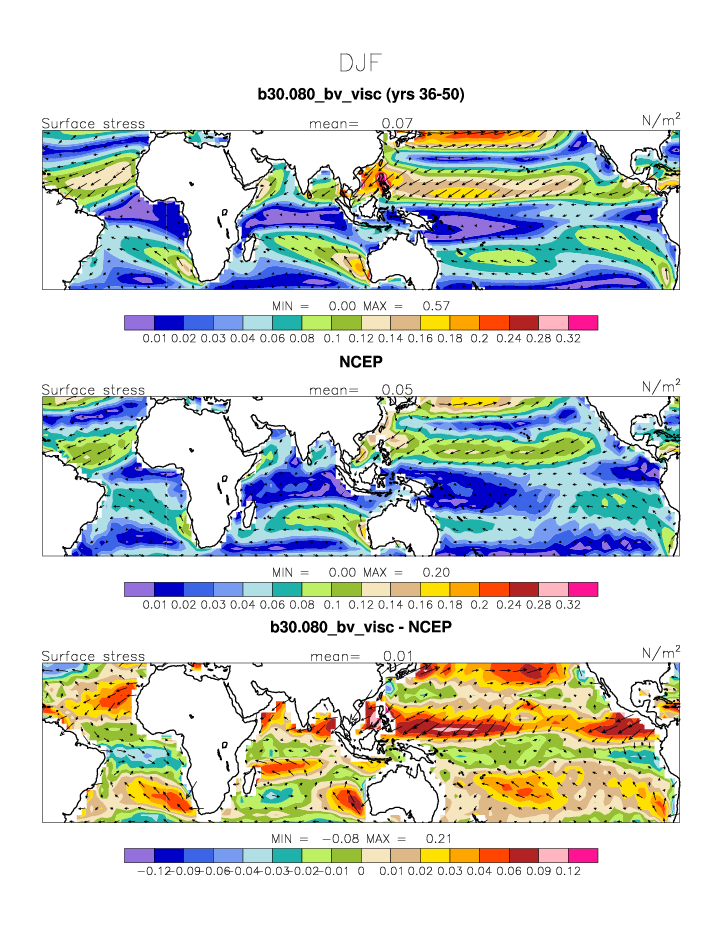
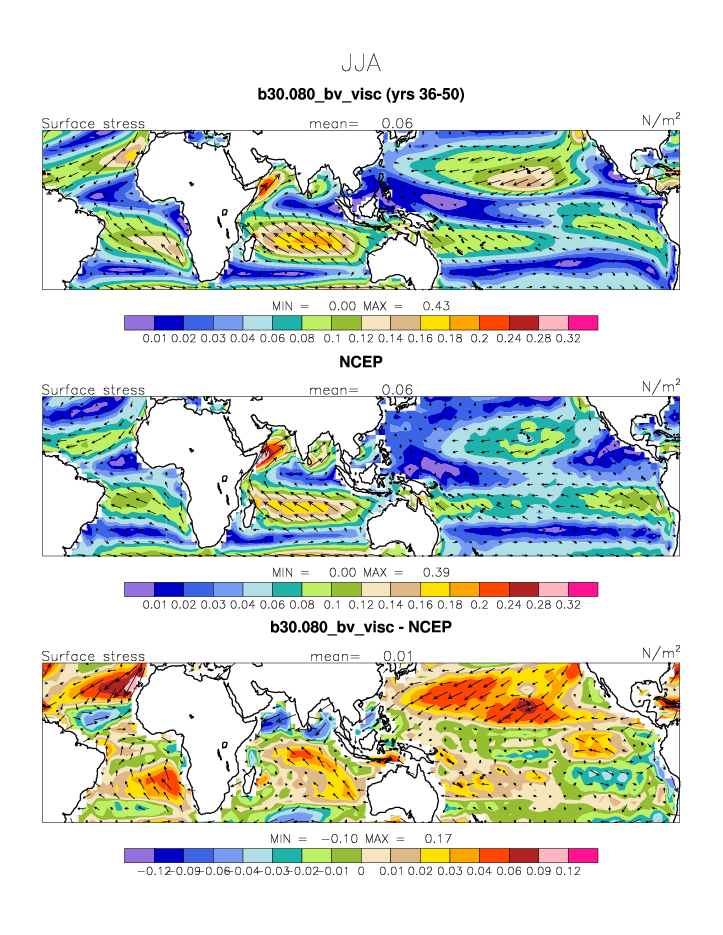
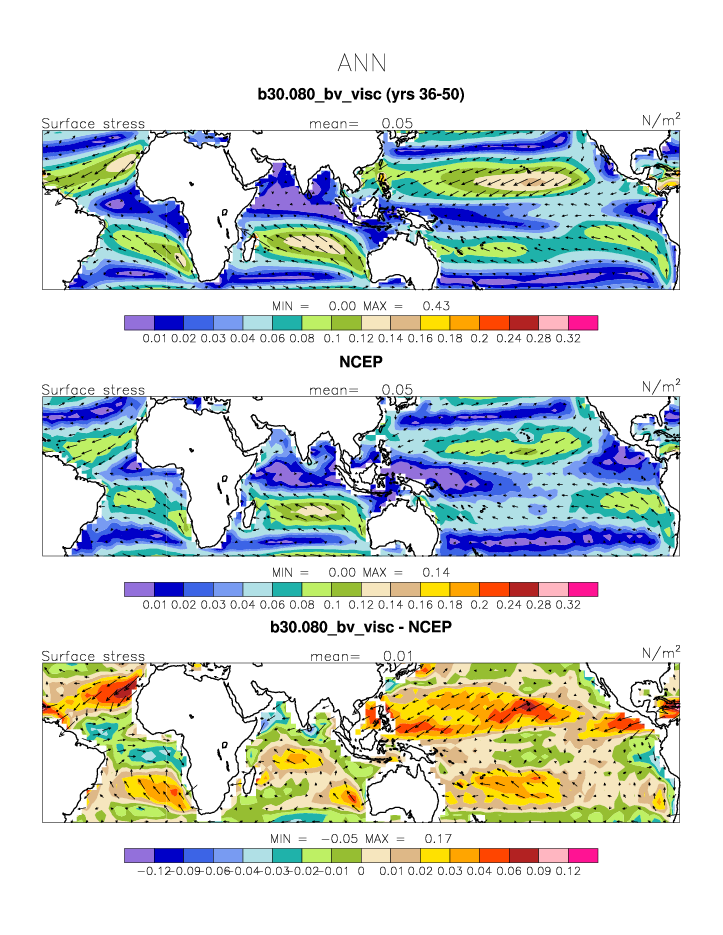
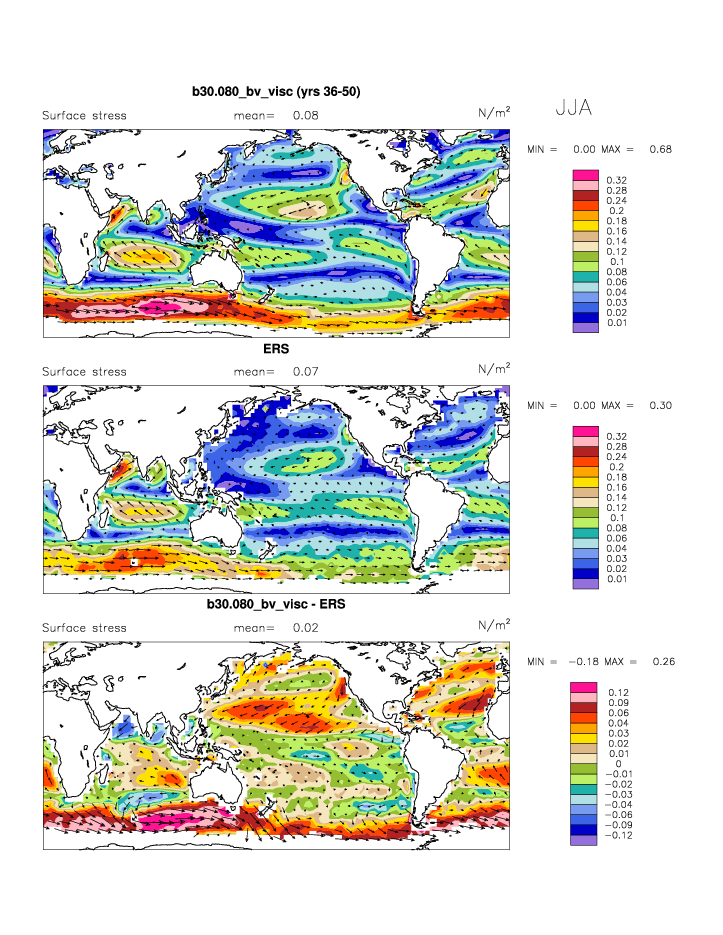
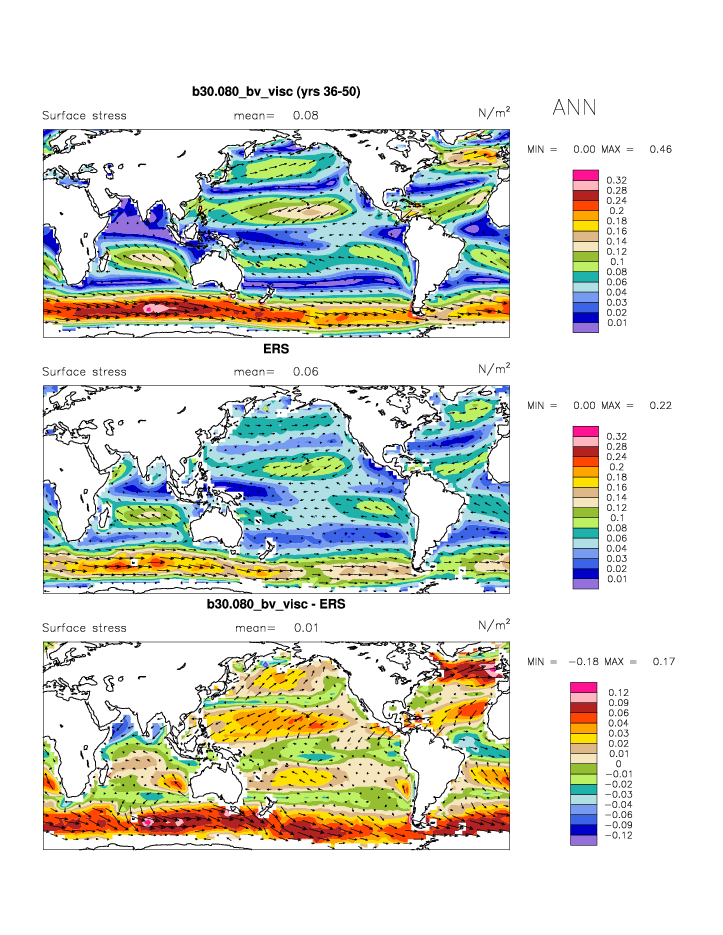
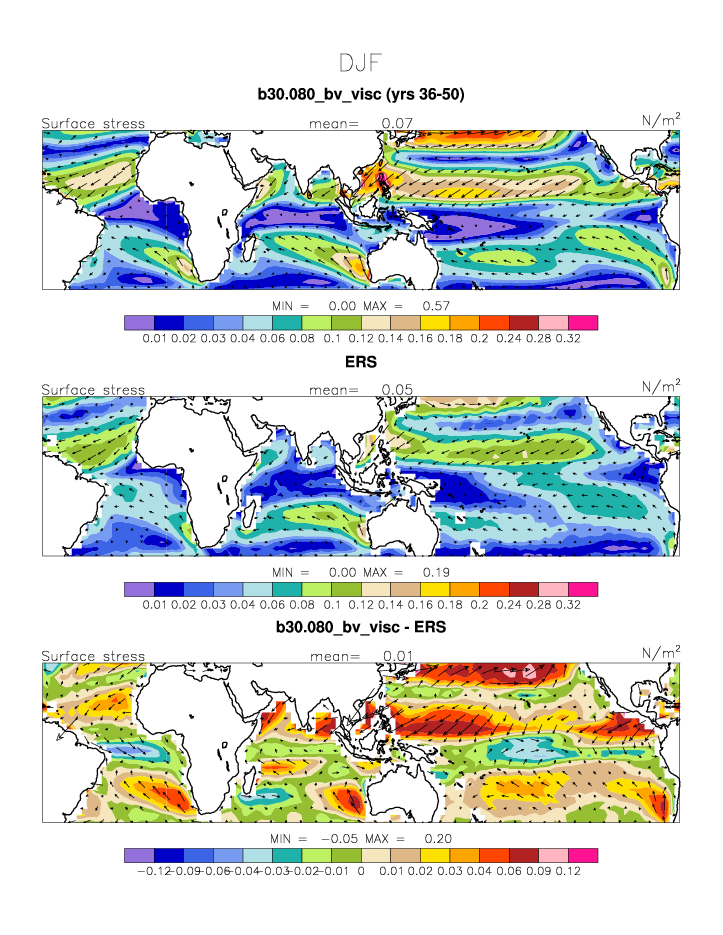
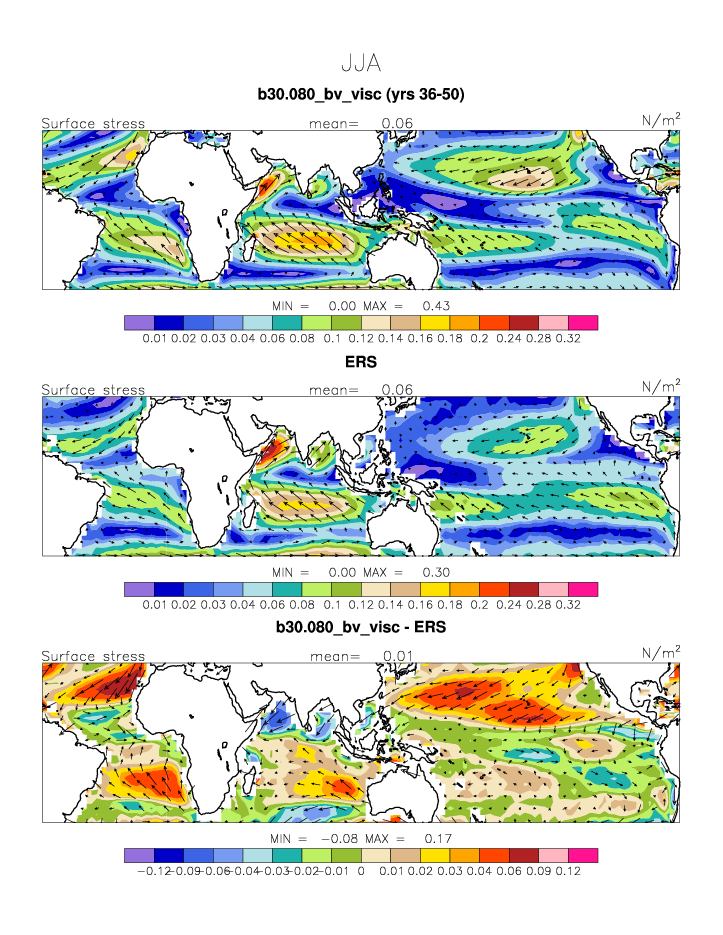
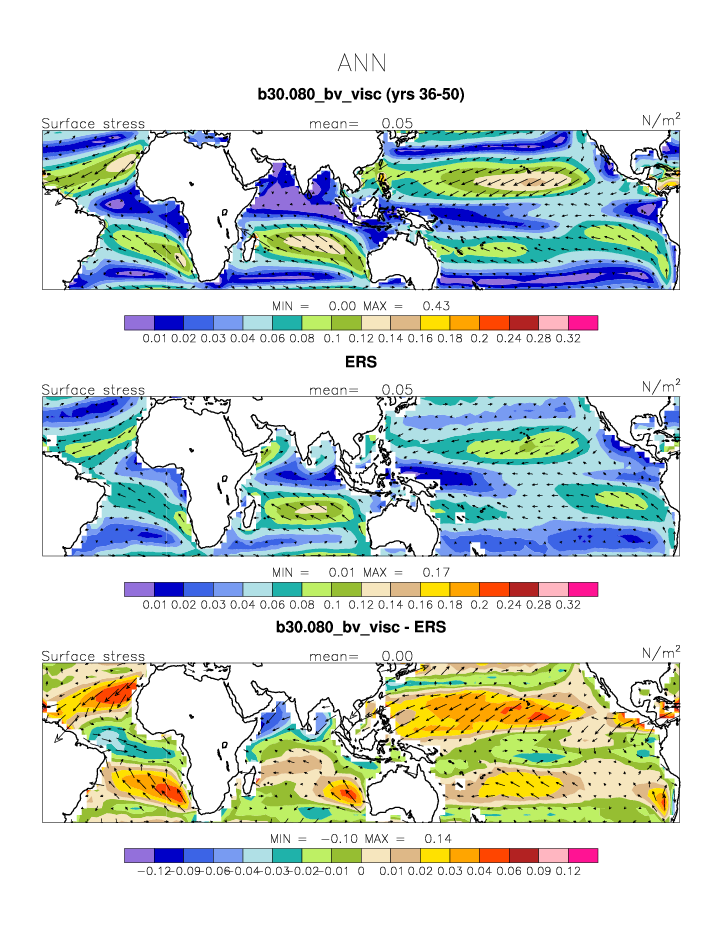
| SURF STRESS * | Surface wind stress (ocean) | plot | plot | plot |
| SURF STRESS TROP | Tropical surface wind stress (ocean) | plot | plot | plot |
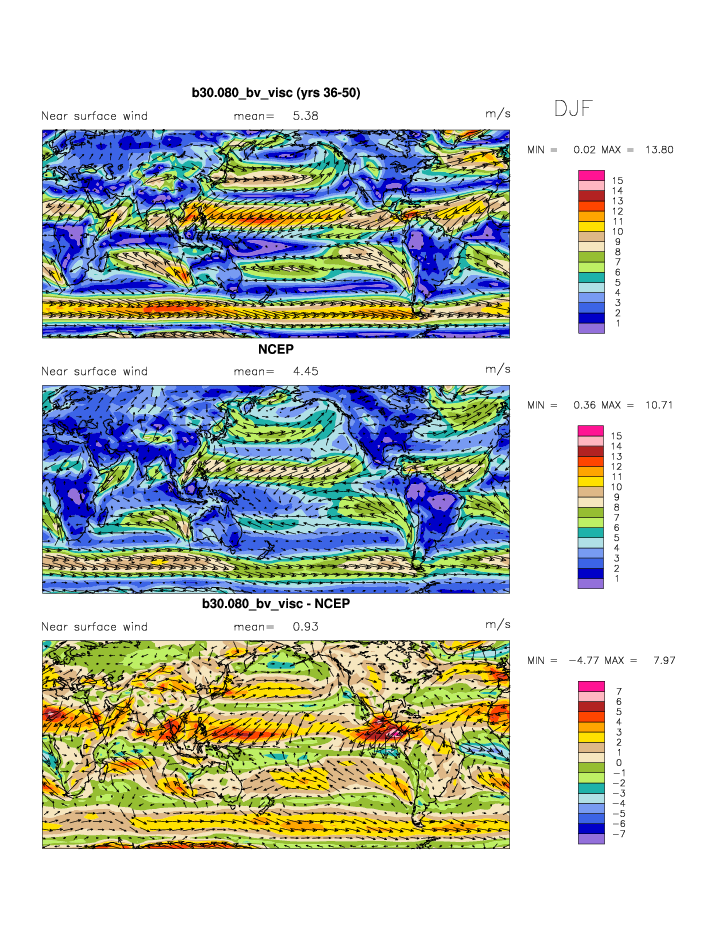
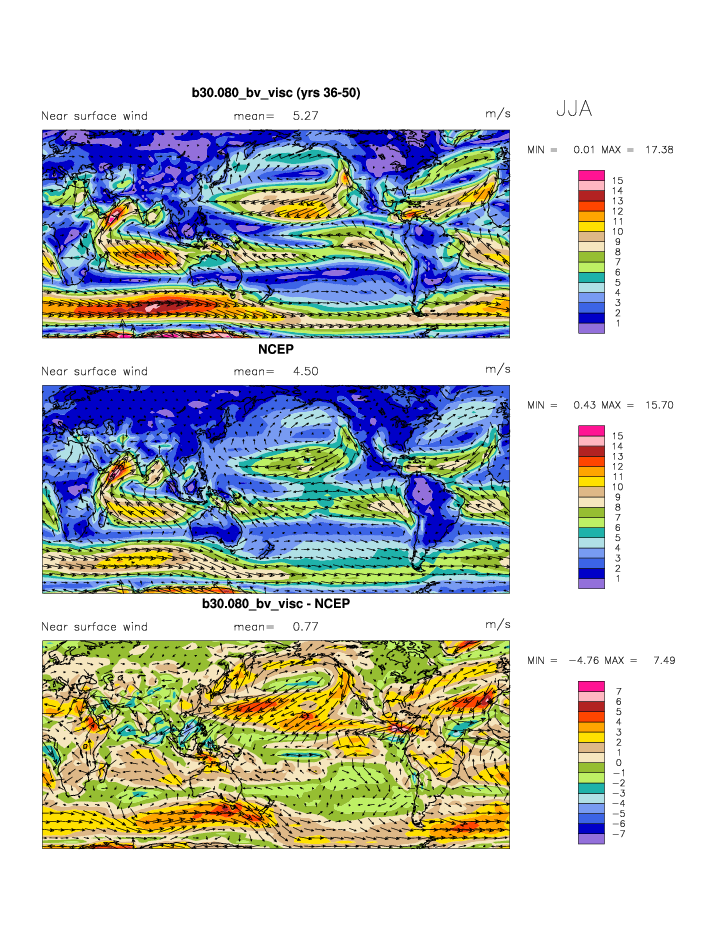
| SURF WIND | Near surface wind | plot | plot | plot |
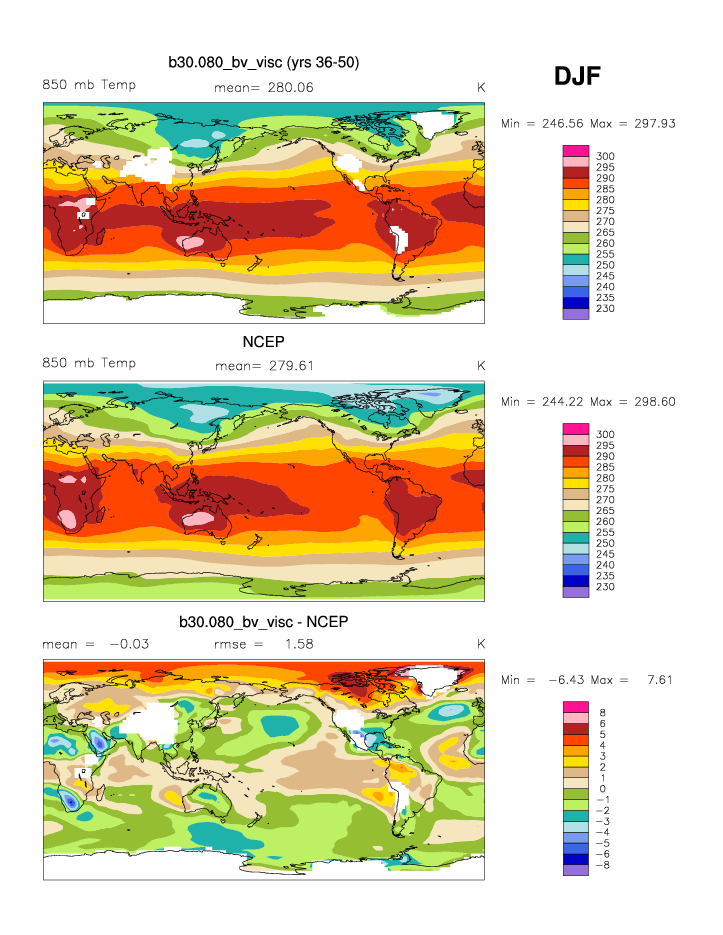
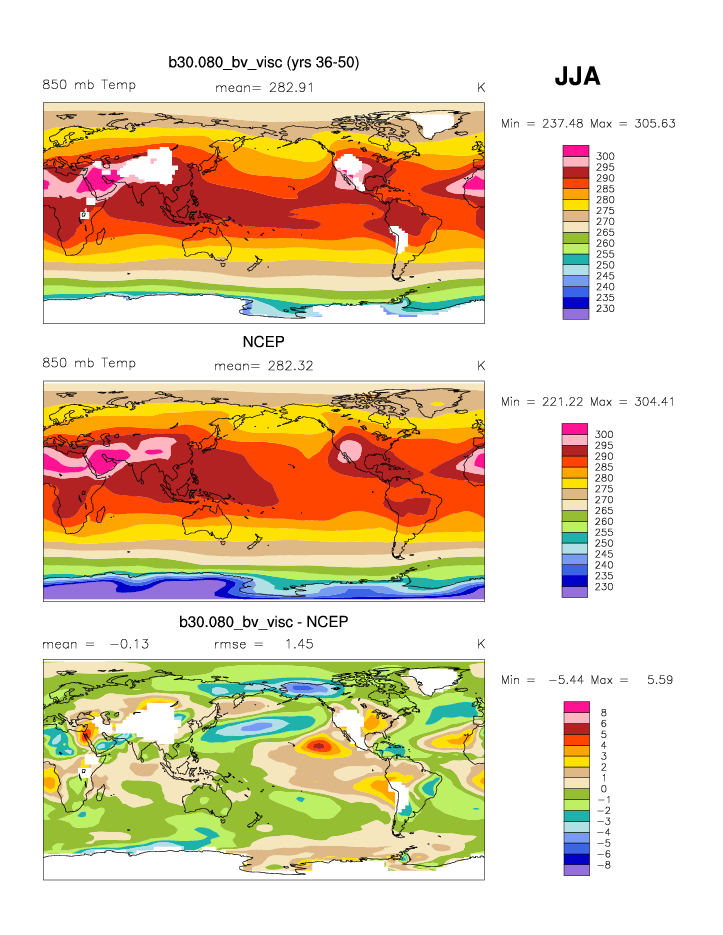
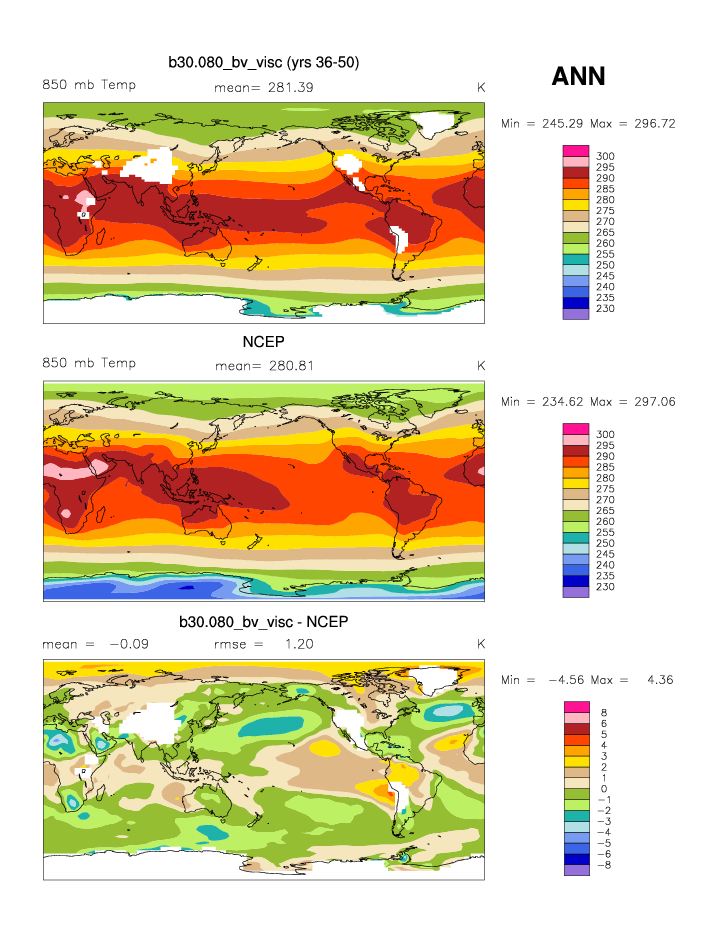
| T 850 * | 850 mb temperature | plot | plot | plot |
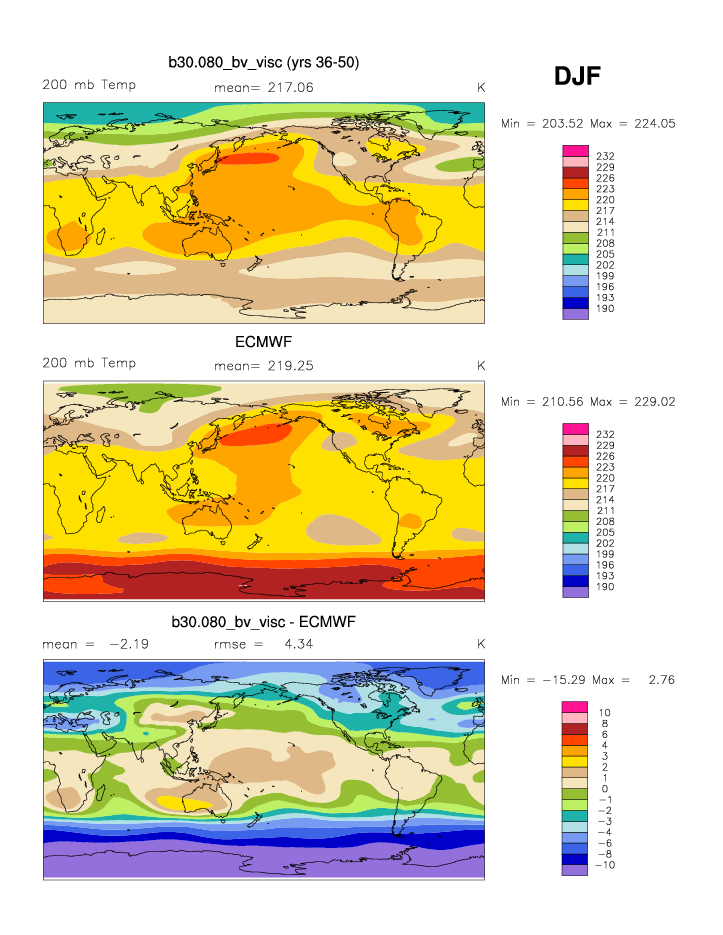
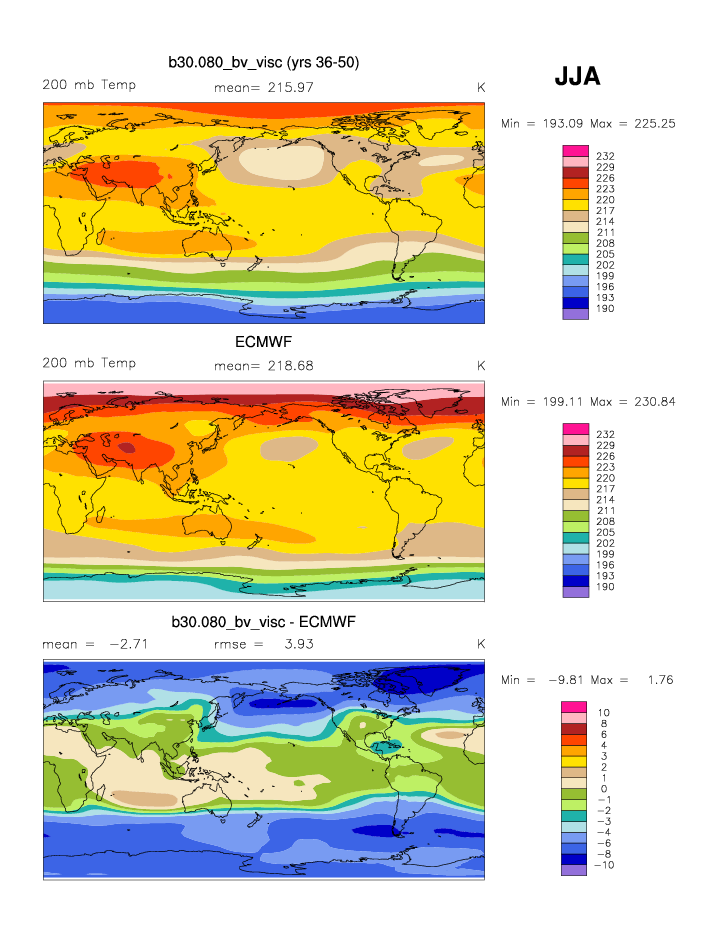
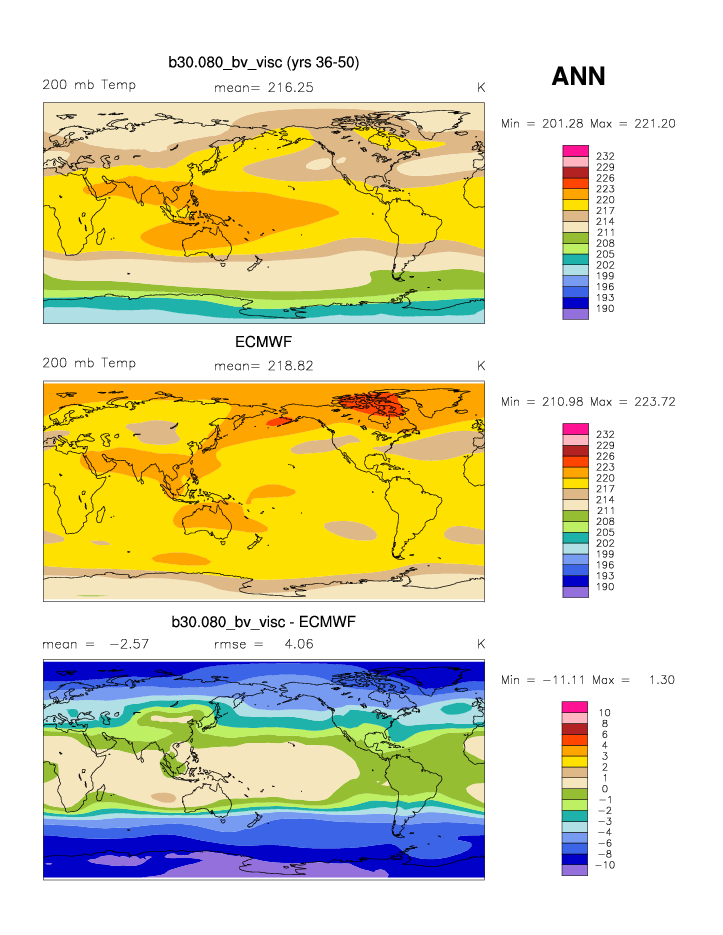
| T 200 | 200 mb temperature | plot | plot | plot |
| TS * | Surface temperature | plot | plot | plot |
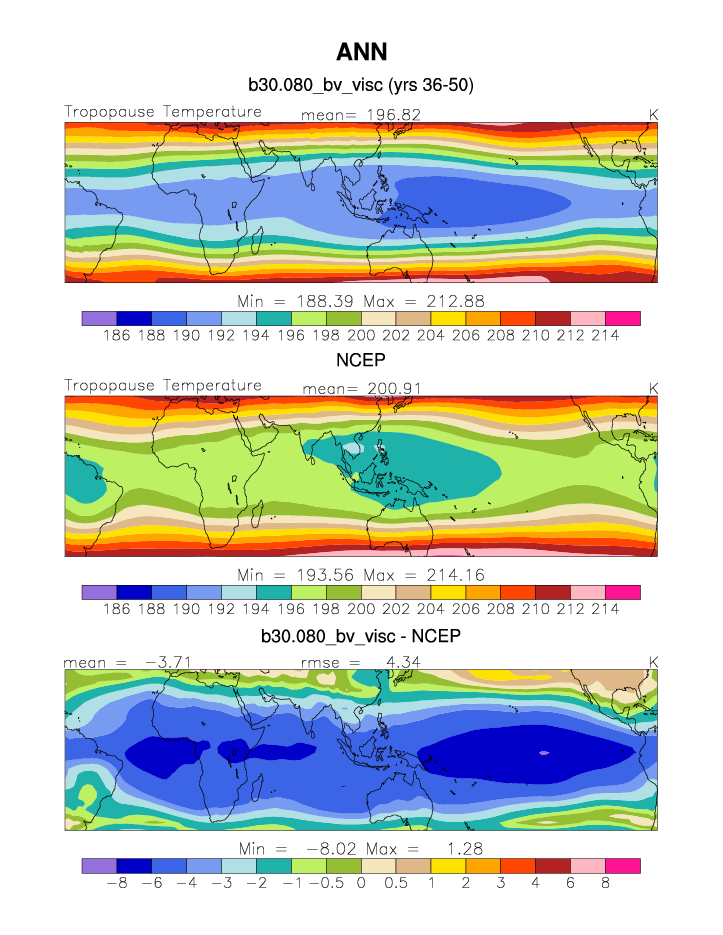
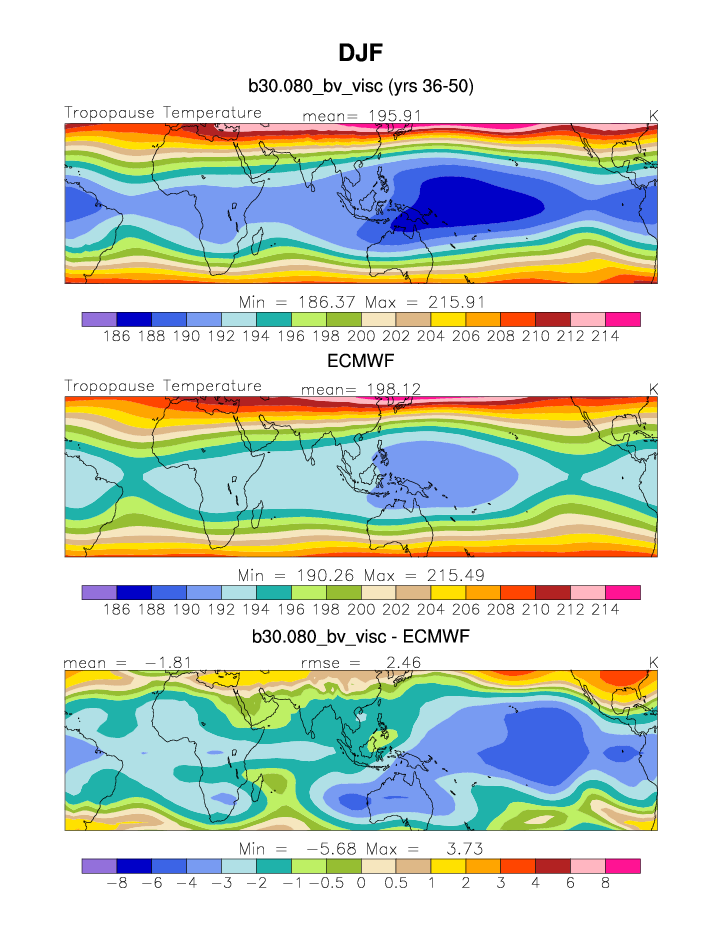
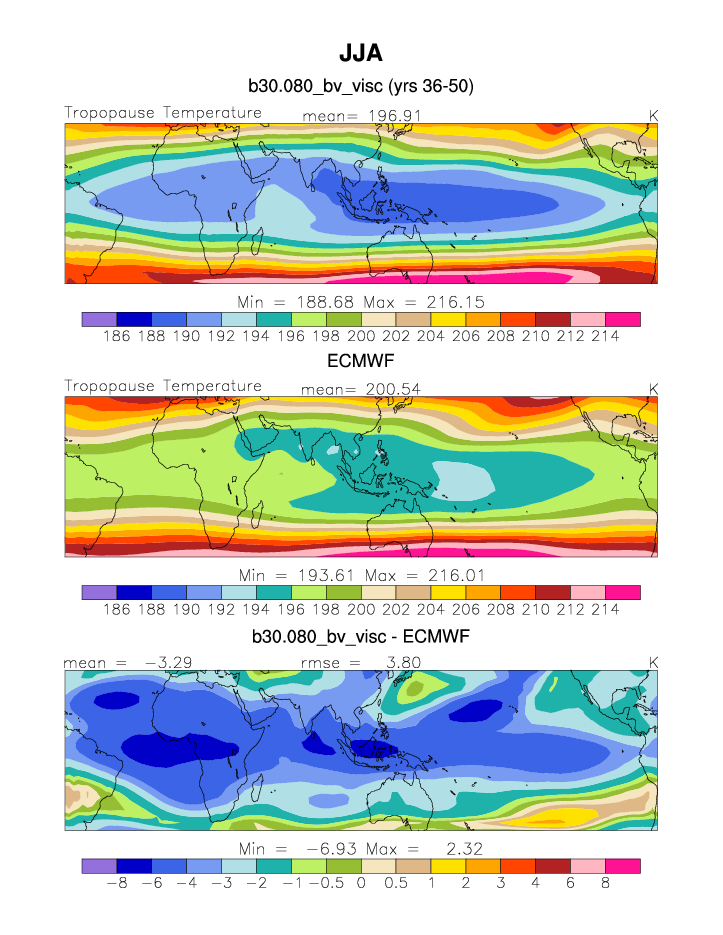
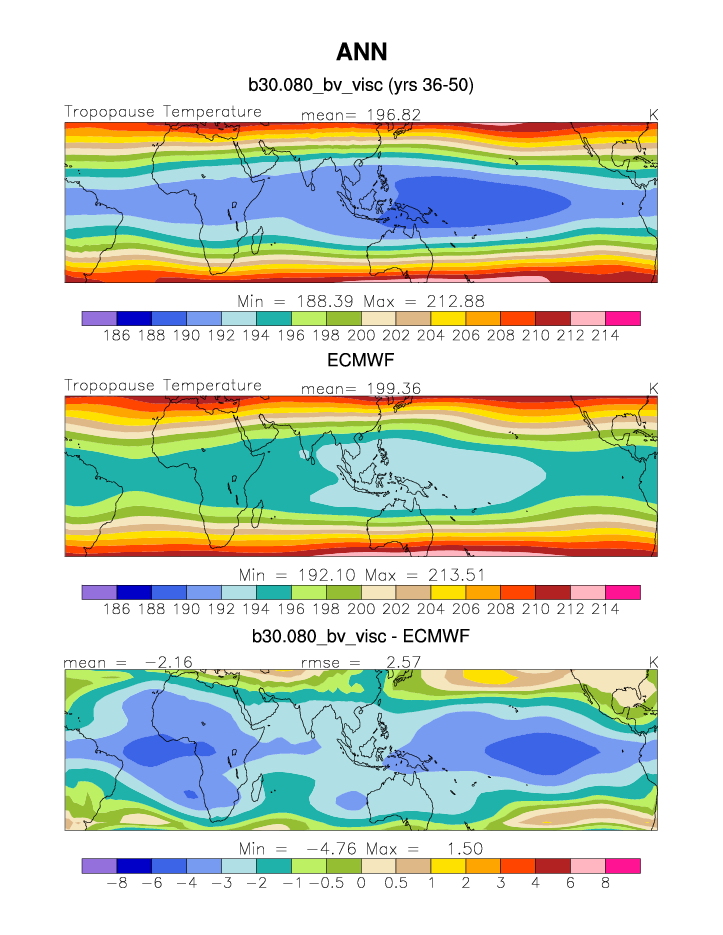
| TTRP | Tropopause temperature | plot | plot | plot |
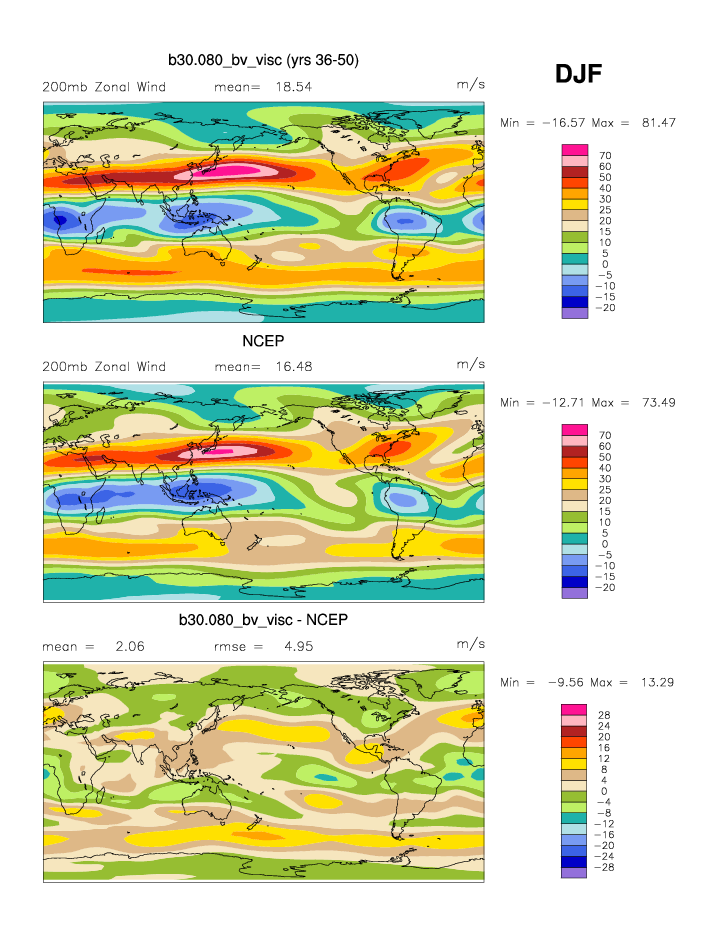
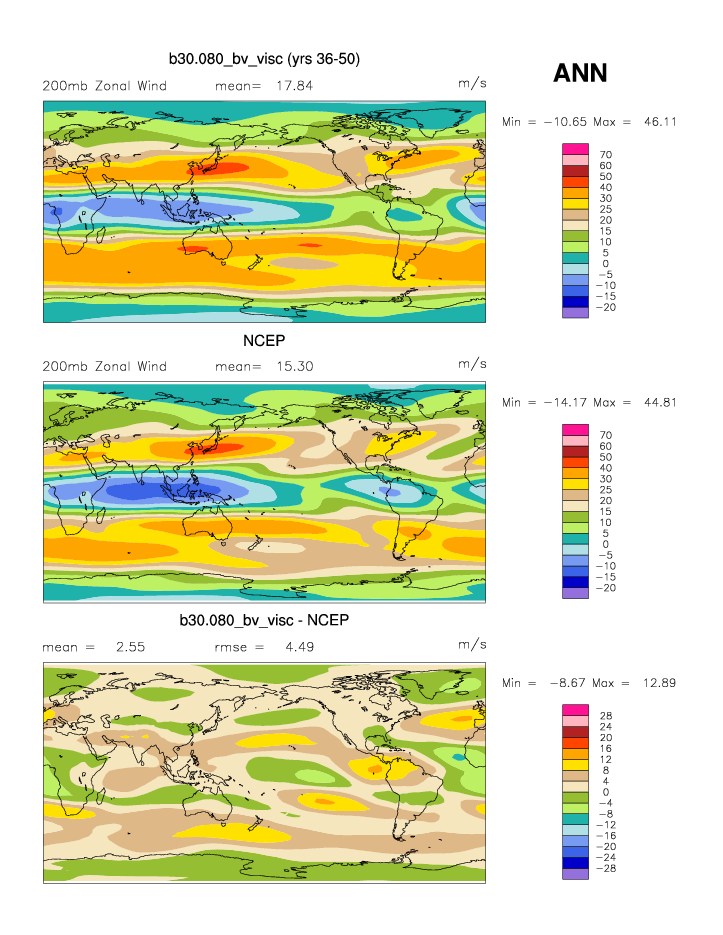
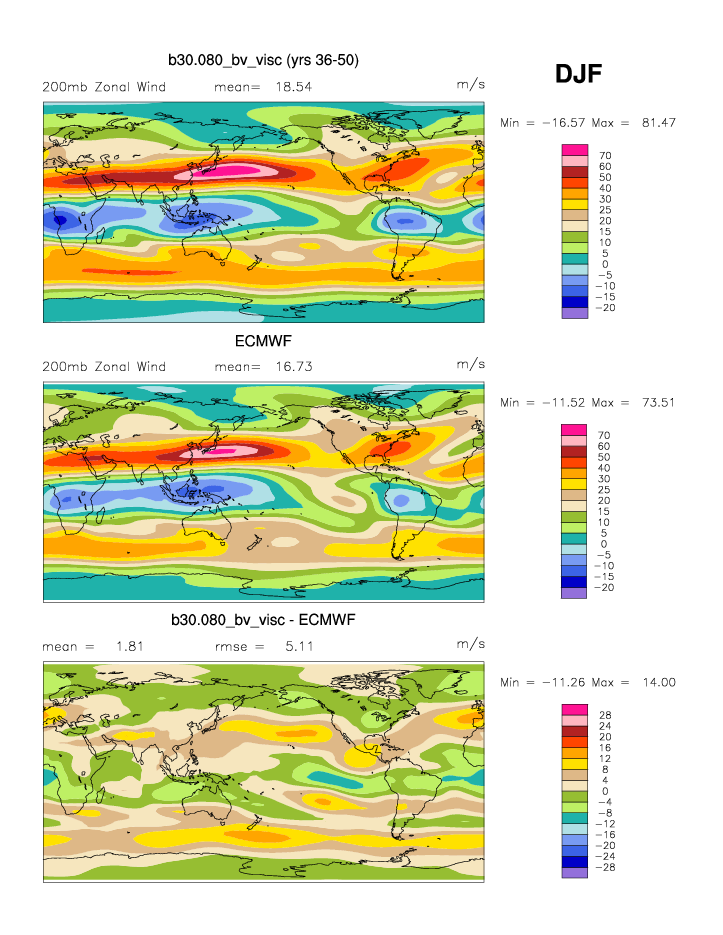
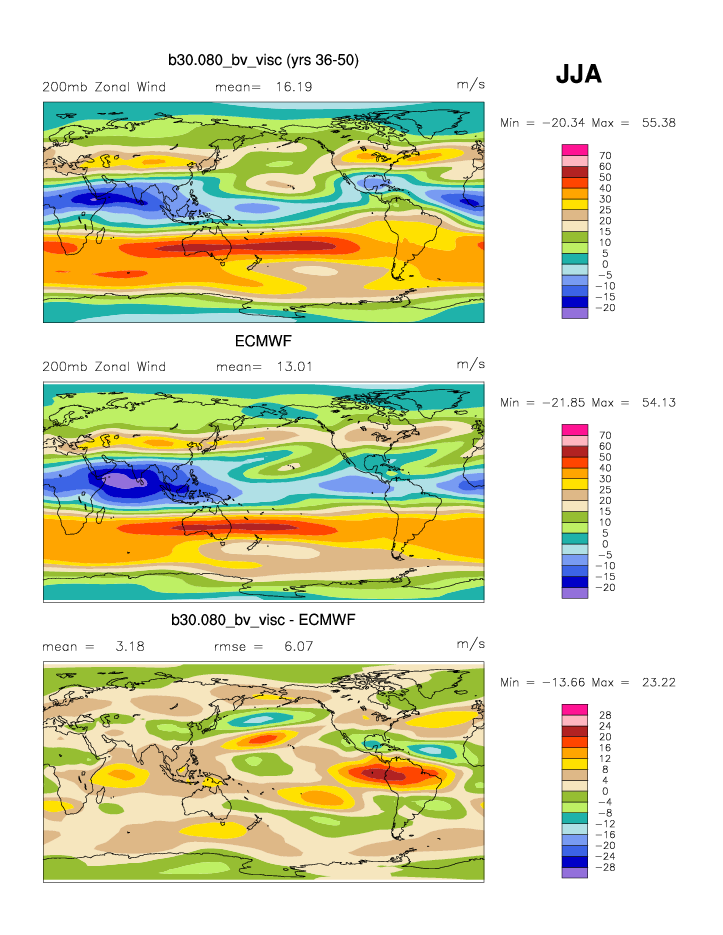
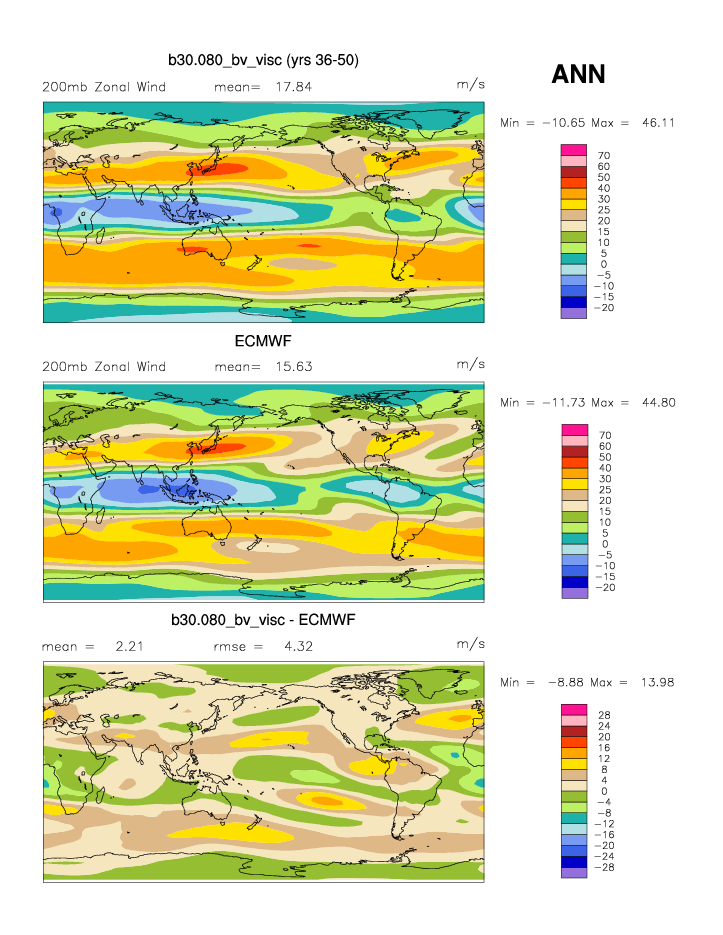
| U 200 * | 200 mb zonal wind | plot | plot | plot |
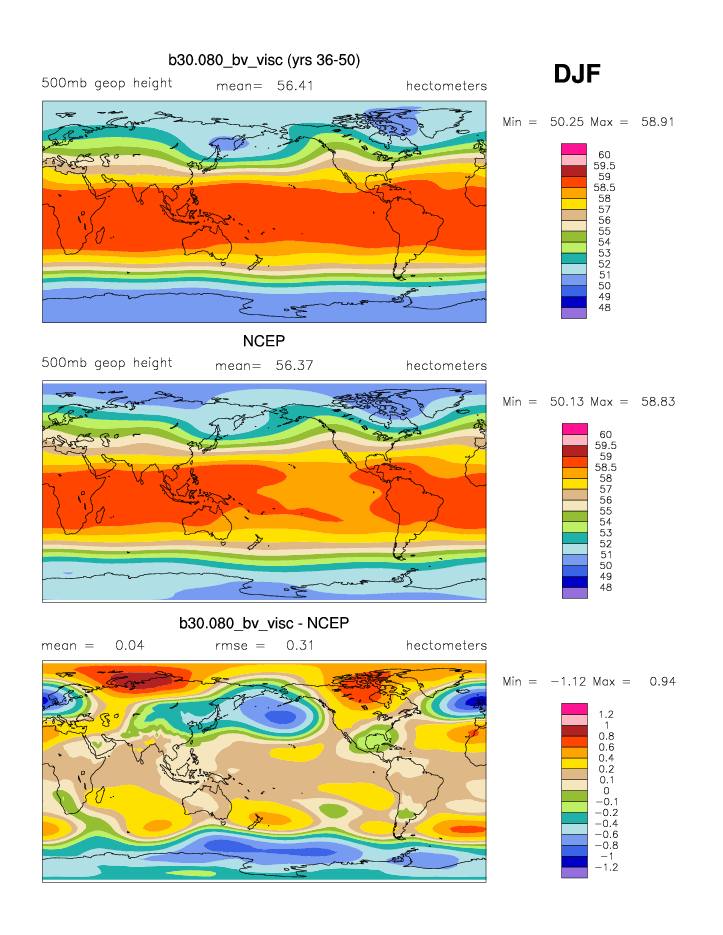
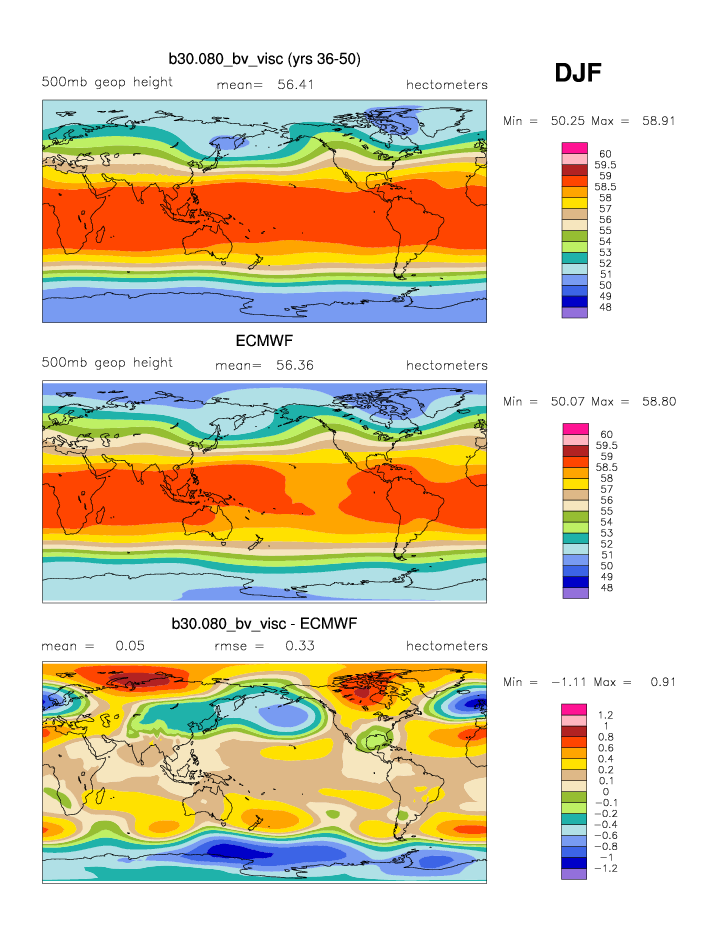
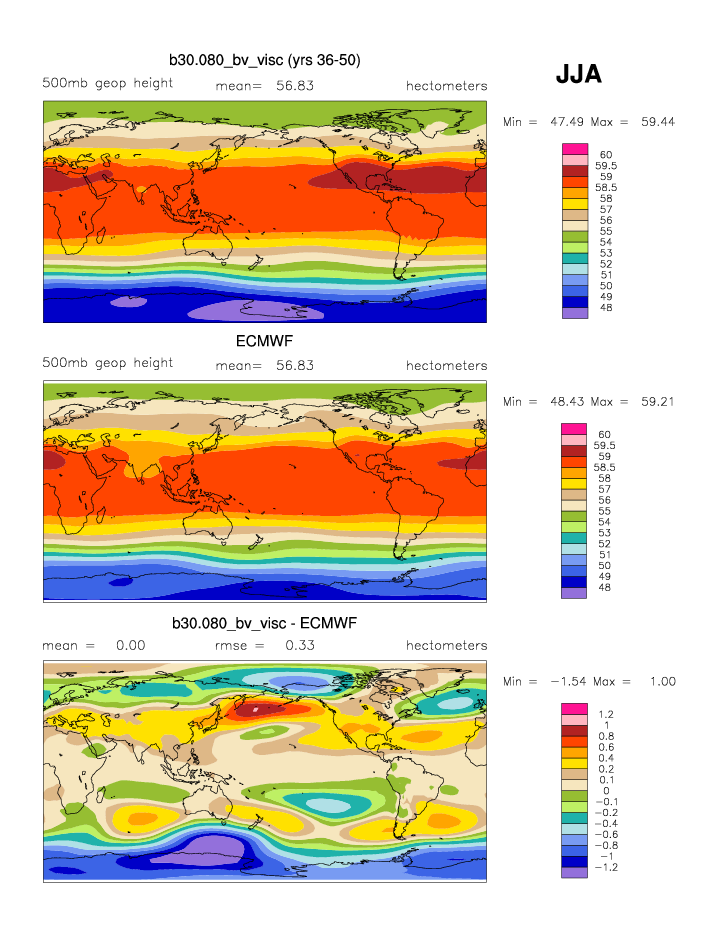
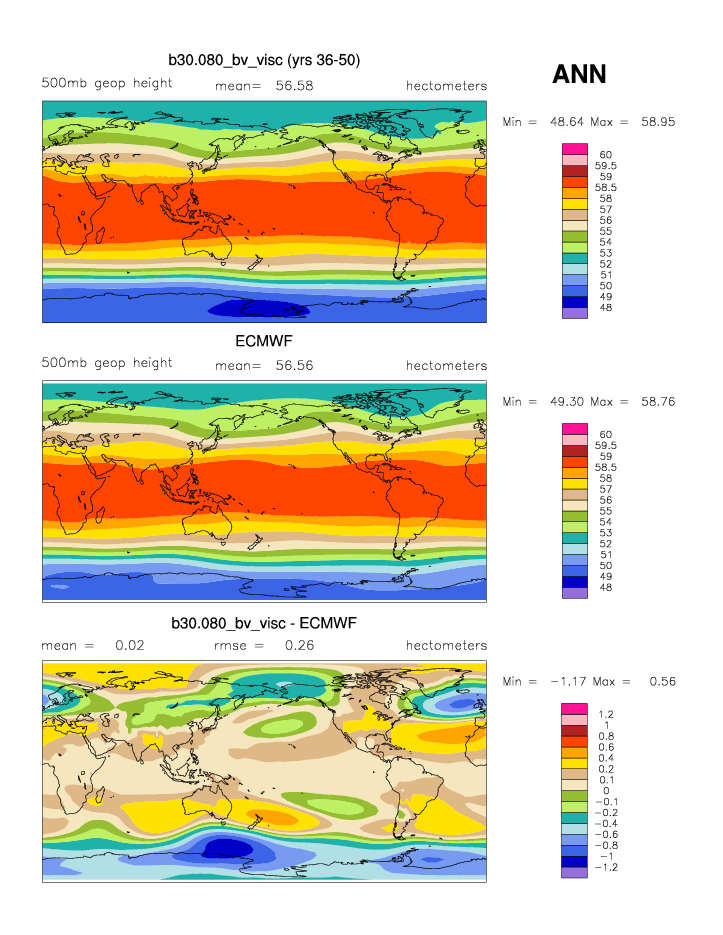
| Z 500 | 500 mb geopotential height | plot | plot | plot |
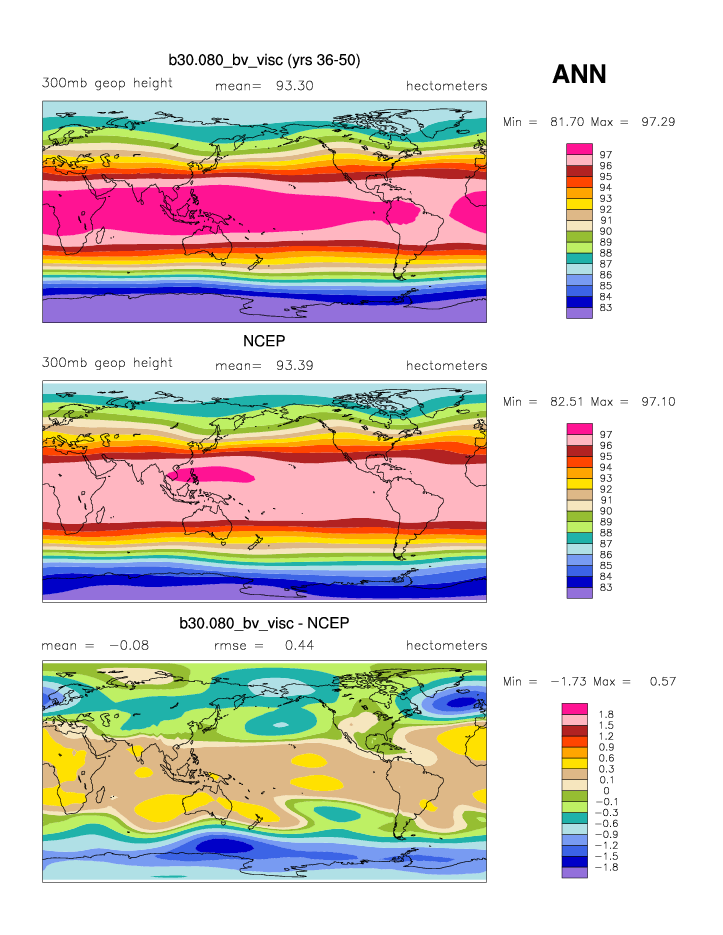
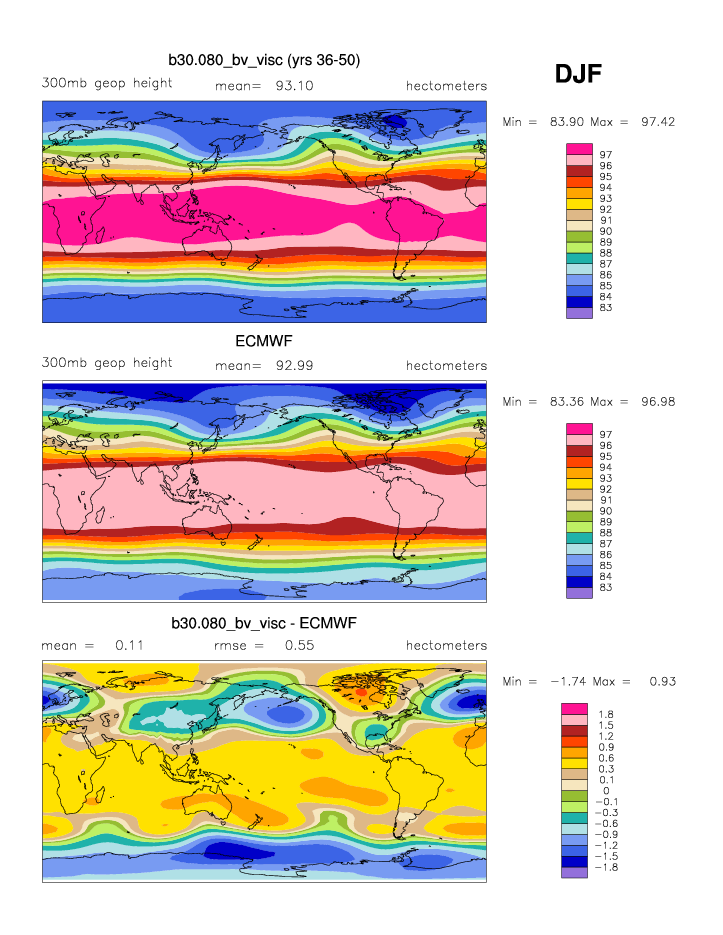
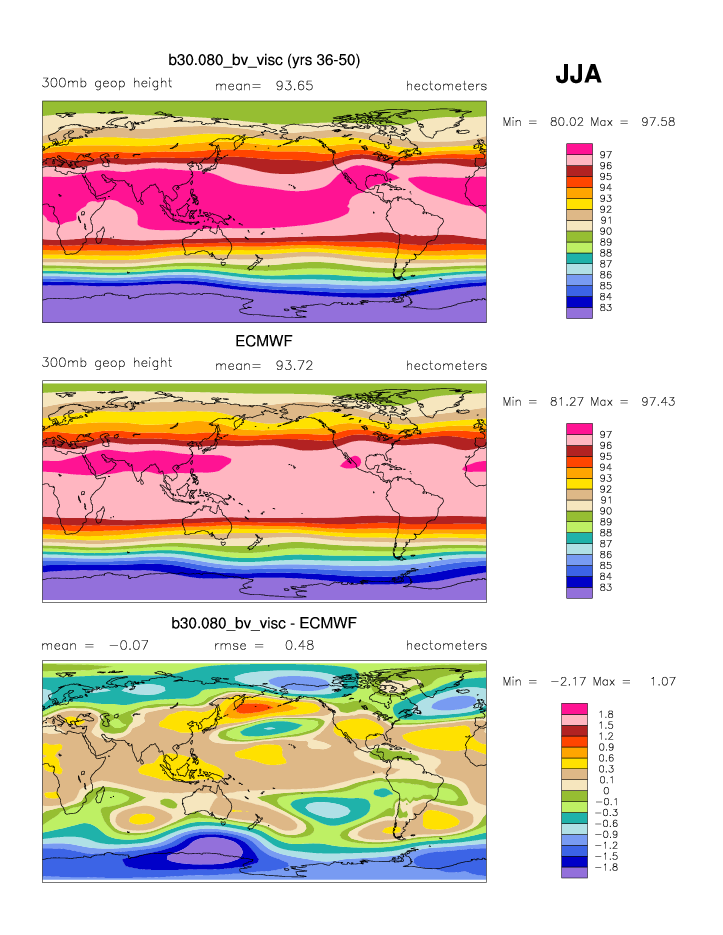
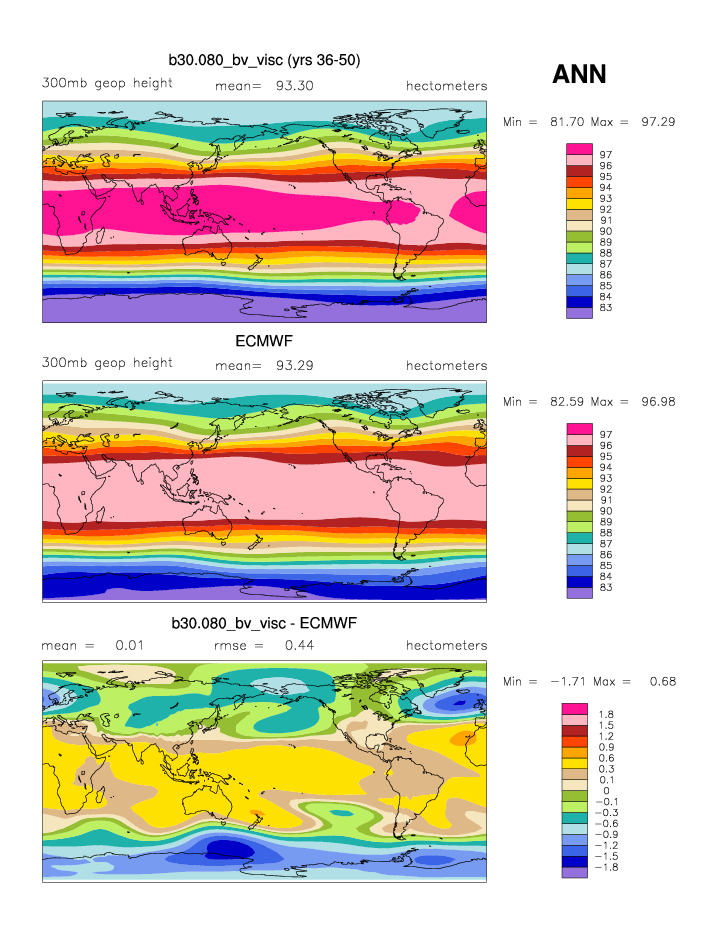
| Z 300 * | 300 mb geopotential height | plot | plot | plot |
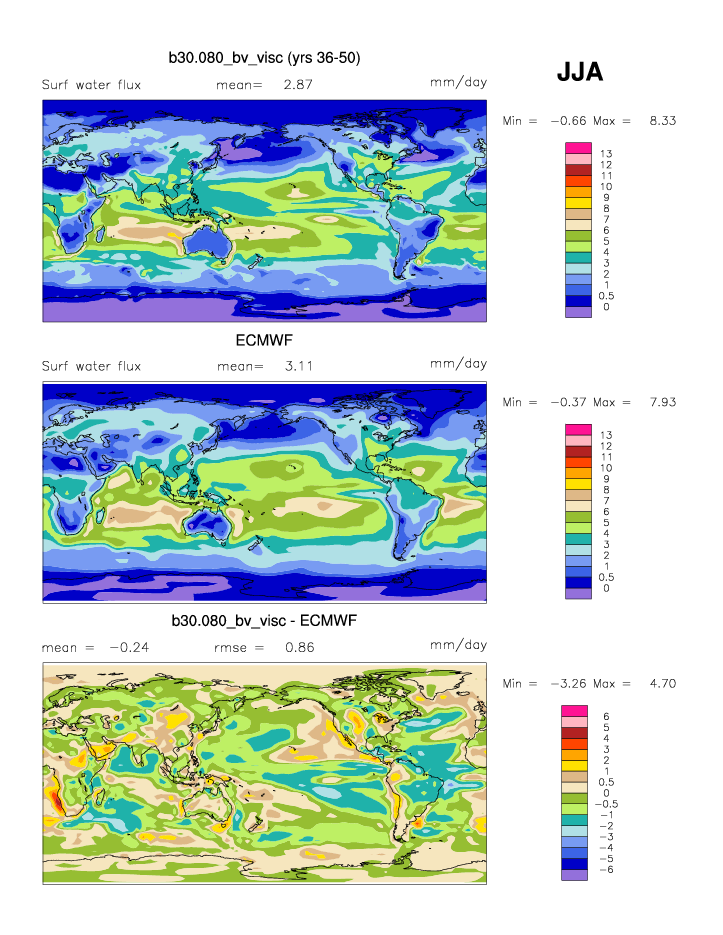
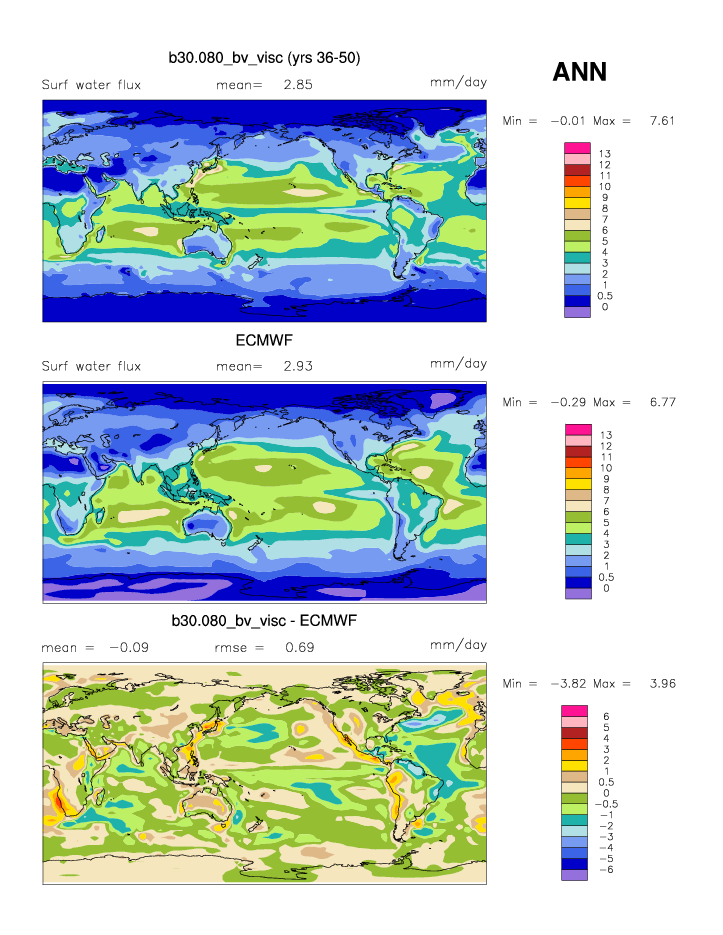
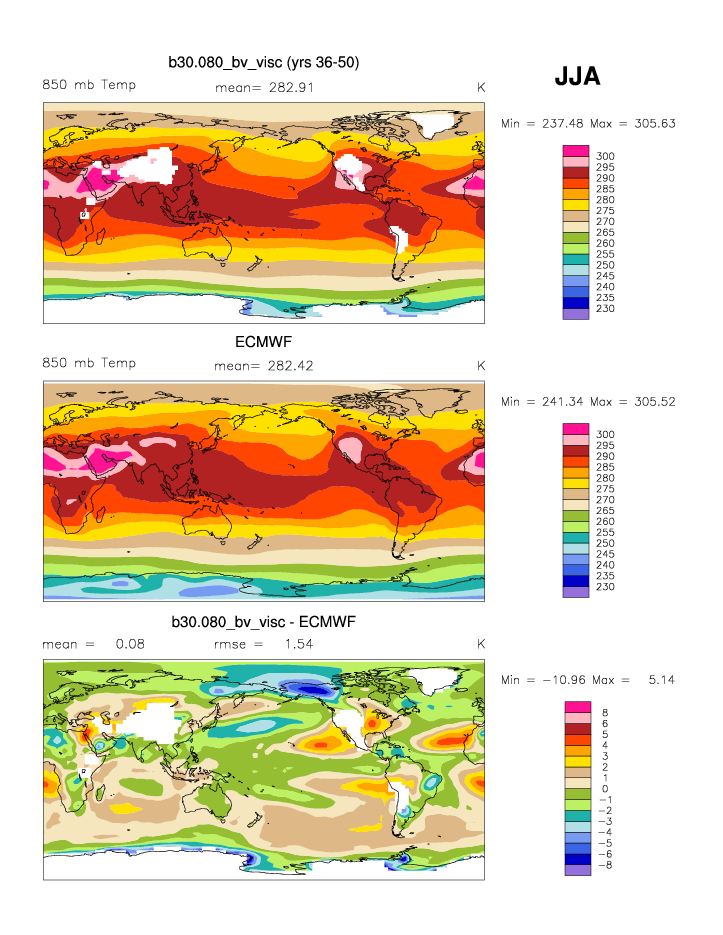
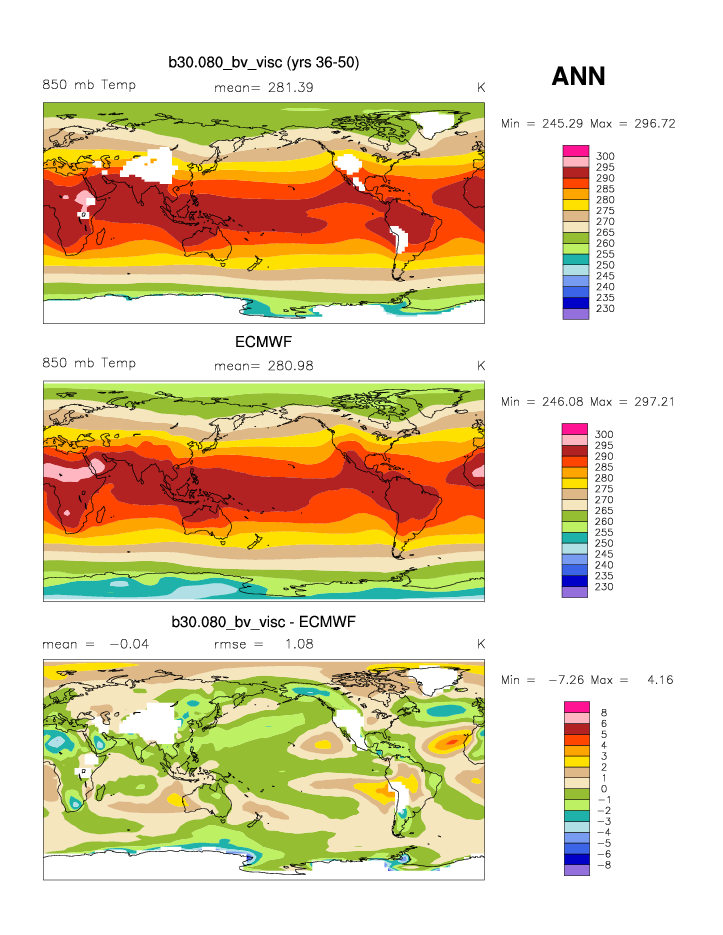
| ECMWF Reanalysis 1979-93 | DJF | JJA | ANN | |
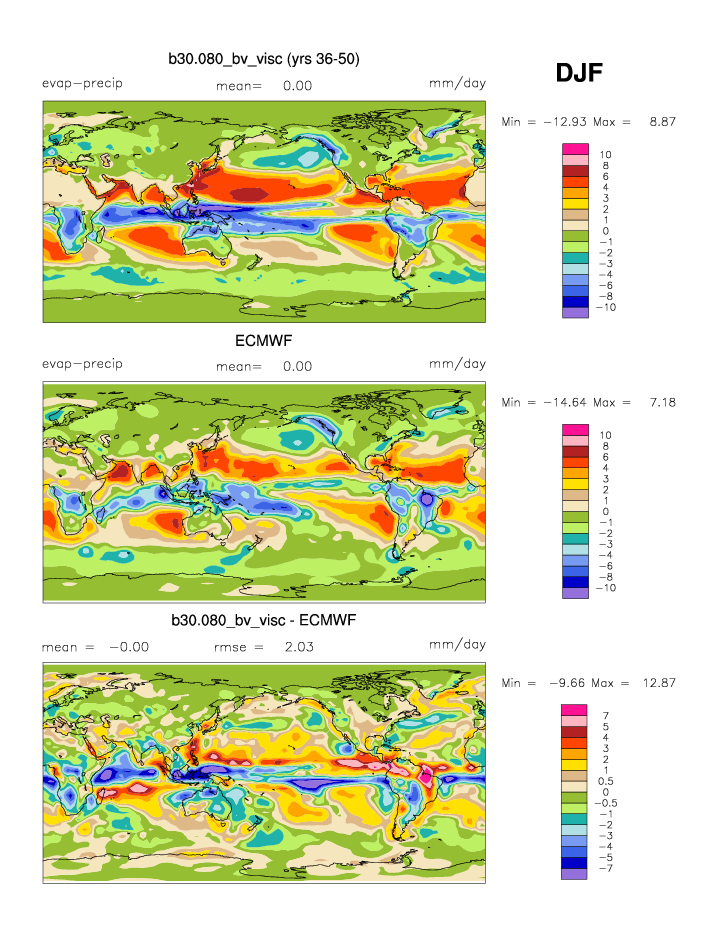
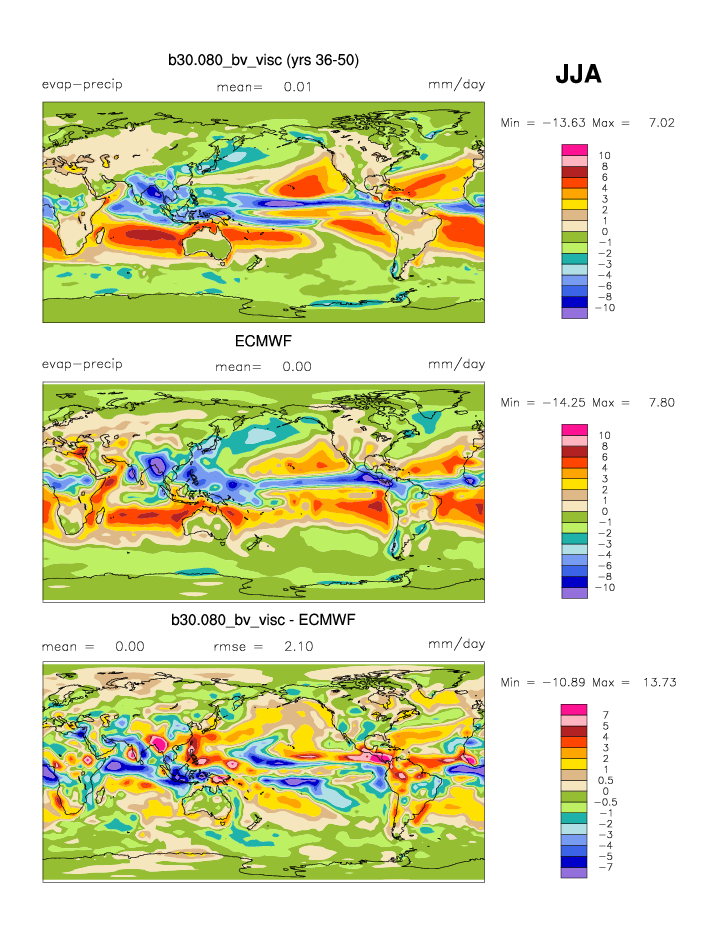
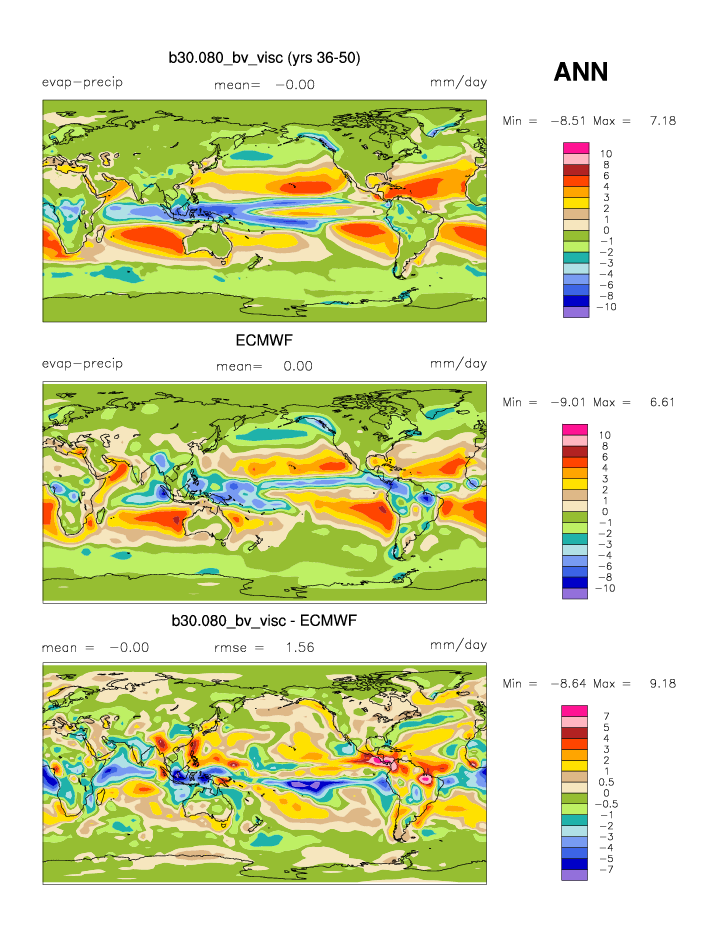
| EP * | Evaporation - precipitation | plot | plot | plot |
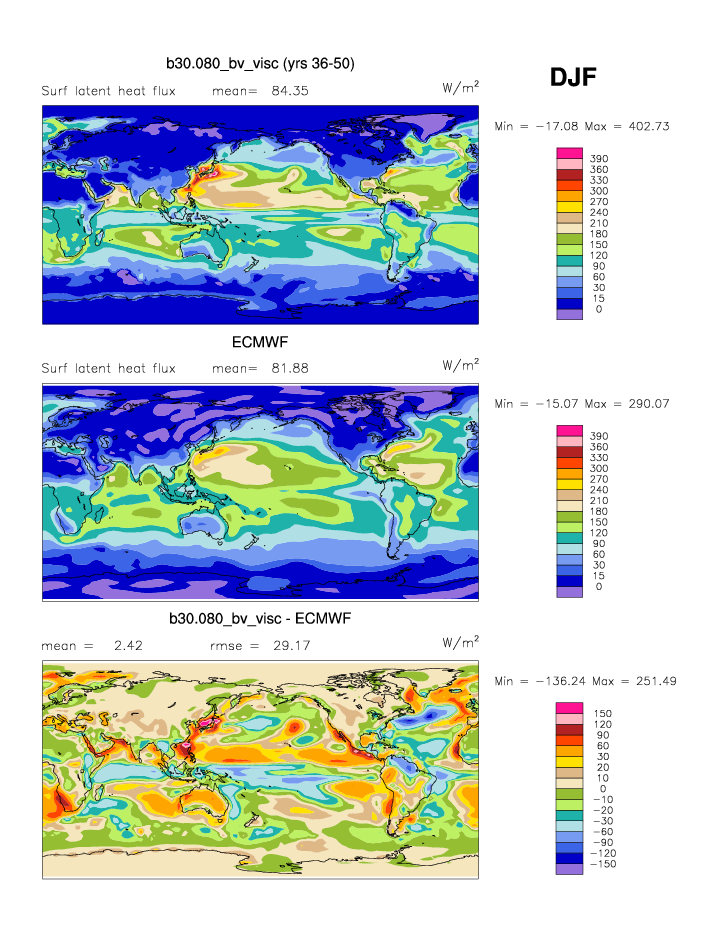
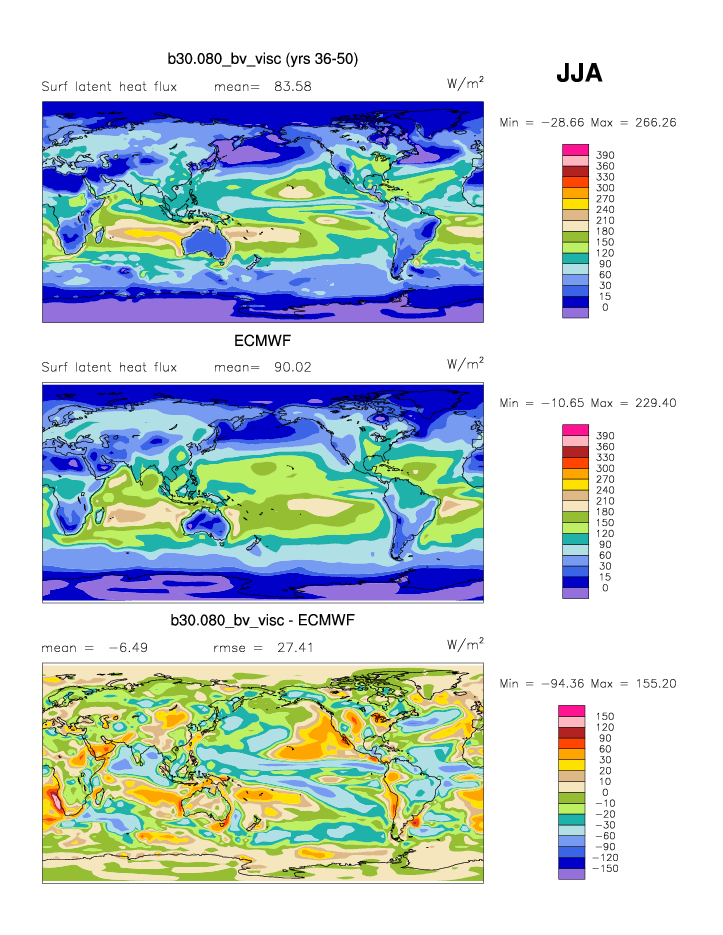
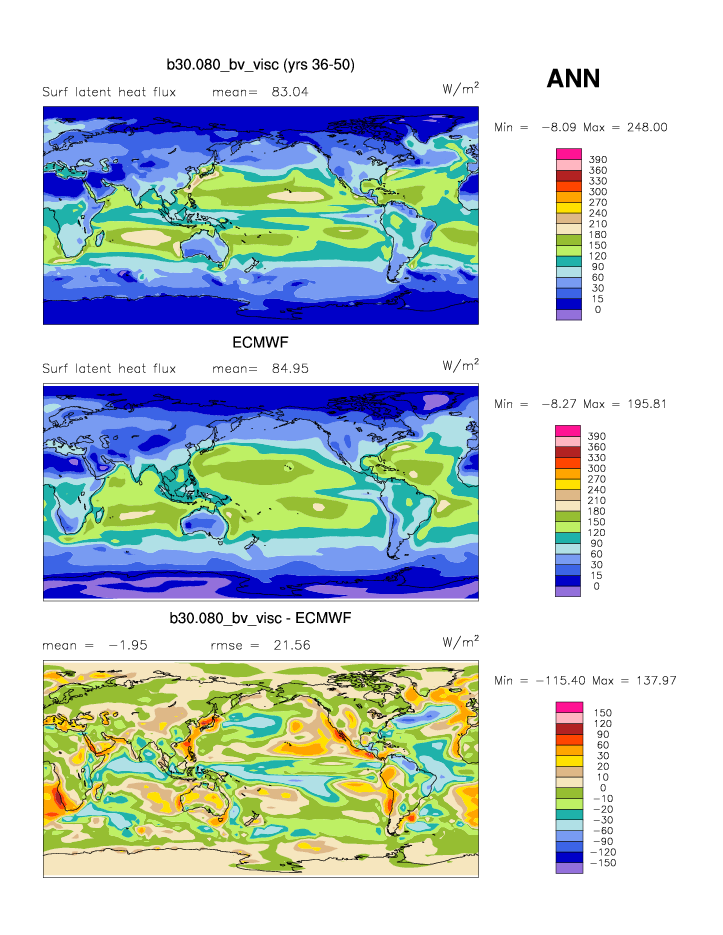
| LHFLX * | Surface latent heat flux | plot | plot | plot |
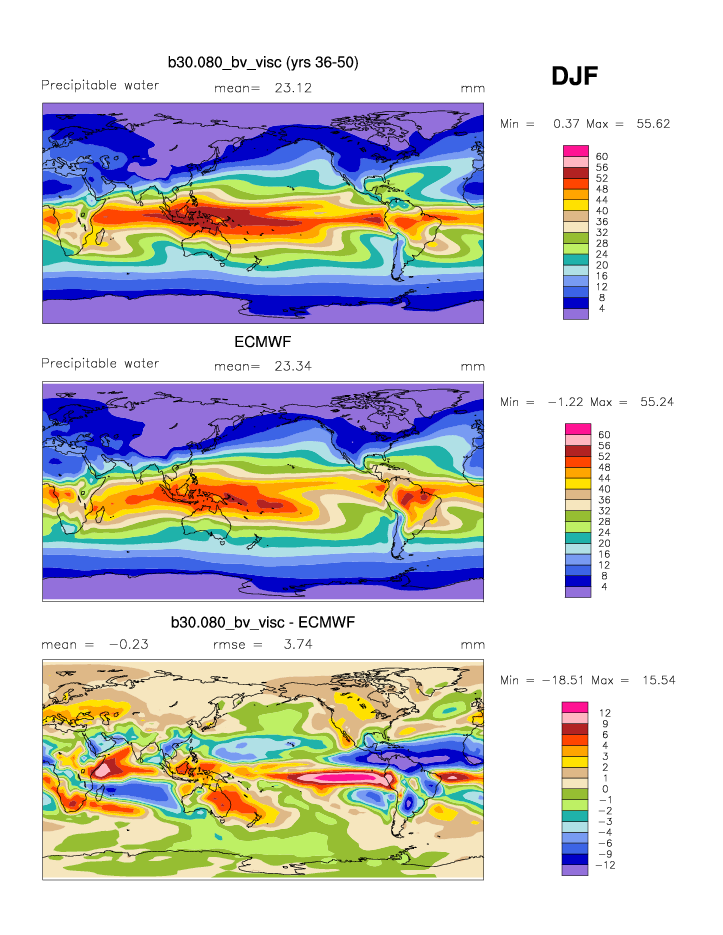
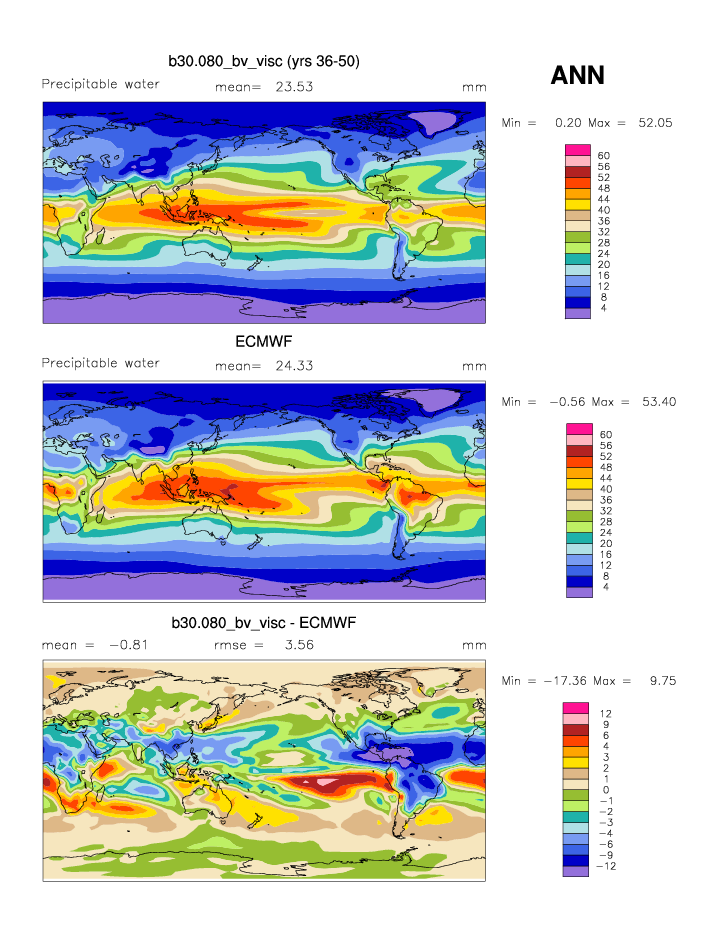
| PREH2O * | Precipitable water | plot | plot | plot |
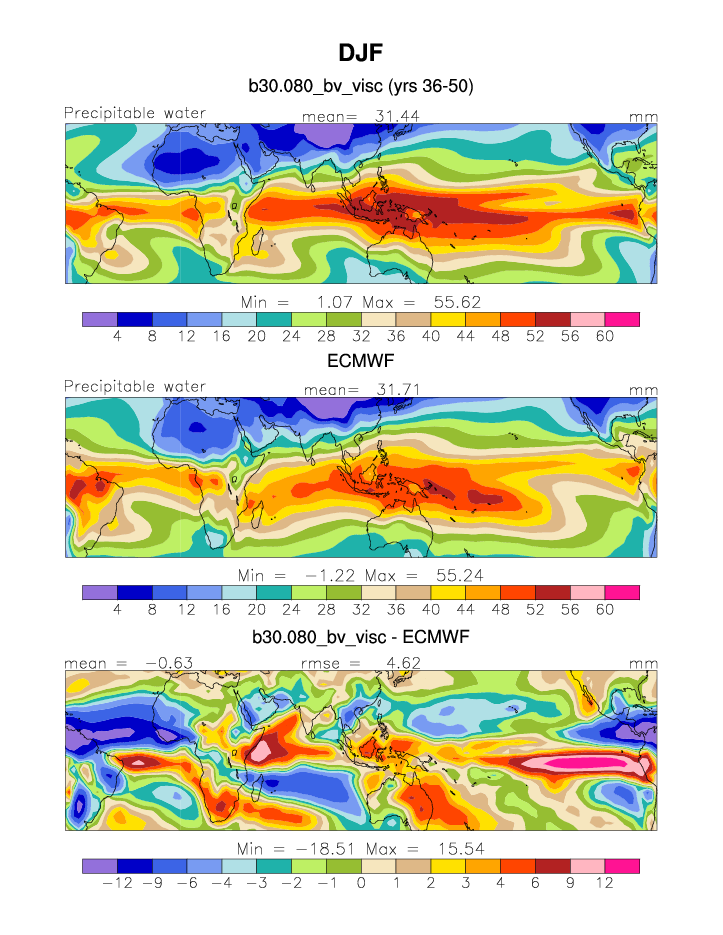
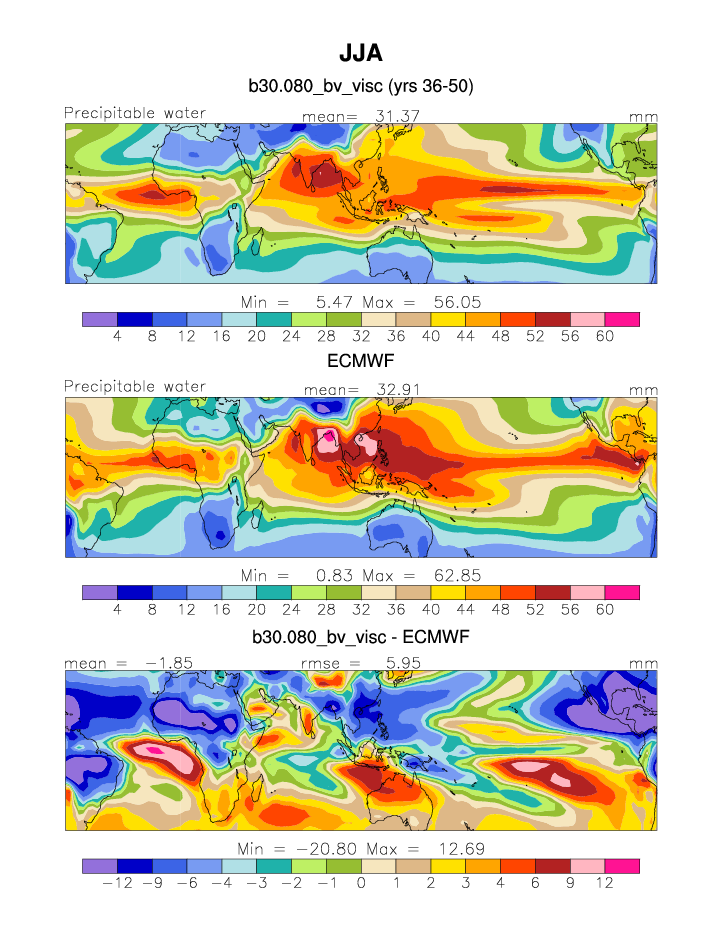
| PREH2O TROP | Tropical precipitable water | plot | plot | plot |
| QFLX | Surface water flux | plot | plot | plot |
| T 850 * | 850 mb temperature | plot | plot | plot |
| T 200 | 200 mb temperature | plot | plot | plot |
| TTRP | Tropopause temperature | plot | plot | plot |
| U 200 * | 200 mb zonal wind | plot | plot | plot |
| Z 500 | 500 mb geopotential height | plot | plot | plot |
| Z 300 * | 300 mb geopotential height | plot | plot | plot |
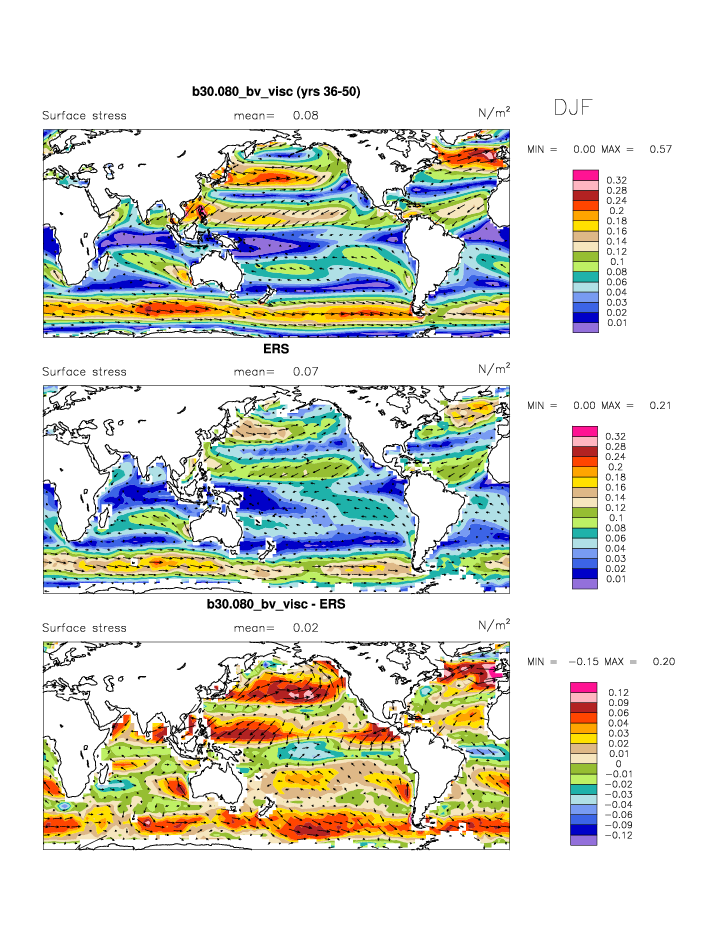
| ERS Scatterometer 1992-2000 | DJF | JJA | ANN | |
| SURF STRESS * | Surface wind stress (ocean) | plot | plot | plot |
| SURF STRESS TROP | Tropical surface wind stress (ocean) | plot | plot | plot |
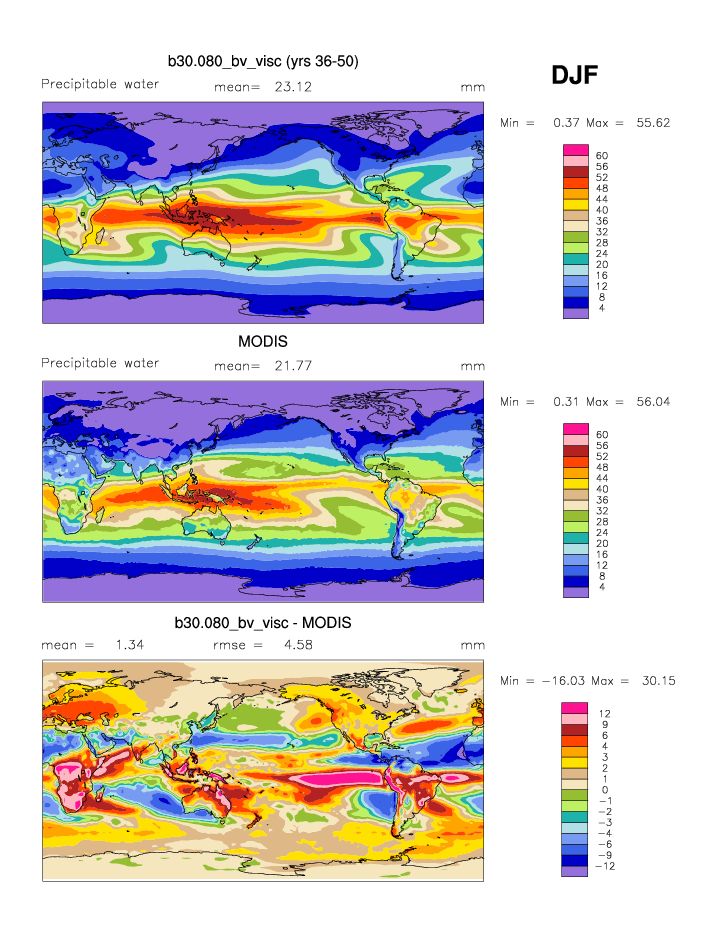
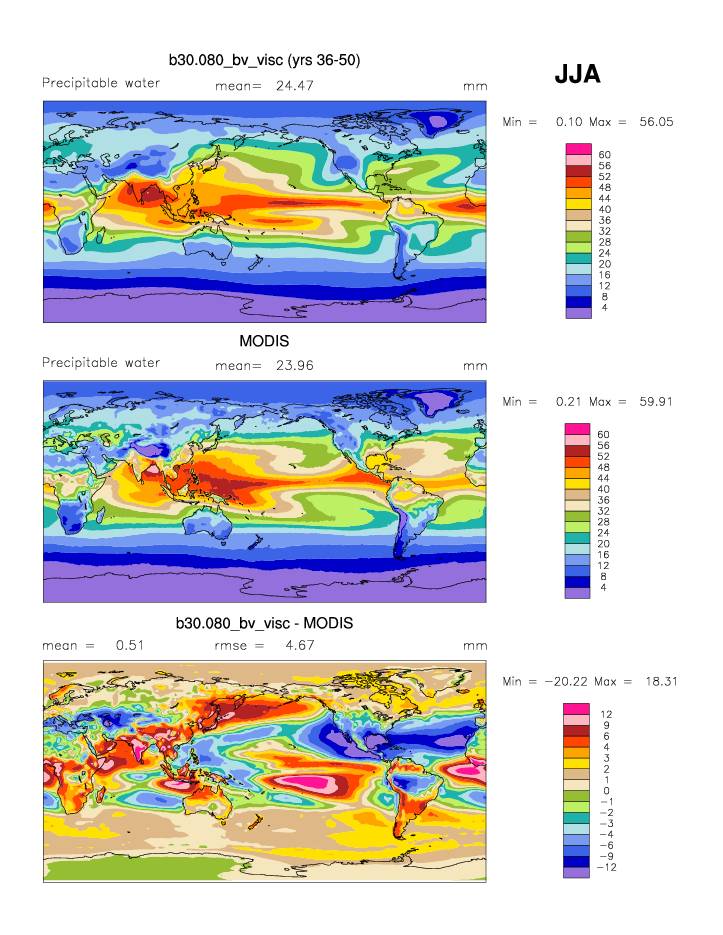
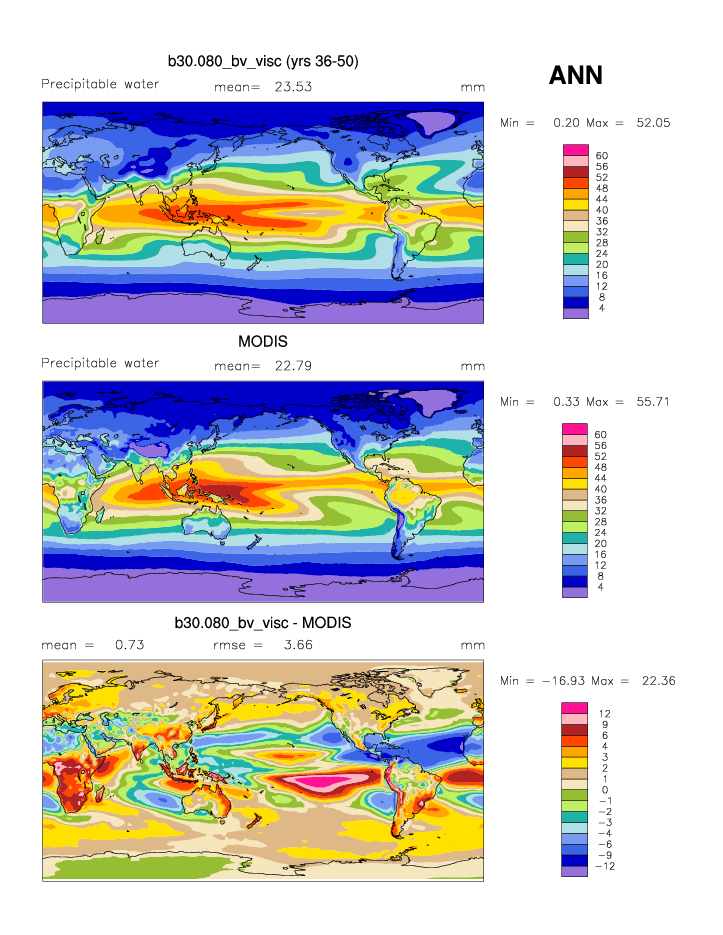
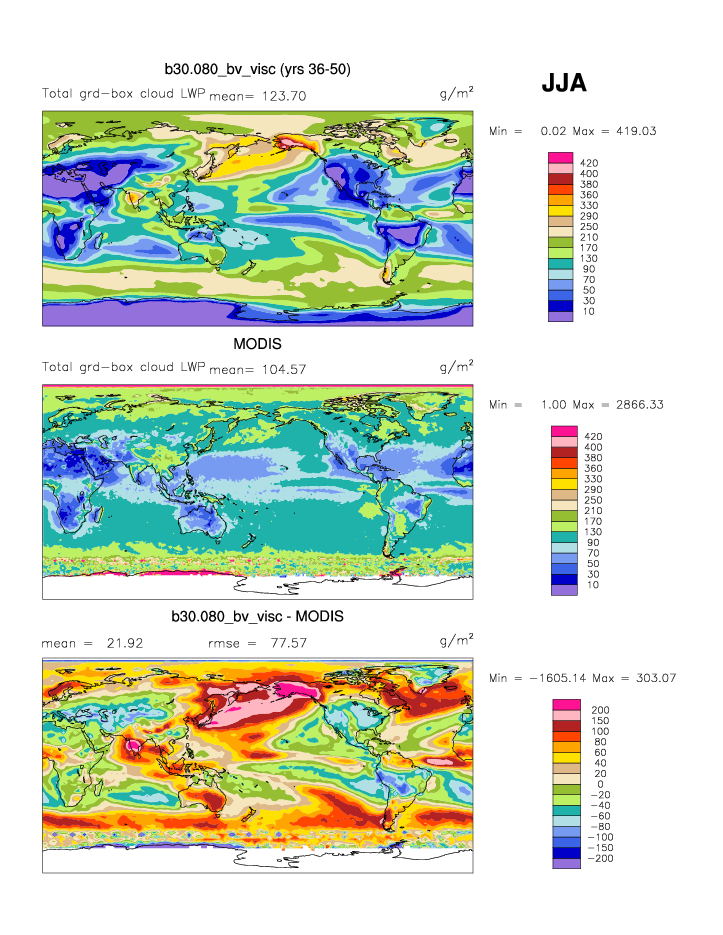
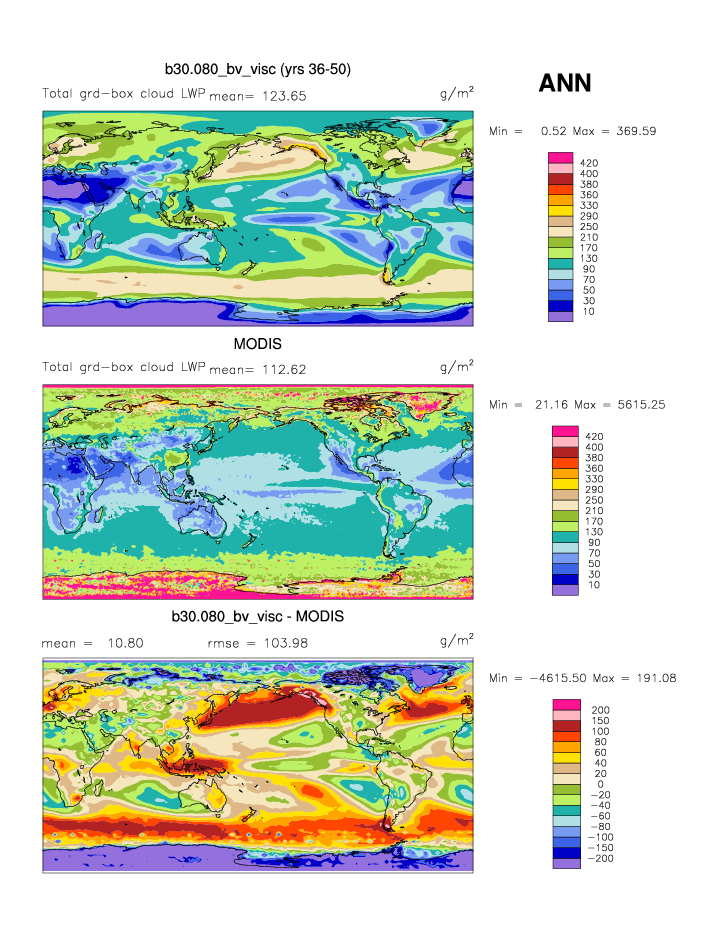
| MODIS Mar2000-Aug2004 | DJF | JJA | ANN | |
| PREH2O * | Total precipitable water | plot | plot | plot |
| PREH2O TROP | Tropical precipitable water | plot | plot | plot |
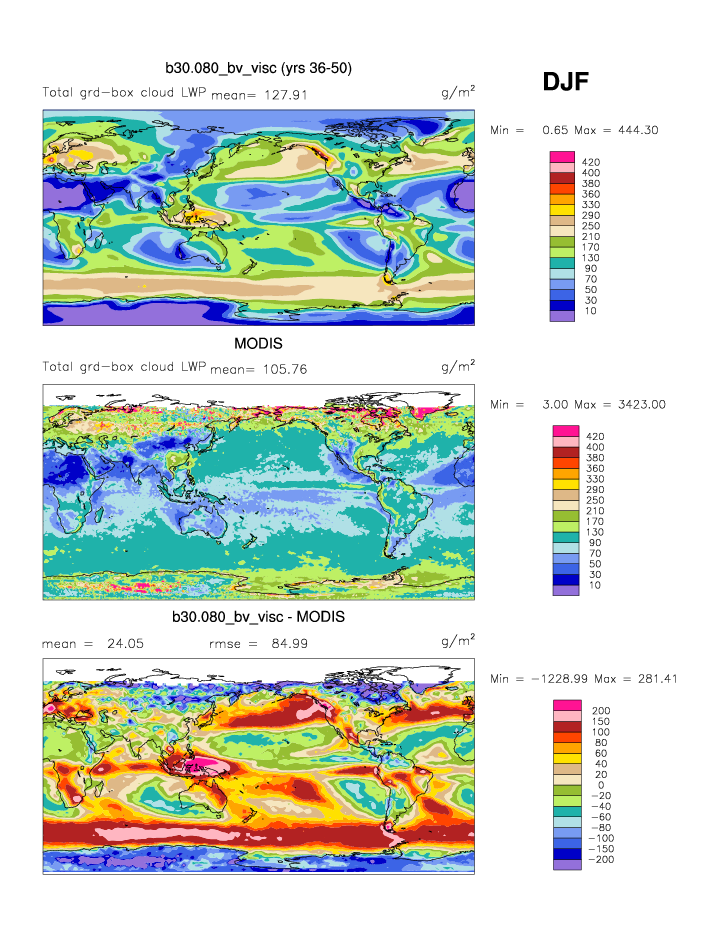
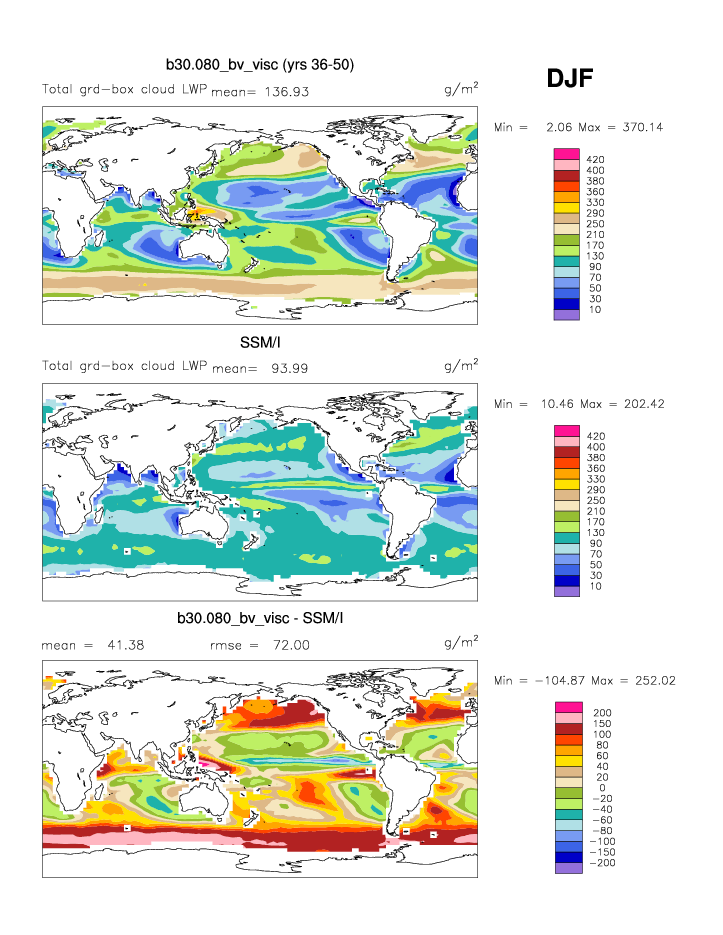
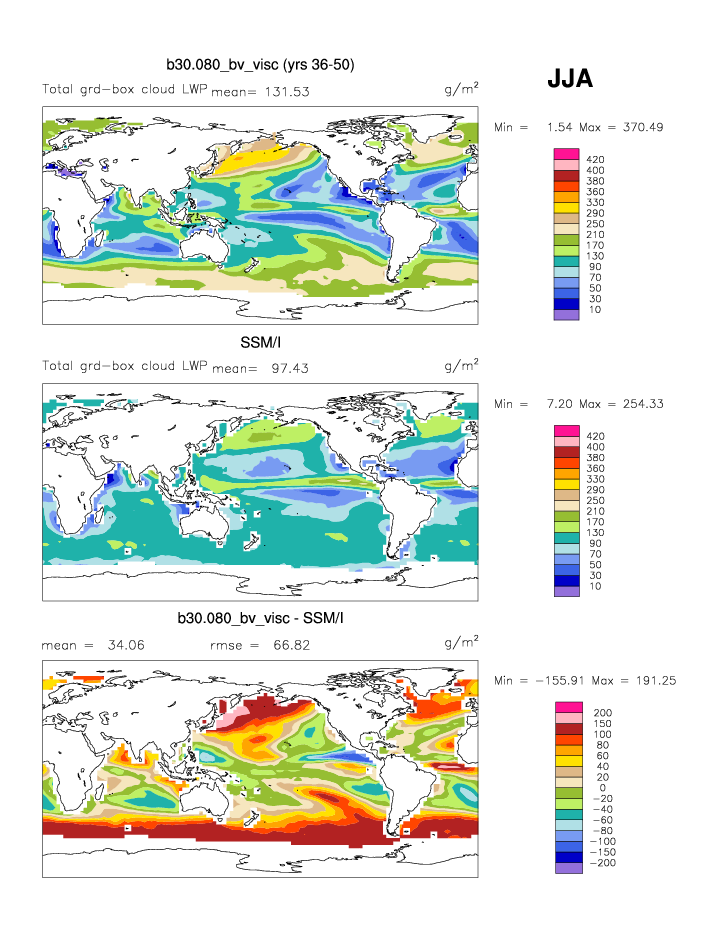
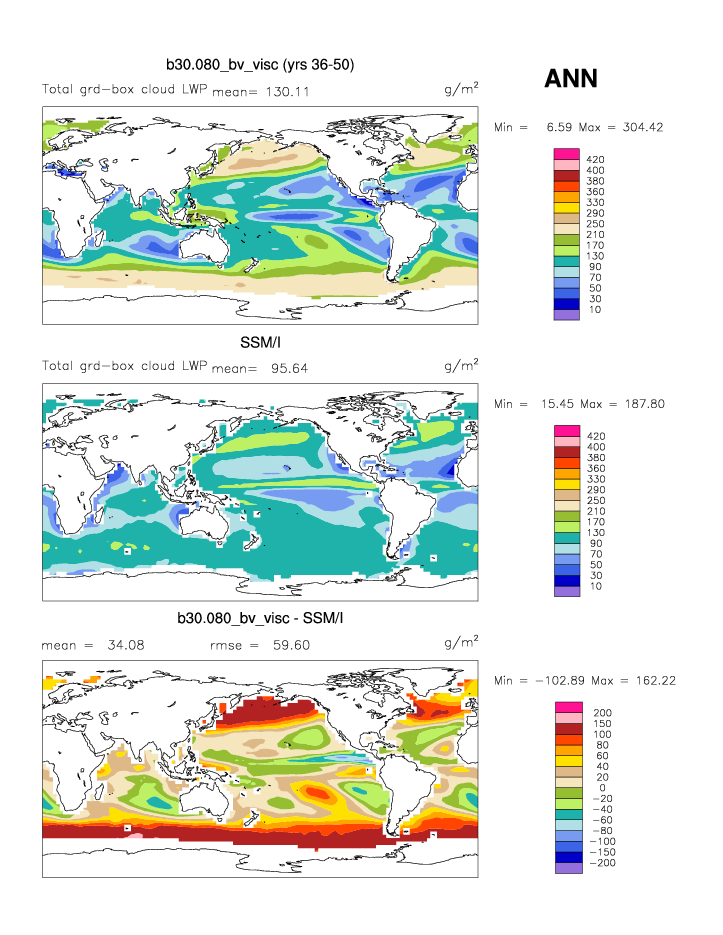
| TGCLDLWP | Cloud liquid water | plot | plot | plot |
| MEANPTOP | Mean cloud top pressure (Day) | plot | plot | plot |
| MEANTTOP | Mean cloud top temperature (Day) | plot | plot | plot |
| MEANTAU | Mean cloud optical thickness (Day) | plot | plot | plot |
| TCLDAREA | Total cloud area (Day) | plot | plot | plot |
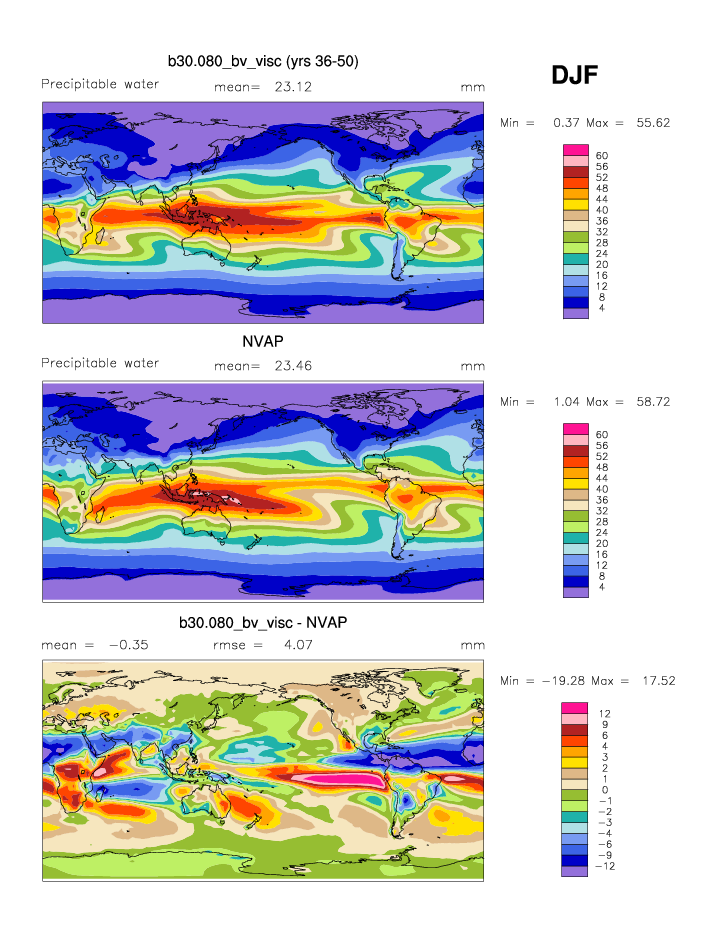
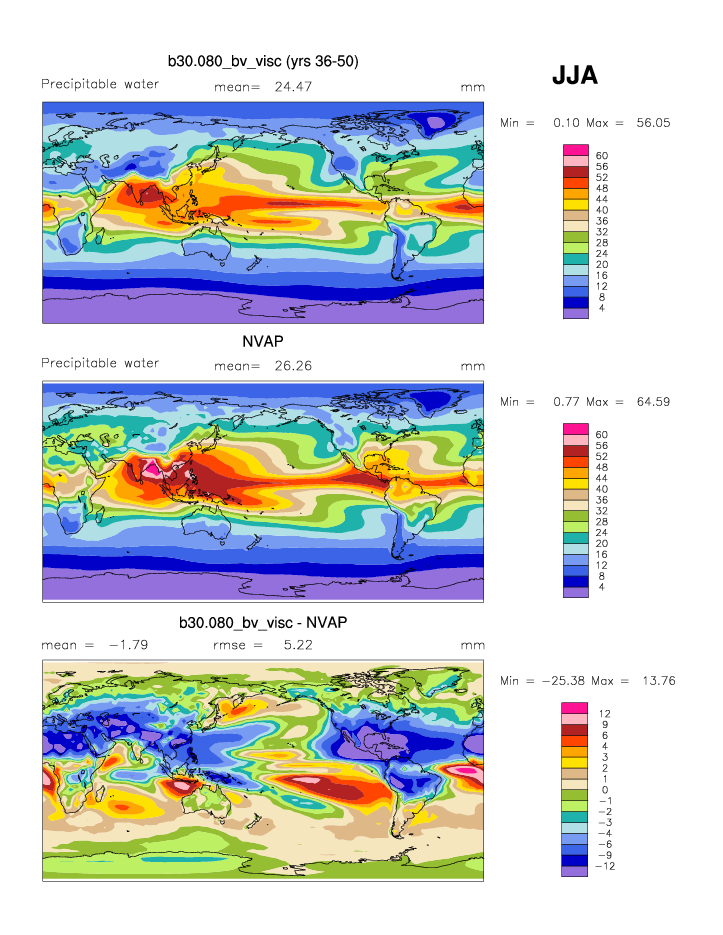
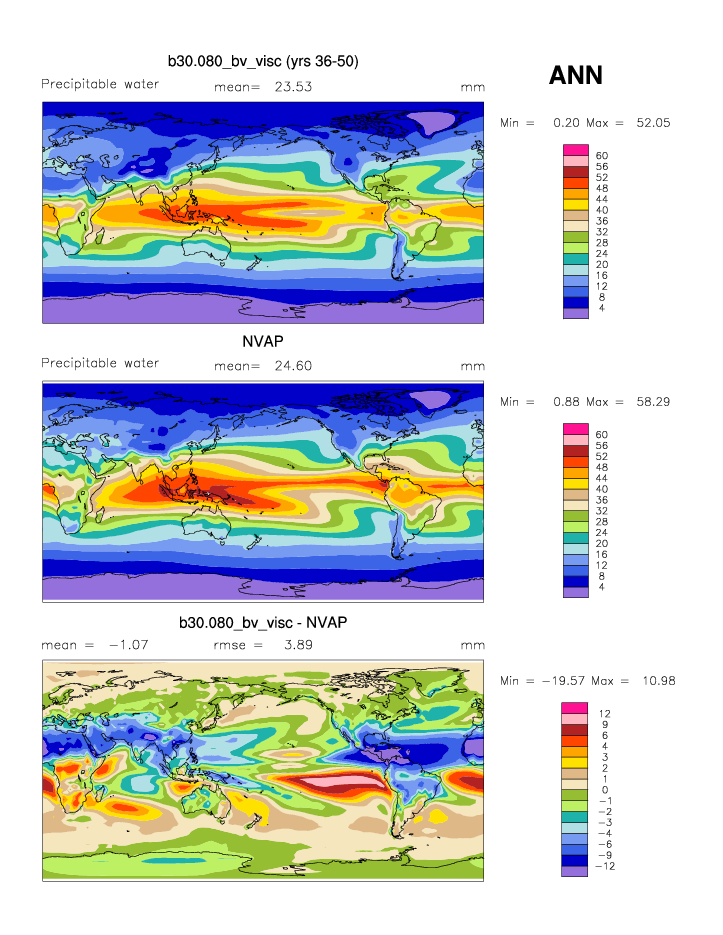
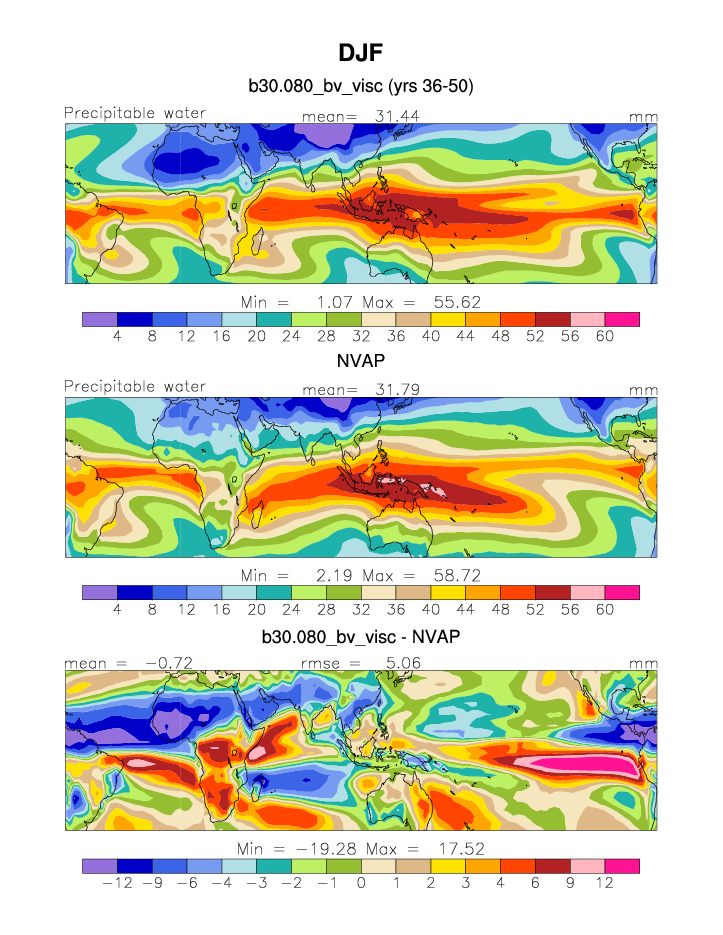
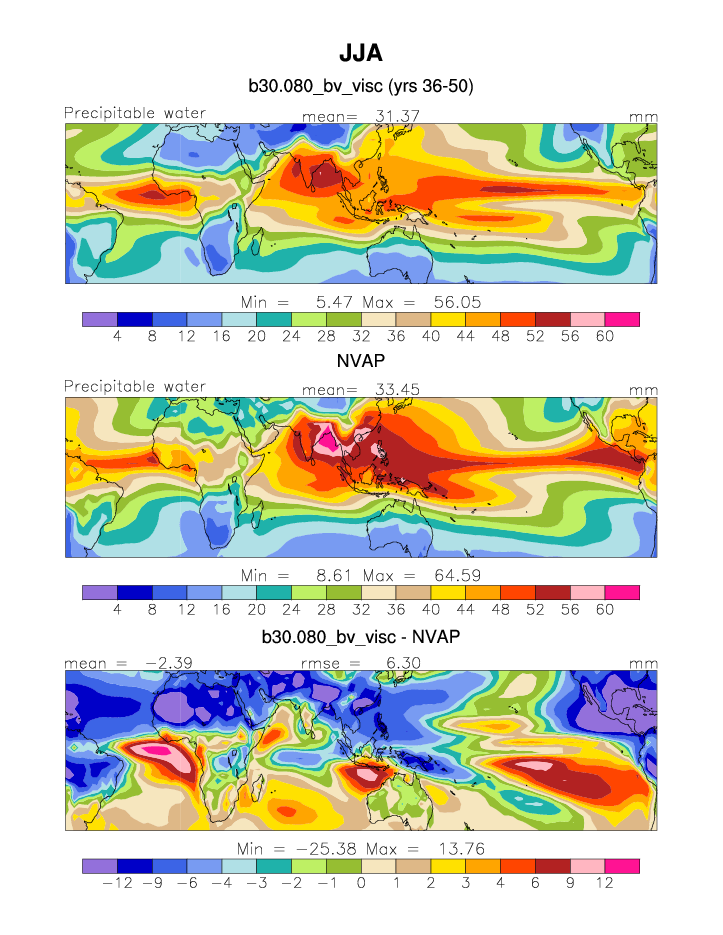
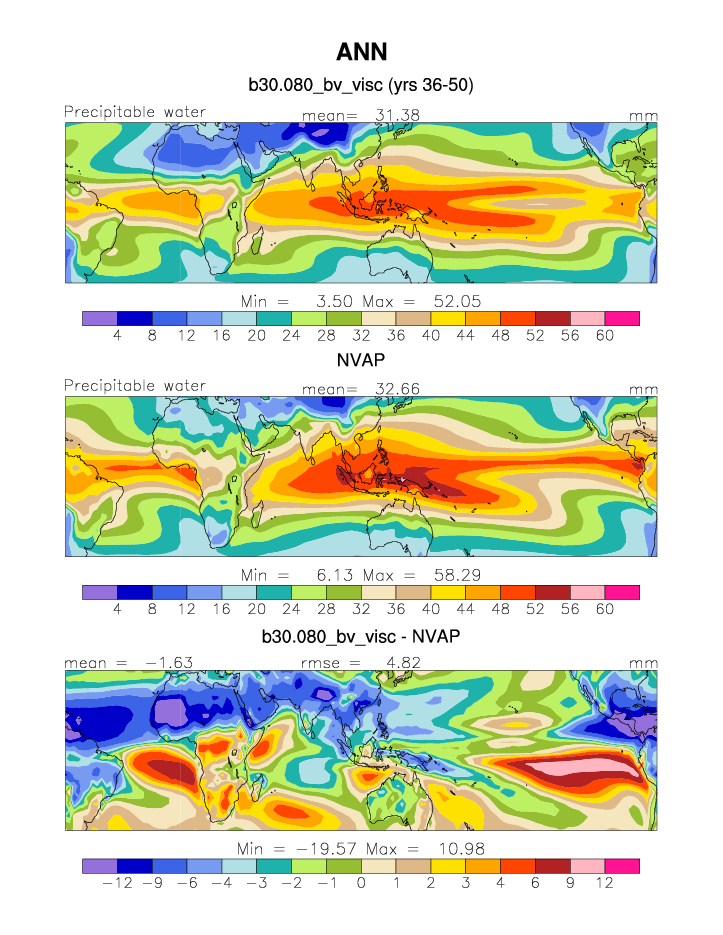
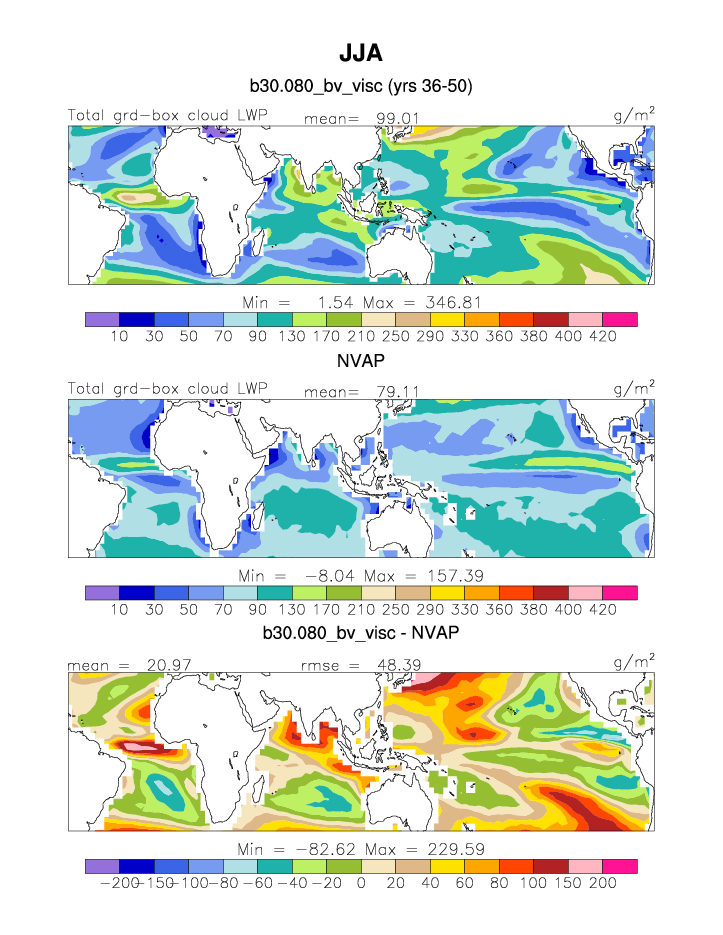
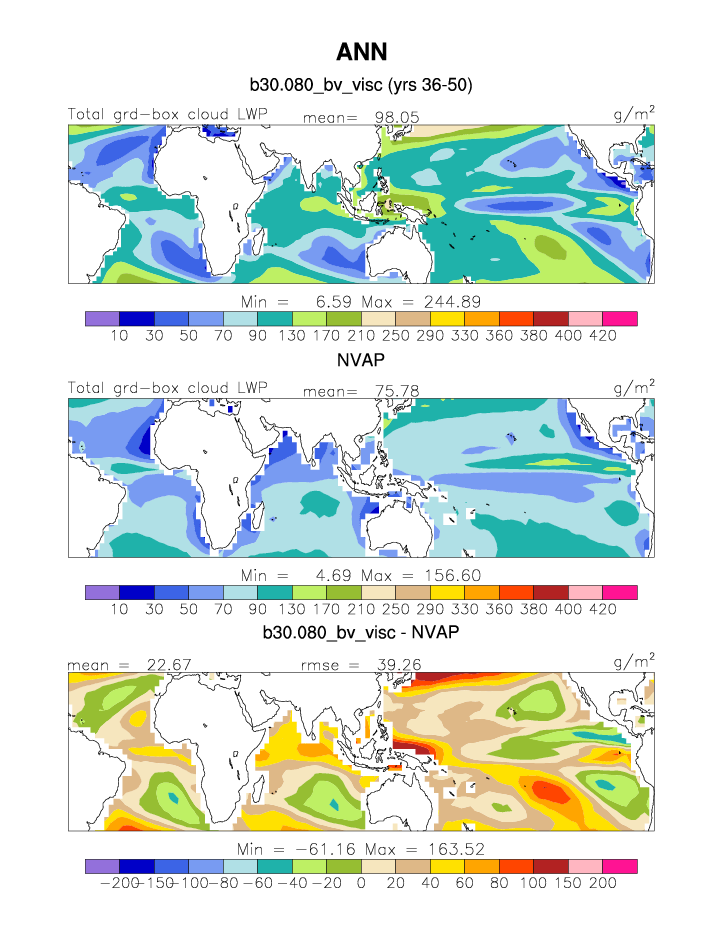
| NVAP 1988-1999 | DJF | JJA | ANN | |
| PREH2O * | Total precipitable water | plot | plot | plot |
| PREH2O TROP | Tropical precipitable water | plot | plot | plot |
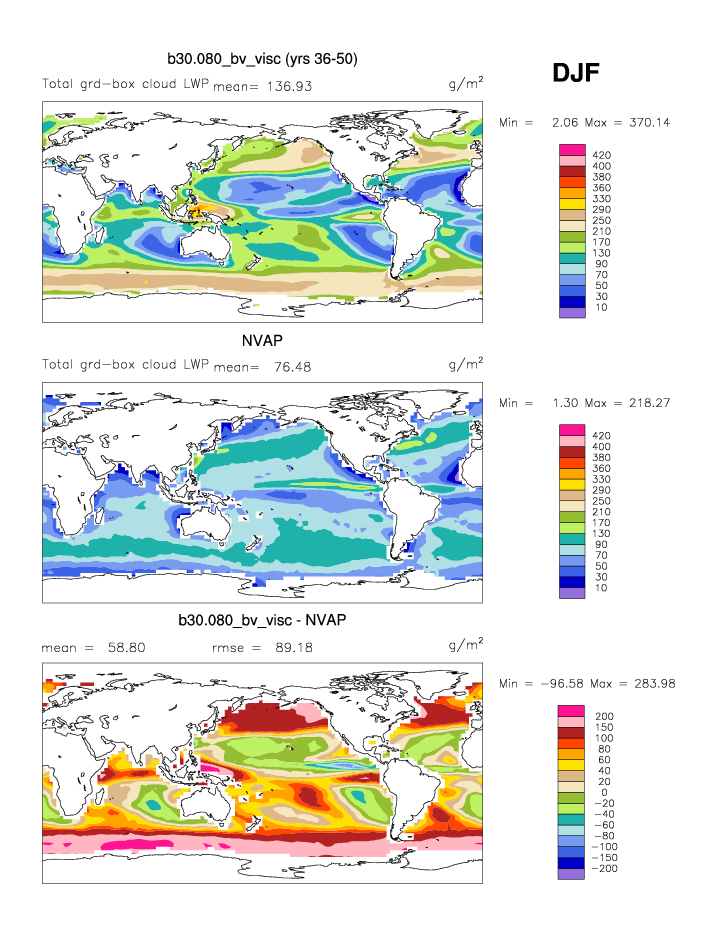
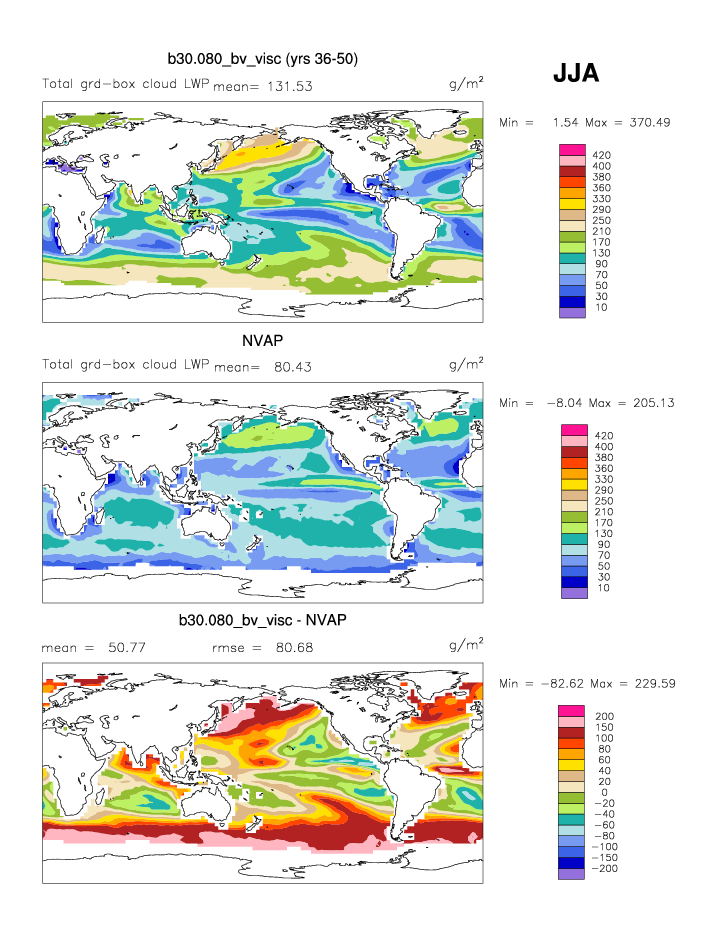
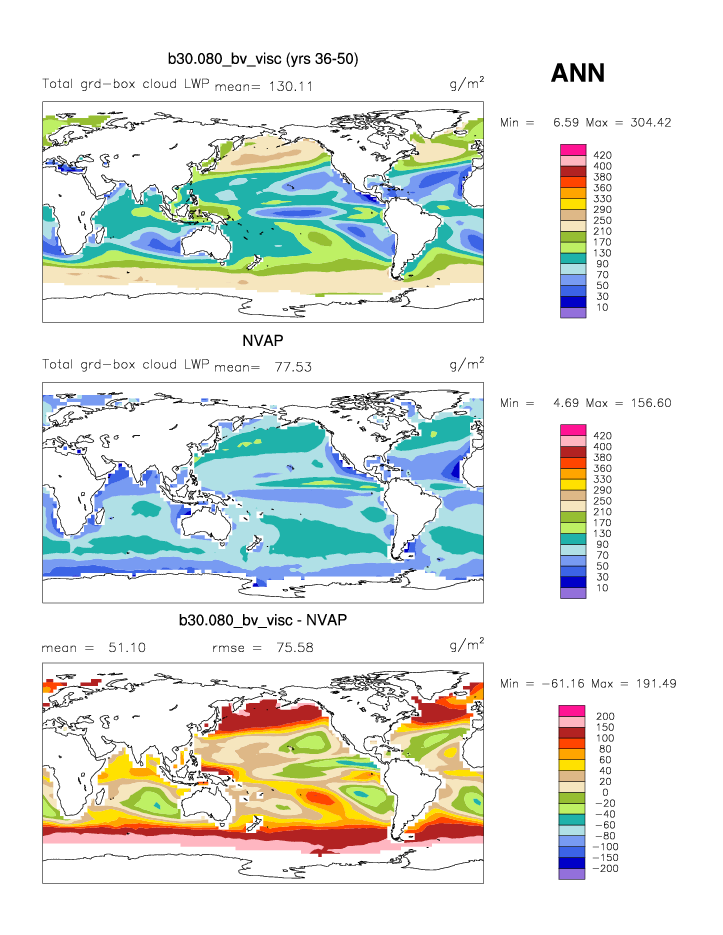
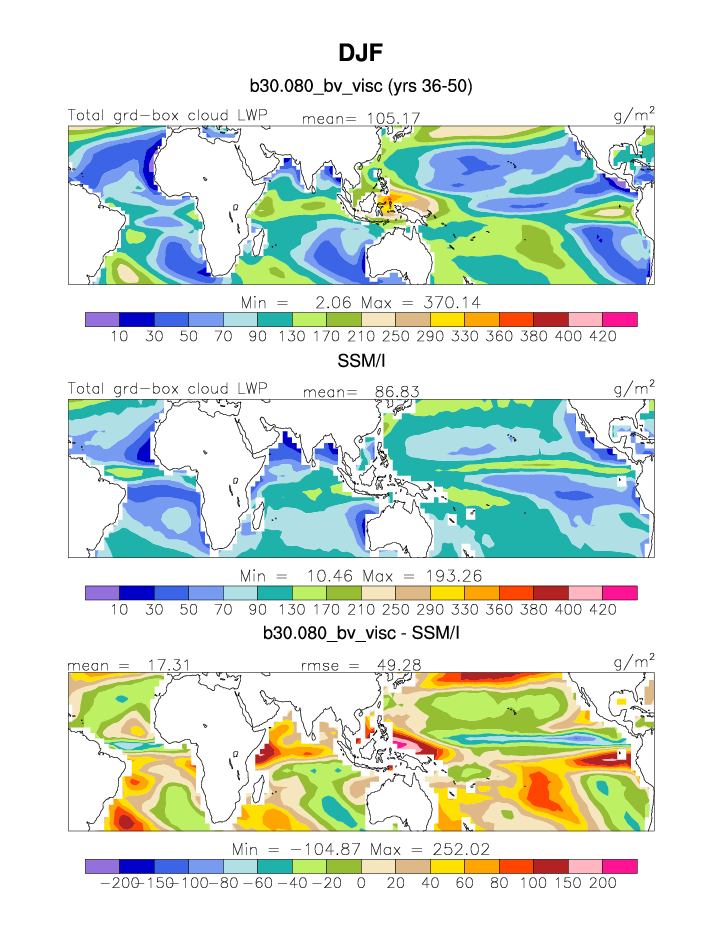
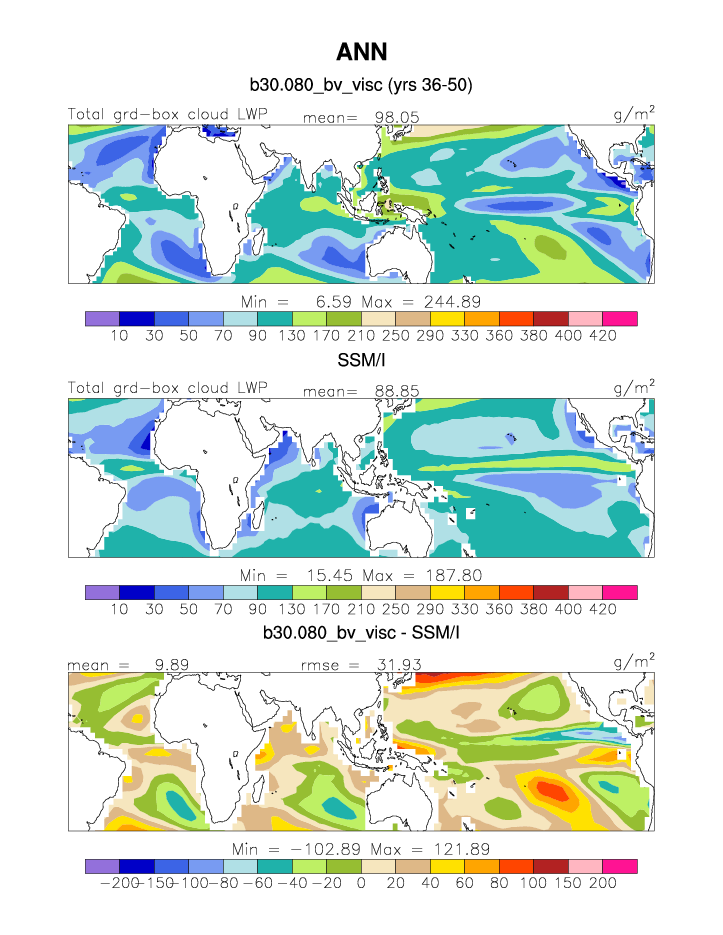
| TGCLDLWP | Cloud liquid water (ocean) | plot | plot | plot |
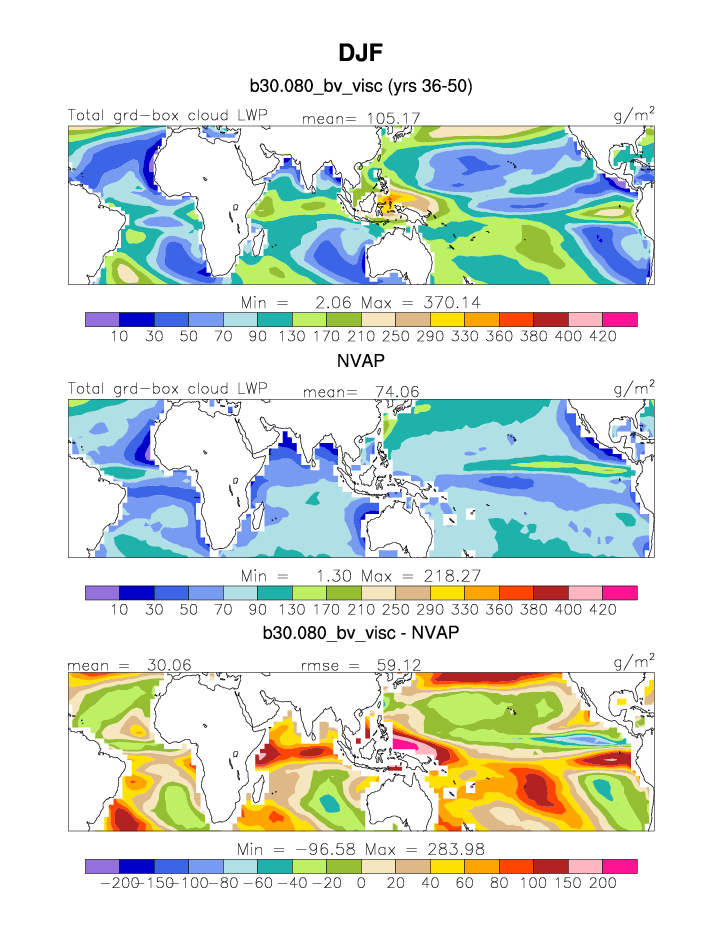
| TGCLDLWP TROP | Tropical cloud liquid water (ocean) | plot | plot | plot |
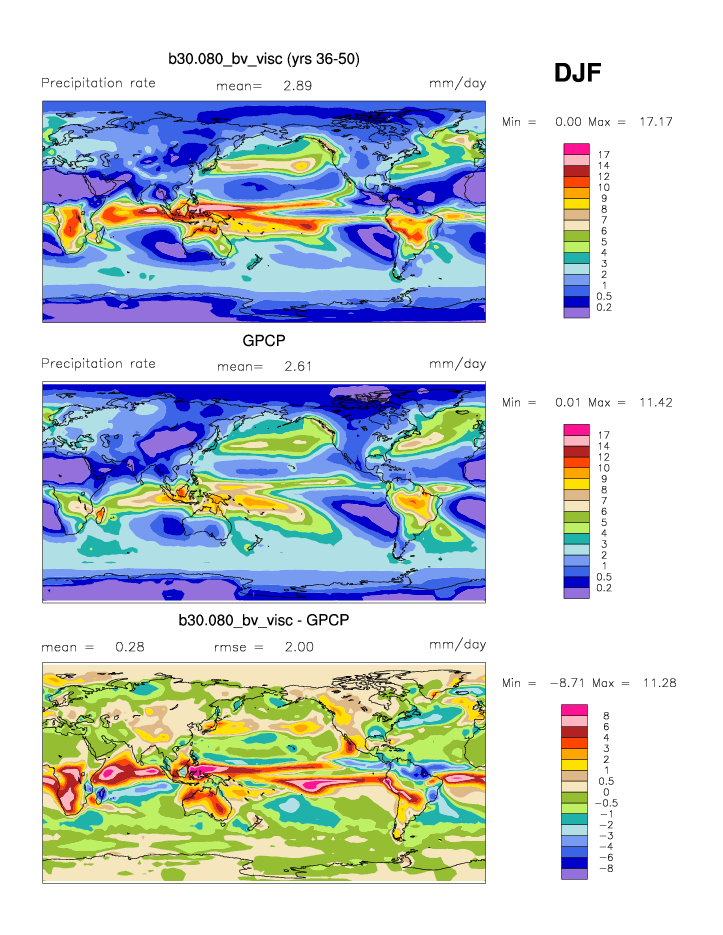
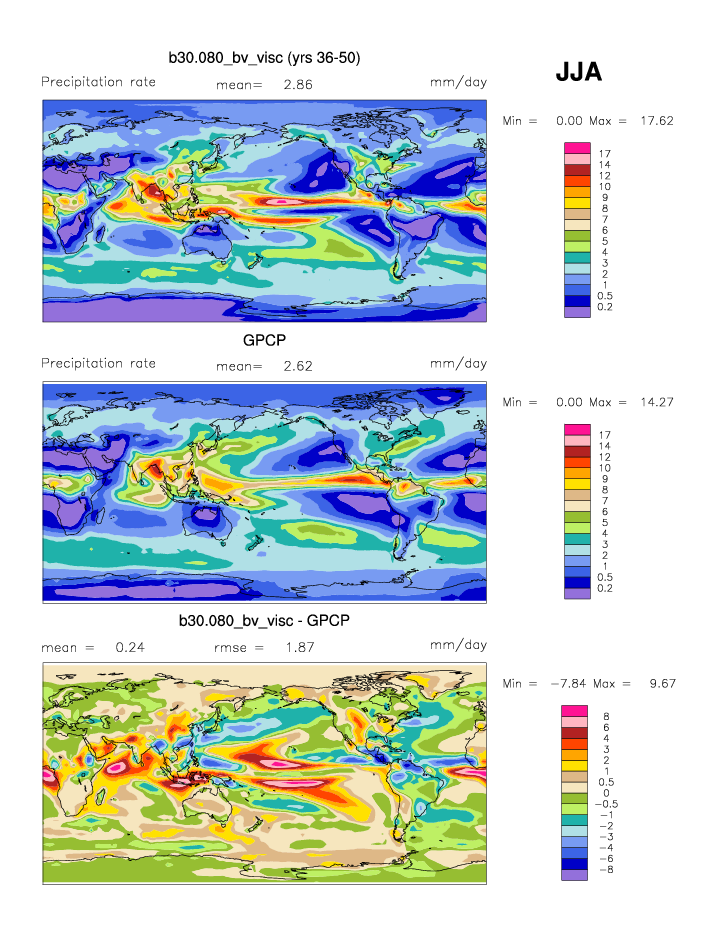
| GPCP 1979-2003 | DJF | JJA | ANN | |
| PRECT * | Precipitation rate | plot | plot | plot |
| PRECT TROP | Tropical precipitation rate | plot | plot | plot |
| CMAP 1979-1998 | DJF | JJA | ANN | |
| PRECT * | Precipitation rate | plot | plot | plot |
| PRECT TROP | Tropical precipitation rate | plot | plot | plot |
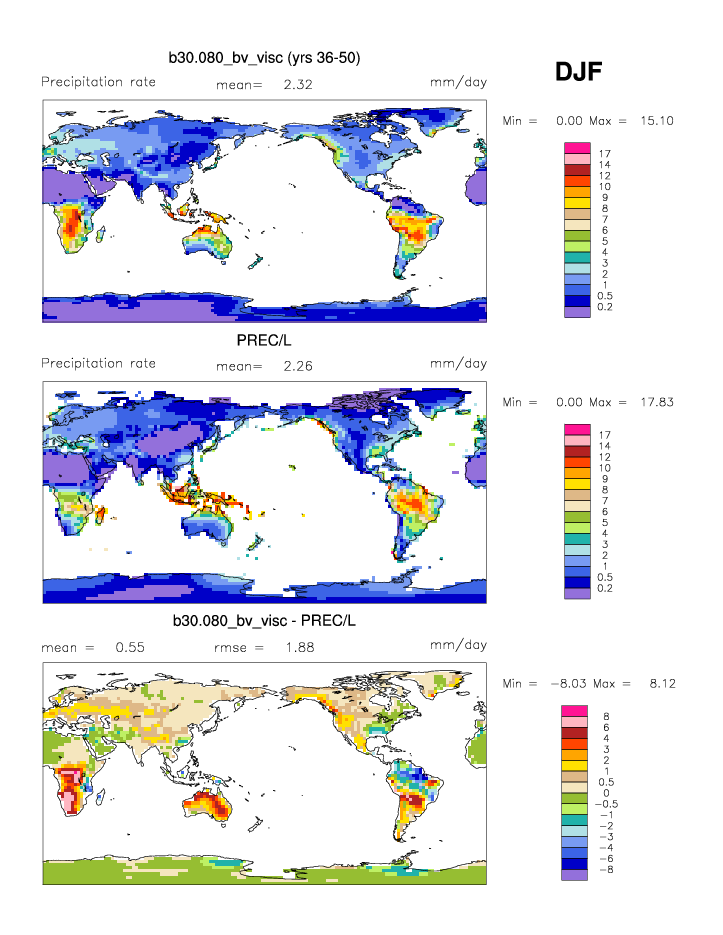
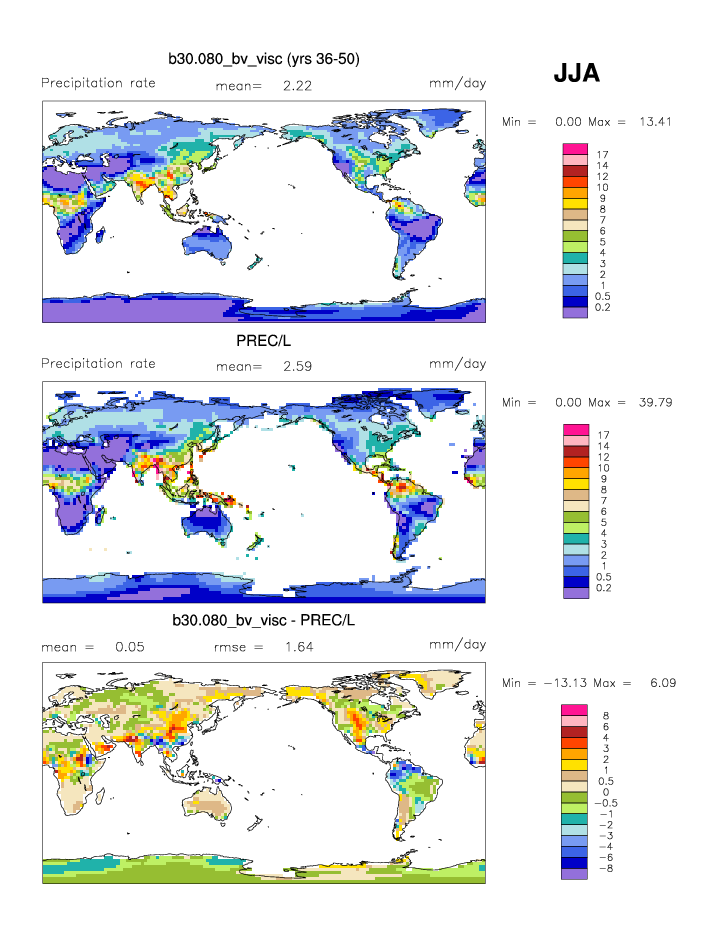
| PREC/L (CMAP) 1948-2001 | DJF | JJA | ANN | |
| PRECT_LAND | Precipitation rate (land) | plot | plot | plot |
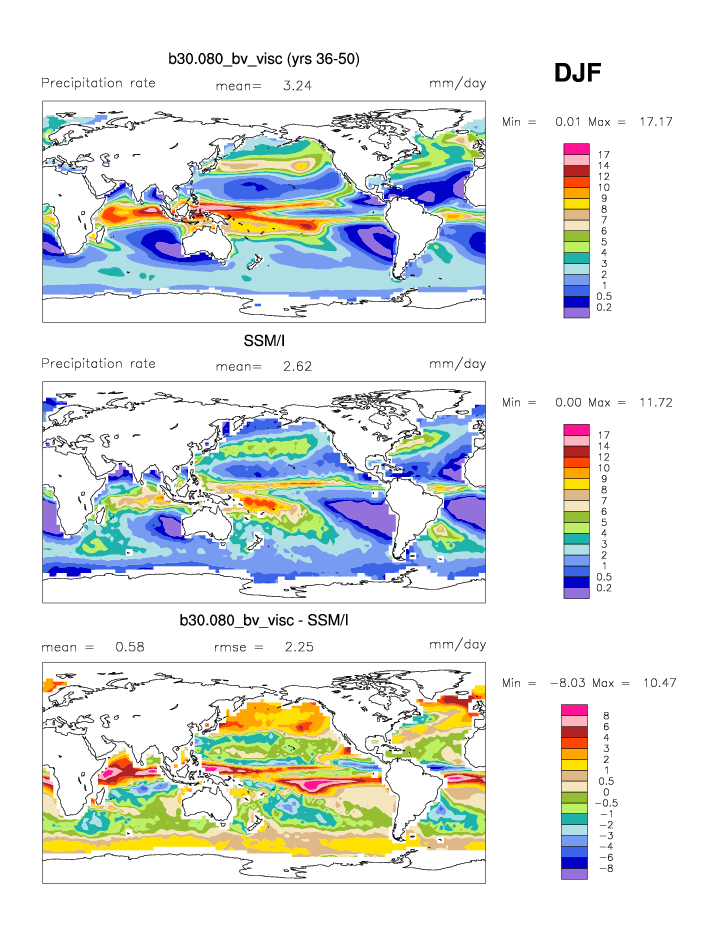
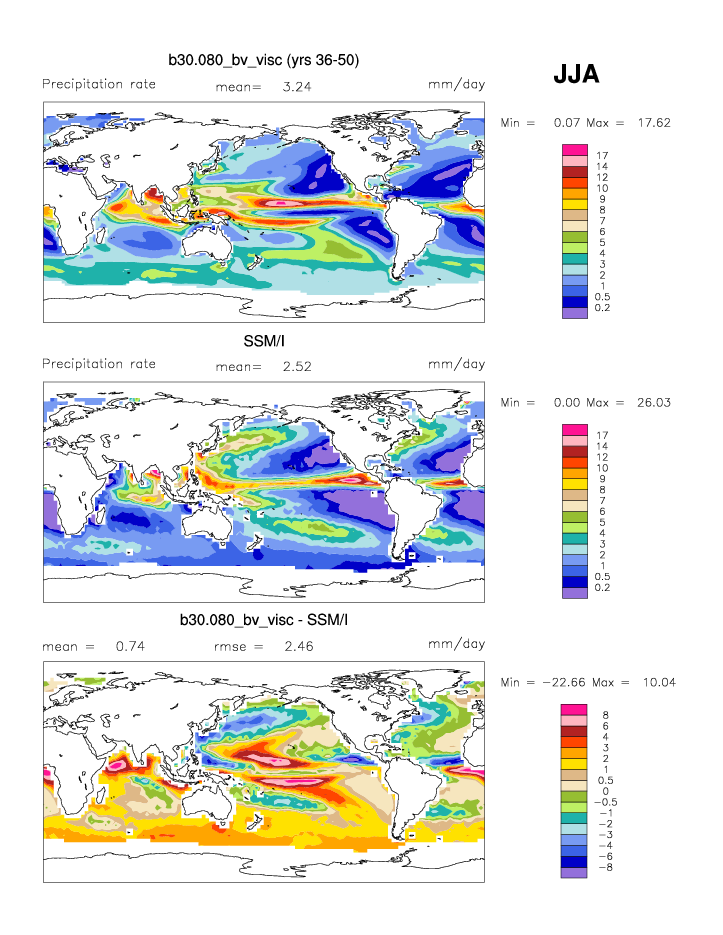
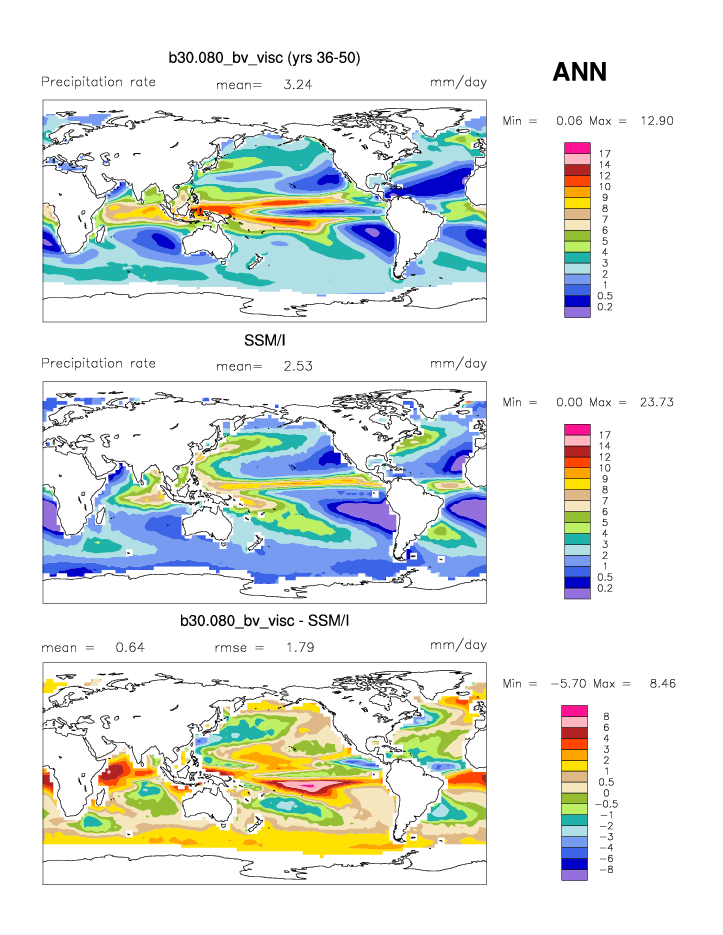
| SSM/I (Wentz) 1987-2000 | DJF | JJA | ANN | |
| PRECT * | Precipitation rate (ocean) | plot | plot | plot |
| PRECT TROP | Tropical precipitation rate (ocean) | plot | plot | plot |
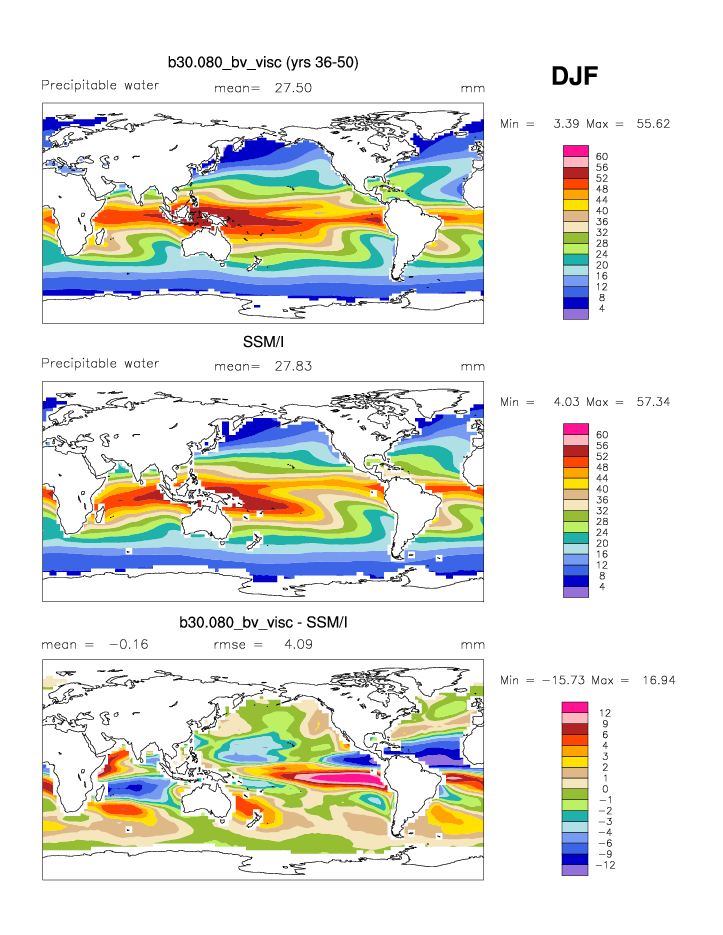
| PREH2O * | Precipitable water (ocean) | plot | plot | plot |
| PREH2O TROP | Tropical precipitable water (ocean) | plot | plot | plot |
| TGCLDLWP | cloud liquid water (ocean) | plot | plot | plot |
| TGCLDLWP TROP | Tropical cloud liquid water (ocean) | plot | plot | plot |
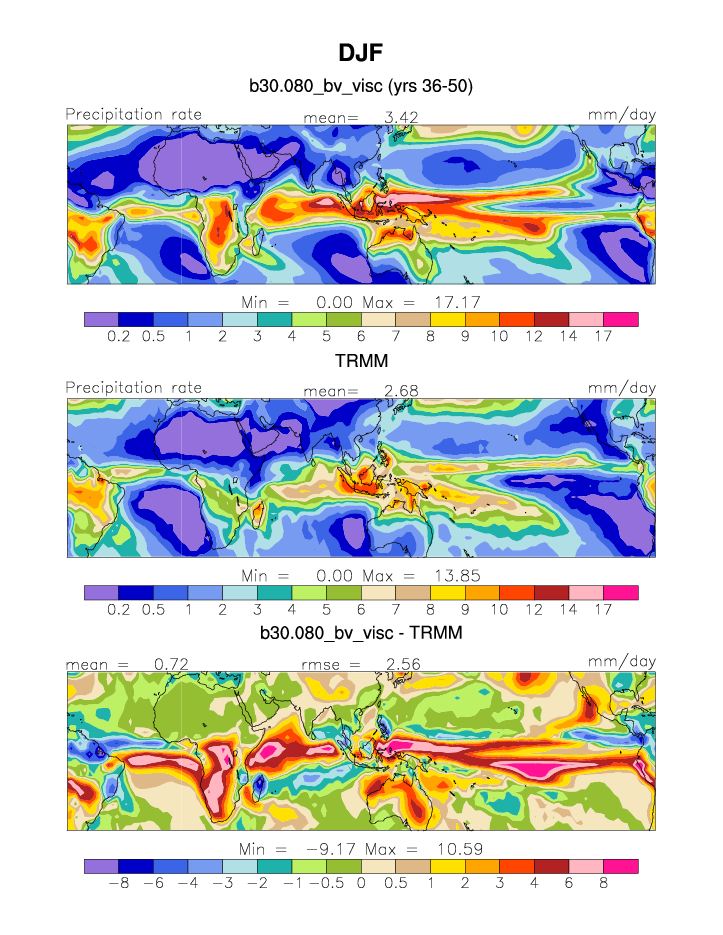
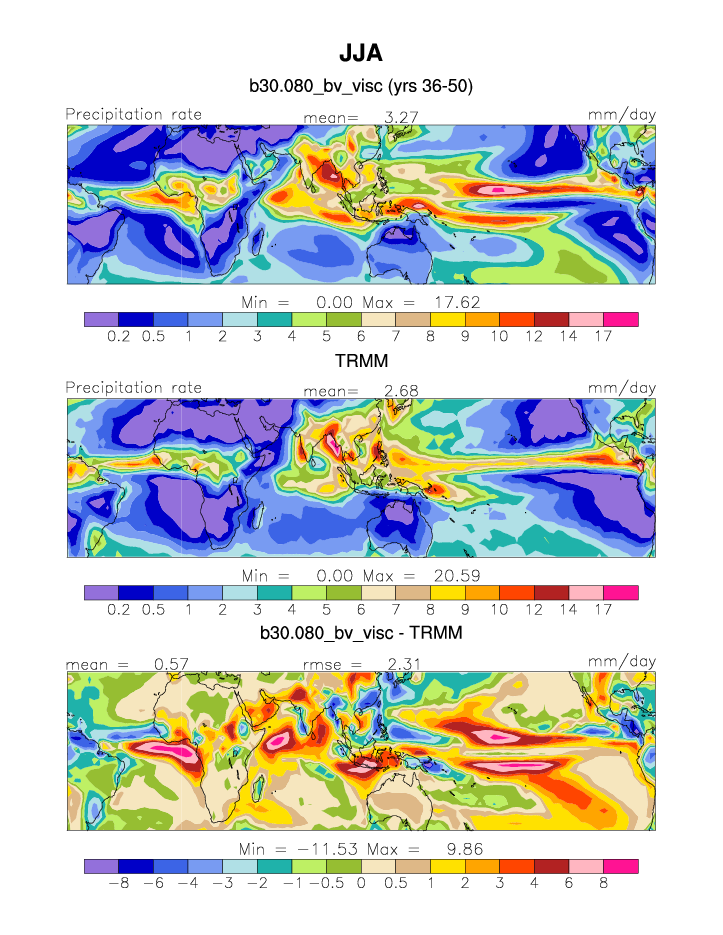
| TRMM (3B43) 1998-Feb2004 | DJF | JJA | ANN | |
| PRECT TROP | Tropical precipitation rate | plot | plot | plot |
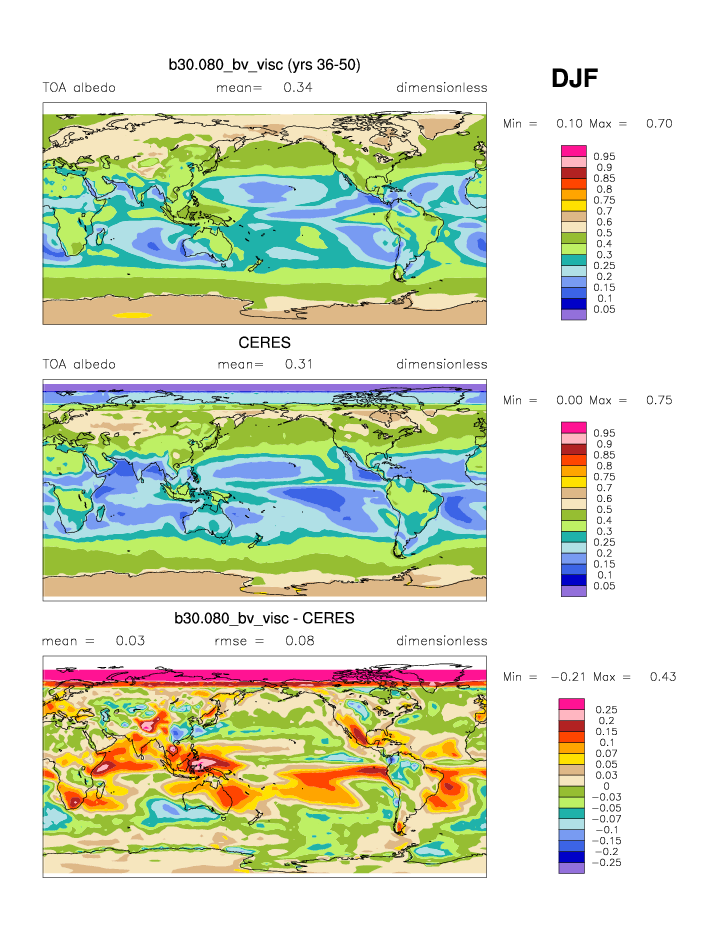
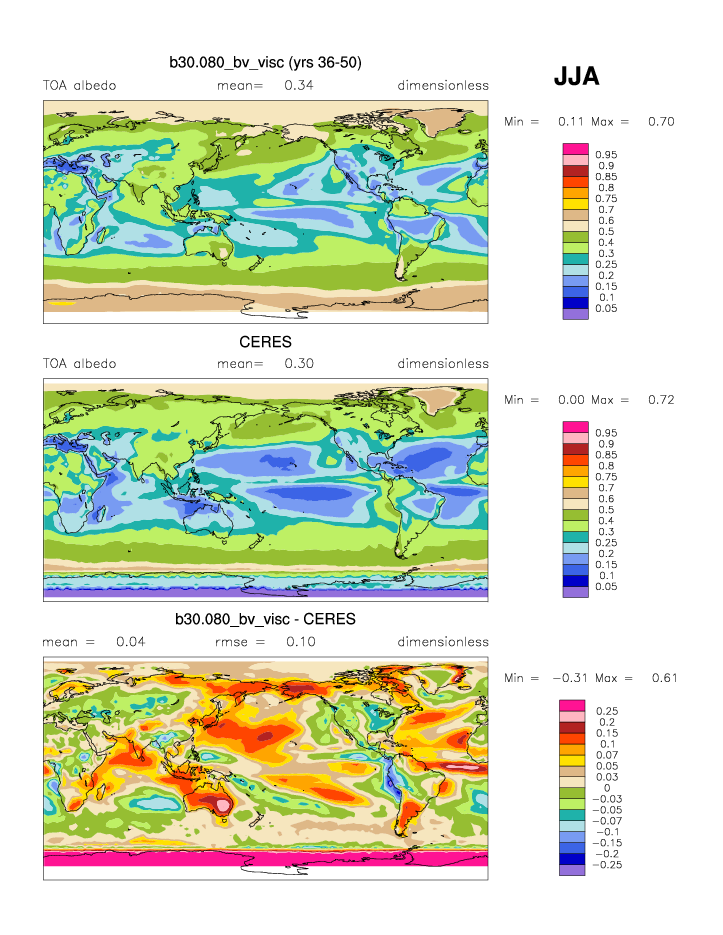
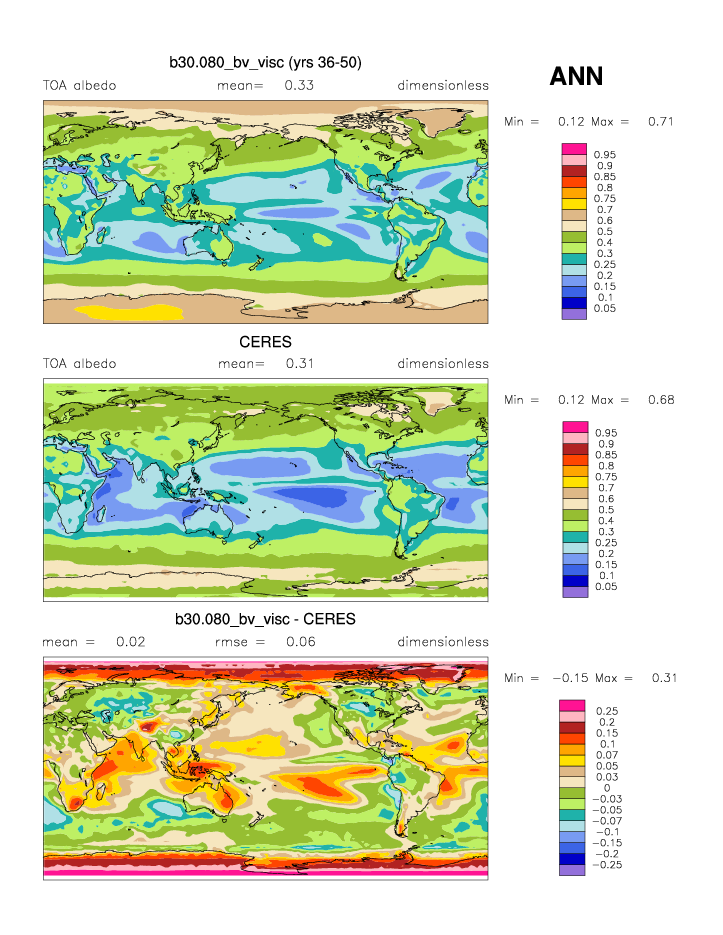
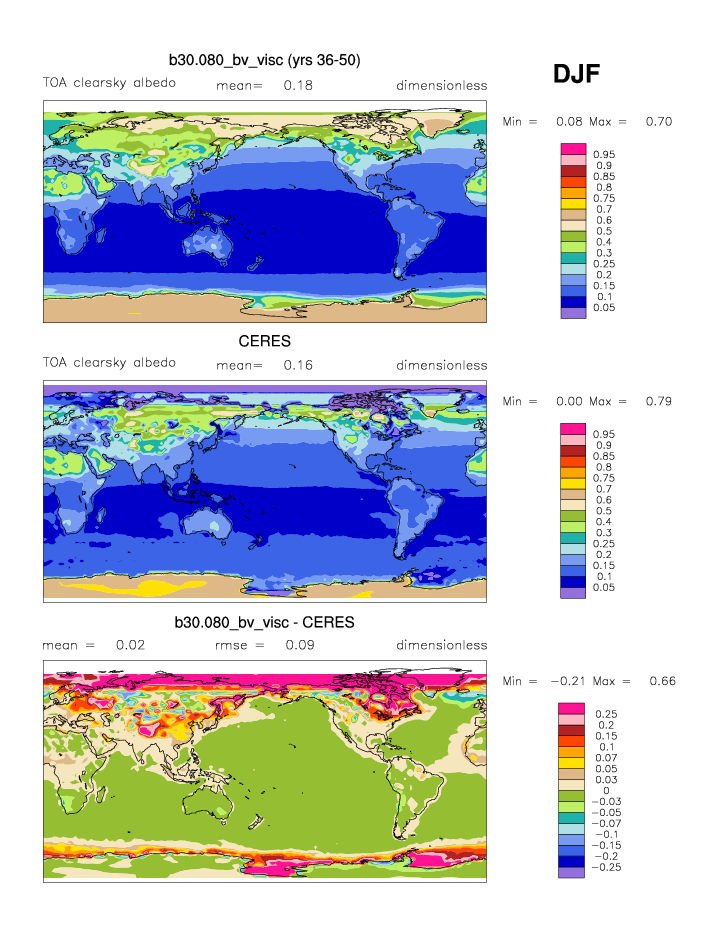
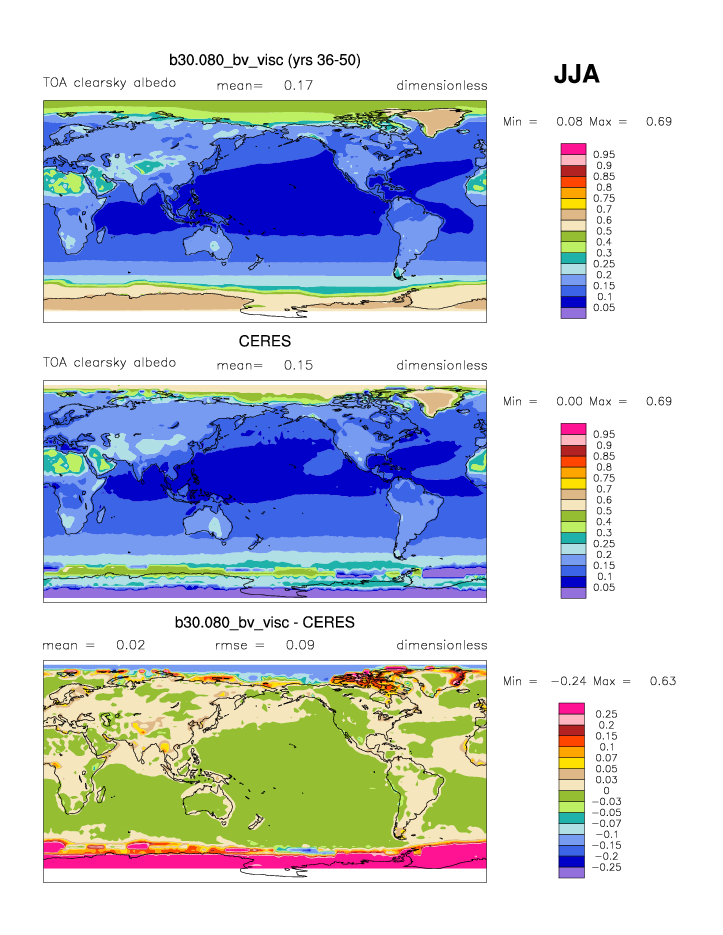
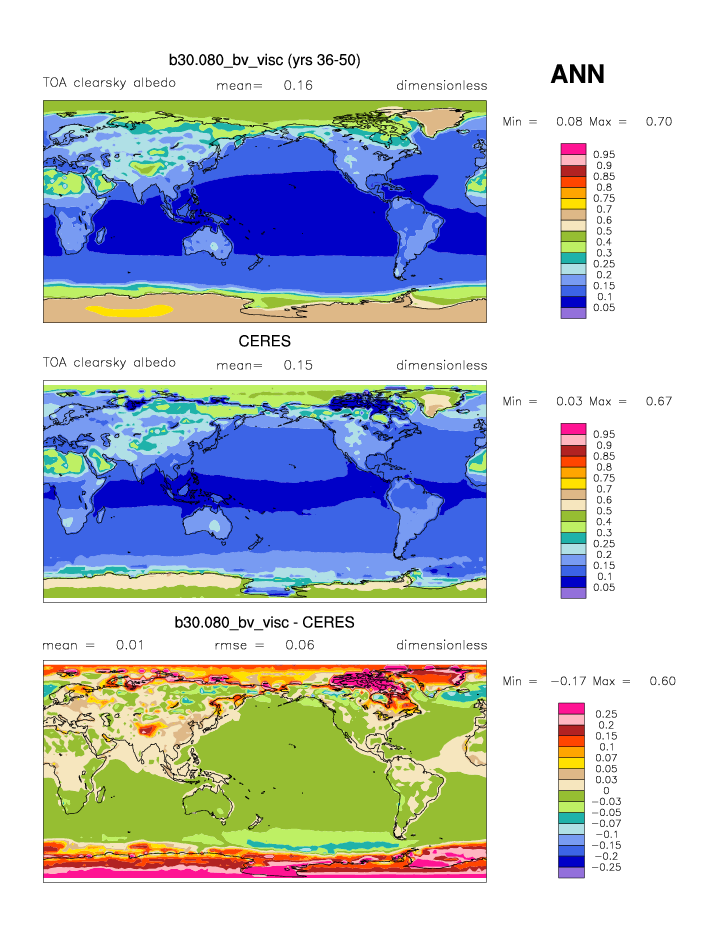
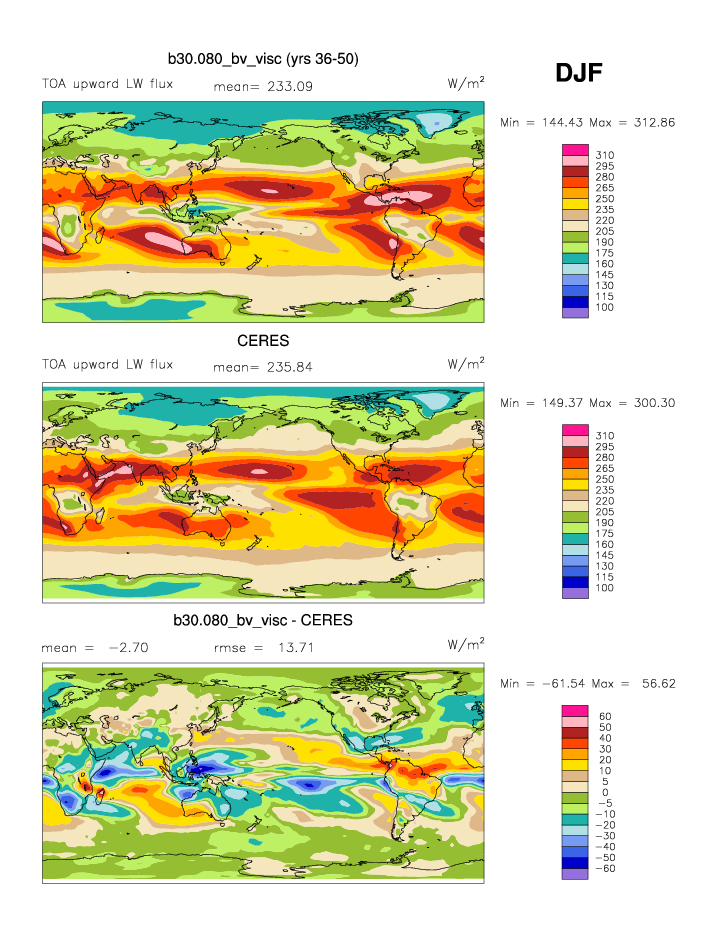
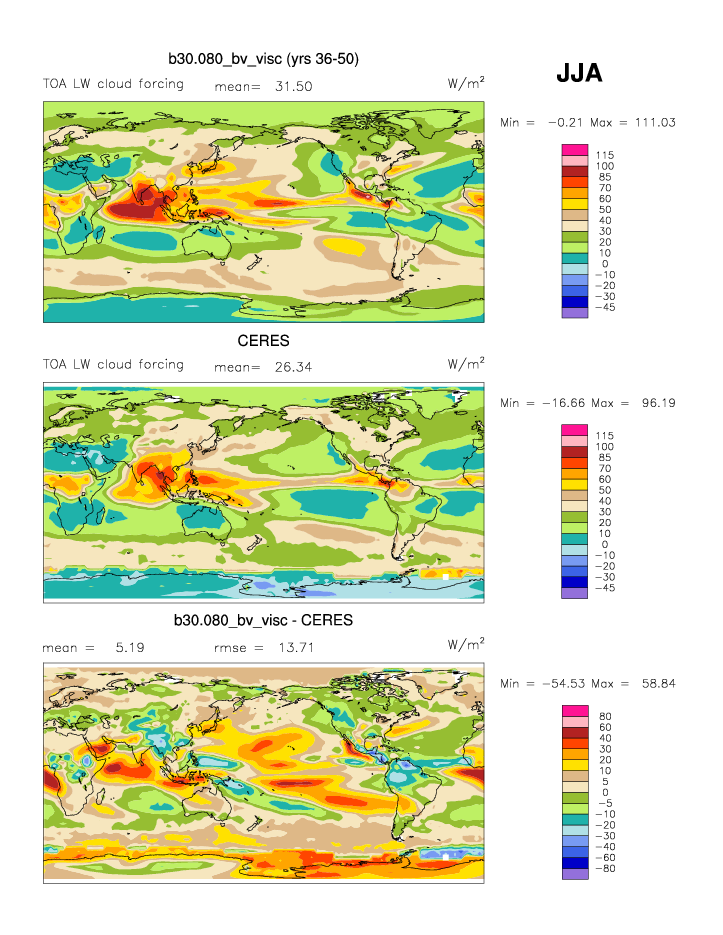
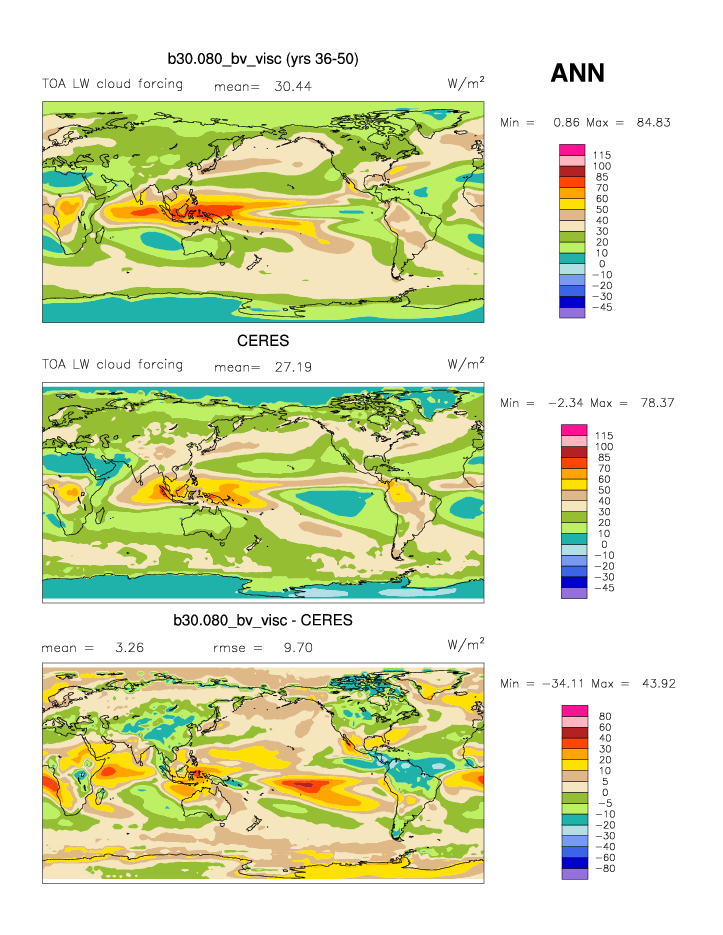
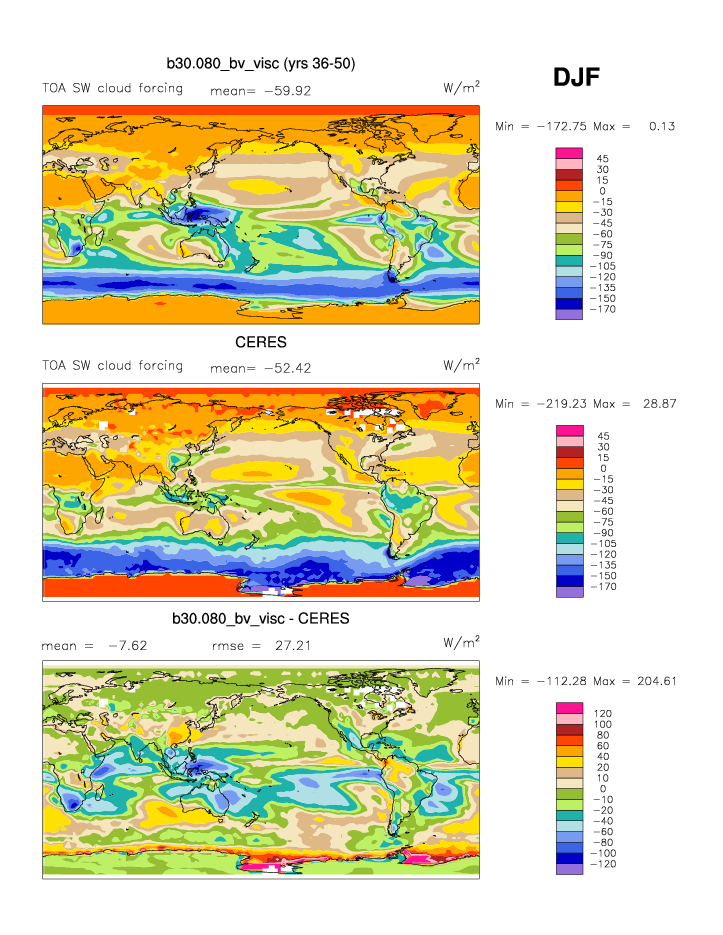
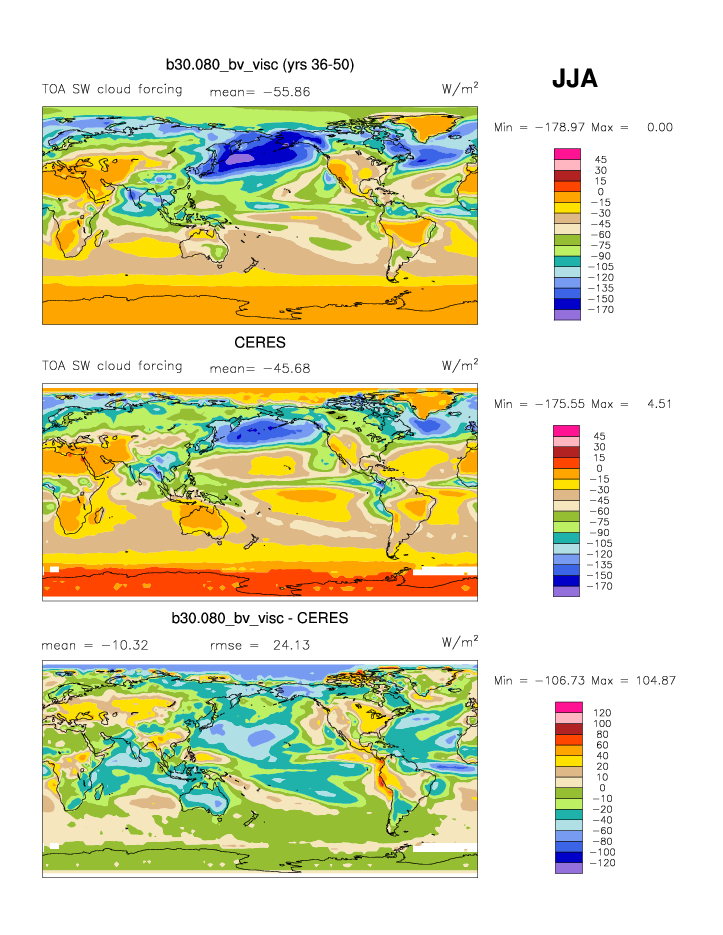
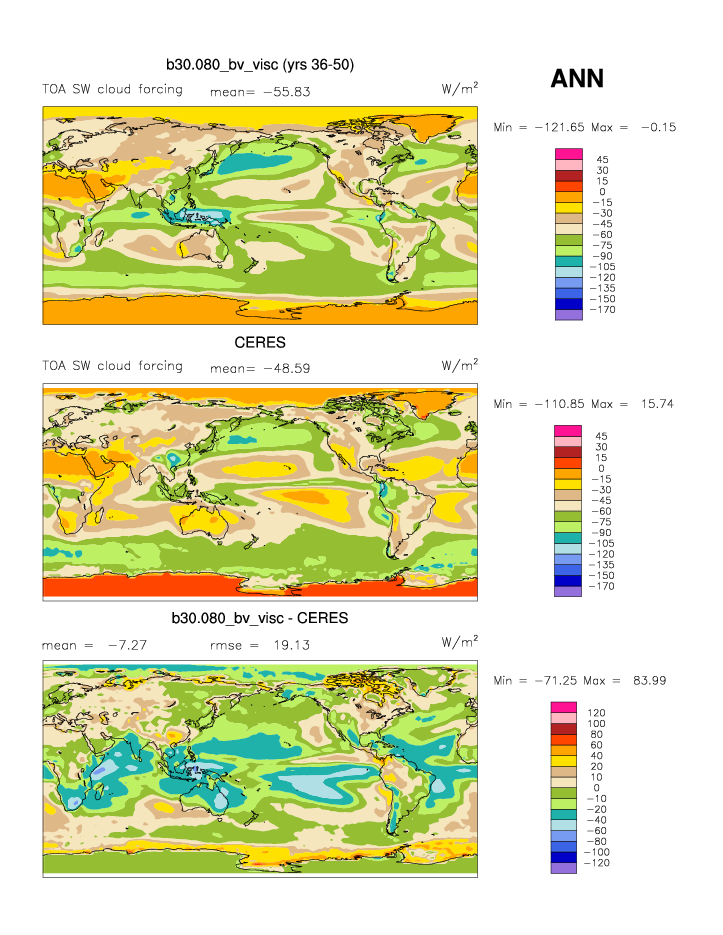
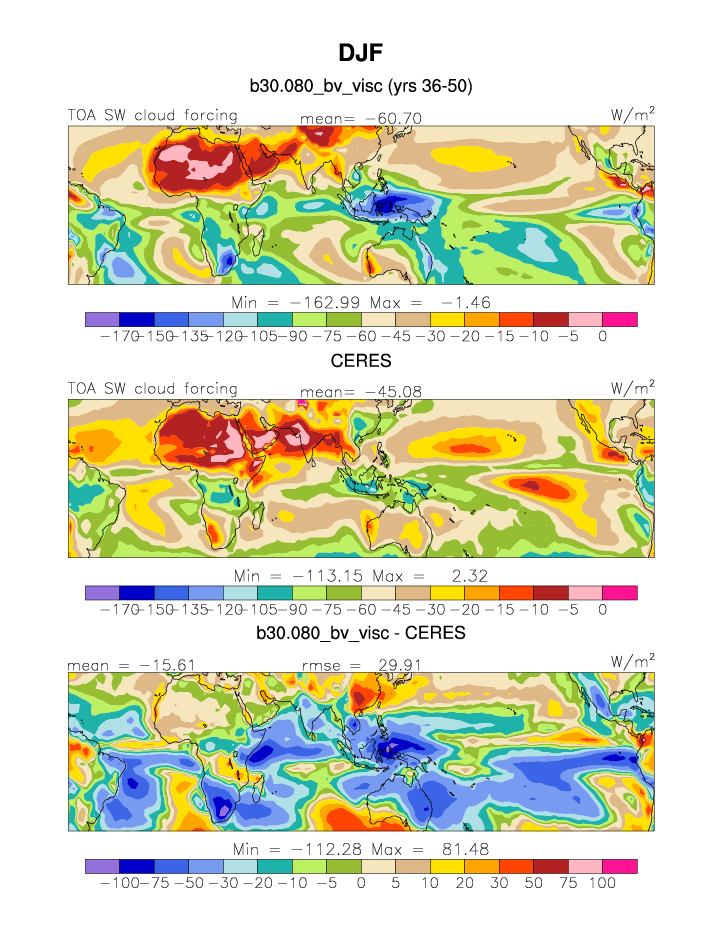
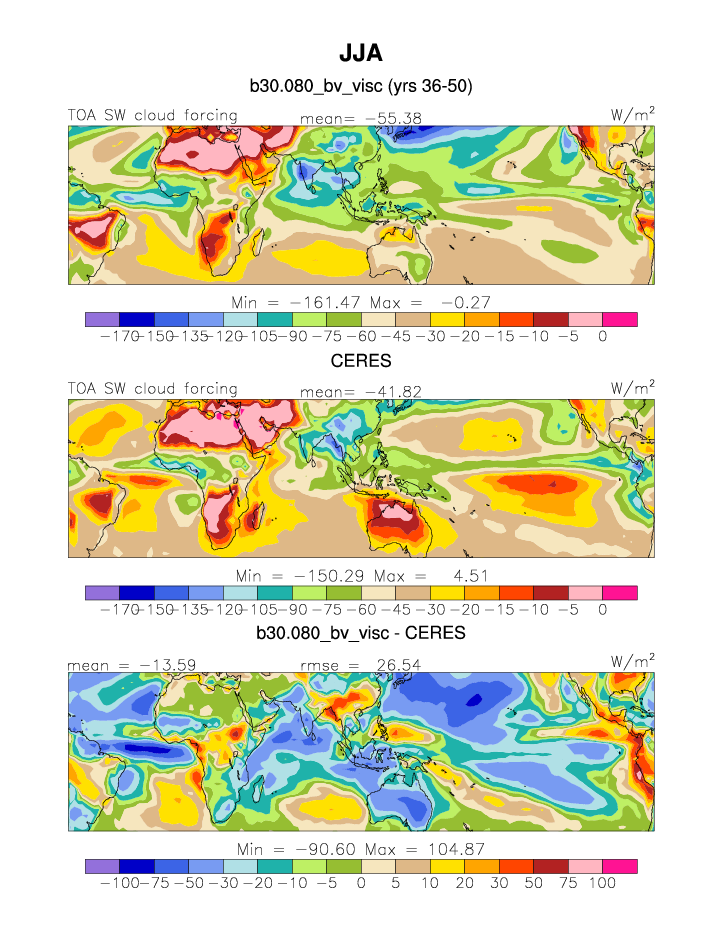
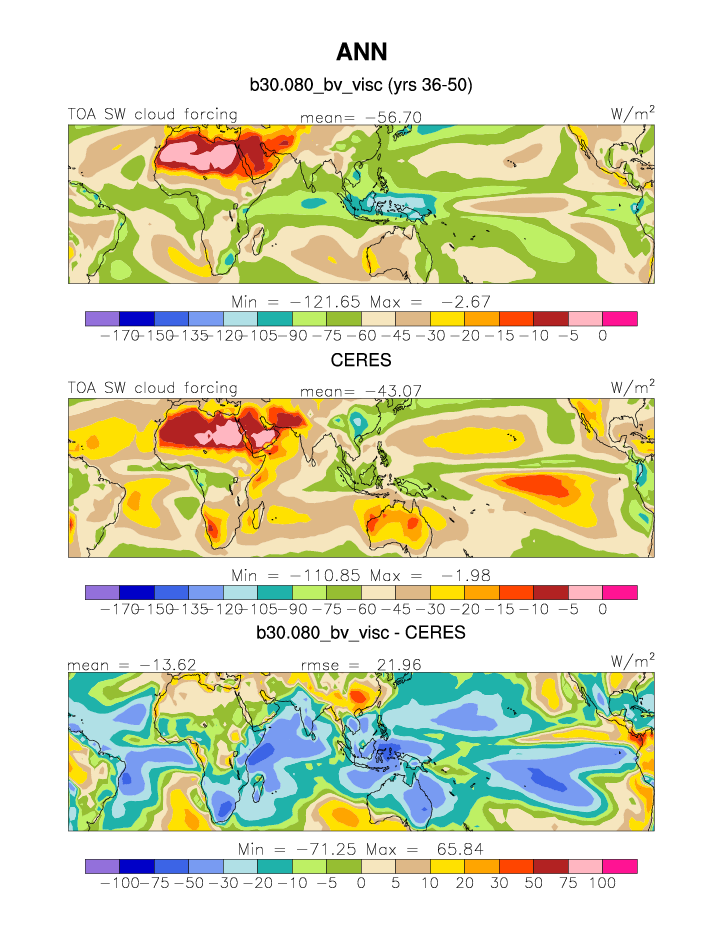
| CERES 2000-2003 | DJF | JJA | ANN | |
| ALBEDO | TOA albedo | plot | plot | plot |
| ALBEDOC | TOA clearsky albedo | plot | plot | plot |
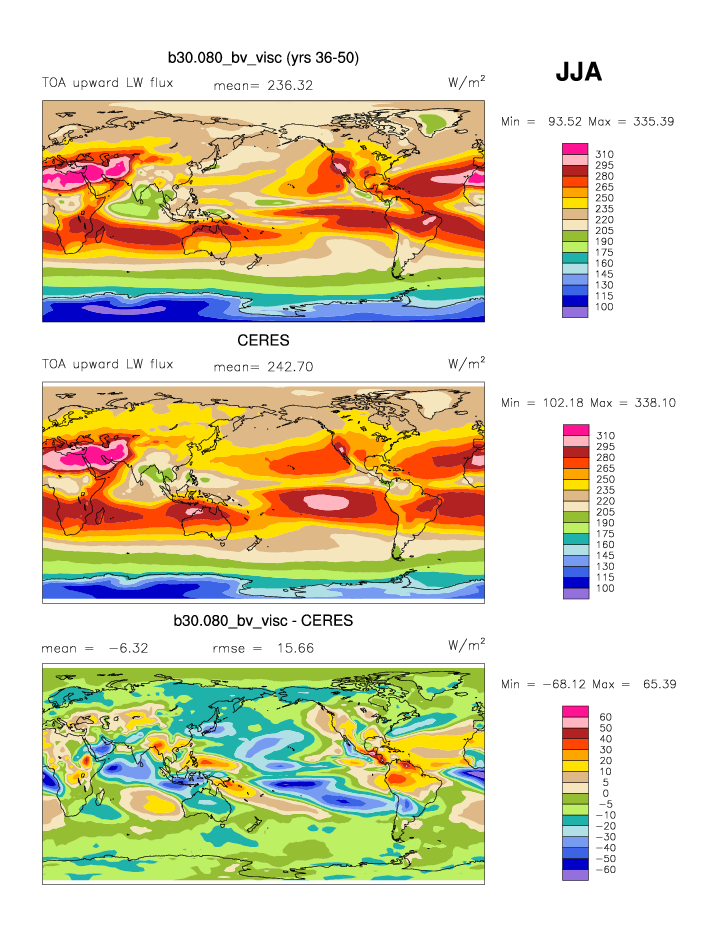
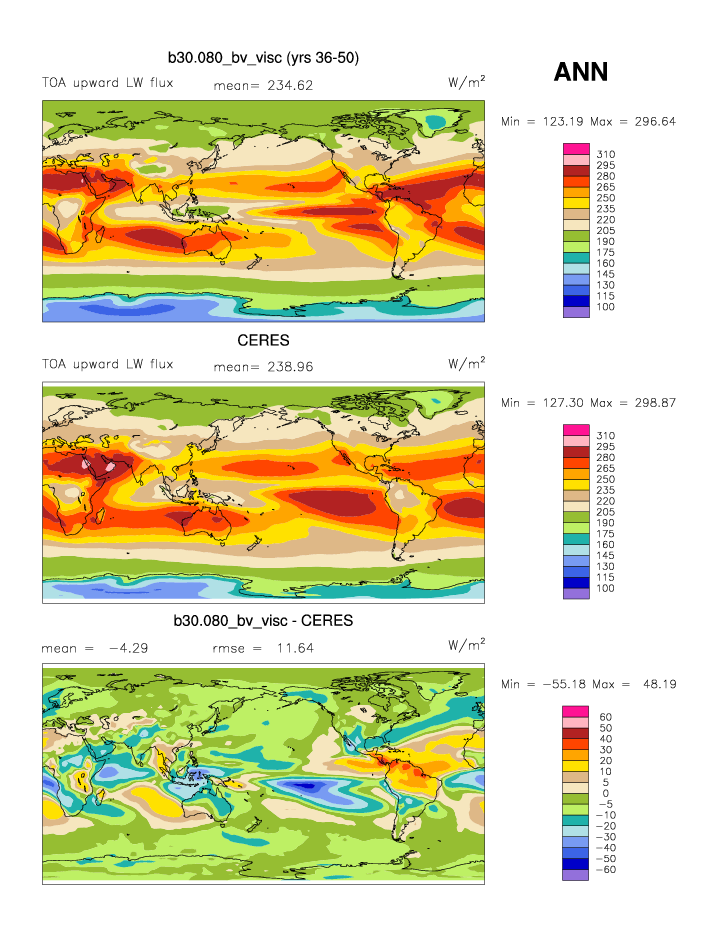
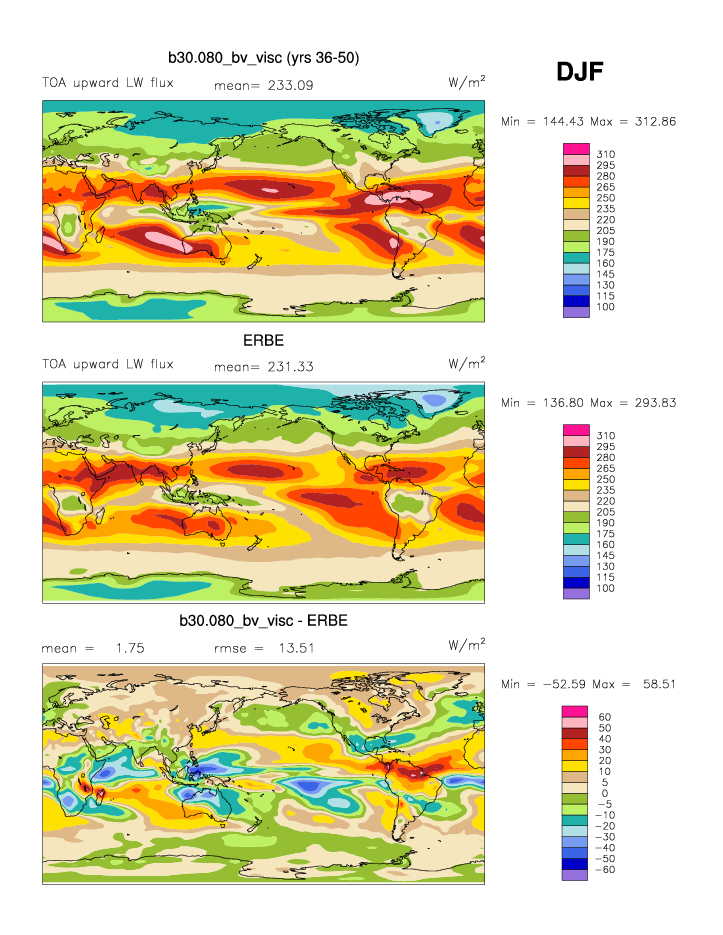
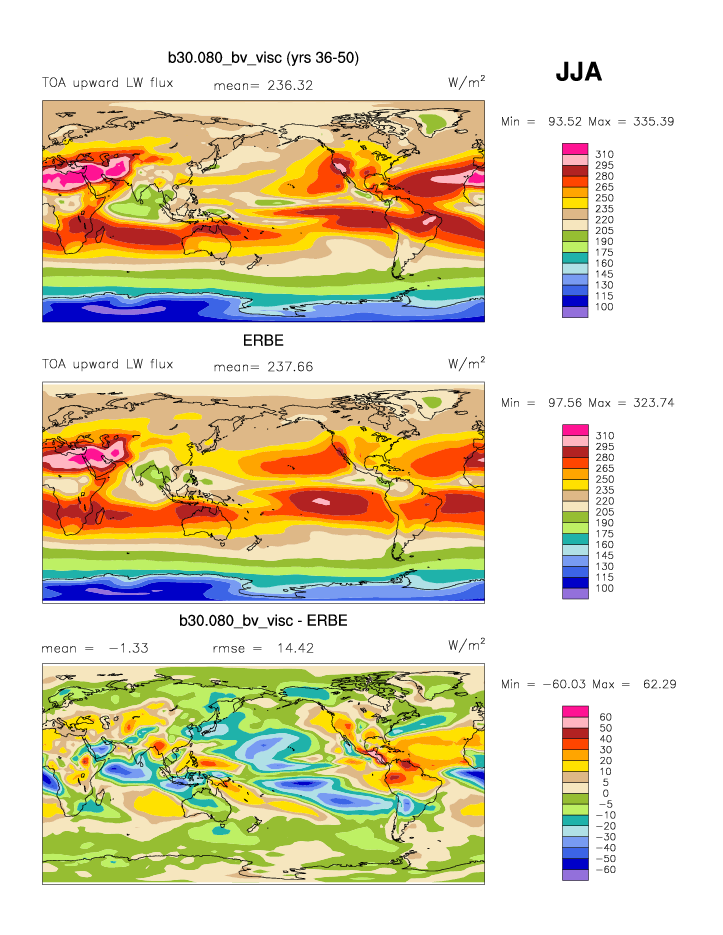
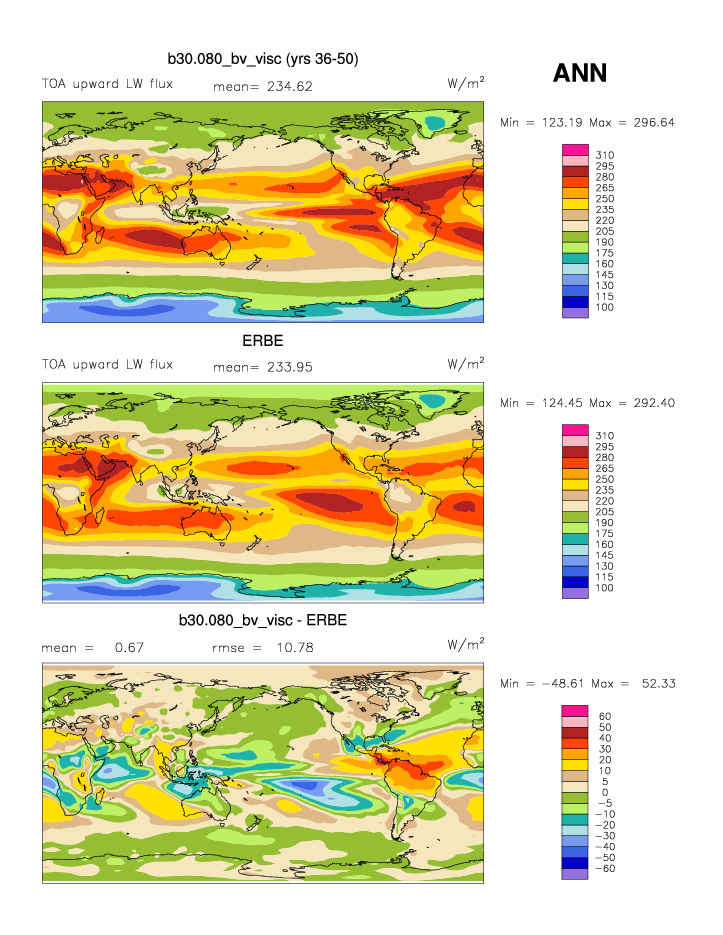
| FLUT * | TOA upward LW flux | plot | plot | plot |
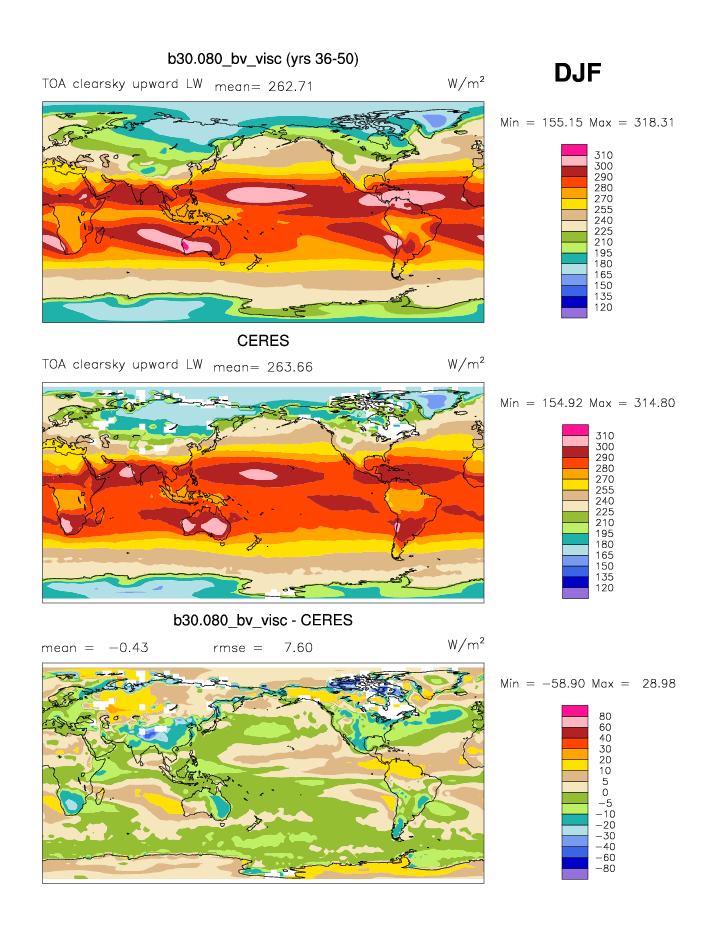
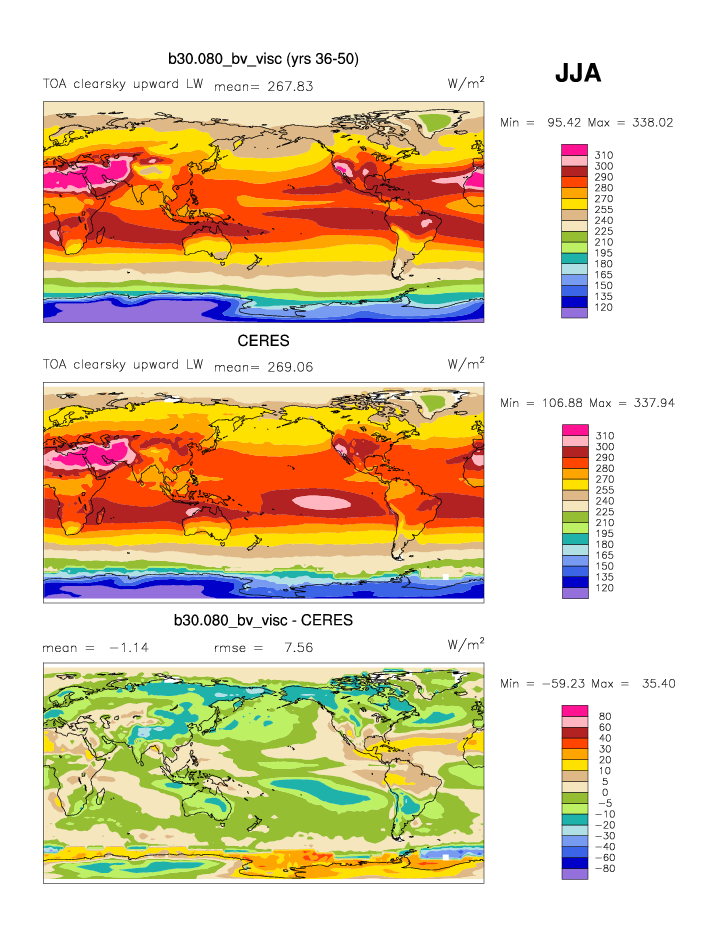
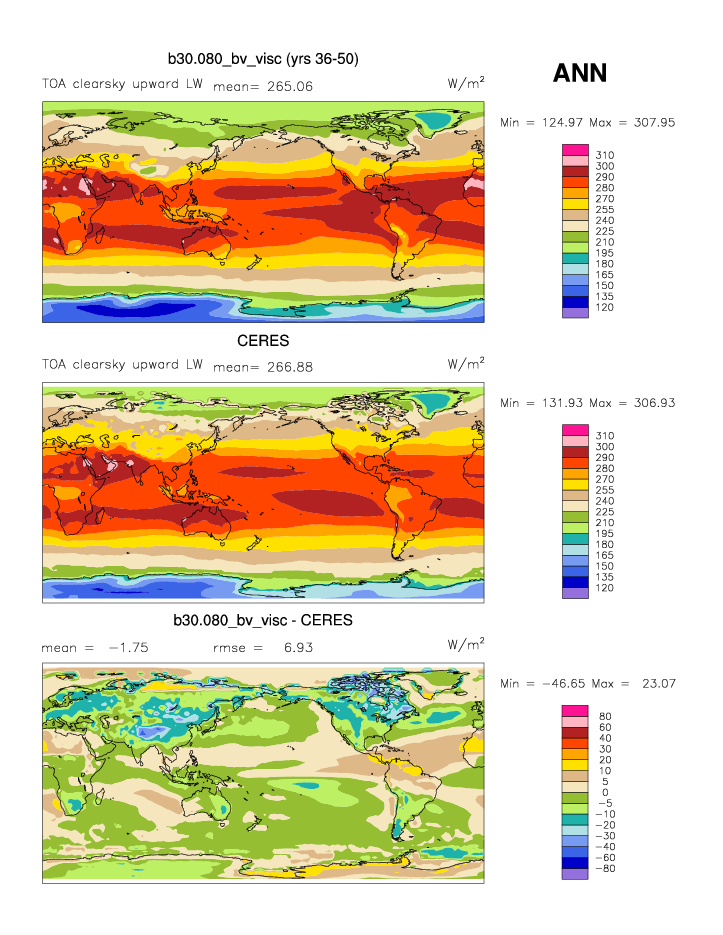
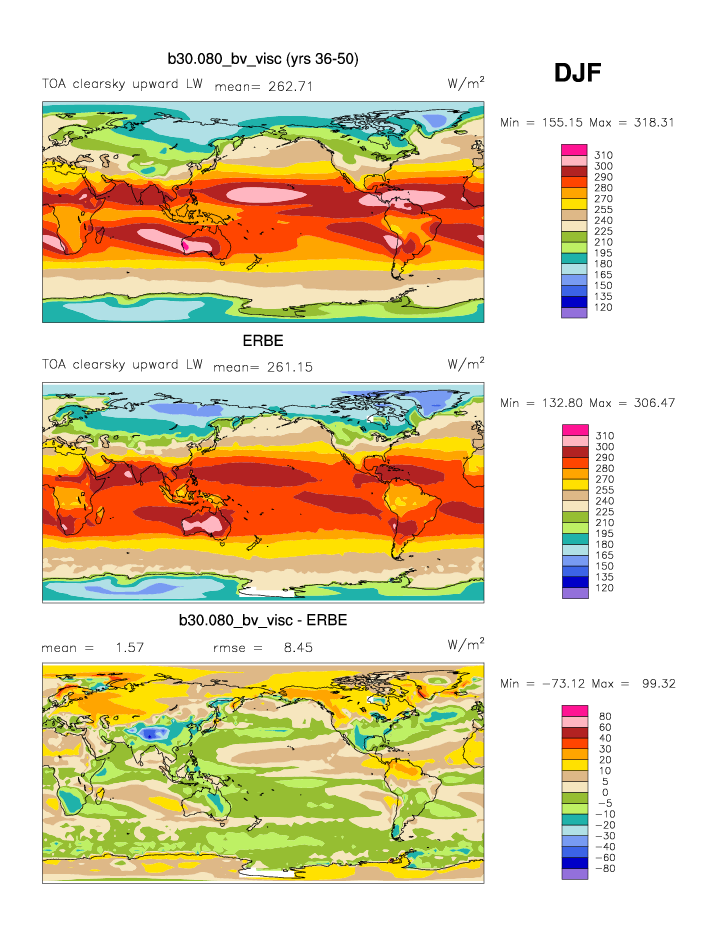
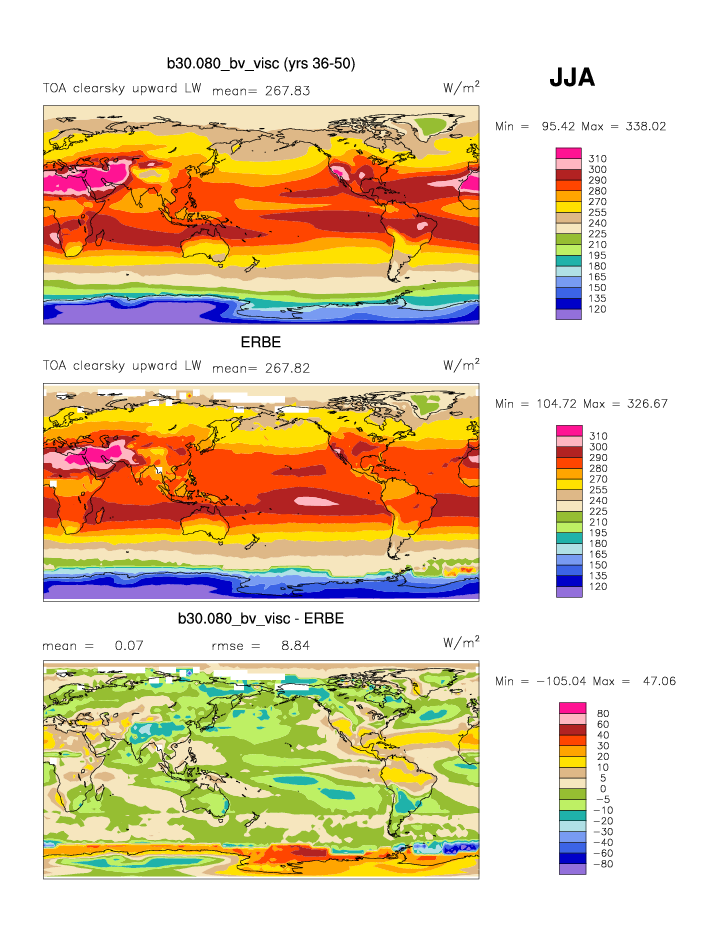
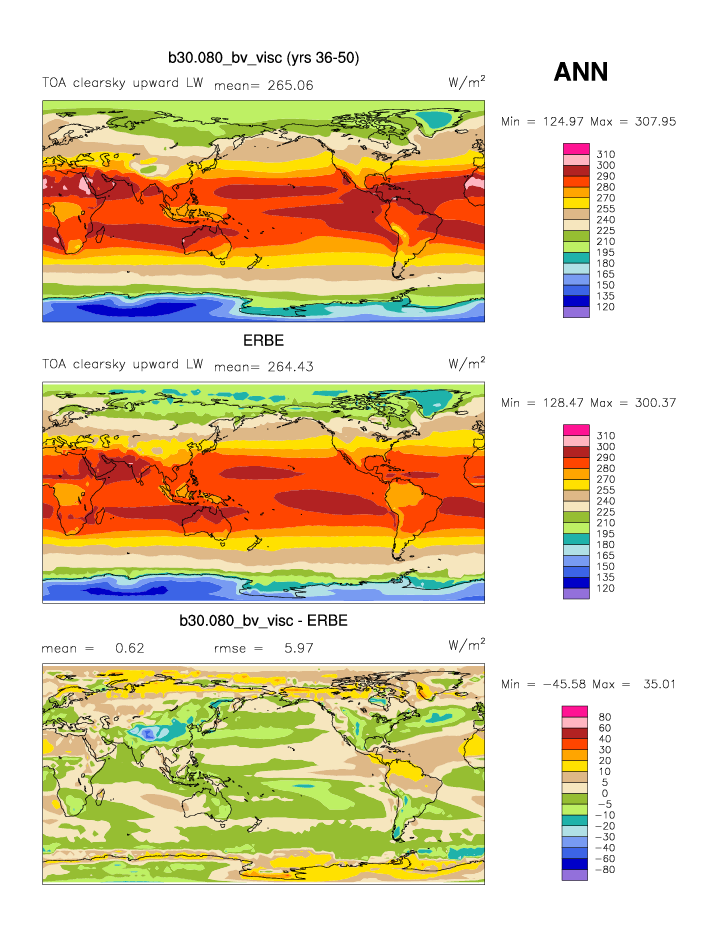
| FLUTC | TOA clearsky upward LW flux | plot | plot | plot |
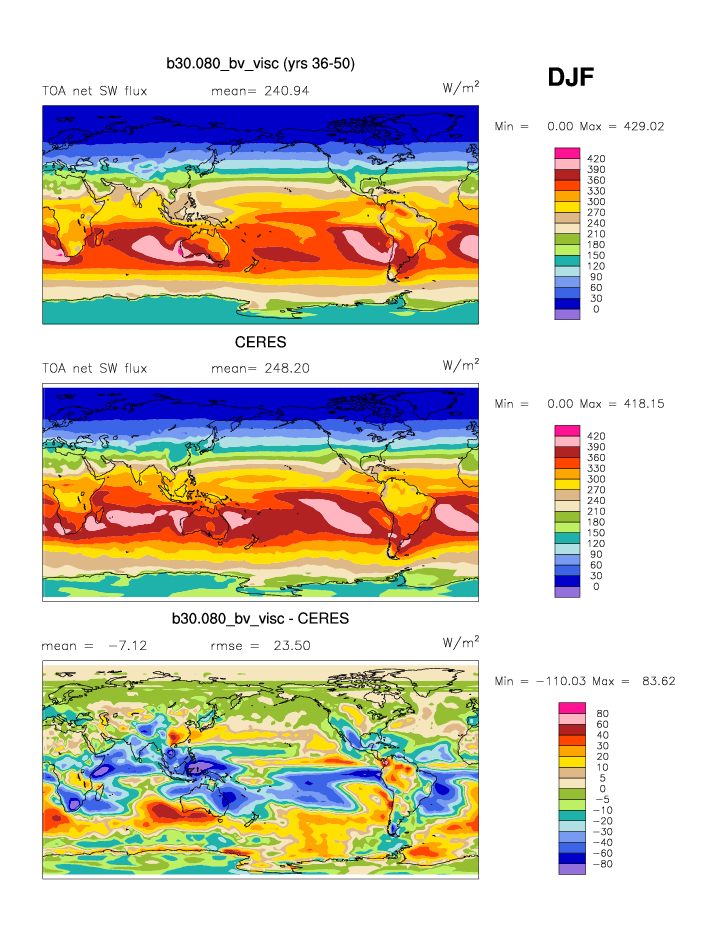
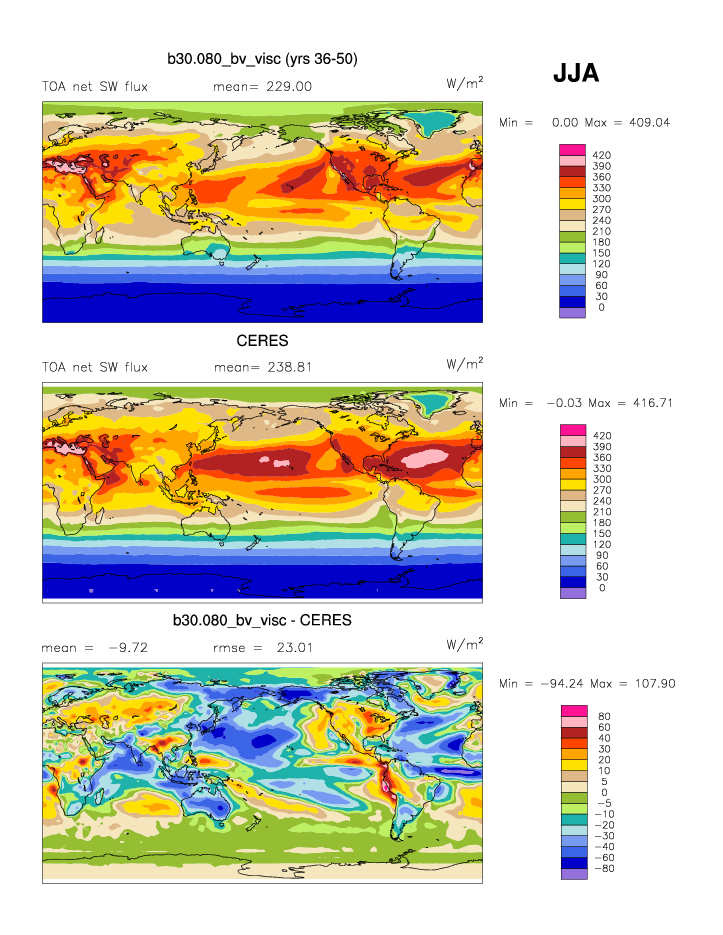
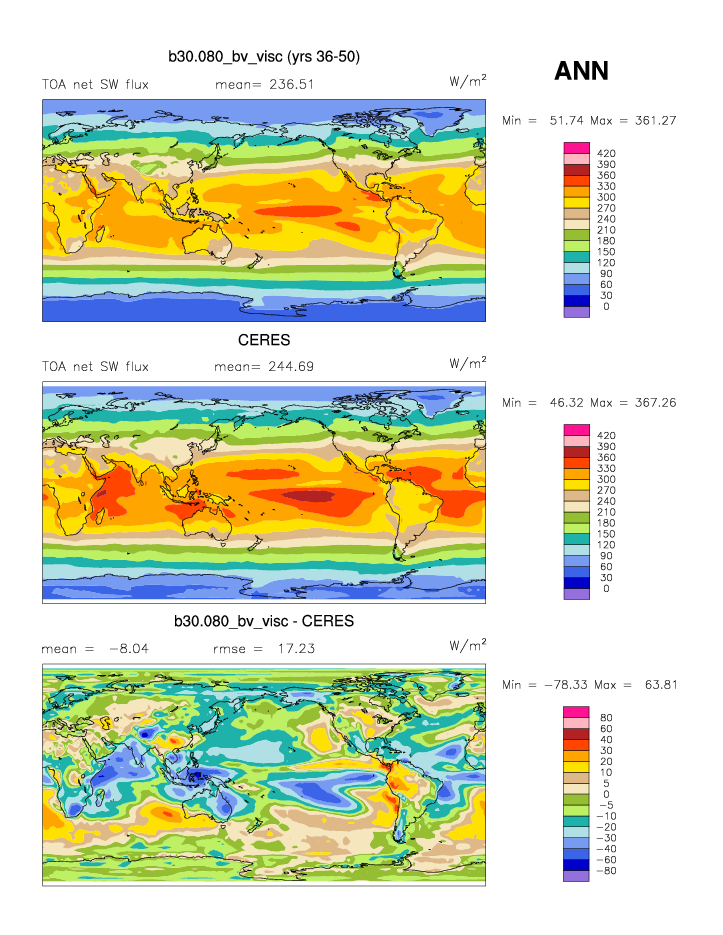
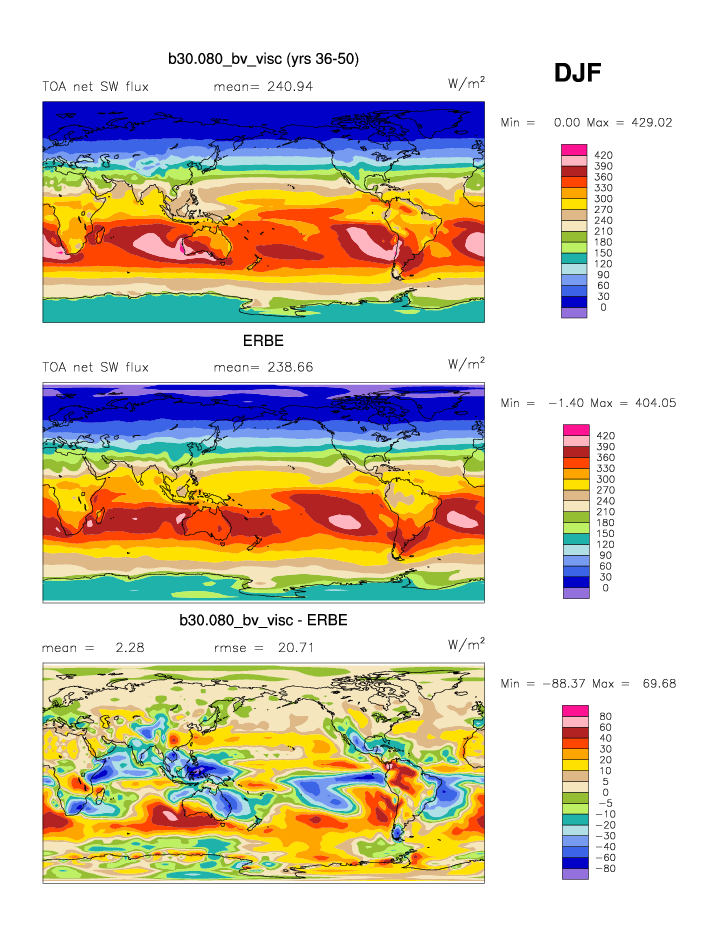
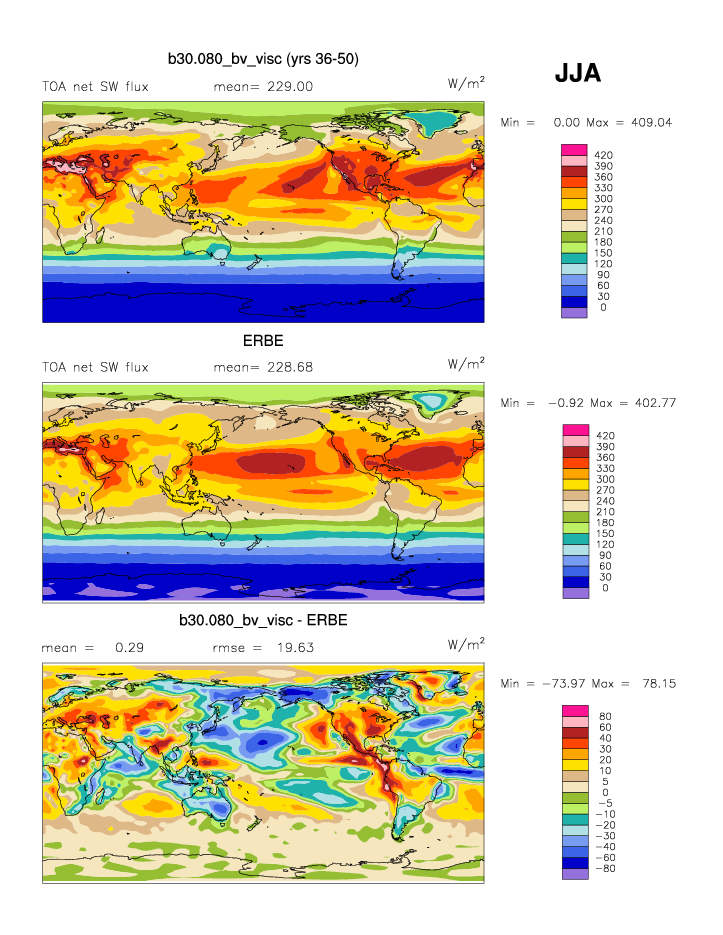
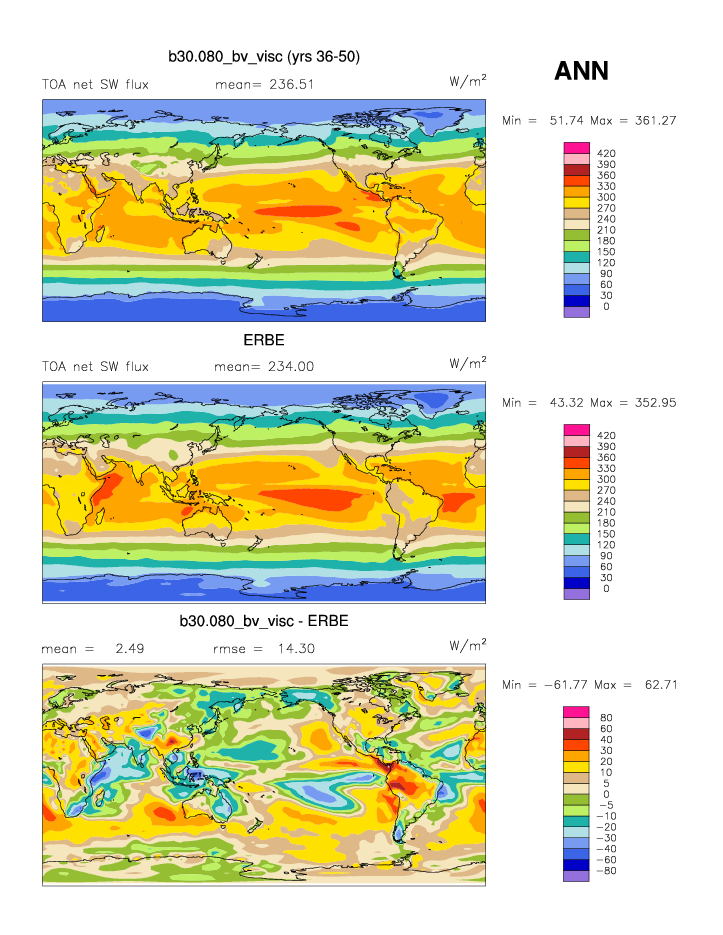
| FSNTOA * | TOA net SW flux | plot | plot | plot |
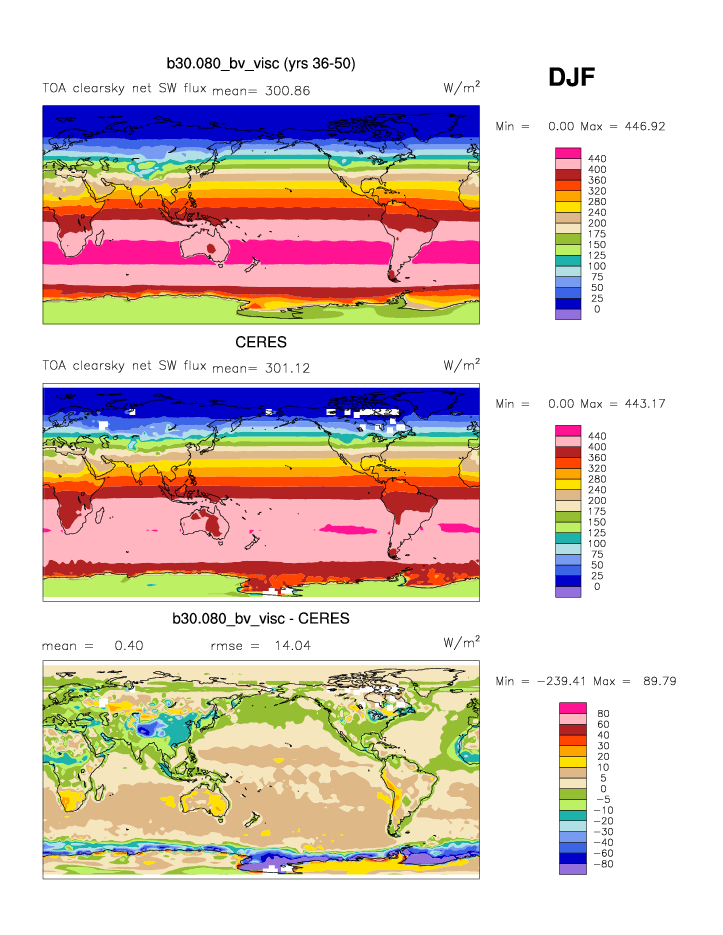
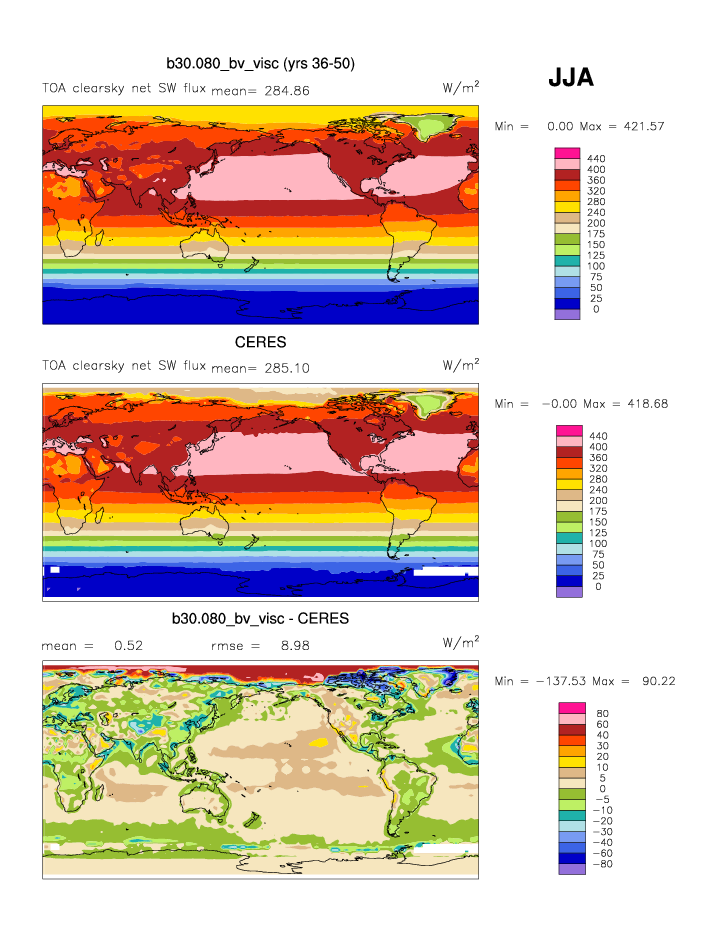
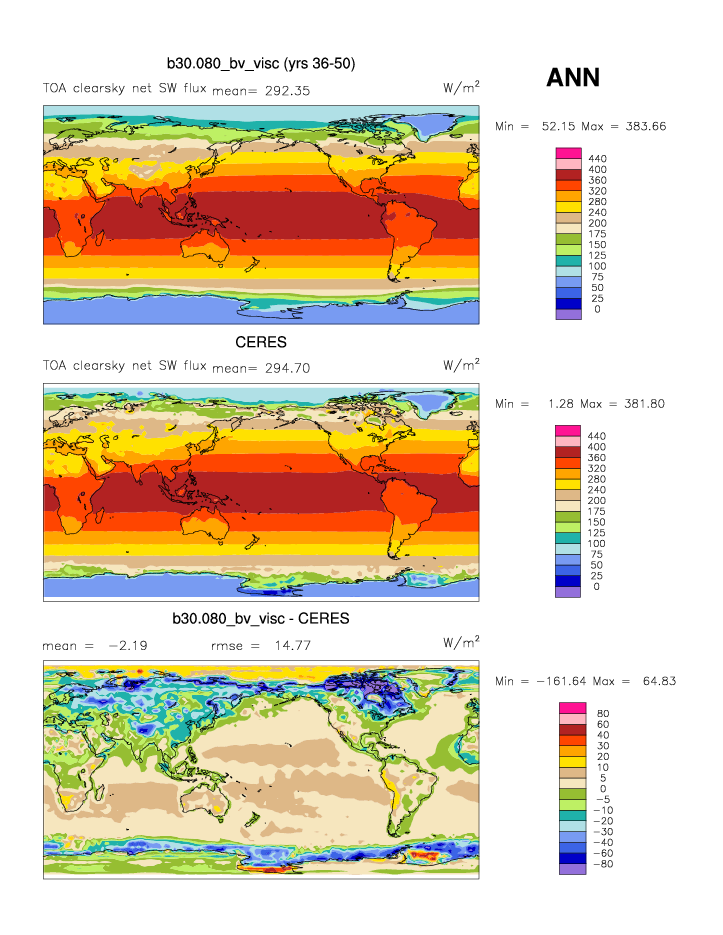
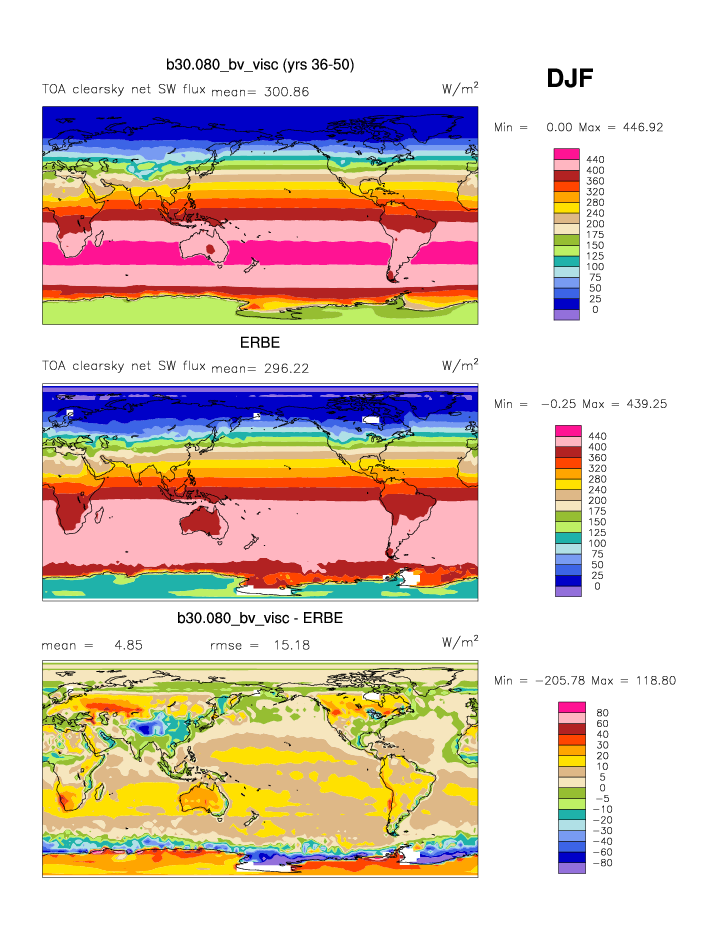
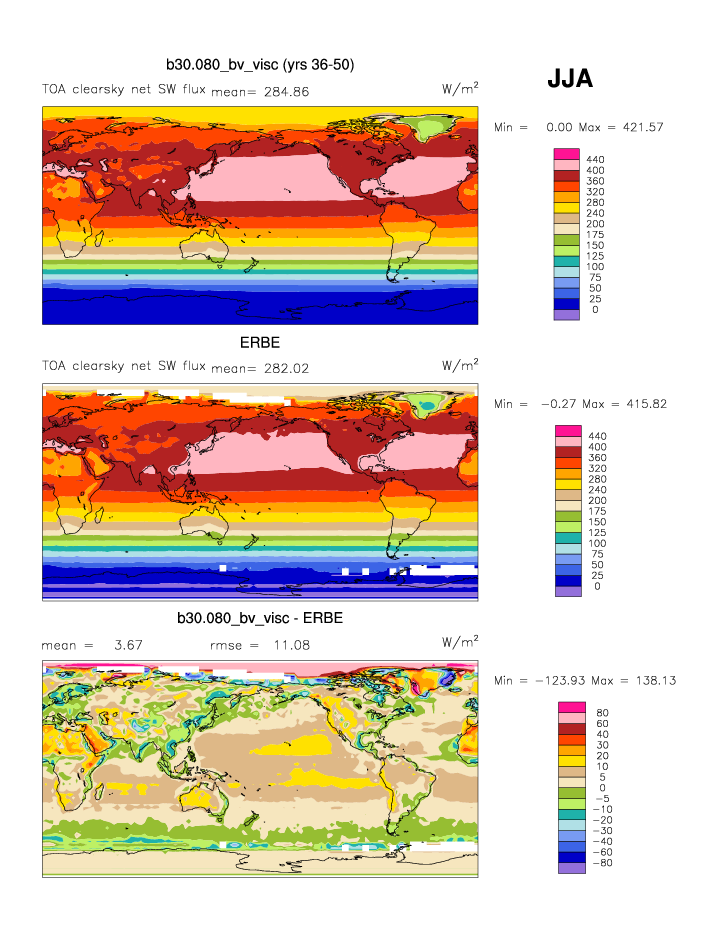
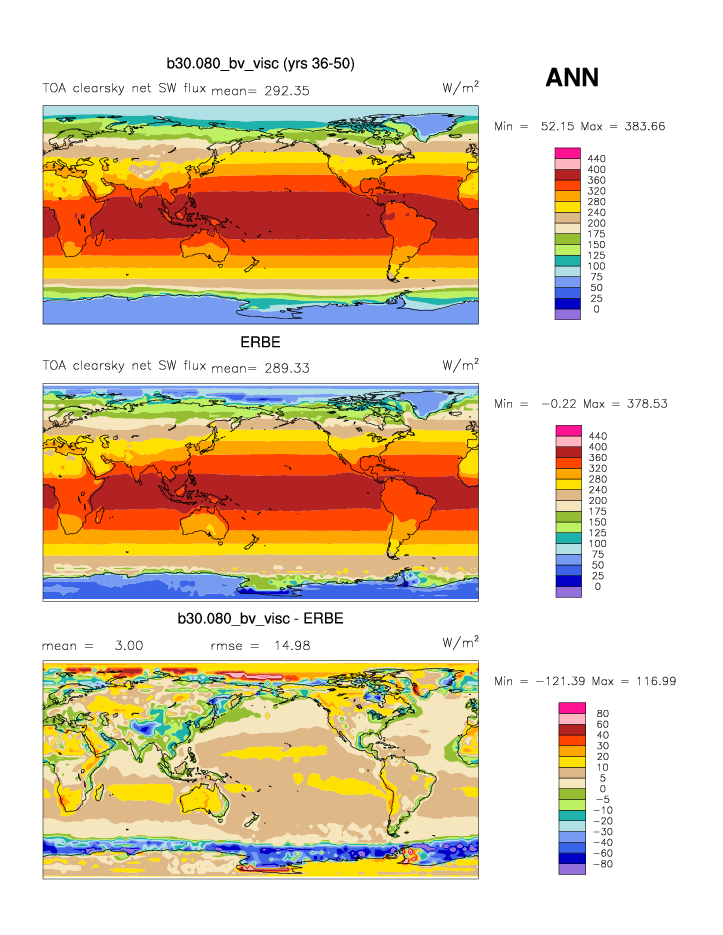
| FSNTOAC | TOA clearsky net SW flux | plot | plot | plot |
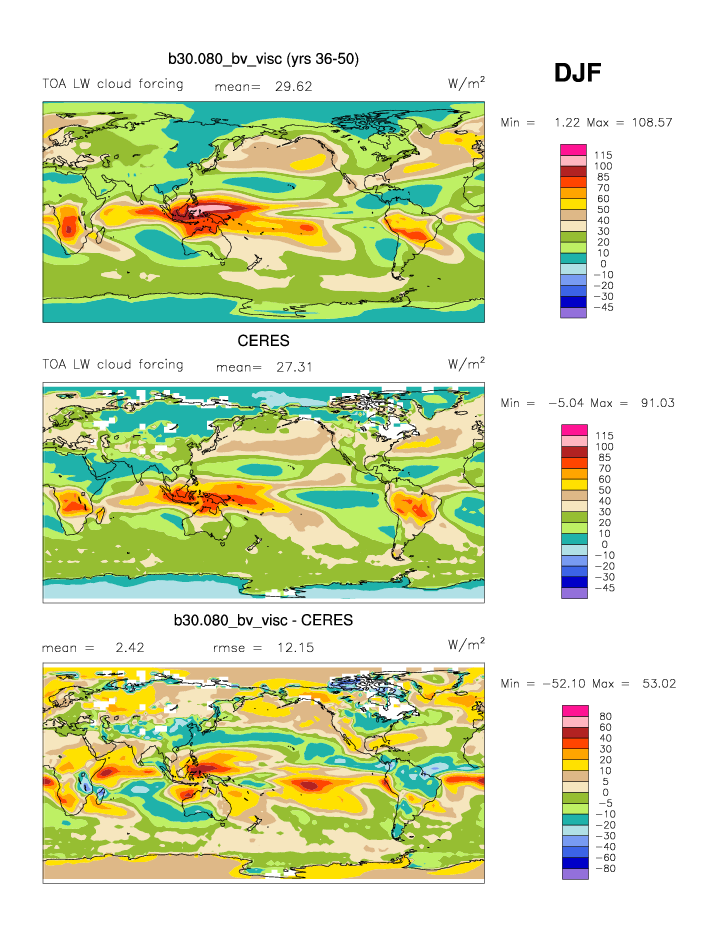
| LWCF * | TOA longwave cloud forcing | plot | plot | plot |
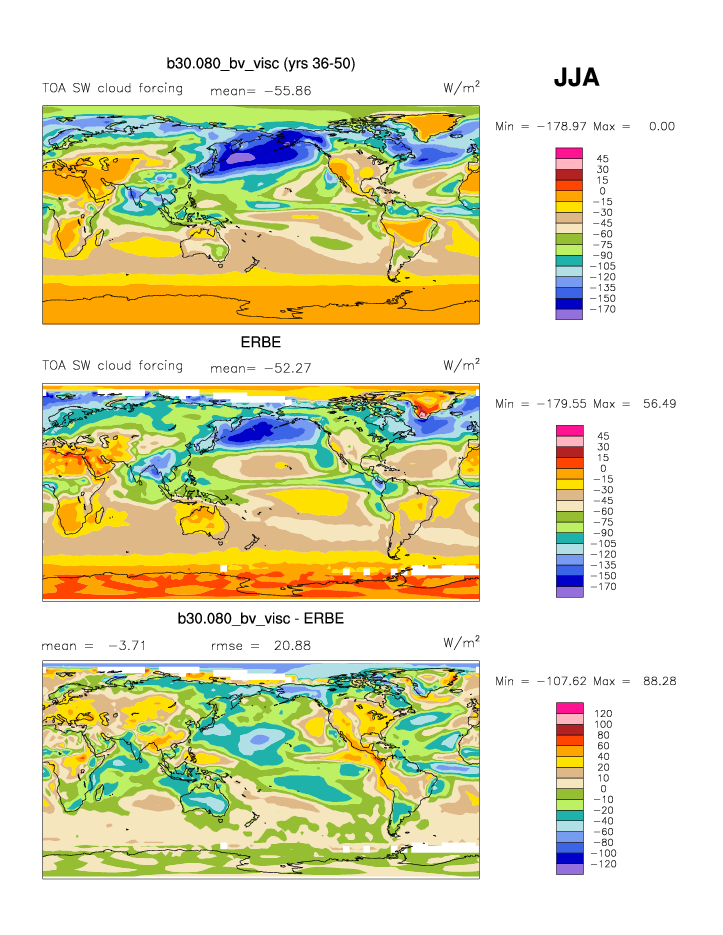
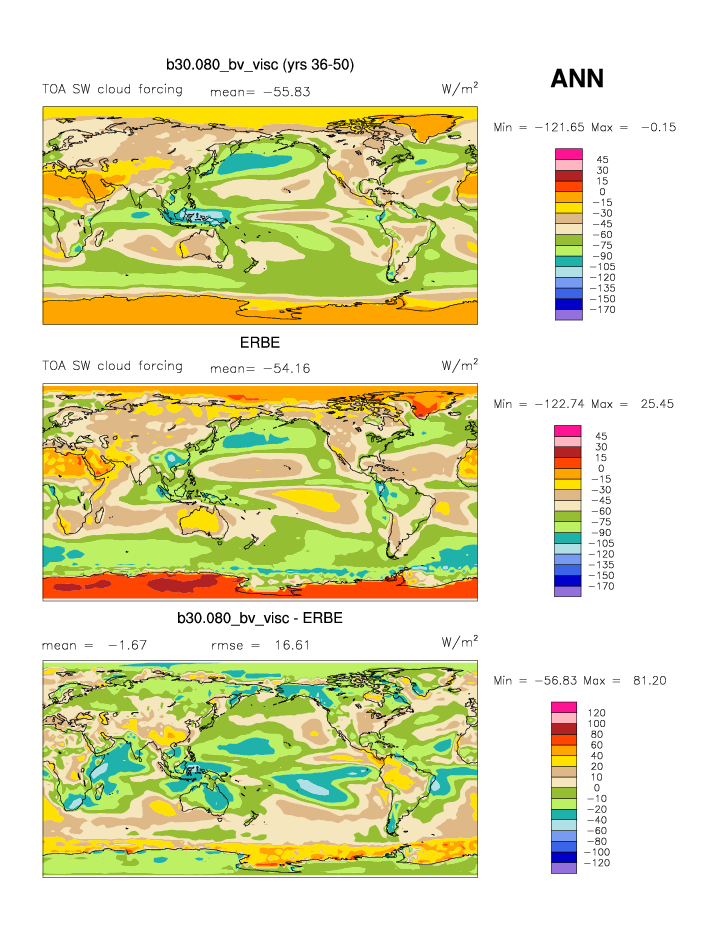
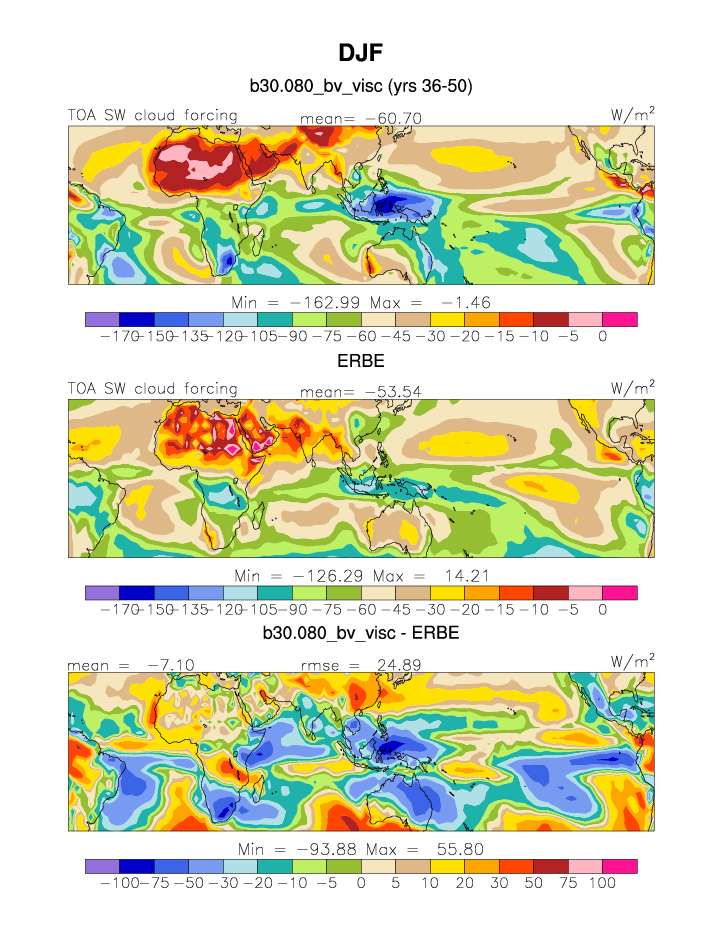
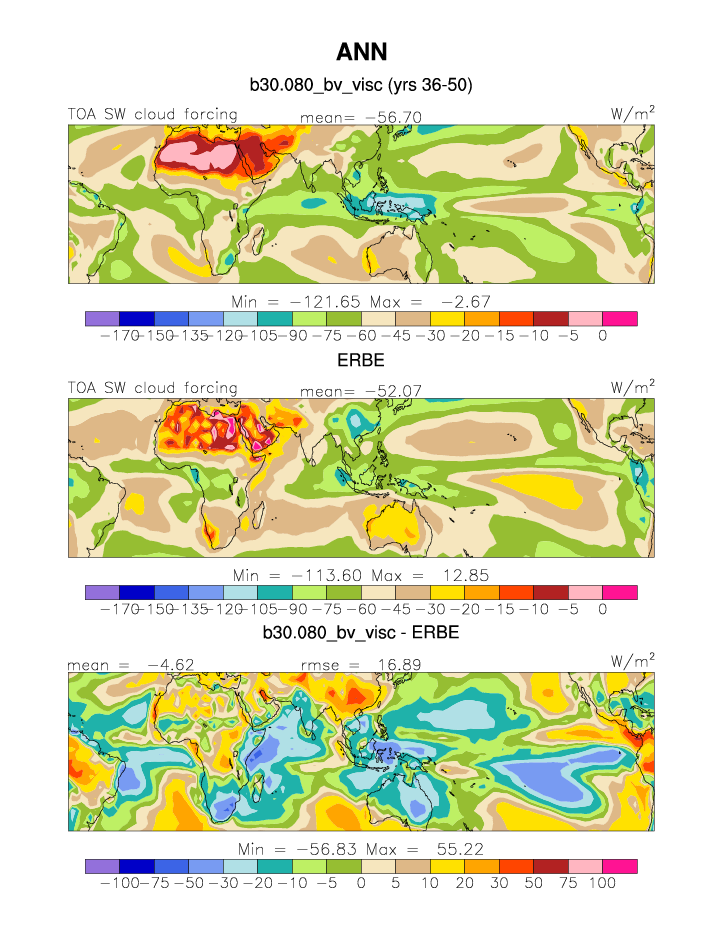
| SWCF * | TOA shortwave cloud forcing | plot | plot | plot |
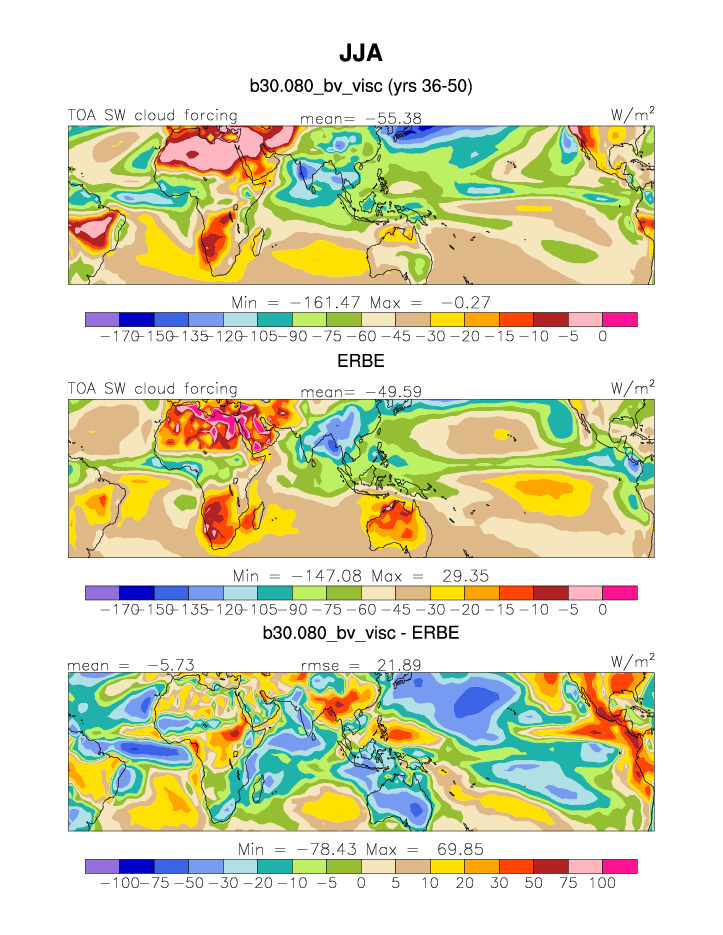
| SWCF TROP | Tropical TOA SW cloud forcing | plot | plot | plot |
| ERBE Feb1985-Apr1989 | DJF | JJA | ANN | |
| FLUT * | TOA upward longwave flux | plot | plot | plot |
| FLUTC | TOA clearsky upward longwave flux | plot | plot | plot |
| FSNTOA * | TOA net shortwave flux | plot | plot | plot |
| FSNTOAC | TOA clearsky net shortwave flux | plot | plot | plot |
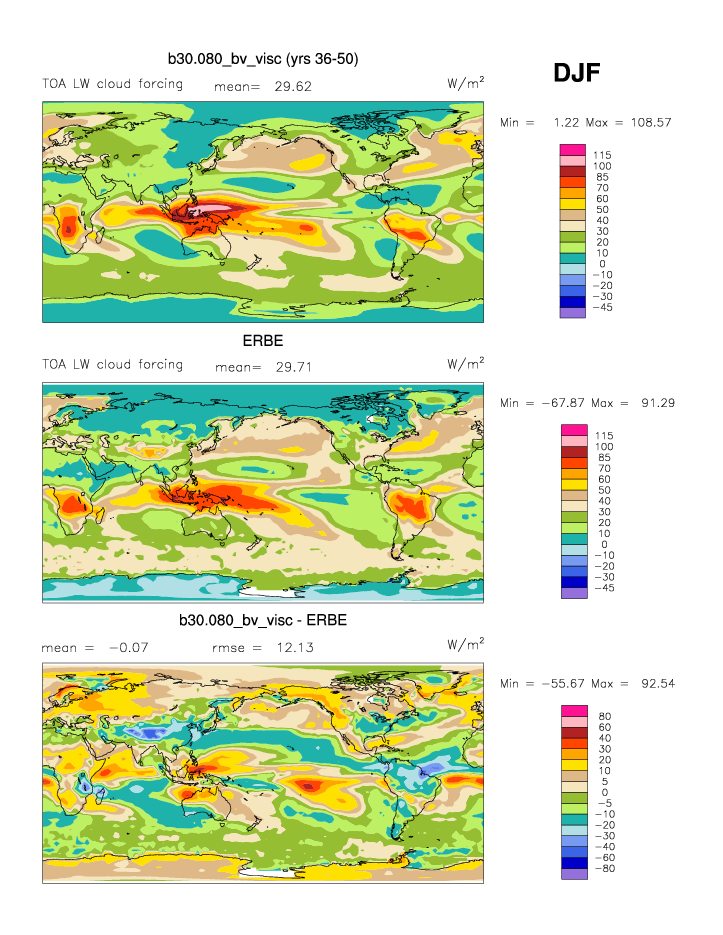
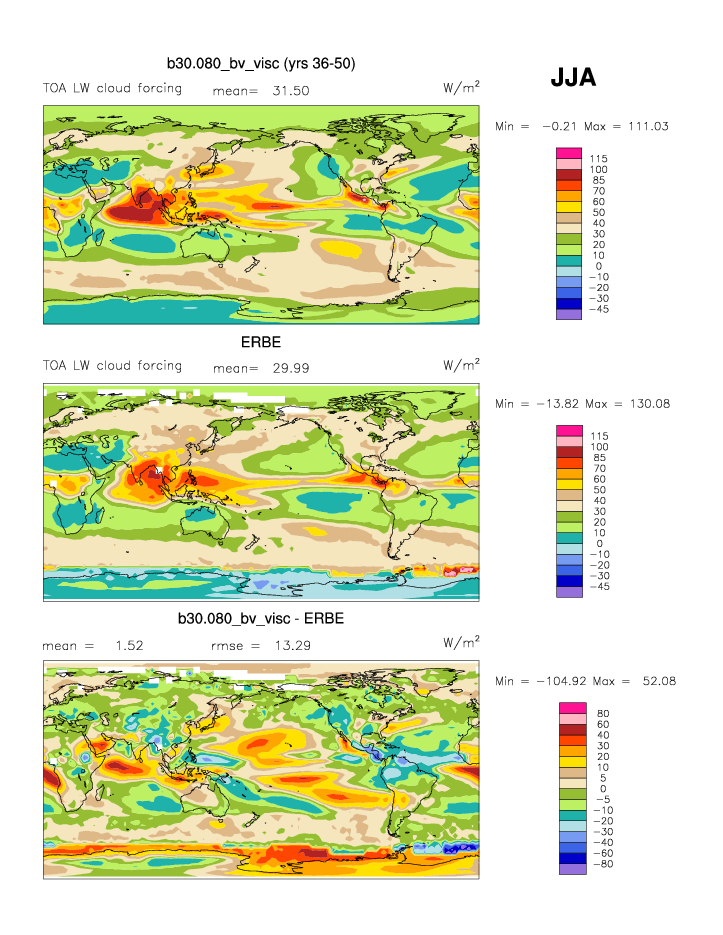
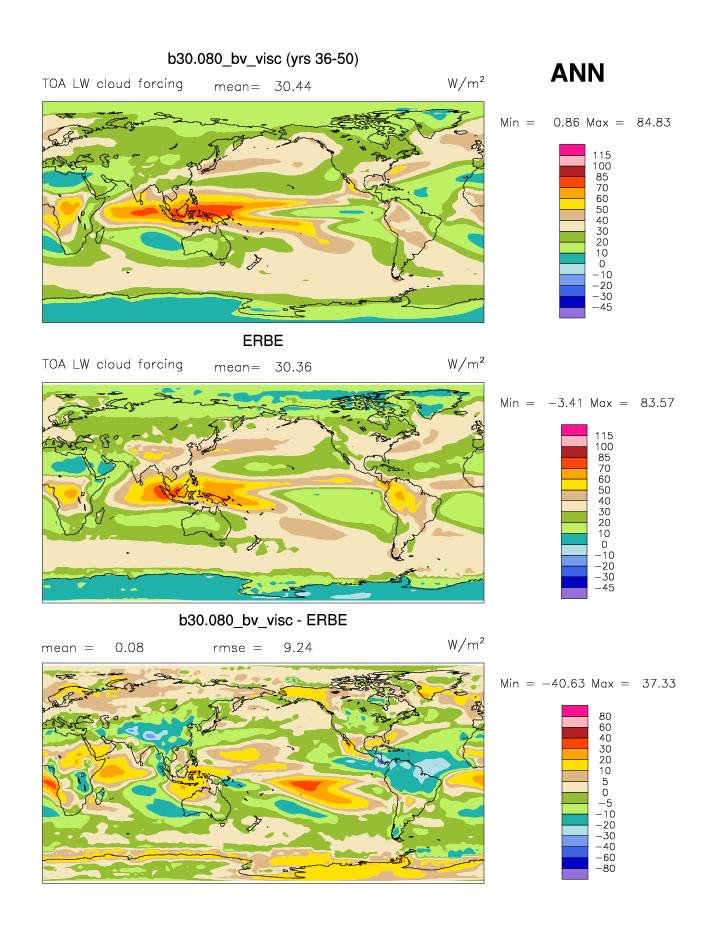
| LWCF * | TOA longwave cloud forcing | plot | plot | plot |
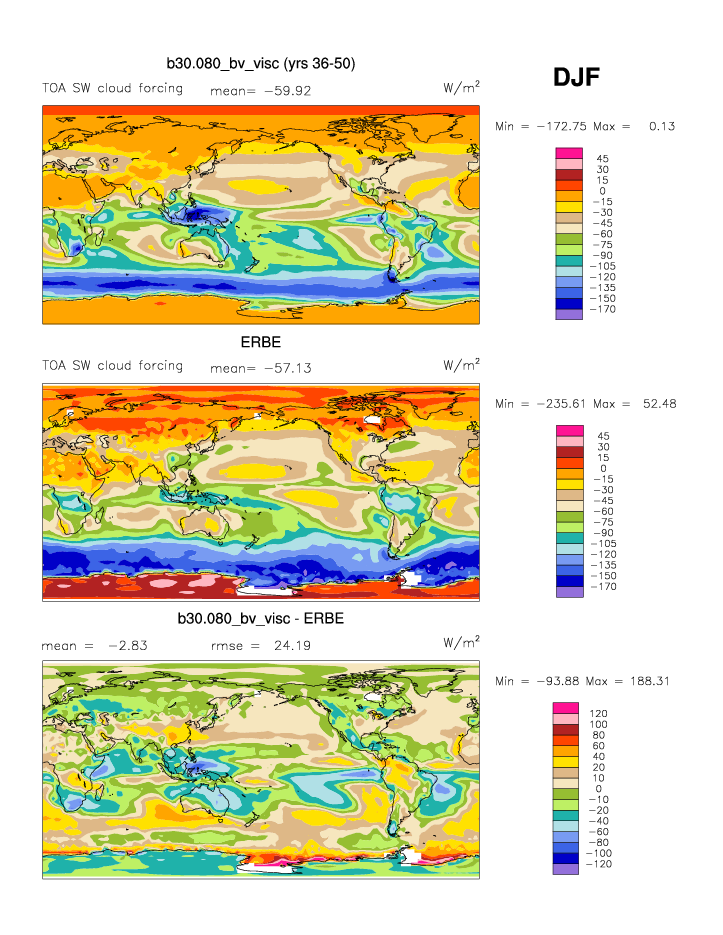
| SWCF * | TOA shortwave cloud forcing | plot | plot | plot |
| SWCF TROP | Tropical TOA SW cloud forcing | plot | plot | plot |
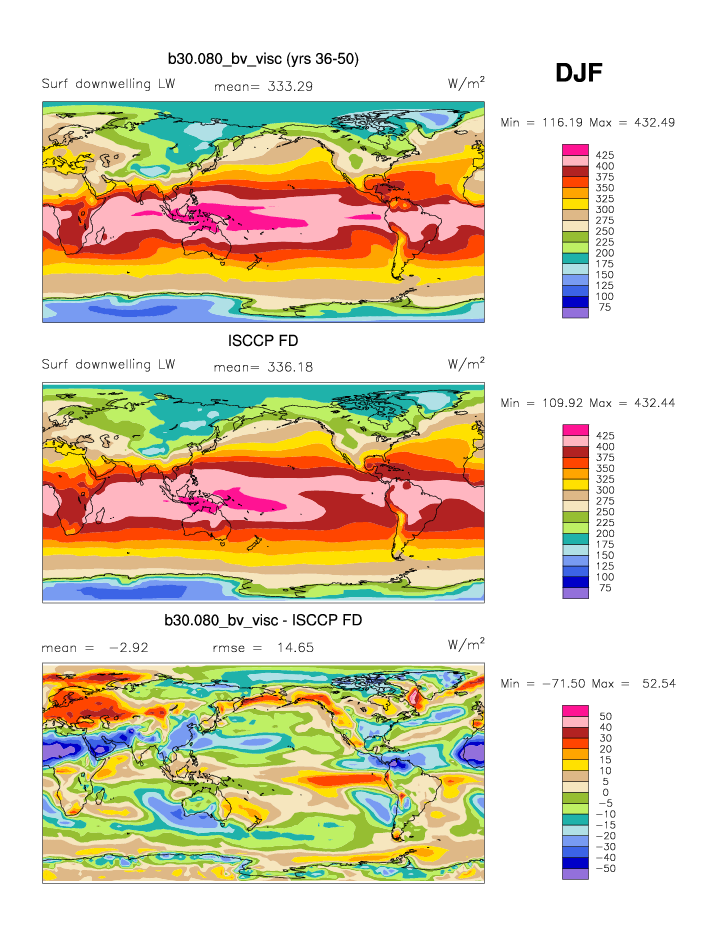
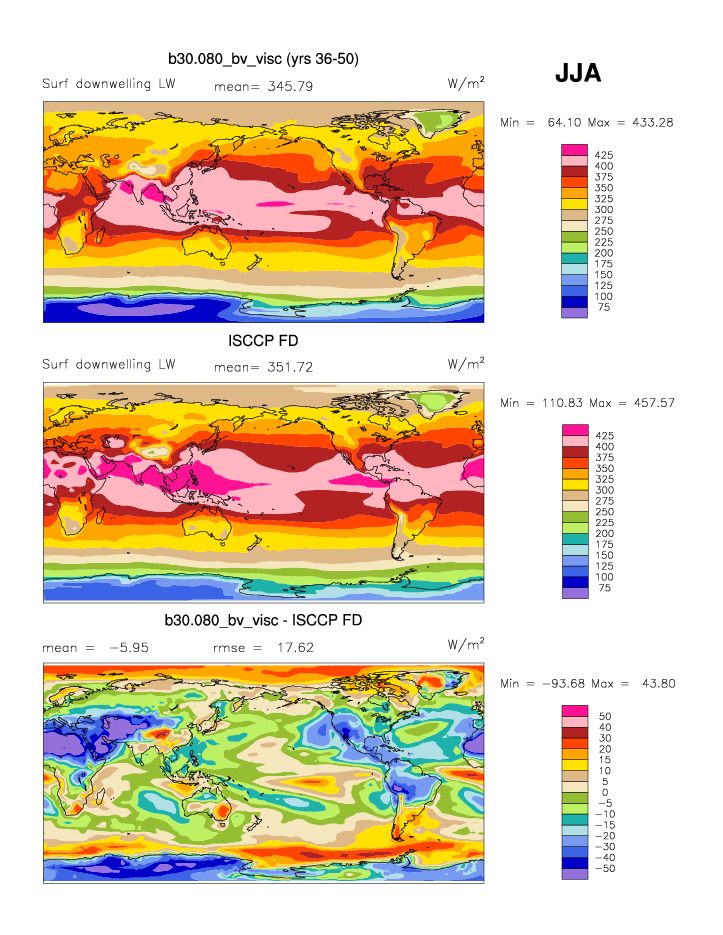
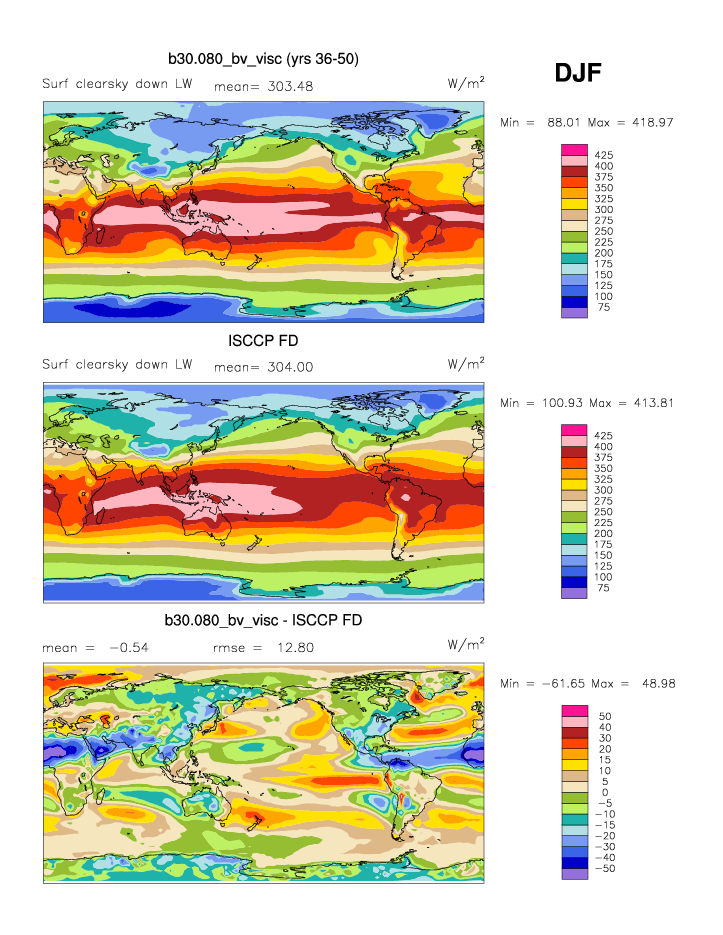
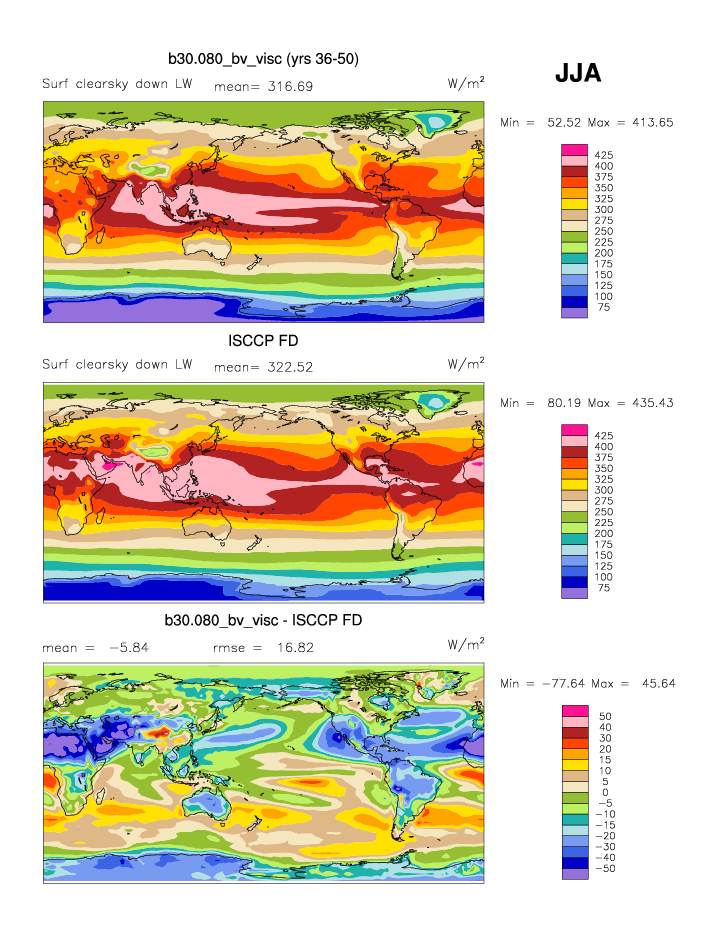
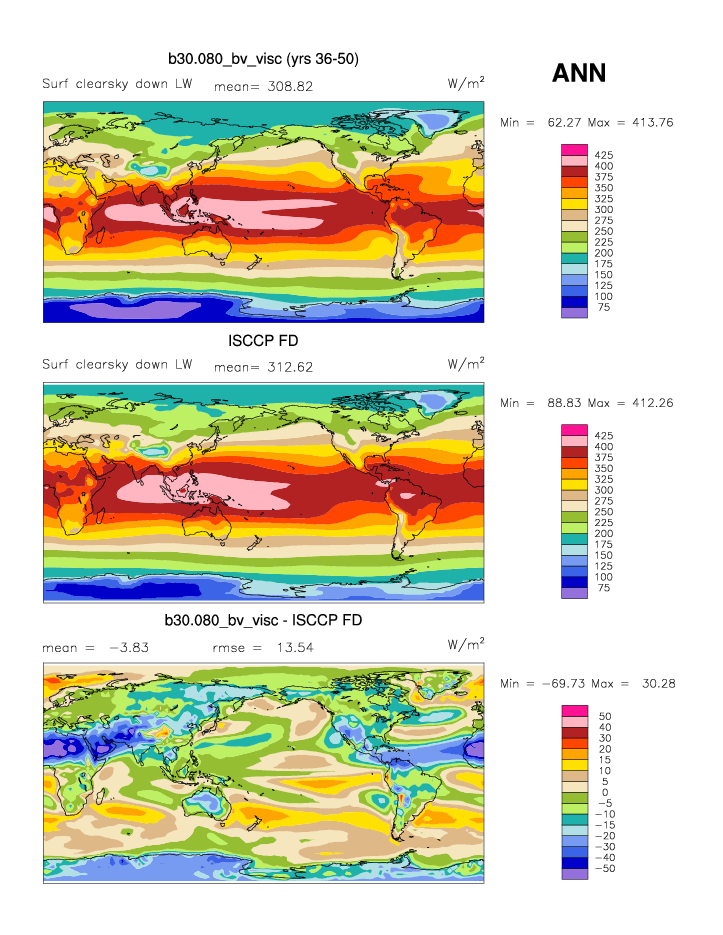
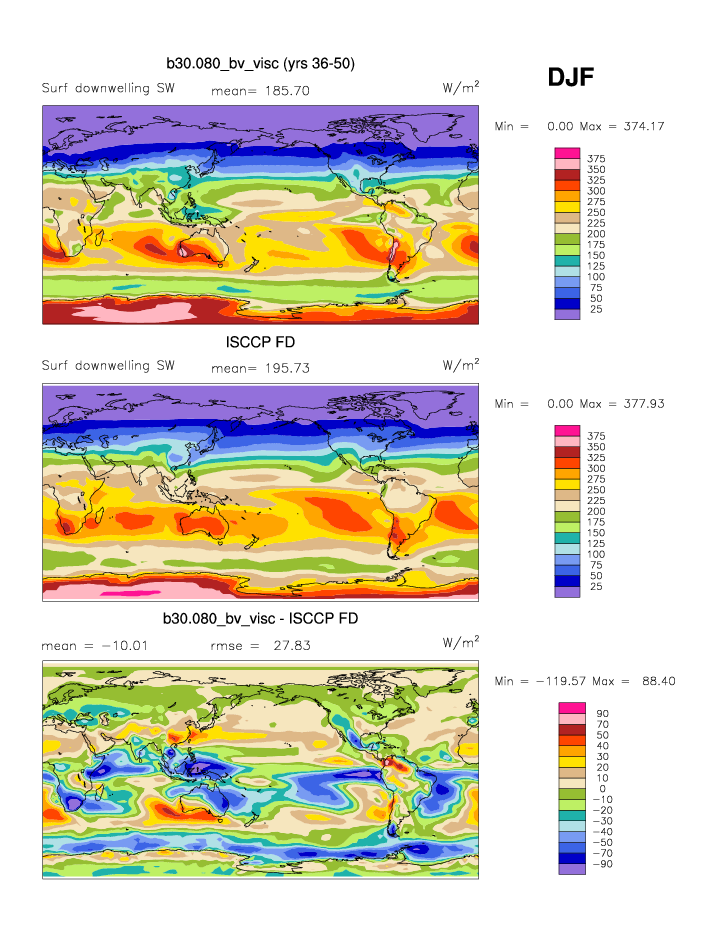
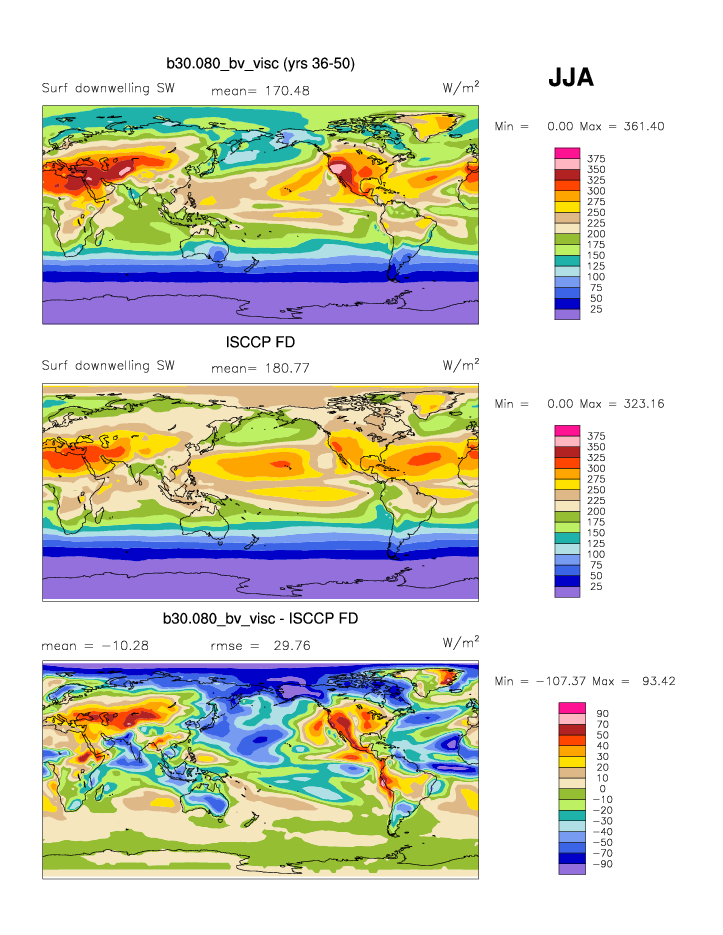
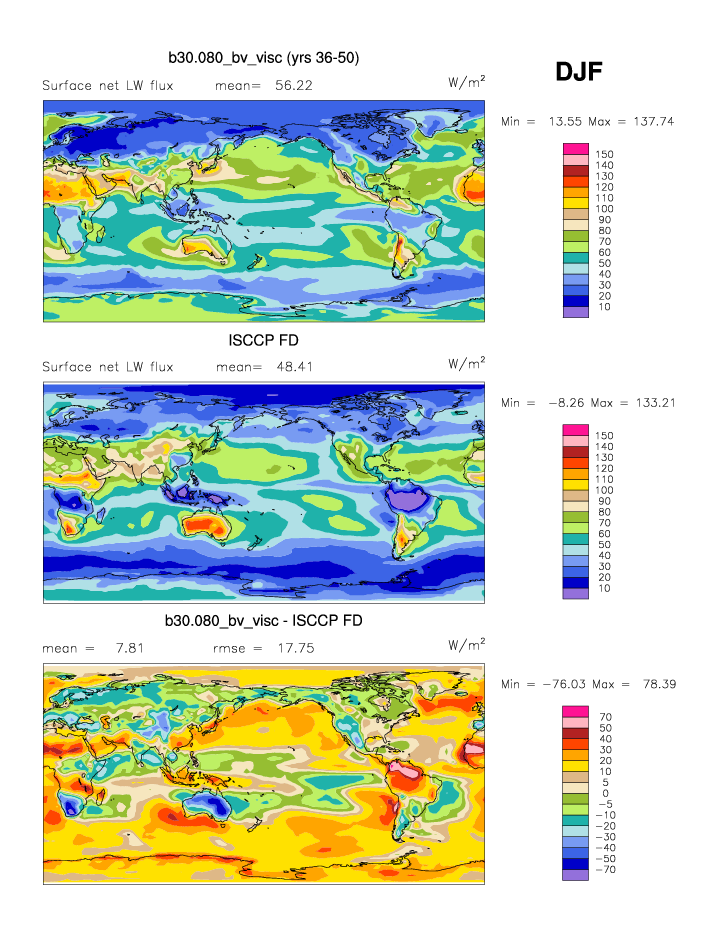
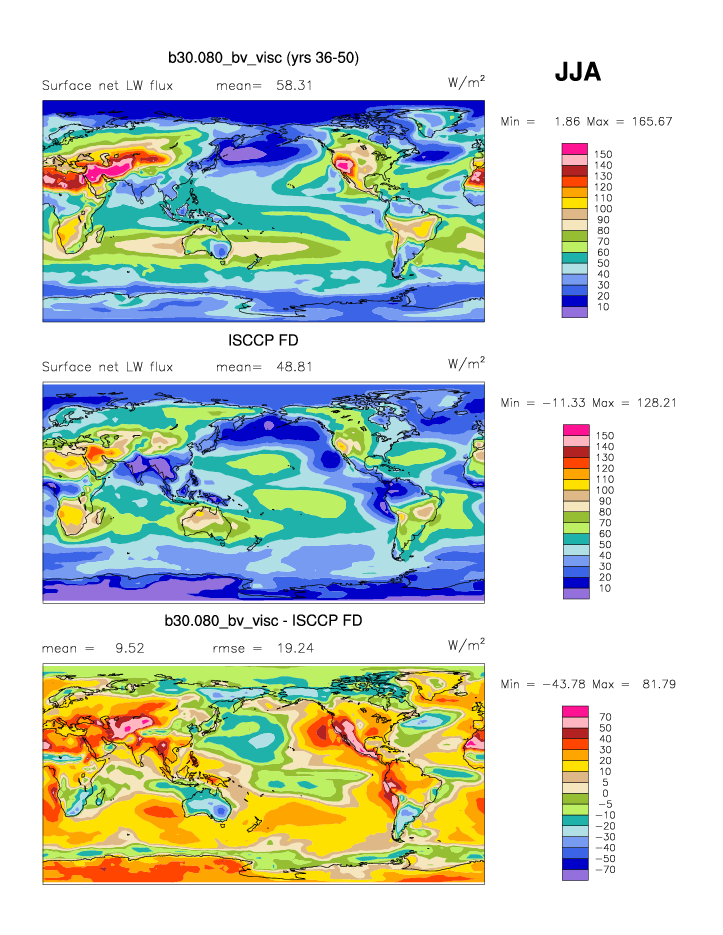
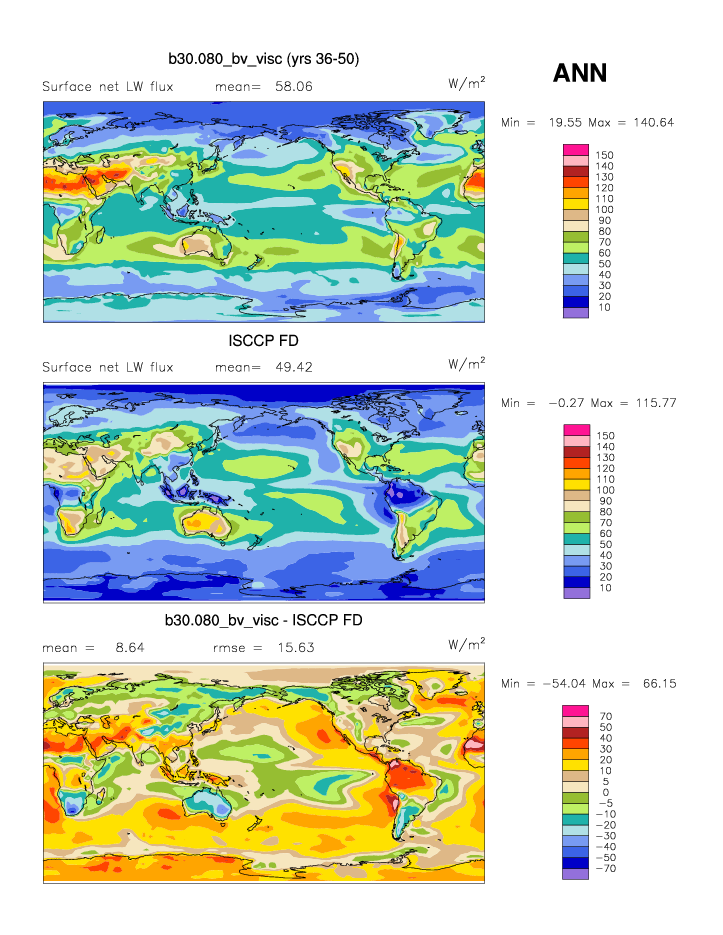
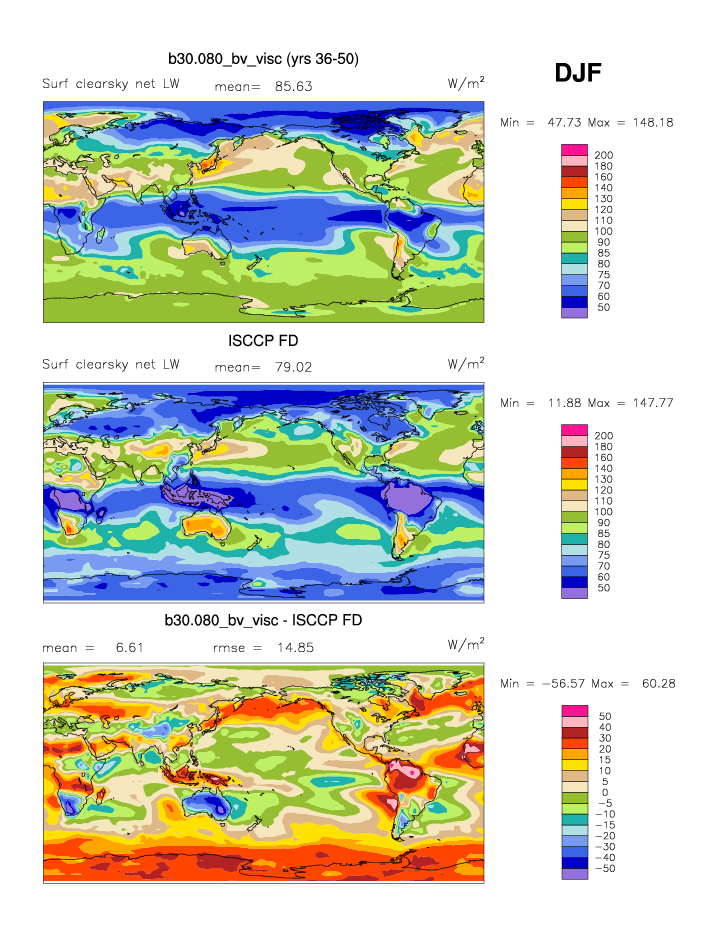
| ISCCP FD Jul1983-Dec2000 | DJF | JJA | ANN | |
| FLDS | Surf LW downwelling flux | plot | plot | plot |
| FLDSC | Clearsky Surf LW downwelling flux | plot | plot | plot |
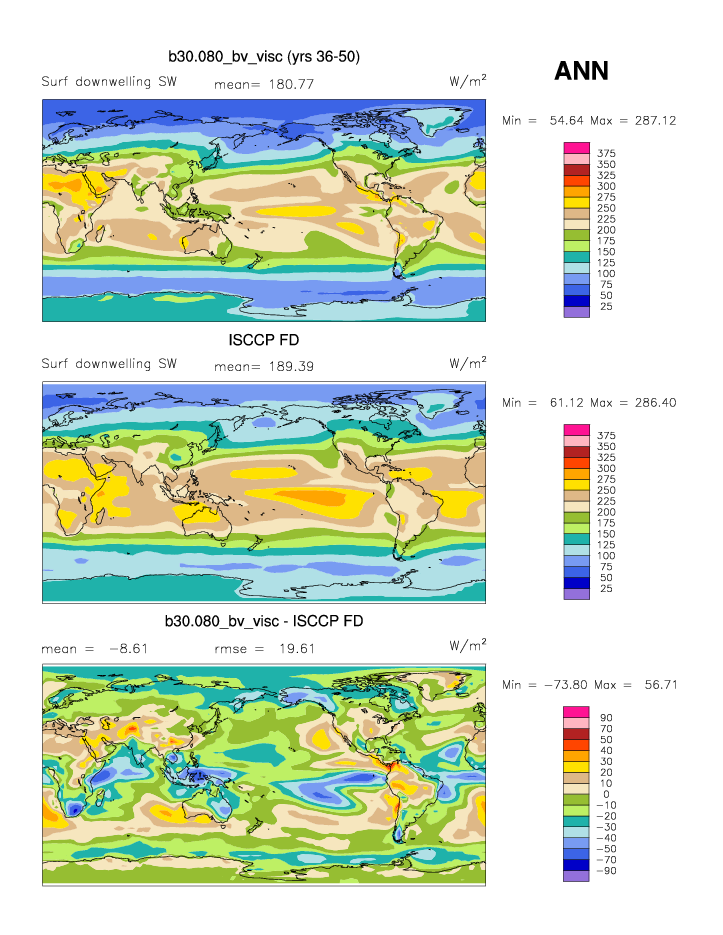
| FSDS | Surf SW downwelling flux | plot | plot | plot |
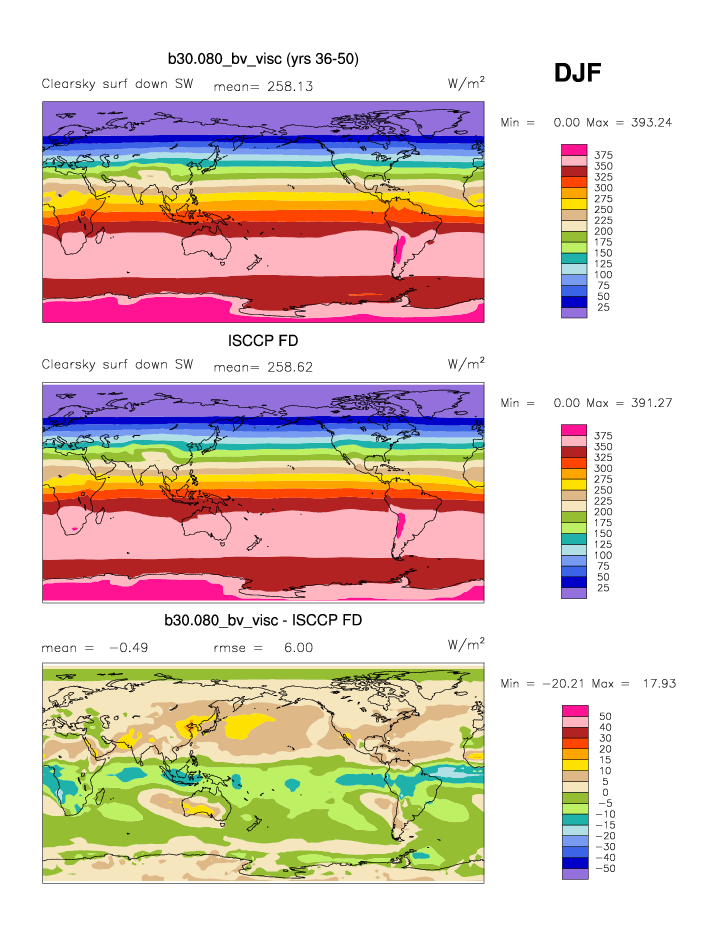
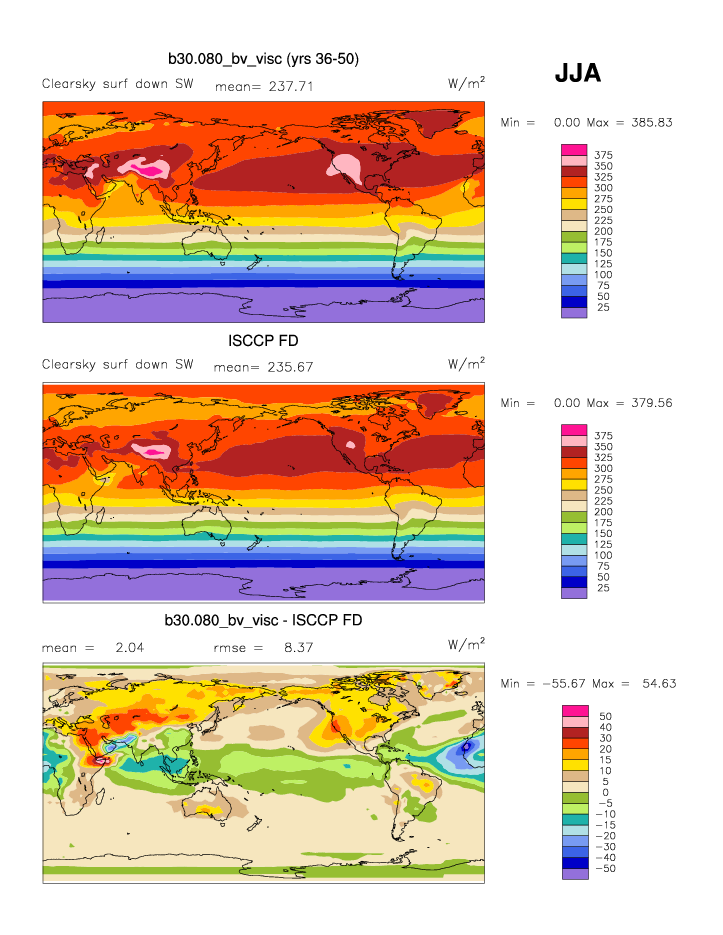
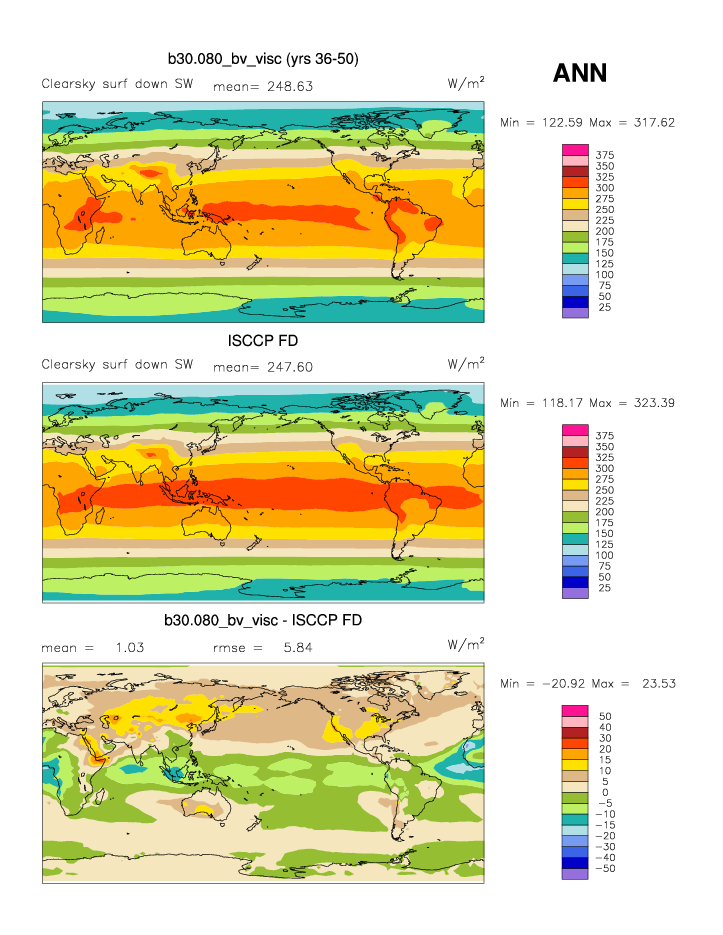
| FSDSC | Clearsky Surf SW downwelling flux | plot | plot | plot |
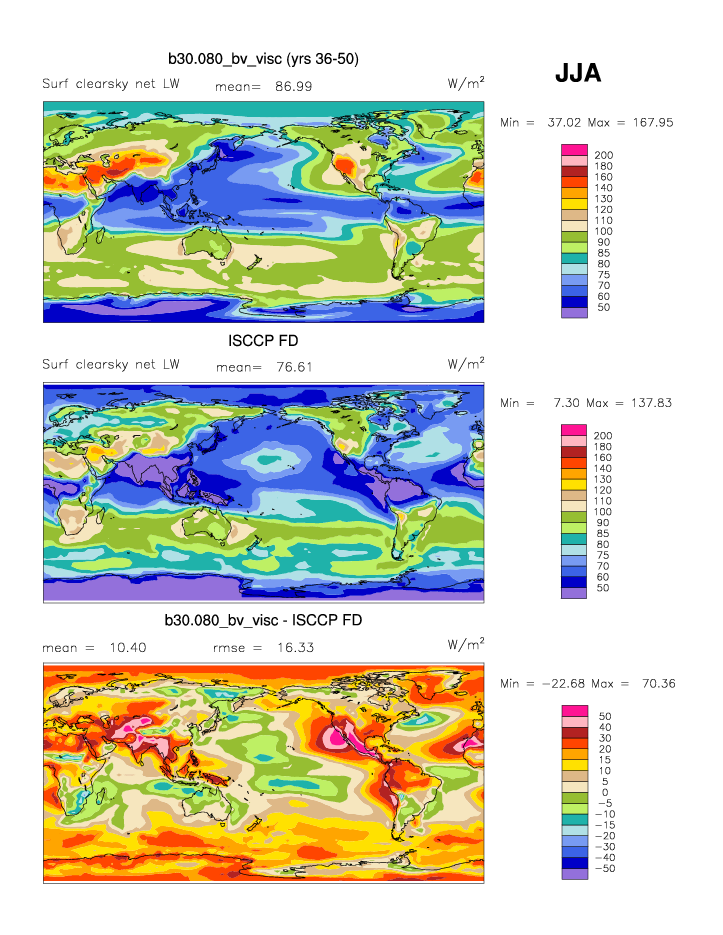
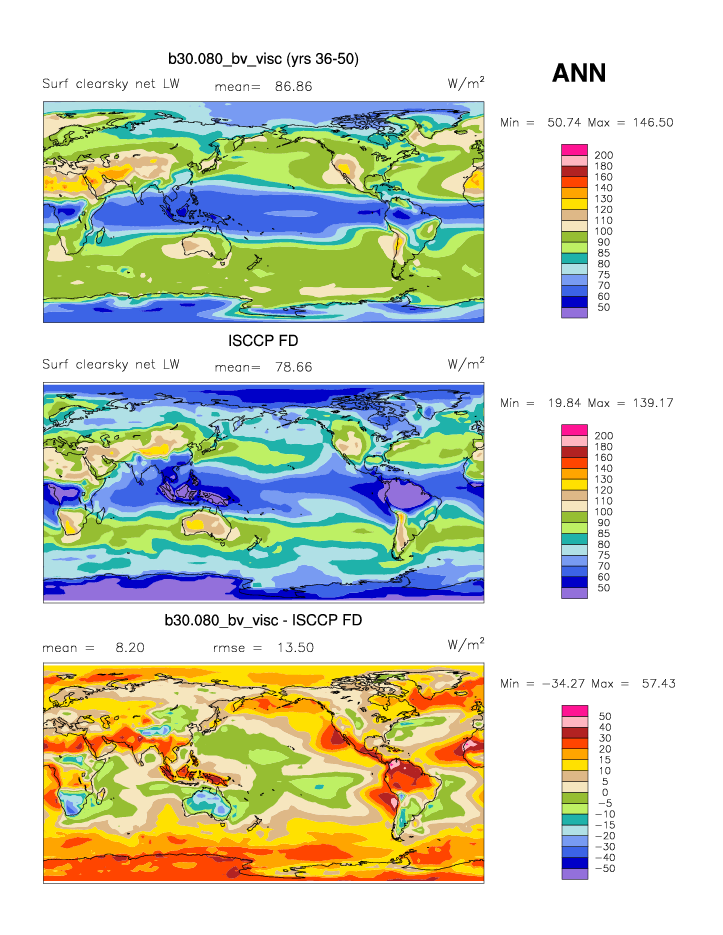
| FLNS | Surf Net LW flux | plot | plot | plot |
| FLNSC | Clearsky Surf Net LW flux | plot | plot | plot |
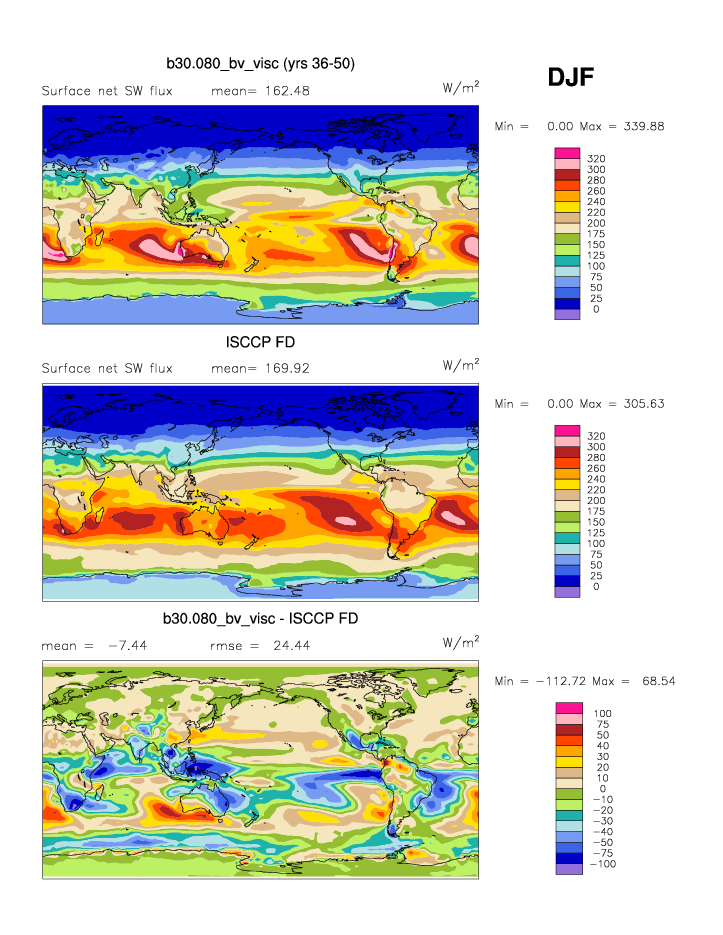
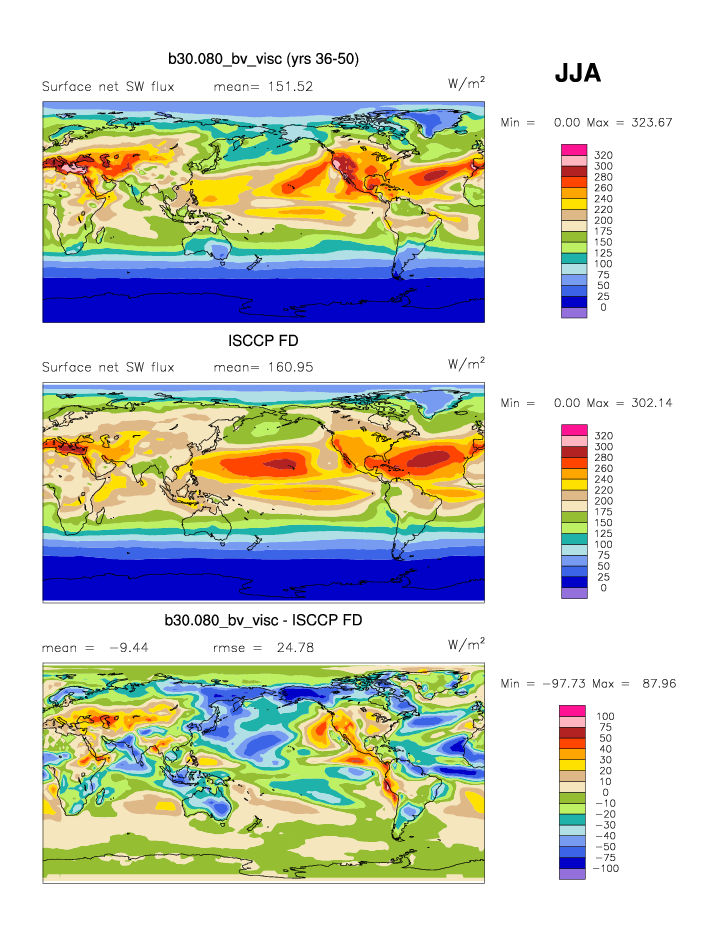
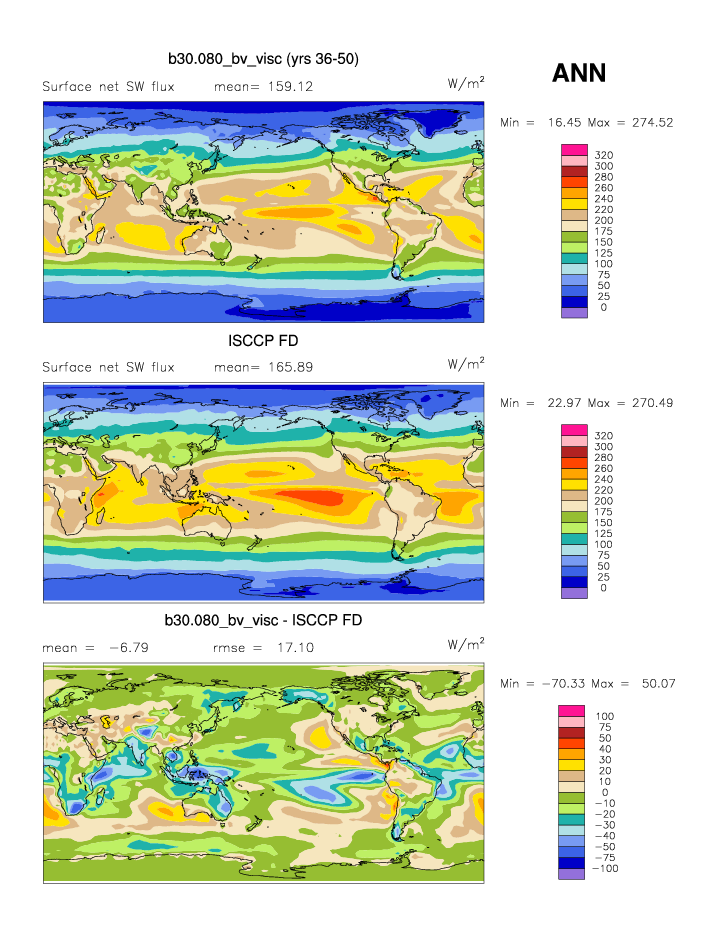
| FSNS | Surf Net SW flux | plot | plot | plot |
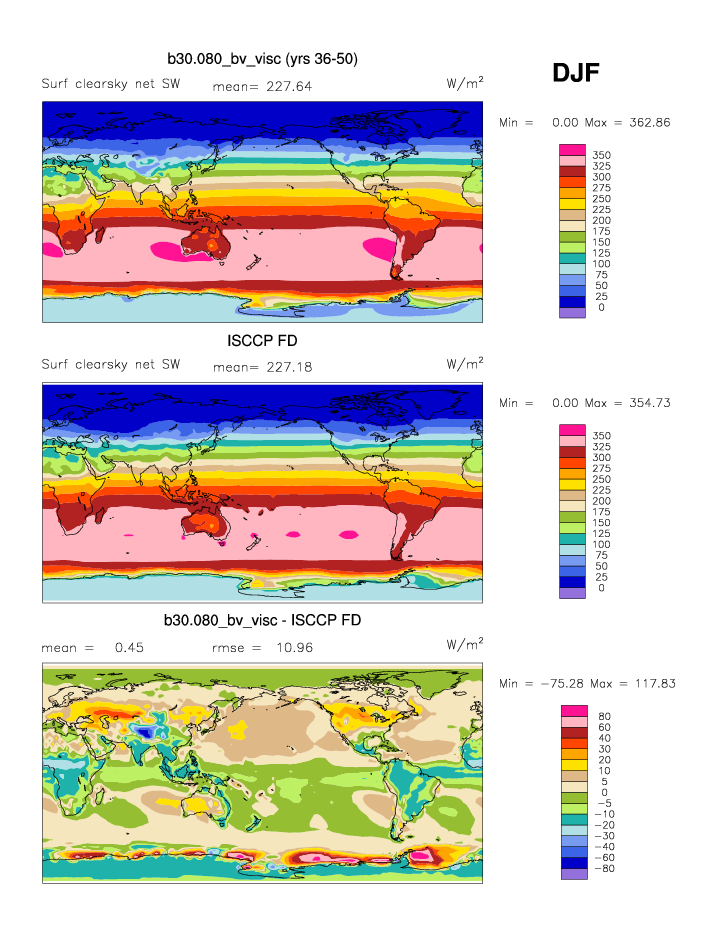
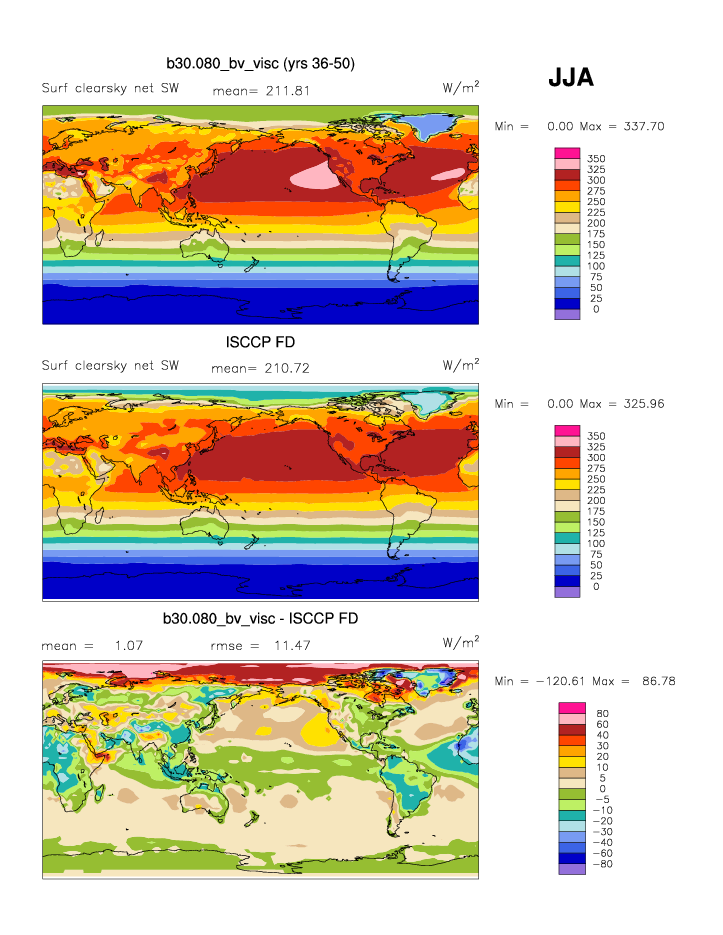
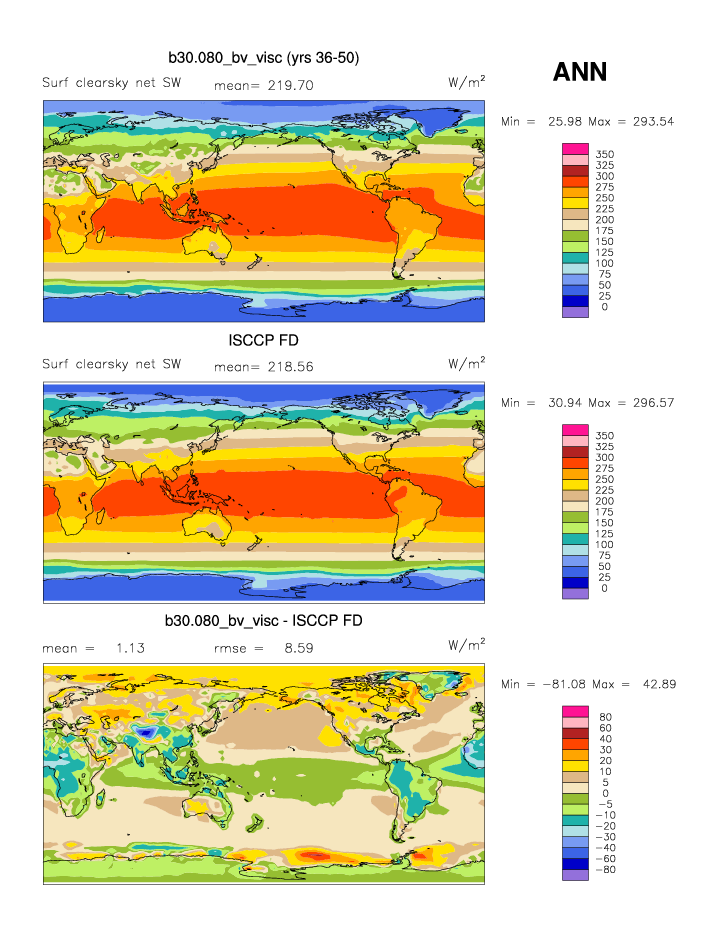
| FSNSC | Clearsky Surf Net SW flux | plot | plot | plot |
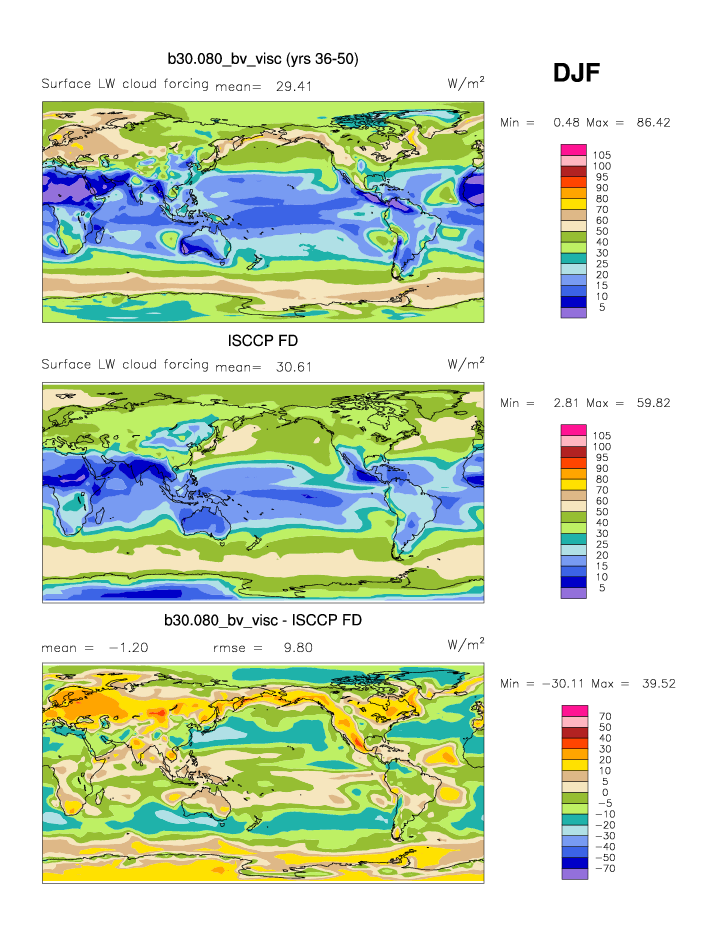
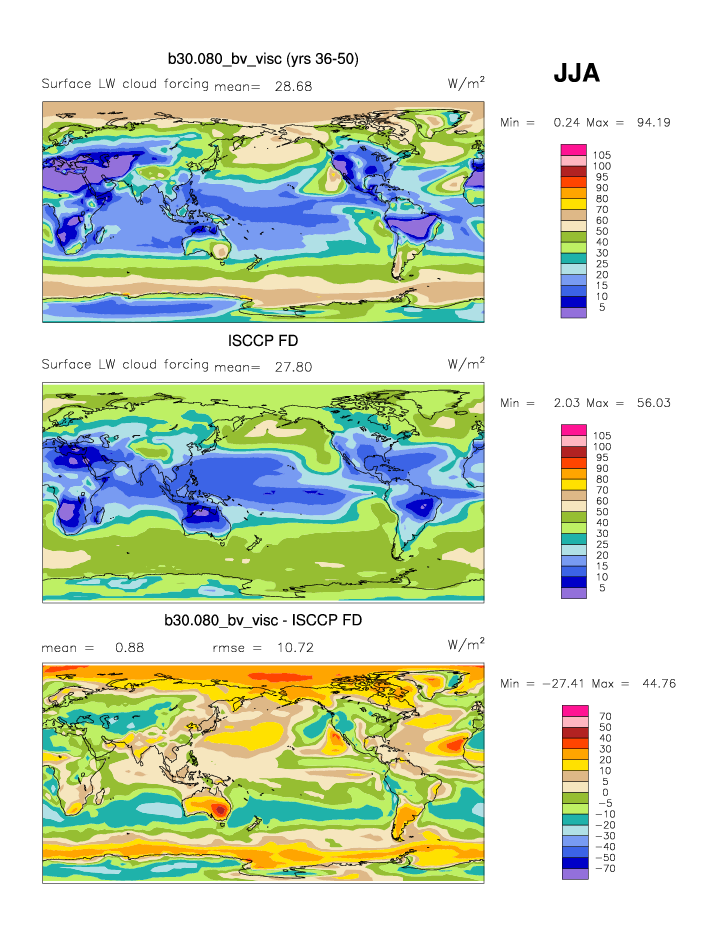
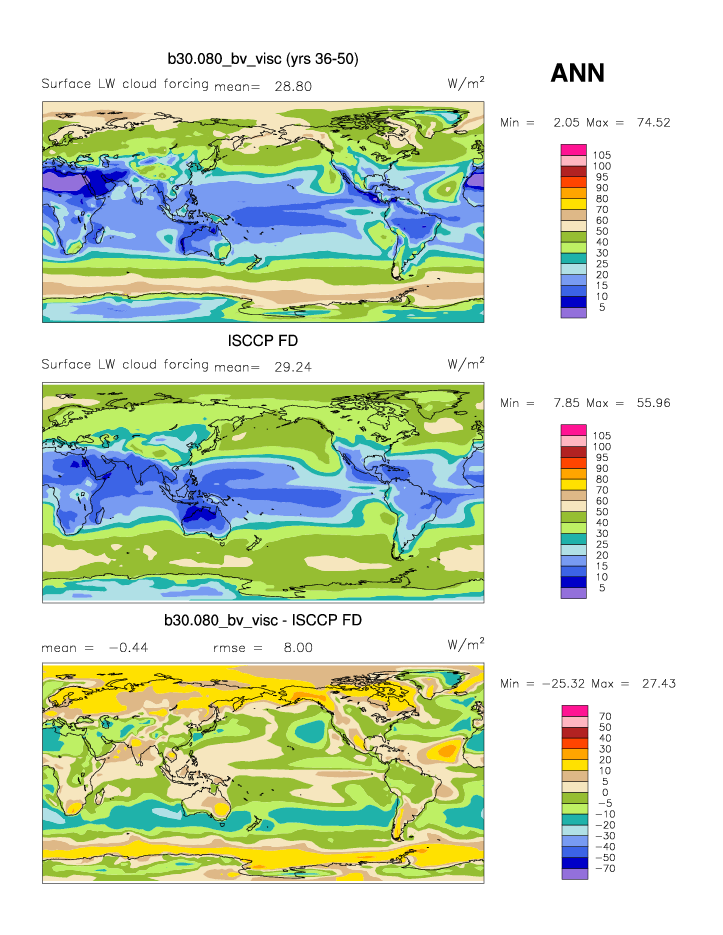
| LWCFSRF | Surf LW cloud forcing | plot | plot | plot |
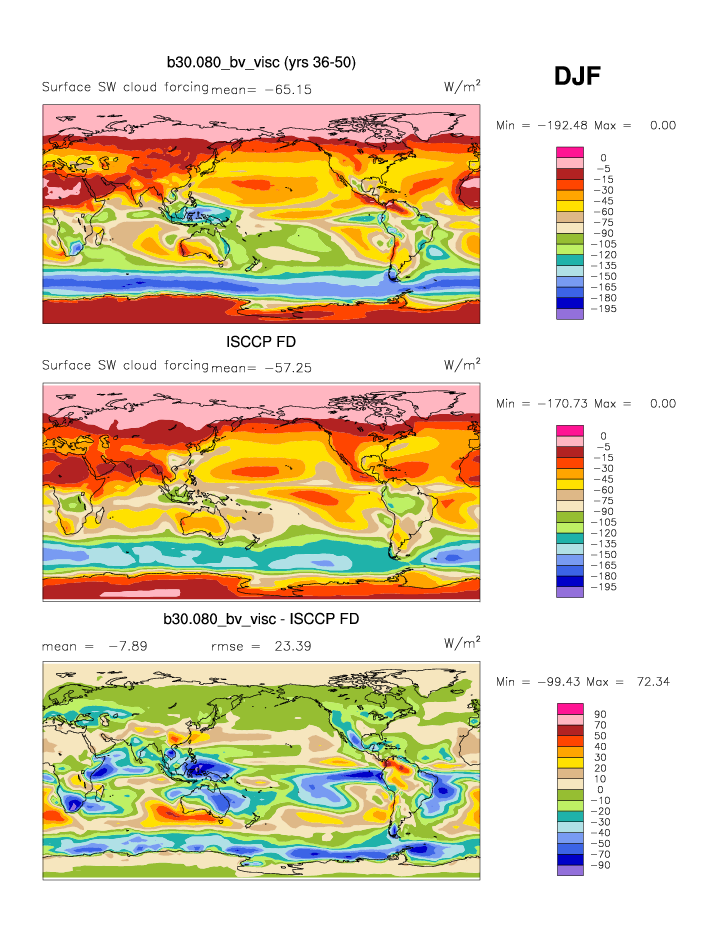
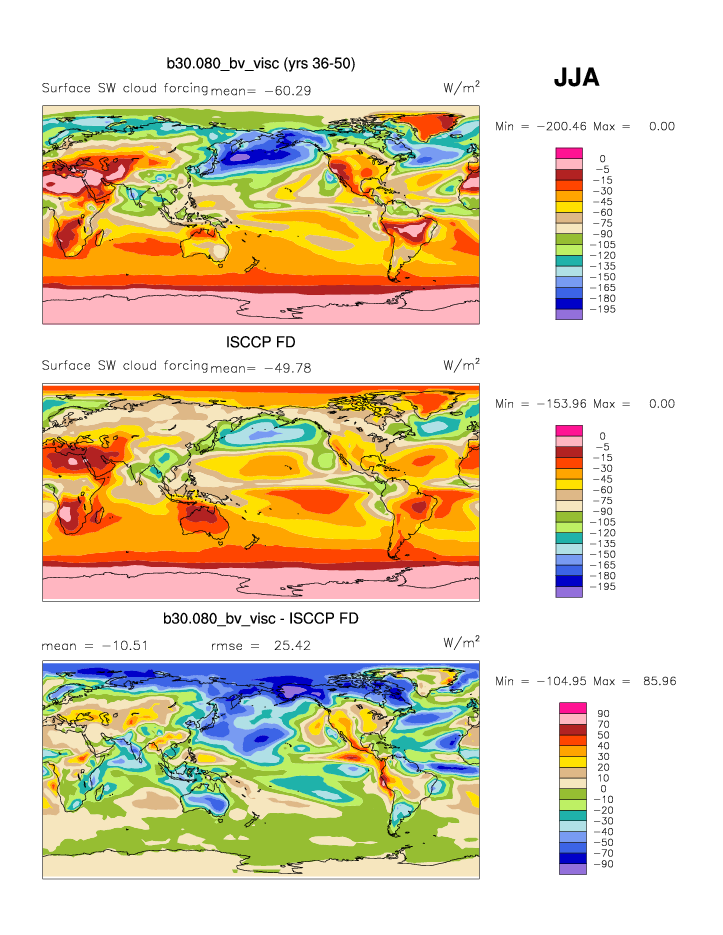
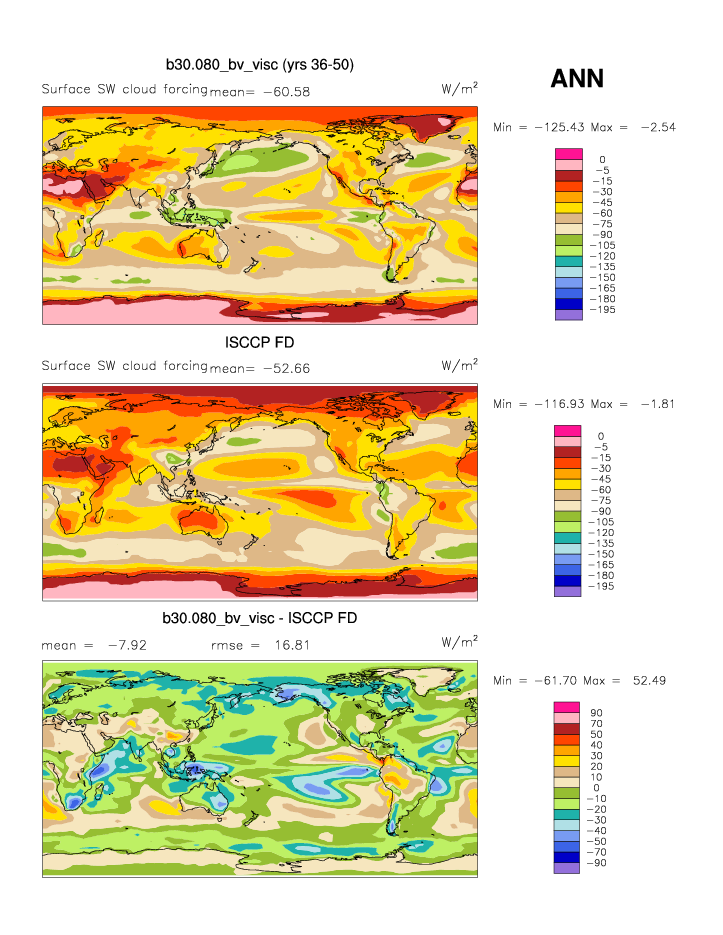
| SWCFSRF | Surf SW cloud forcing | plot | plot | plot |
| ISCCP D2 1983-2001 | DJF | JJA | ANN | |
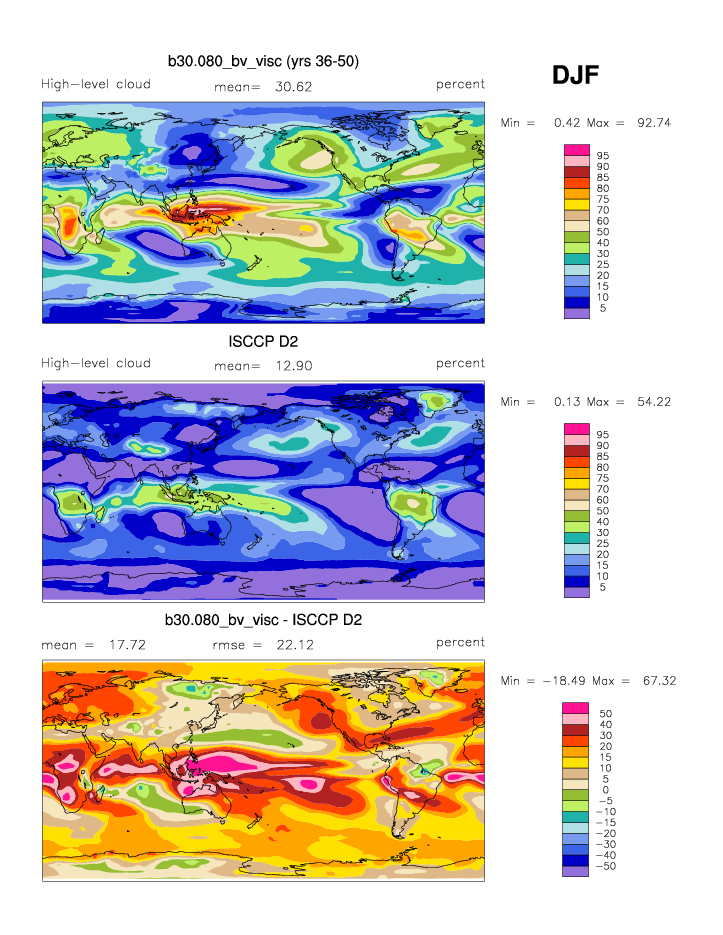
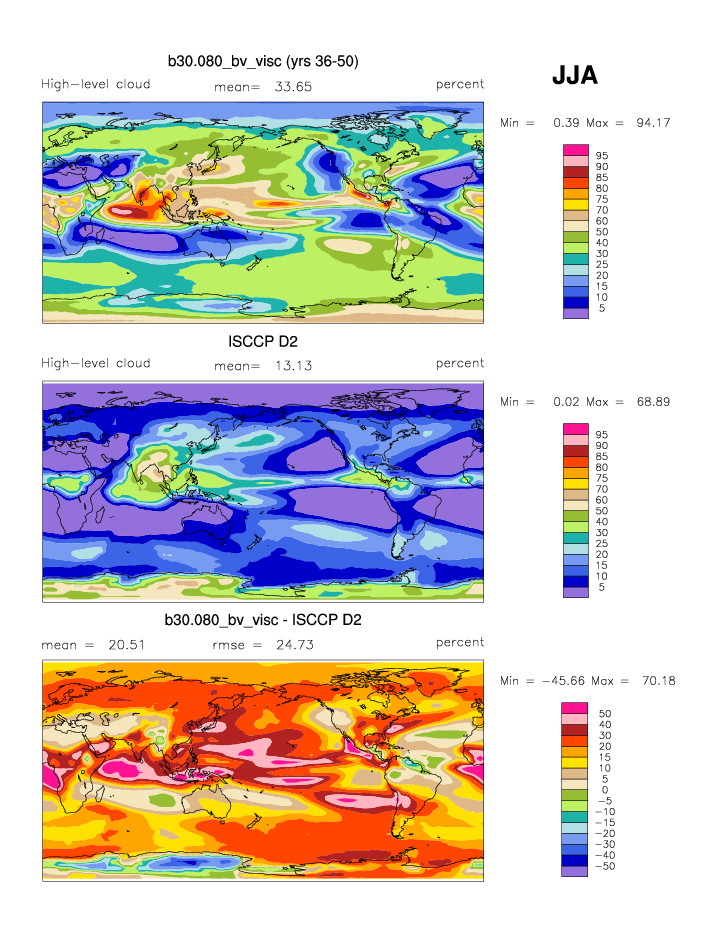
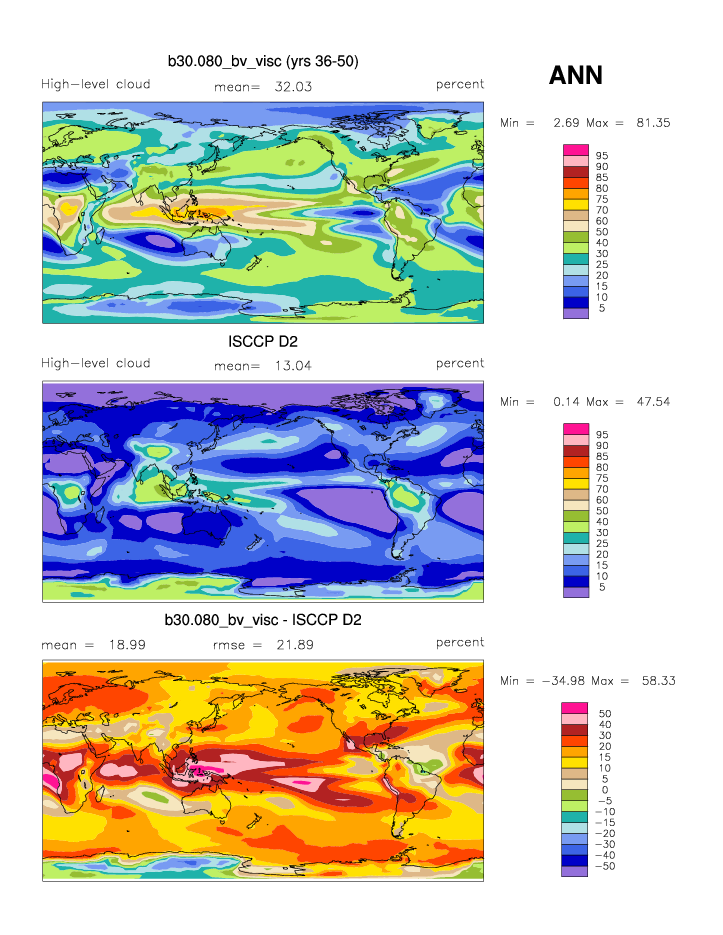
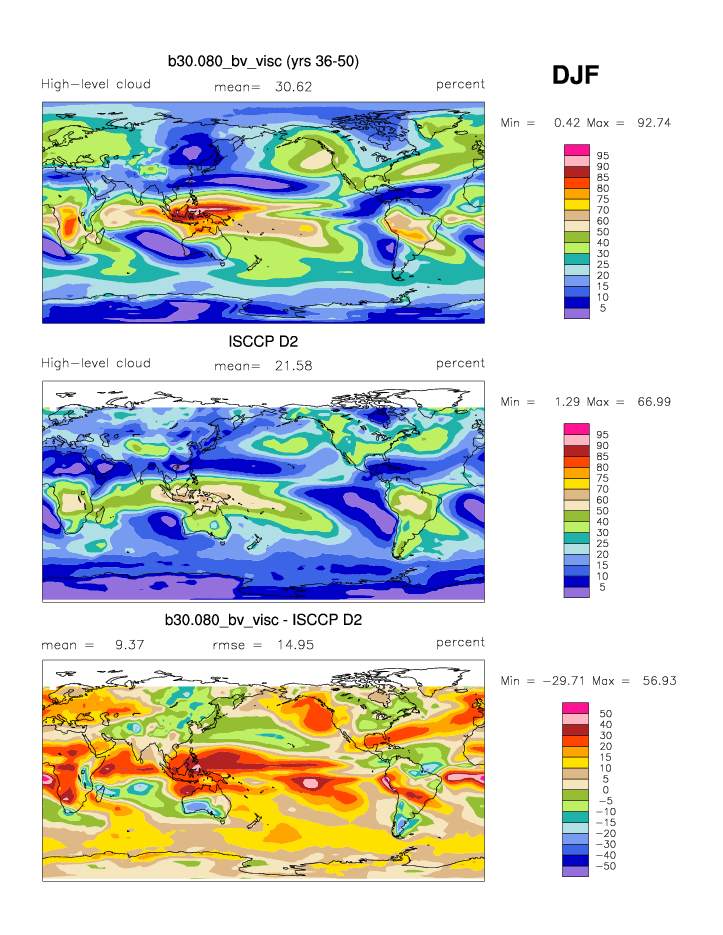
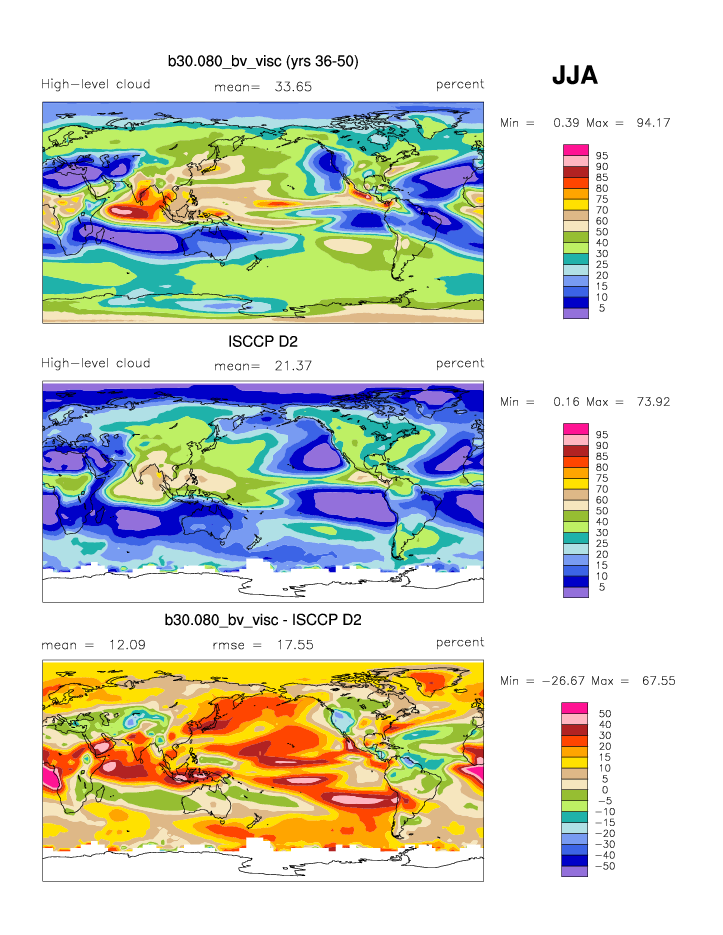
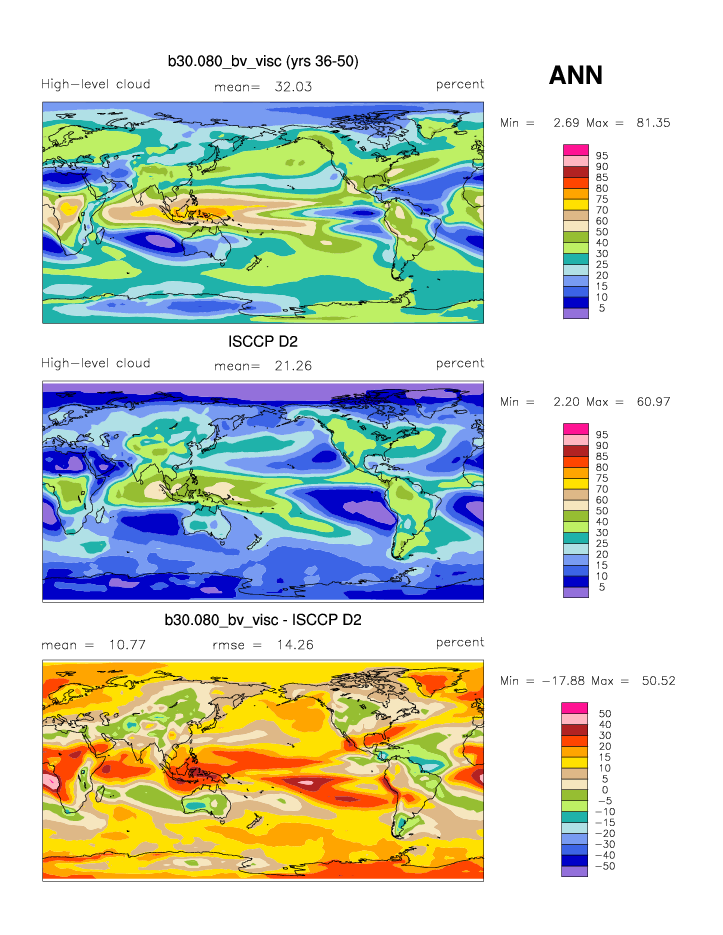
| CLDHGH (IR clouds) | High cloud amount | plot | plot | plot |
| CLDHGH (VIS/IR/NIR clouds) | High cloud amount | plot | plot | plot |
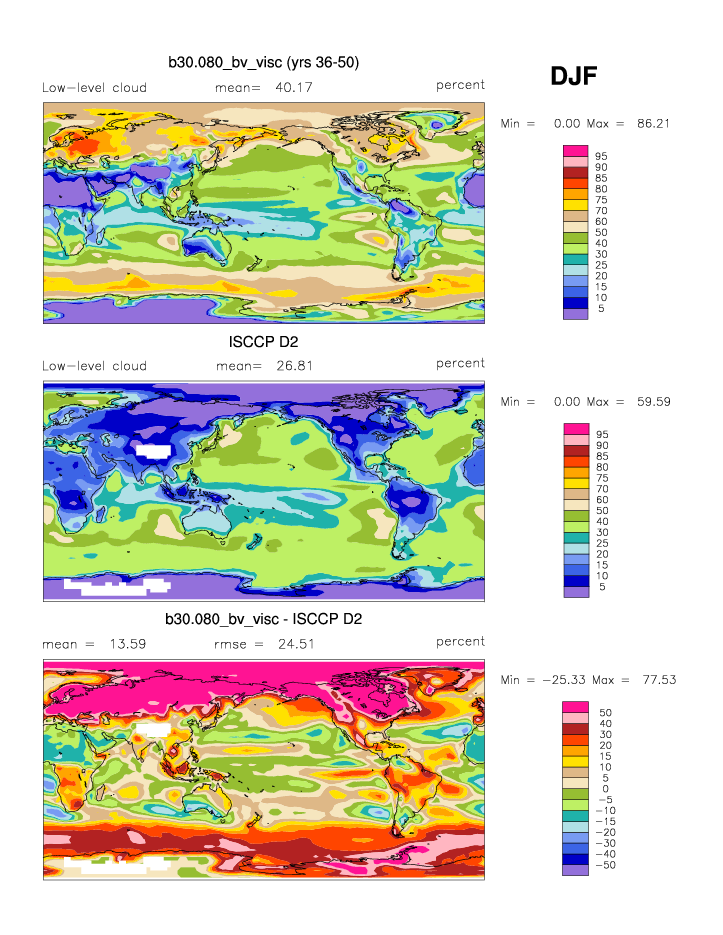
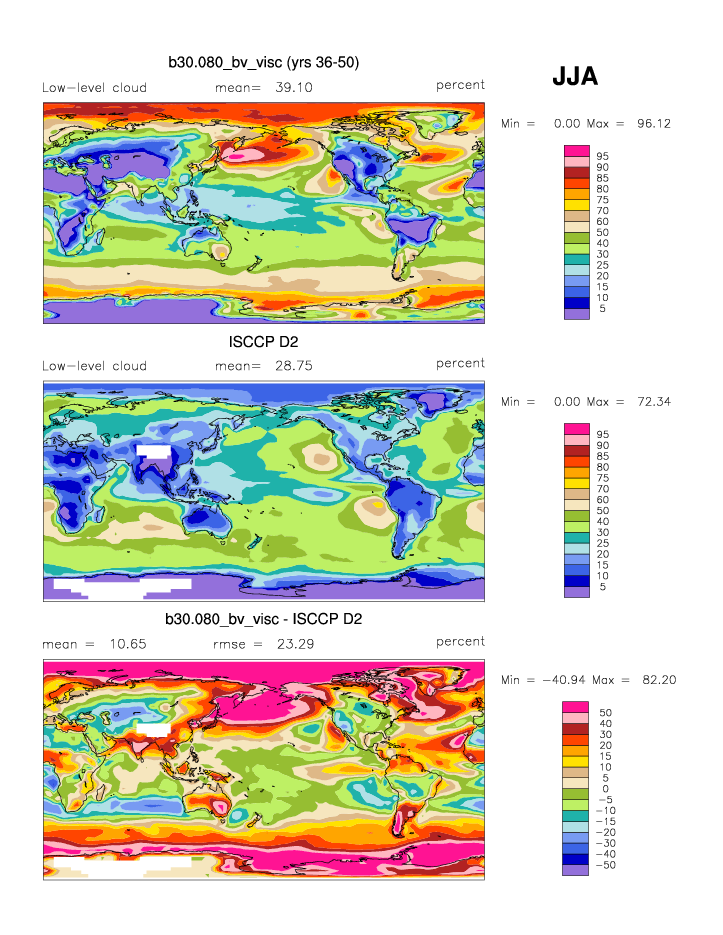
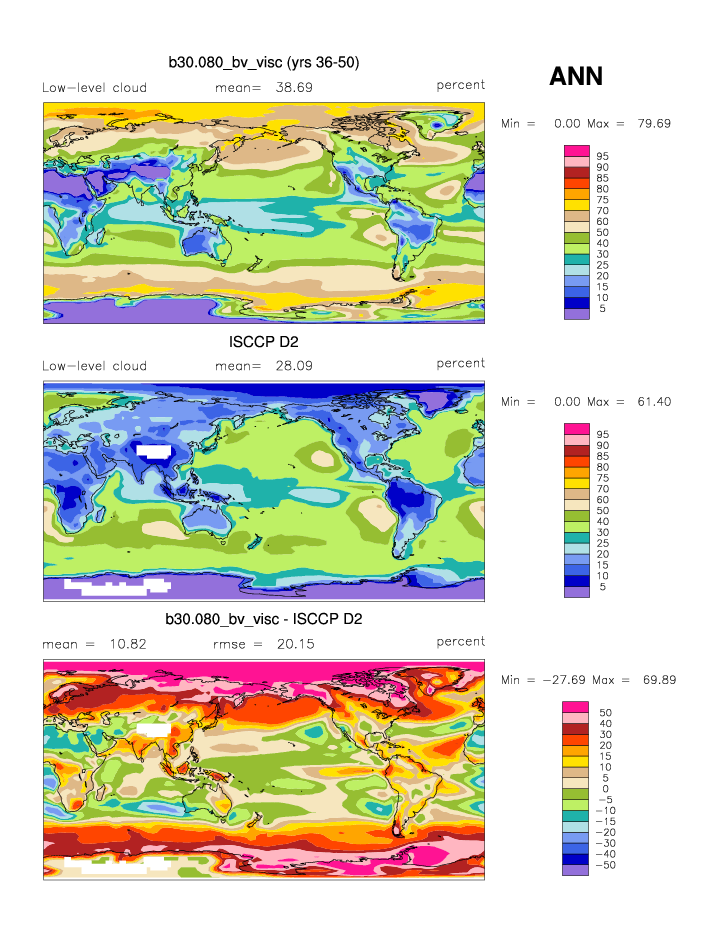
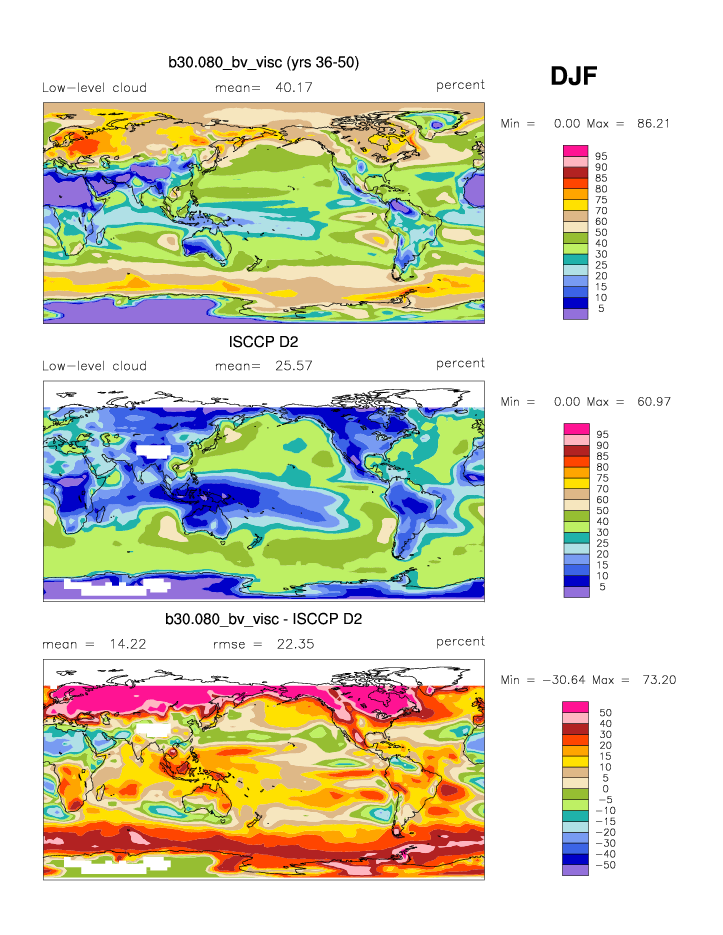
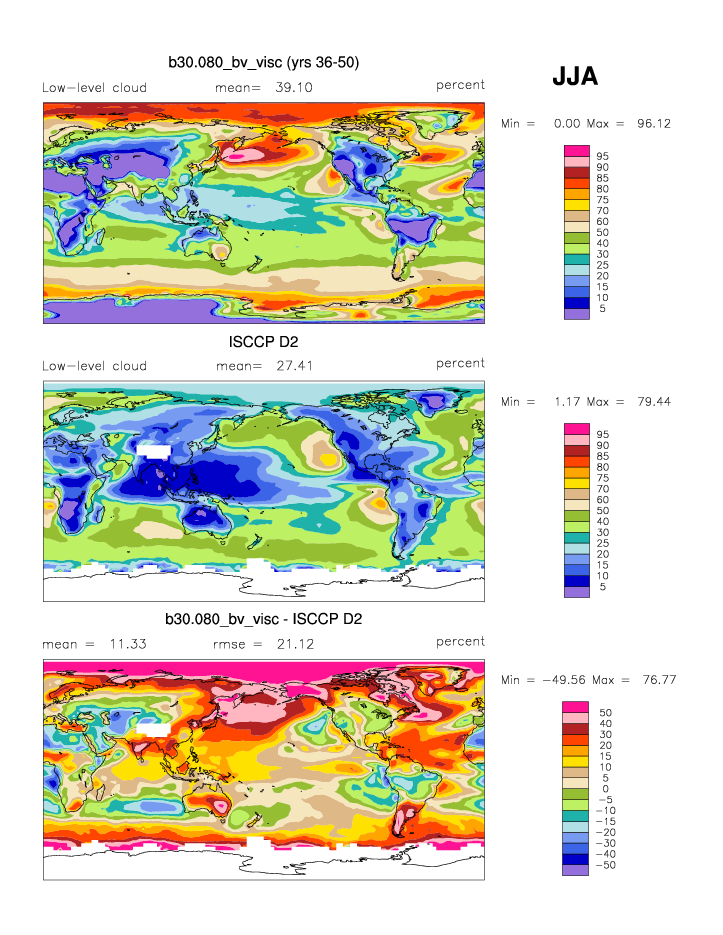
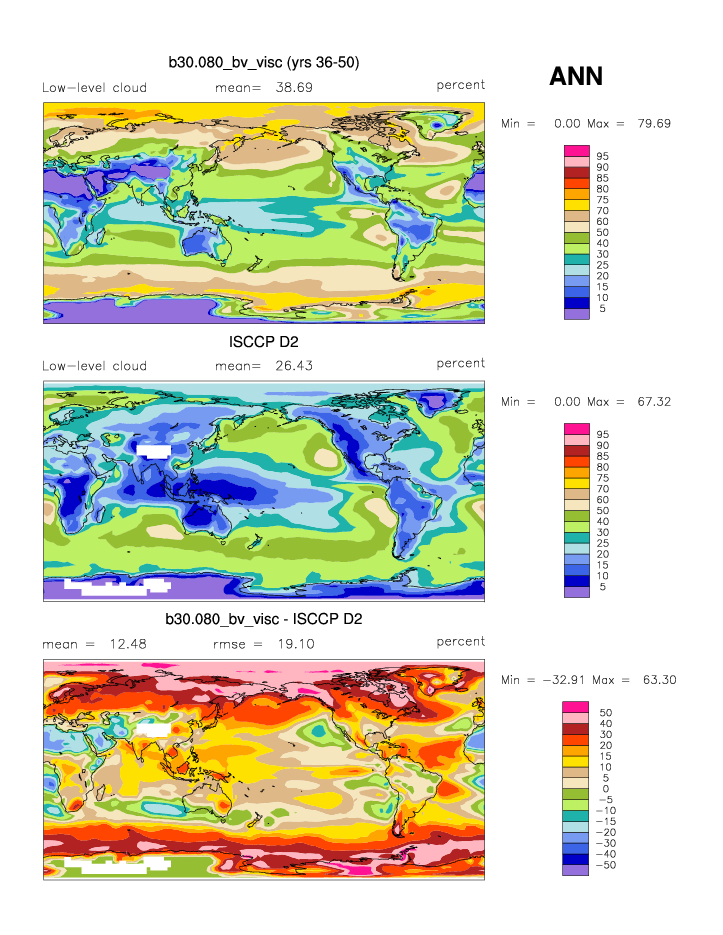
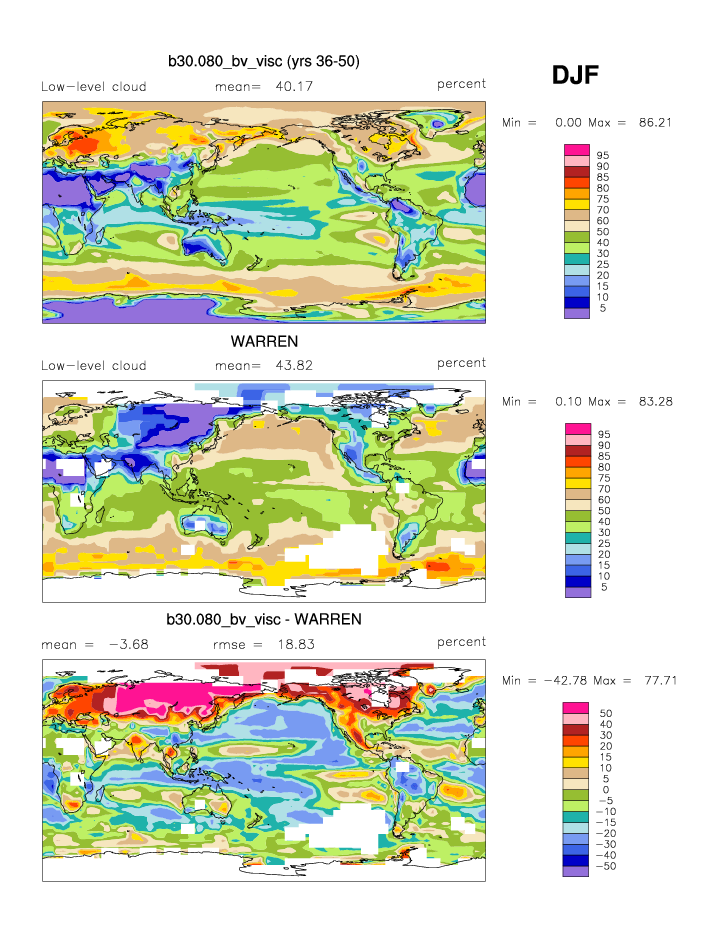
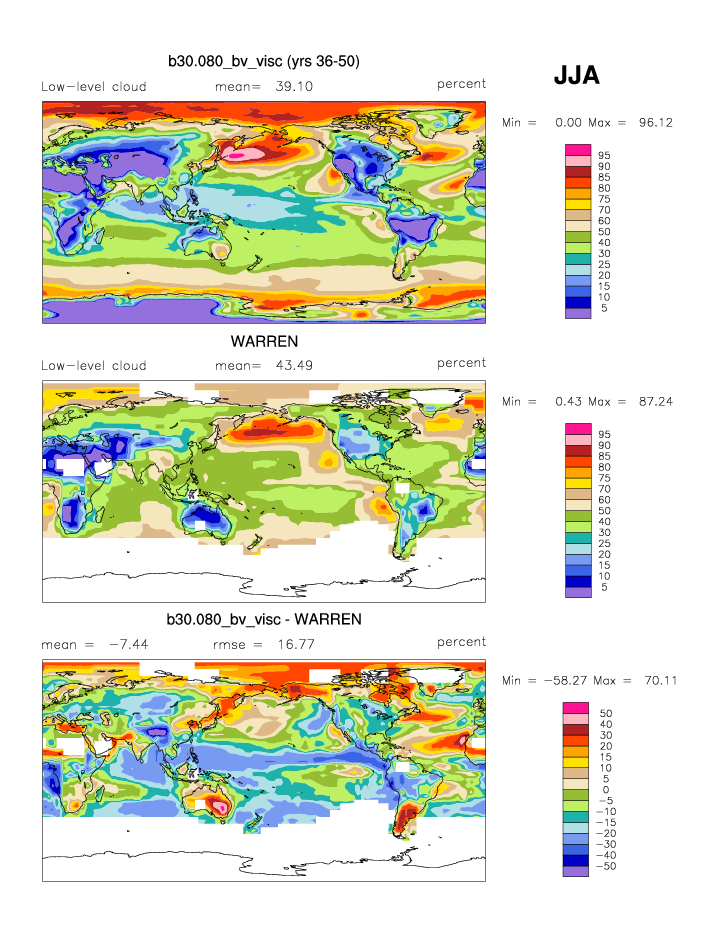
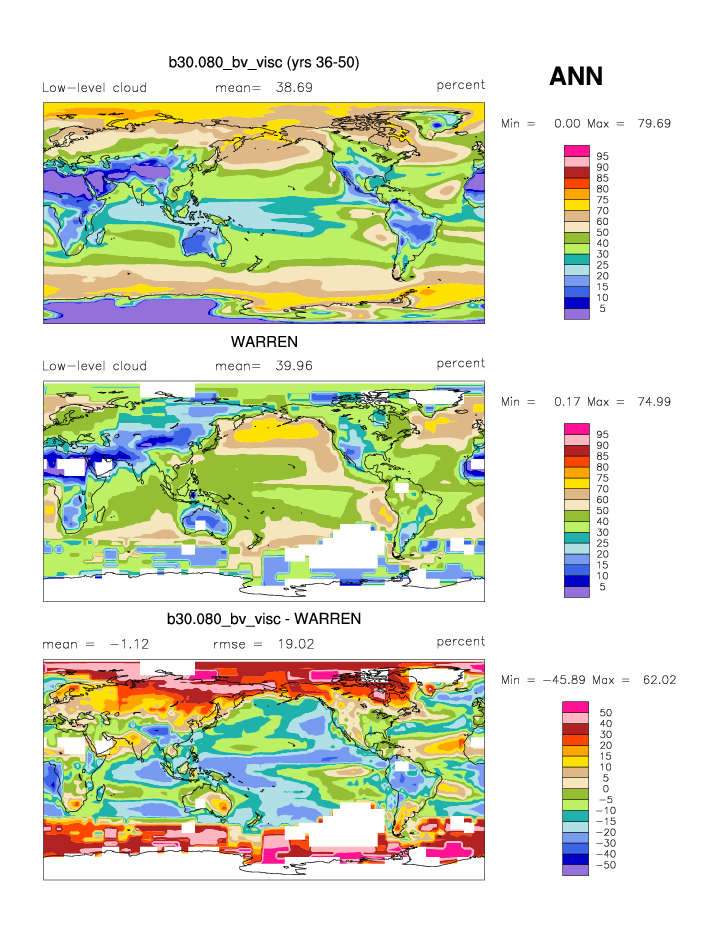
| CLDLOW (IR clouds) | Low cloud amount | plot | plot | plot |
| CLDLOW (VIS/IR/NIR clouds) | Low cloud amount | plot | plot | plot |
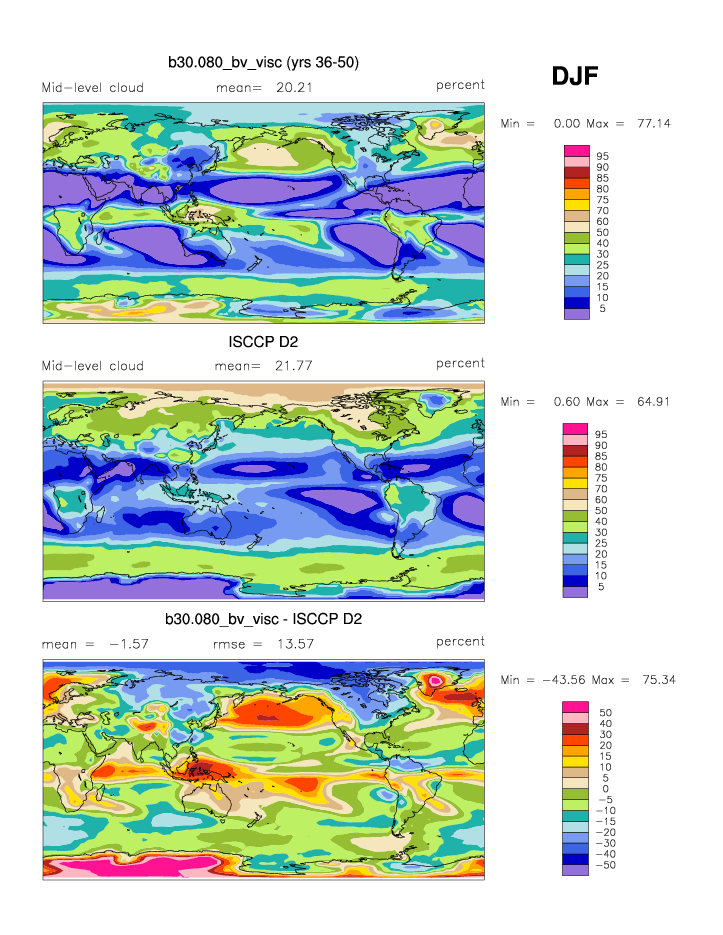
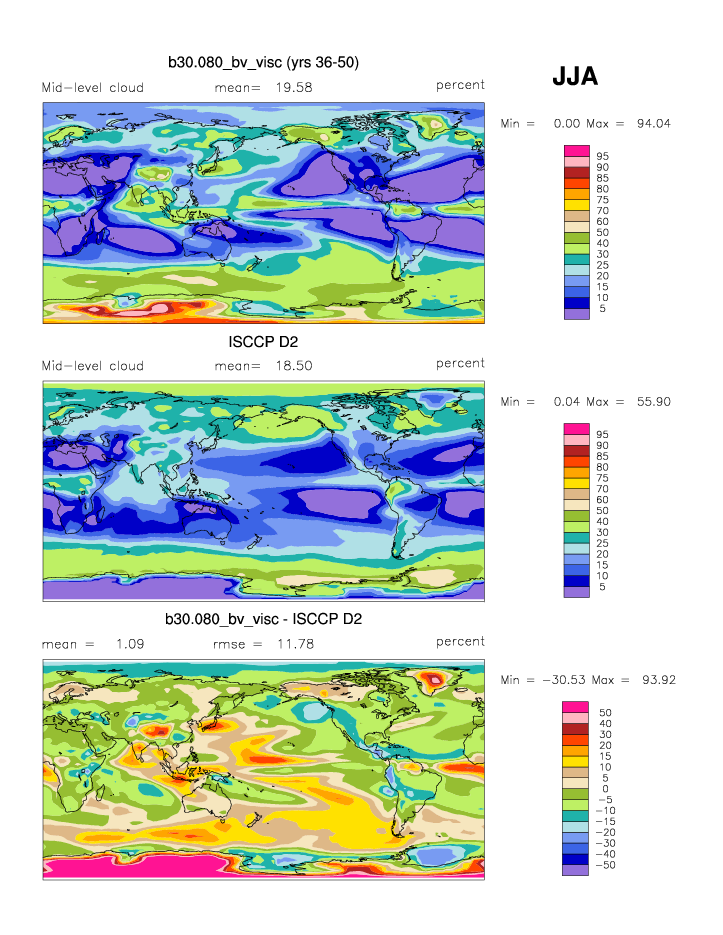
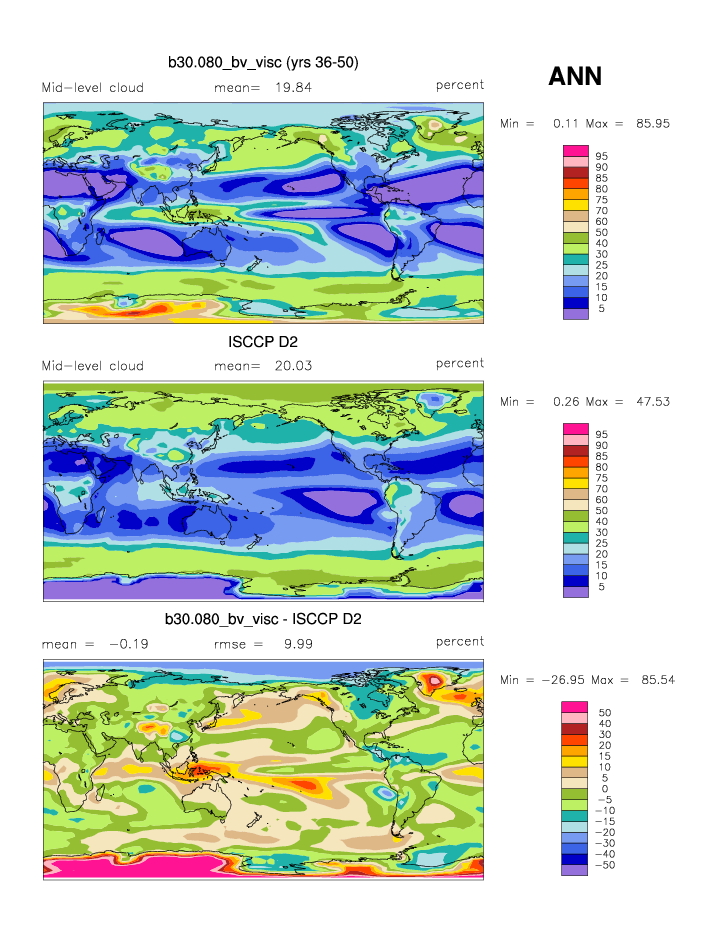
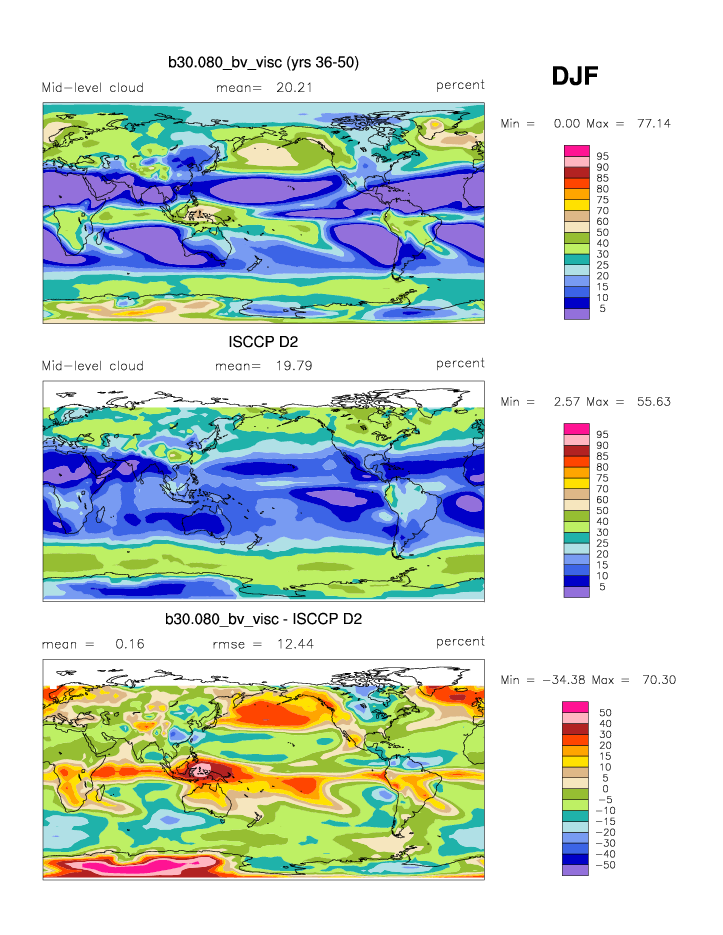
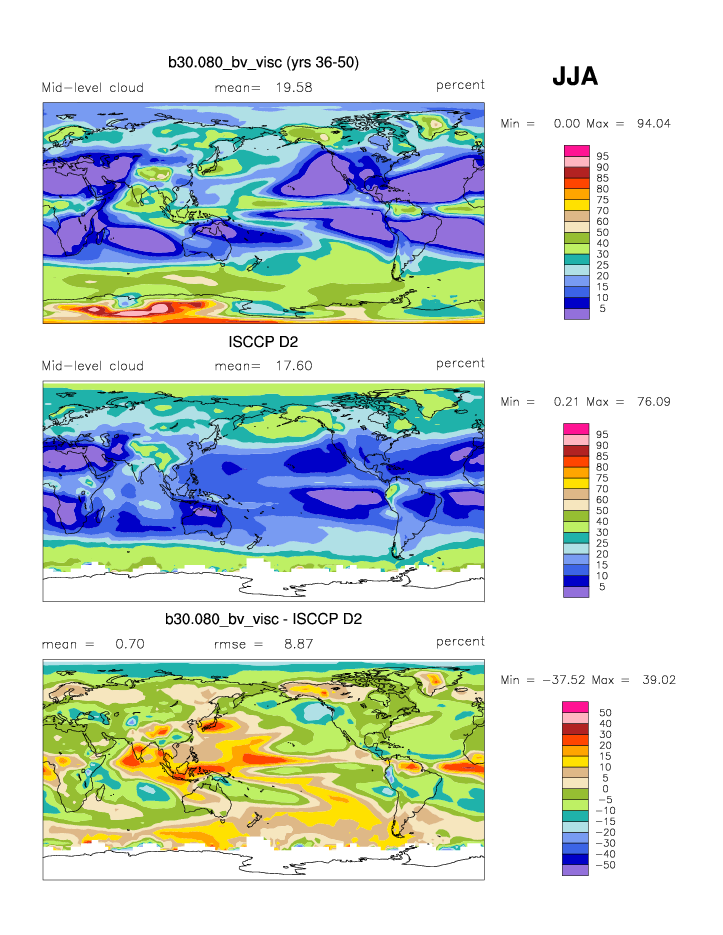
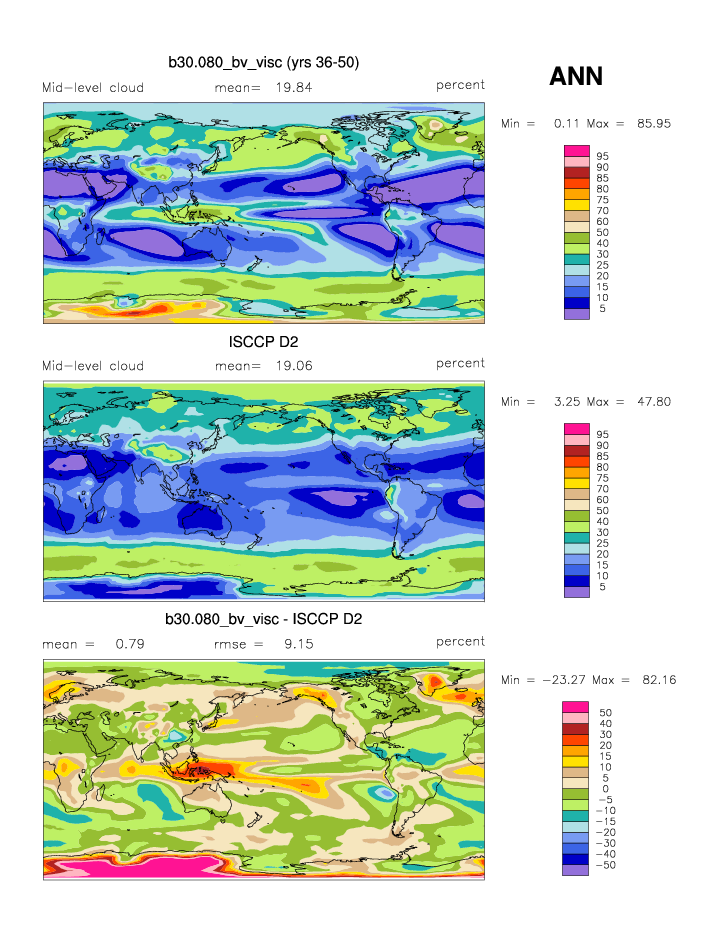
| CLDMED (IR clouds) | Mid cloud amount | plot | plot | plot |
| CLDMED (VIS/IR/NIR clouds) | Mid cloud amount | plot | plot | plot |
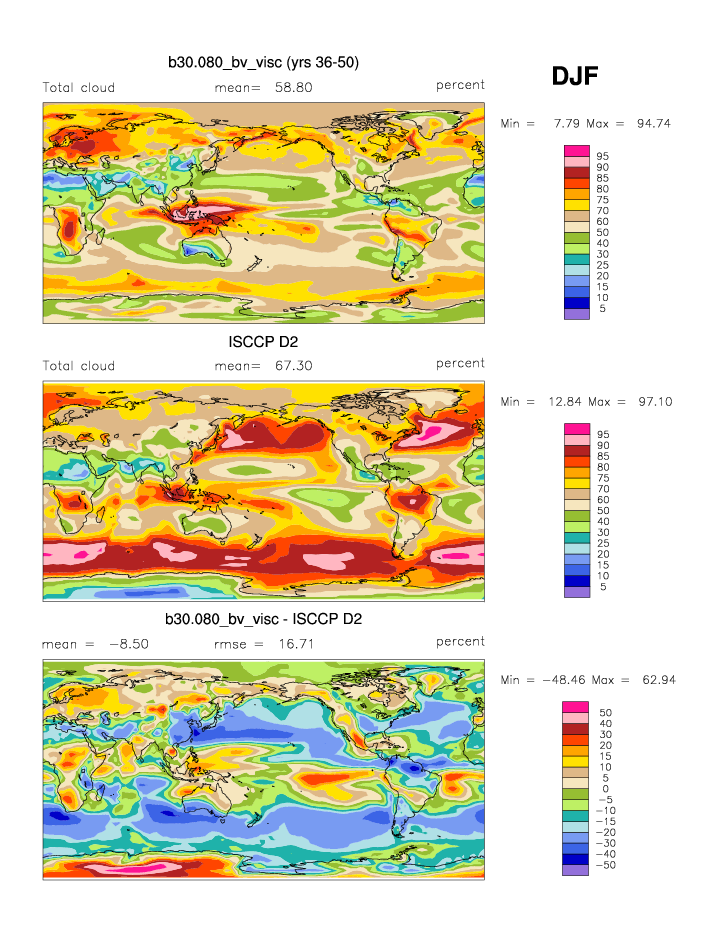
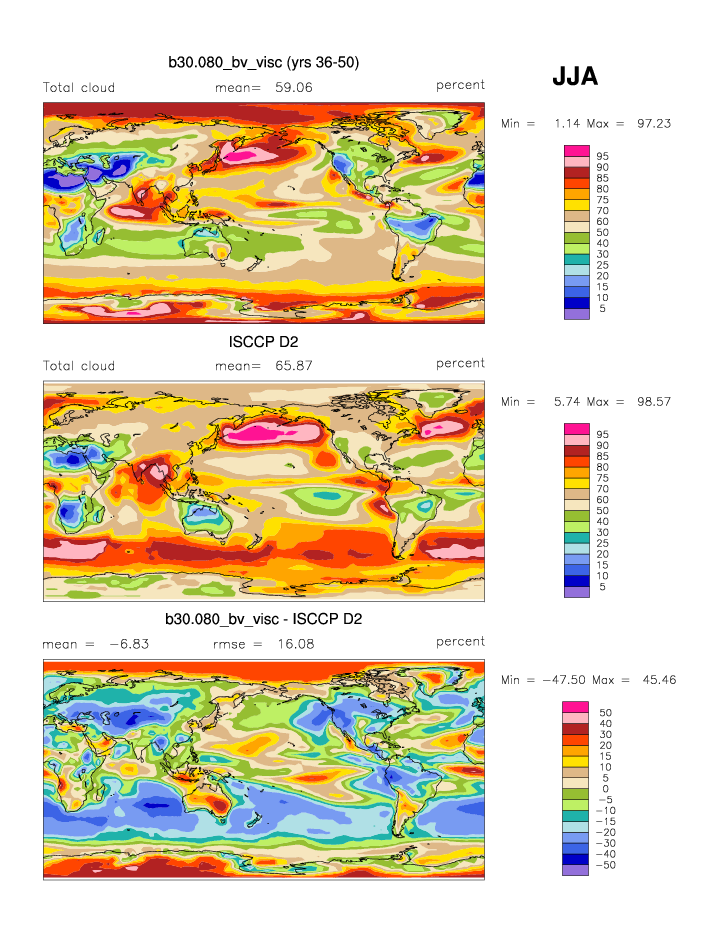
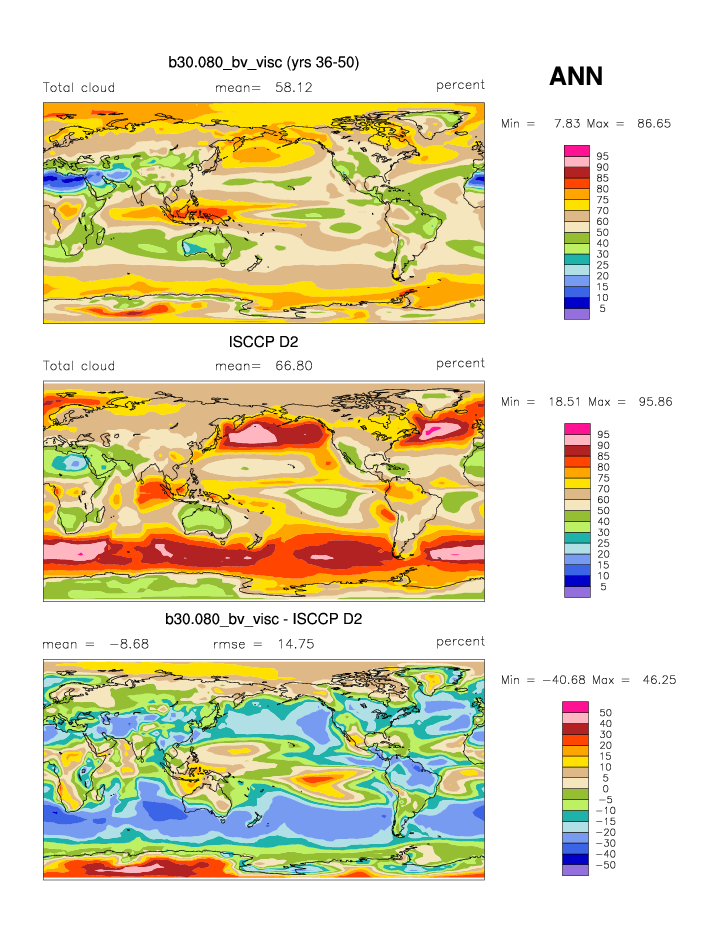
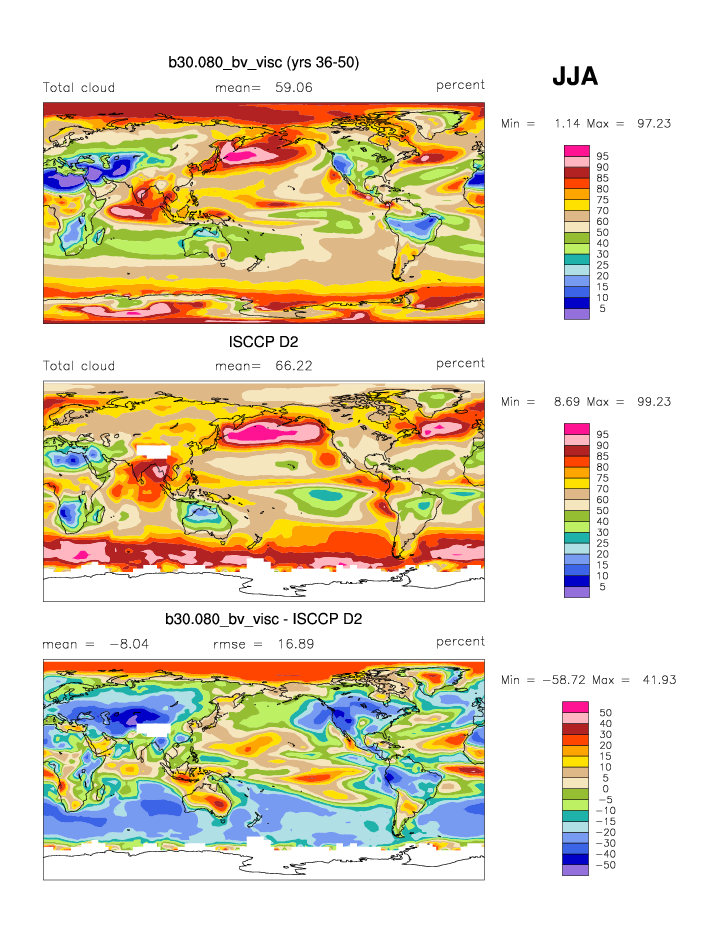
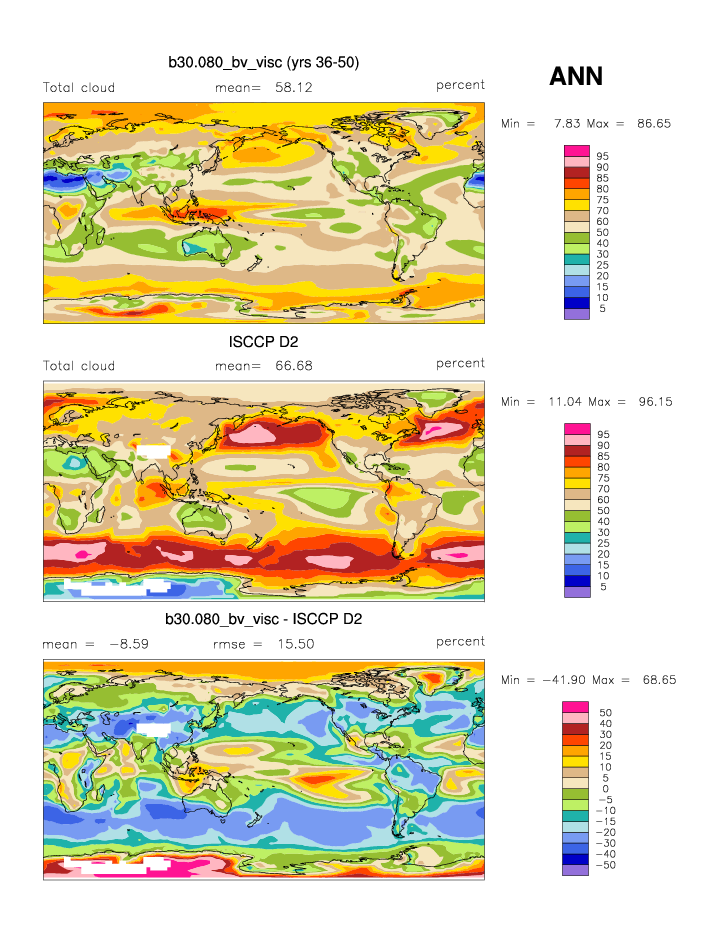
| CLDTOT (IR clouds) * | Total cloud amount | plot | plot | plot |
| CLDTOT (VIS/IR/NIR clouds) * | Total cloud amount | plot | plot | plot |
| ISCCP D1 Daytime Jul1983-Sep2001 | DJF | JJA | ANN | |
| MEANPTOP | Mean cloud top pressure | plot | plot | plot |
| MEANTTOP | Mean cloud top temperature | plot | plot | plot |
| MEANTAU | Mean cloud optical thickness | plot | plot | plot |
| TCLDAREA | Total cloud area | plot | plot | plot |
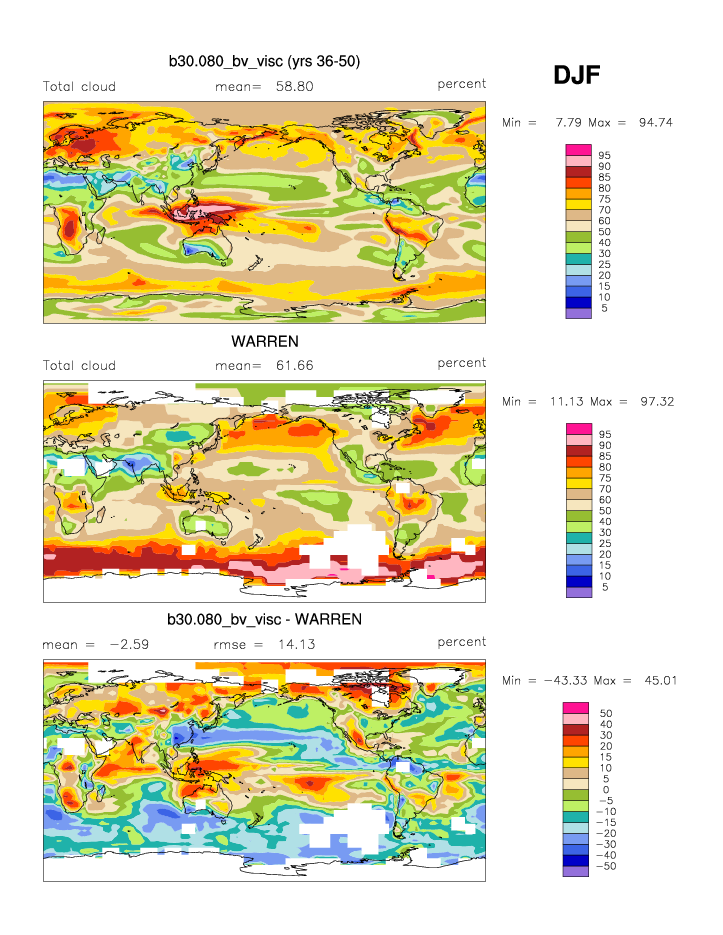
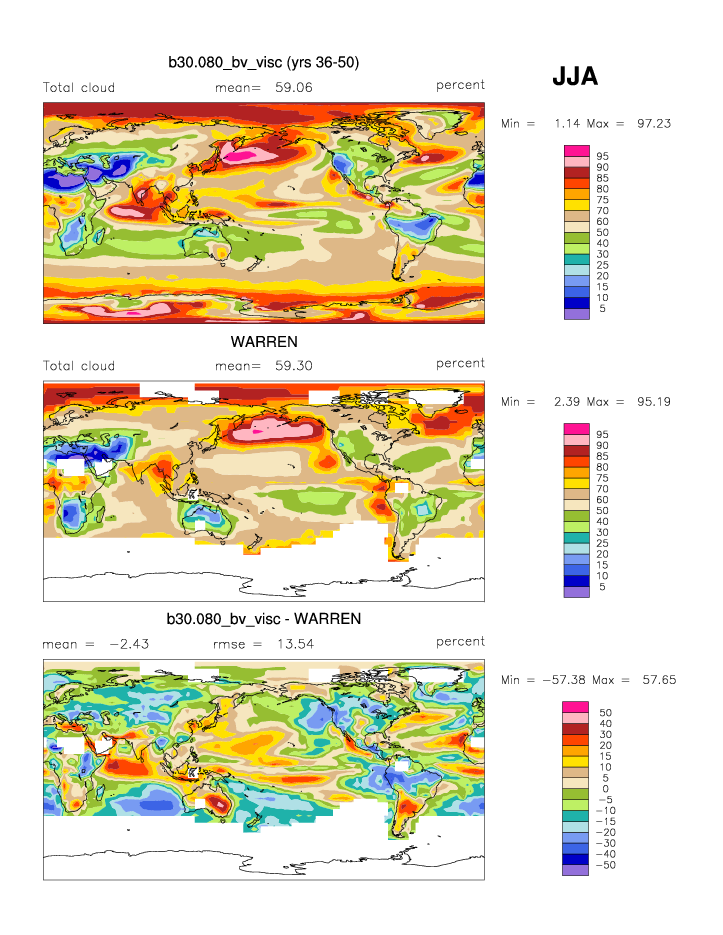
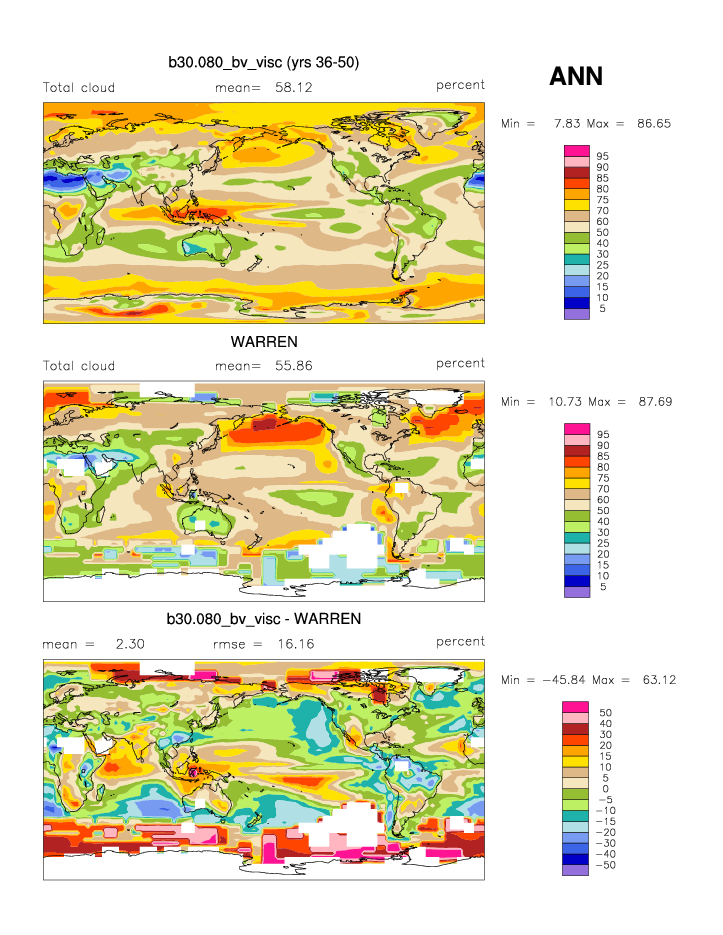
| Warren Cloud Surface OBS | DJF | JJA | ANN | |
| CLDLOW | Low cloud amount | plot | plot | plot |
| CLDTOT * | Total cloud amount | plot | plot | plot |