
| Mark's Master Webpage | AMWG Diagnostics Package |
|---|
| Set | Description |
|---|---|
| 1 | Tables of ANN, DJF, JJA, global and regional means and RMSE. |
| 2 | Line plots of annual implied northward transports. |
| 3 | Line plots of DJF, JJA and ANN zonal means |
| 4 | Vertical contour plots of DJF, JJA and ANN zonal means |
| 5 | Horizontal contour plots of DJF, JJA and ANN means |
| 6 | Horizontal vector plots of DJF, JJA and ANN means |
| 7 | Polar contour and vector plots of DJF, JJA and ANN means |
| 8 | Annual cycle contour plots of zonal means |
| 9 | Horizontal contour plots of DJF-JJA differences |
| 10 | Annual cycle line plots of global means |
| 11 | Pacific annual cycle, Scatter plot plots |
| 12 | Vertical profile plots from 17 selected stations |
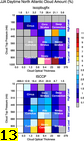
| 13 | ISCCP cloud simulator plots |
Click on Plot Type
|
|
|
|
|---|---|---|
|
|
|
|
|
|
|
|
|
|
|