 b.e21.B1850.f09_g17.CMIP6-DAMIP-hist-nat.002
and
OBS data (info)
b.e21.B1850.f09_g17.CMIP6-DAMIP-hist-nat.002
and
OBS data (info)
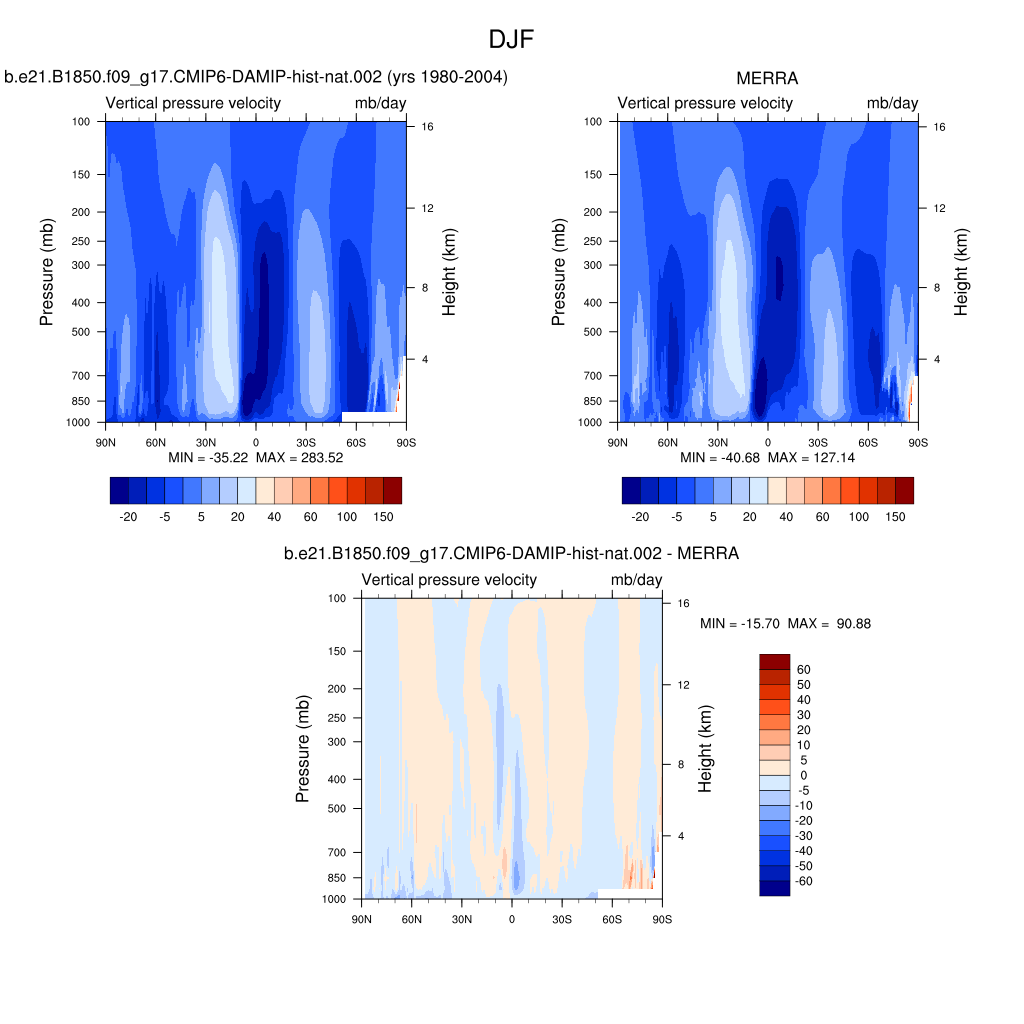
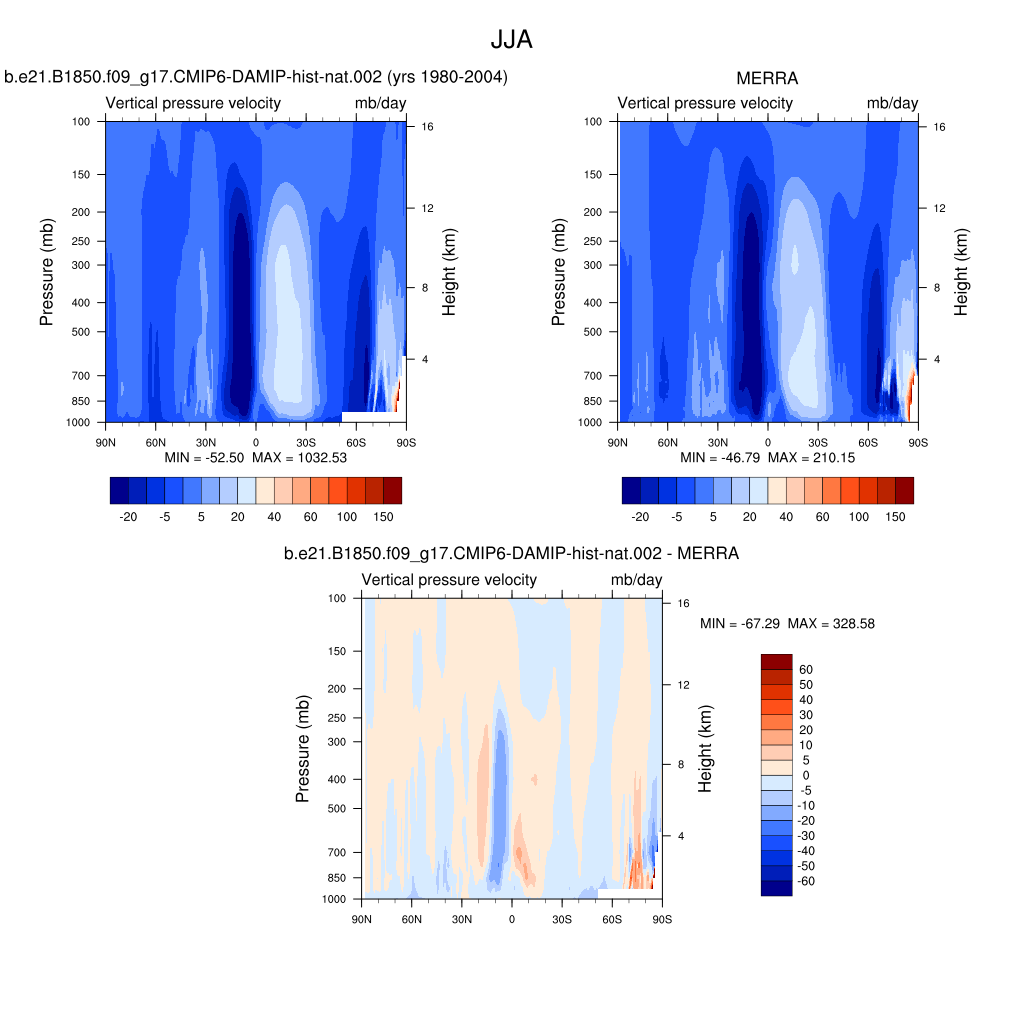
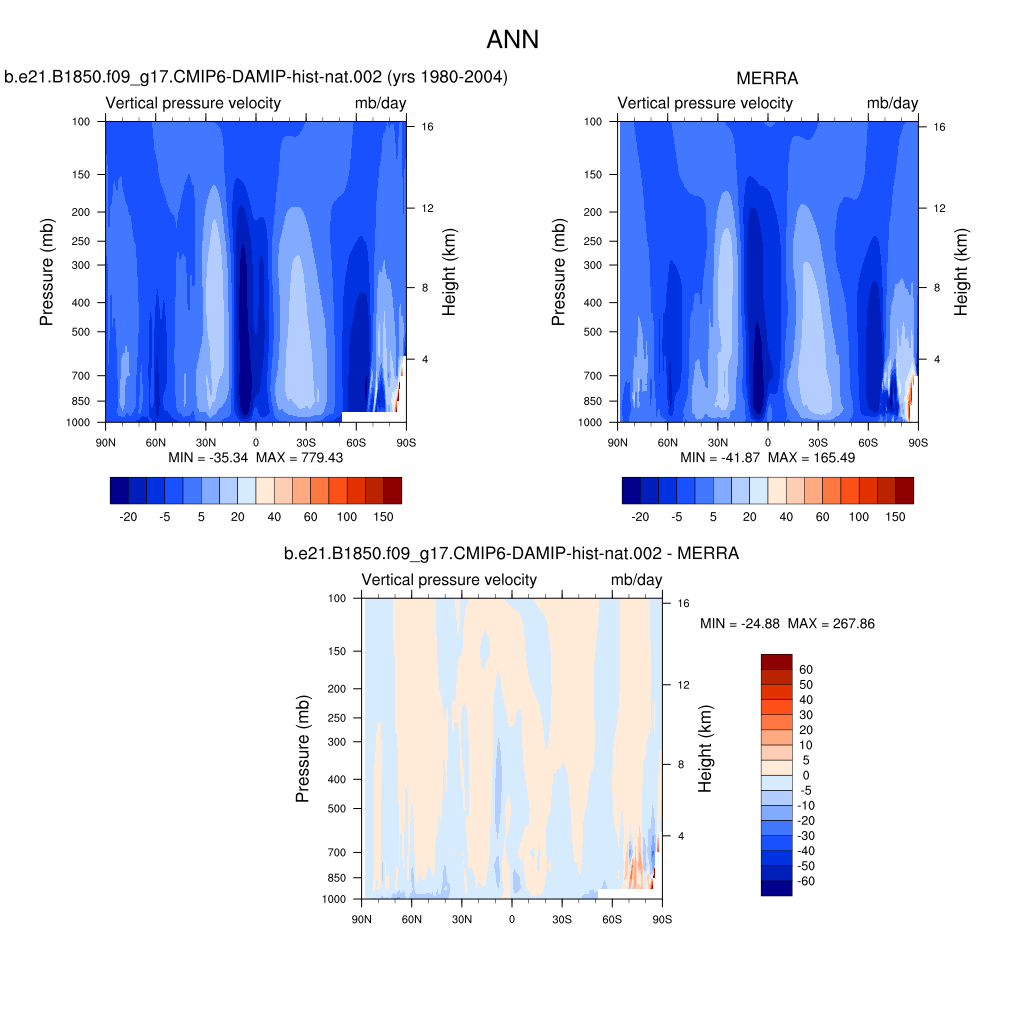
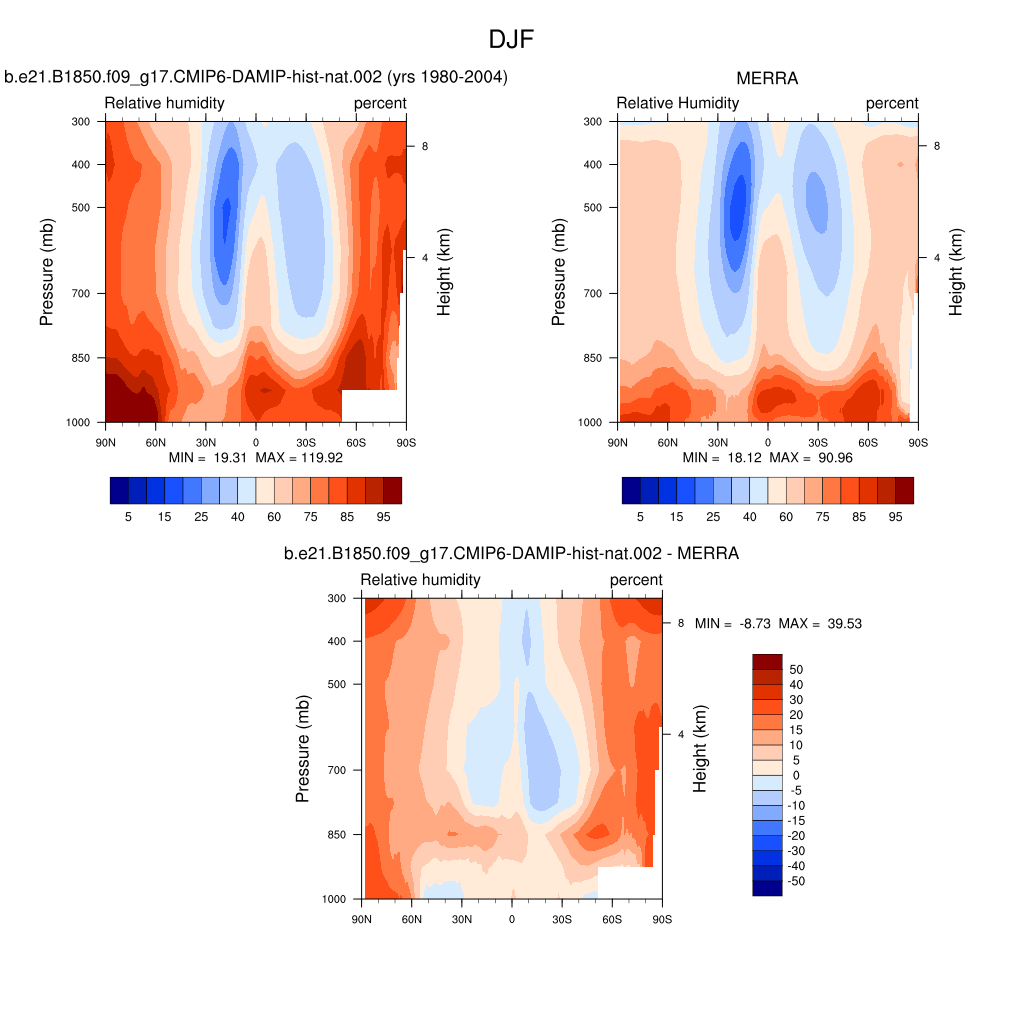
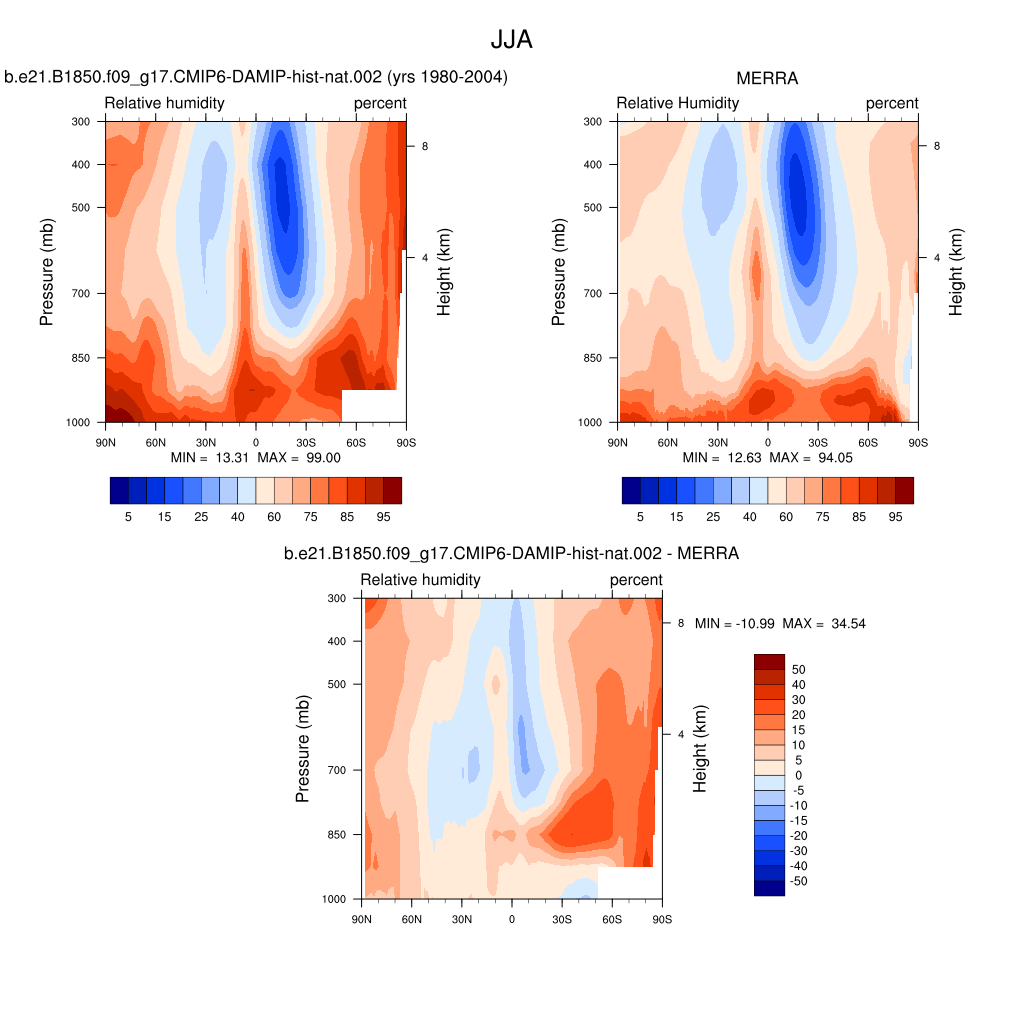
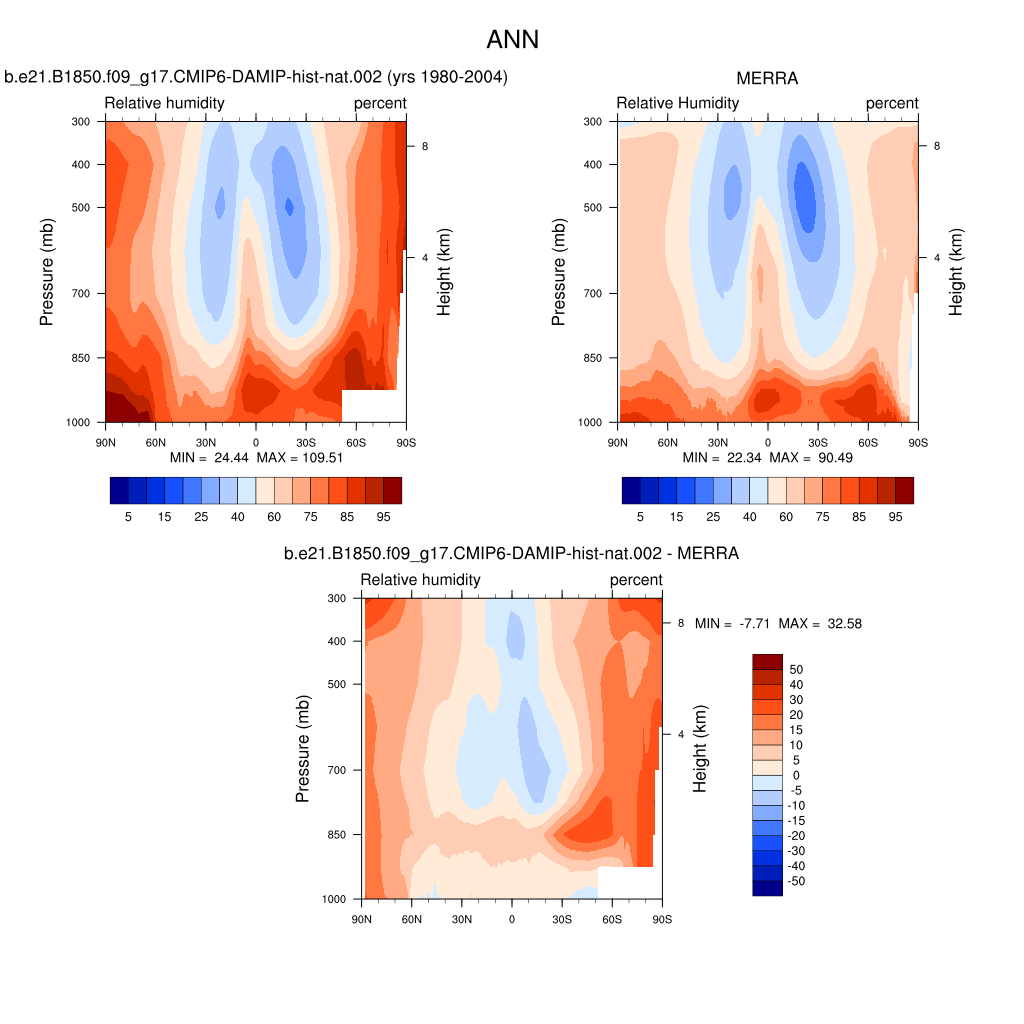
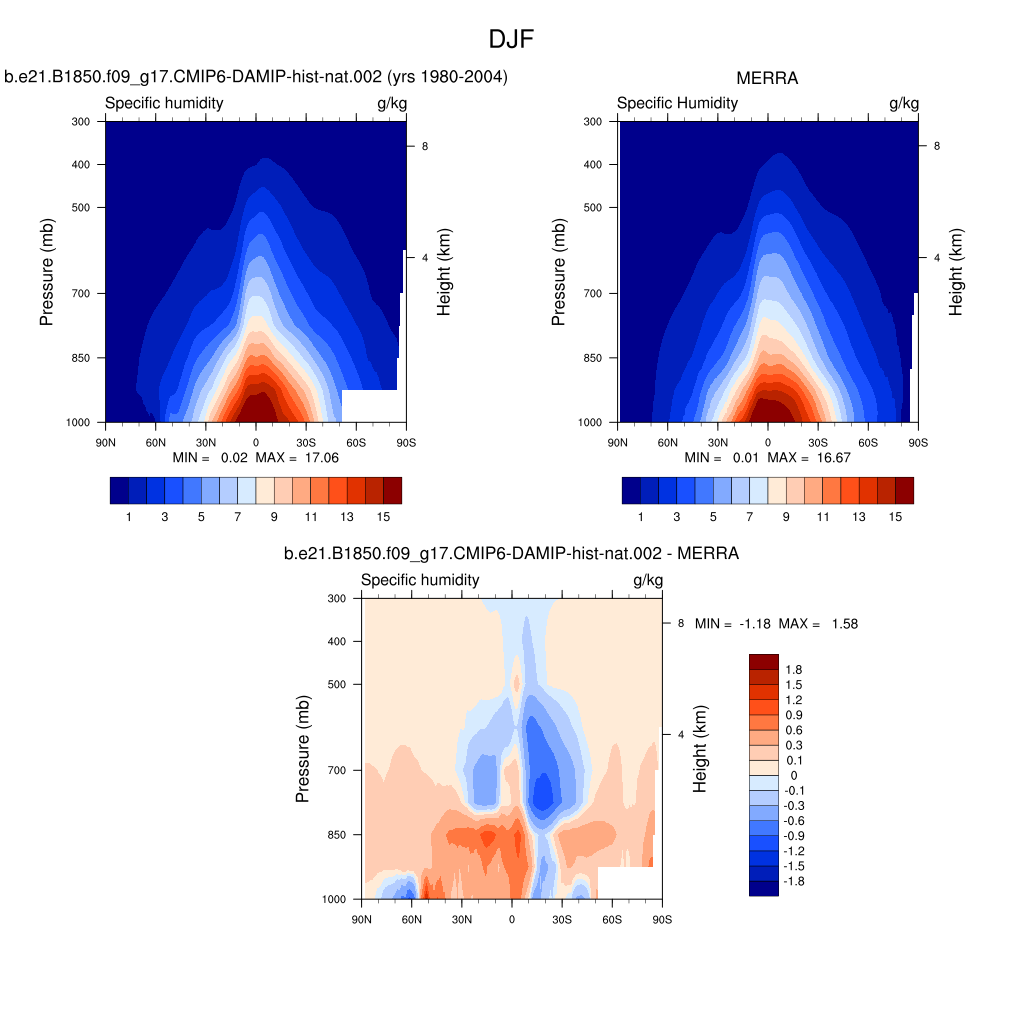
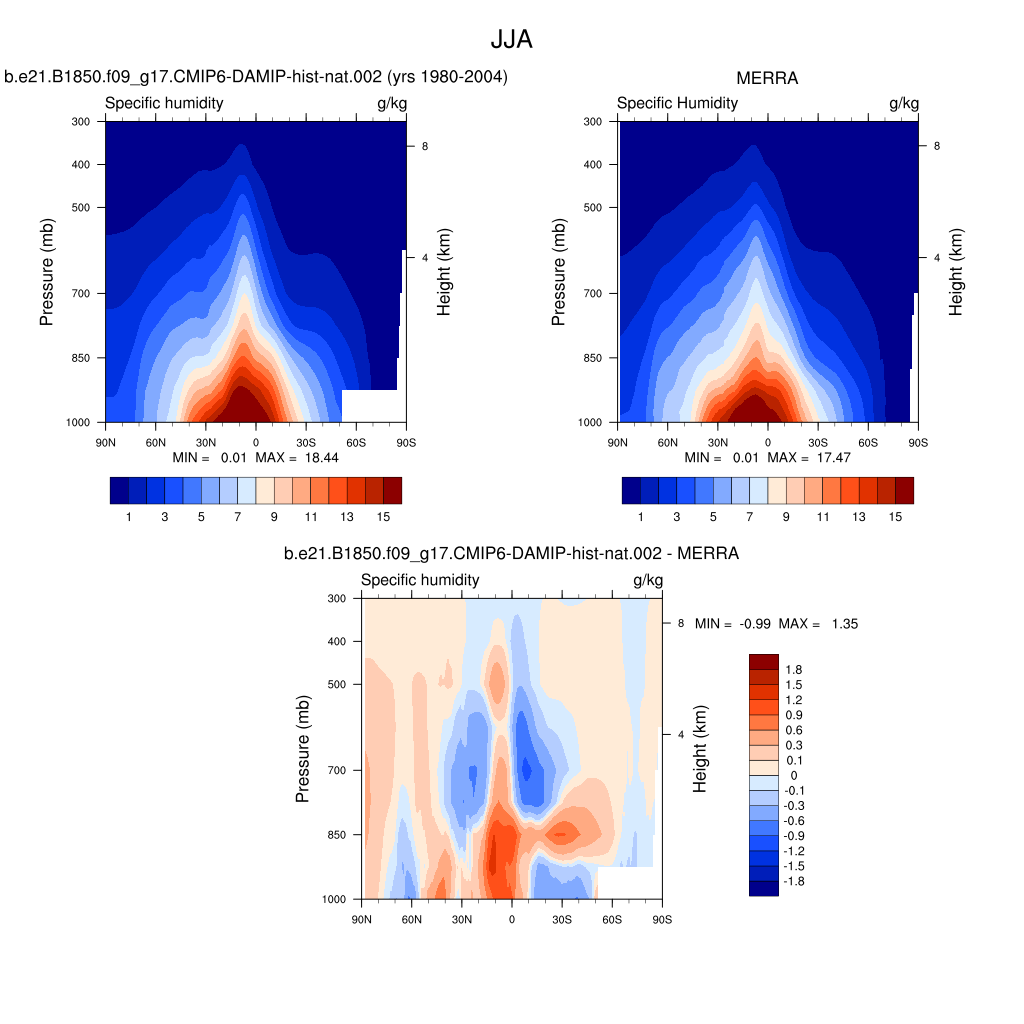
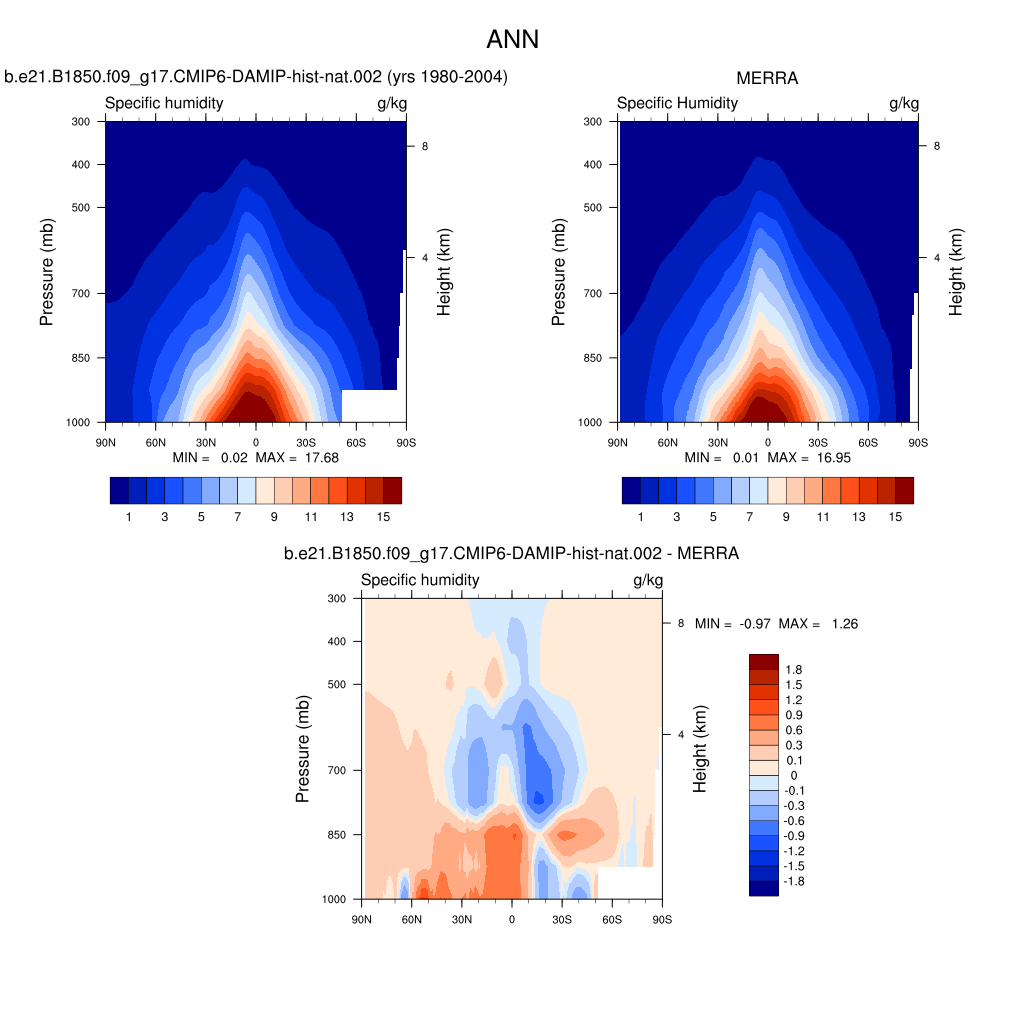
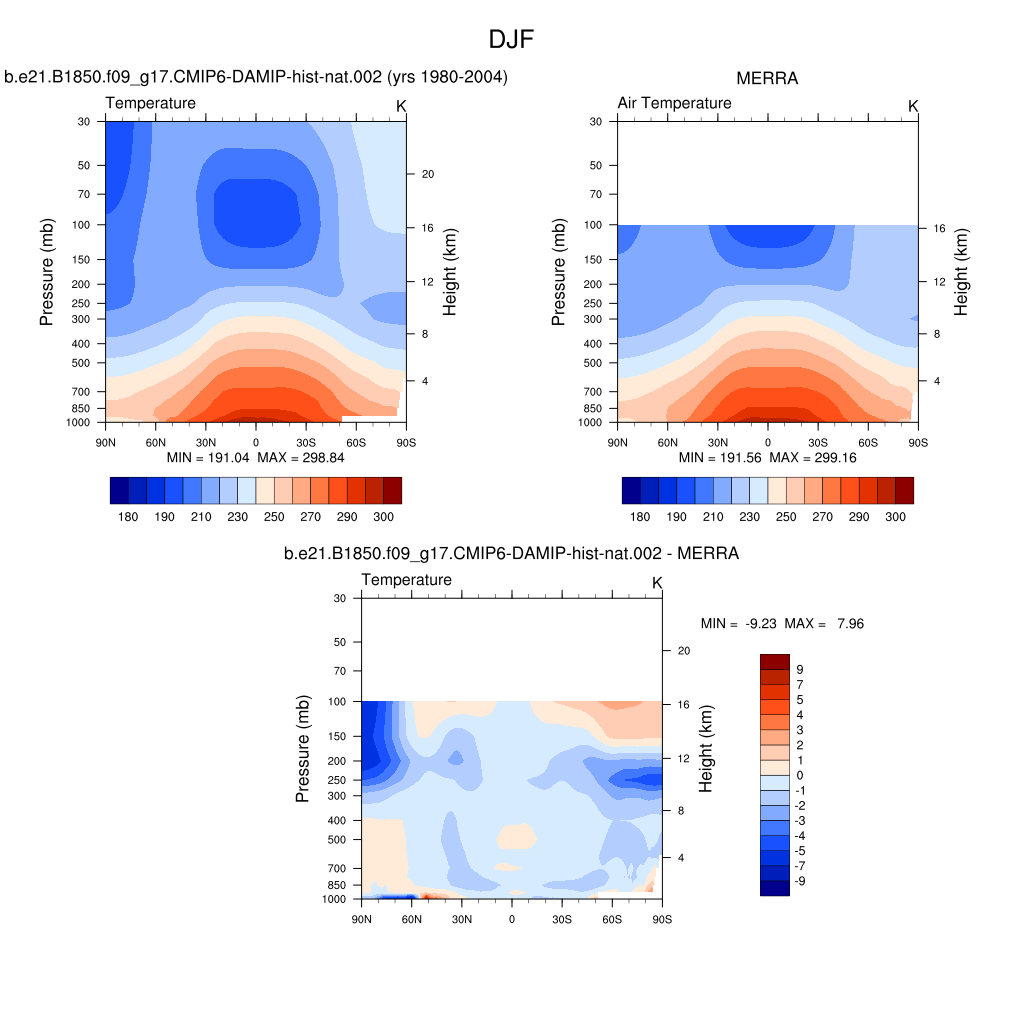
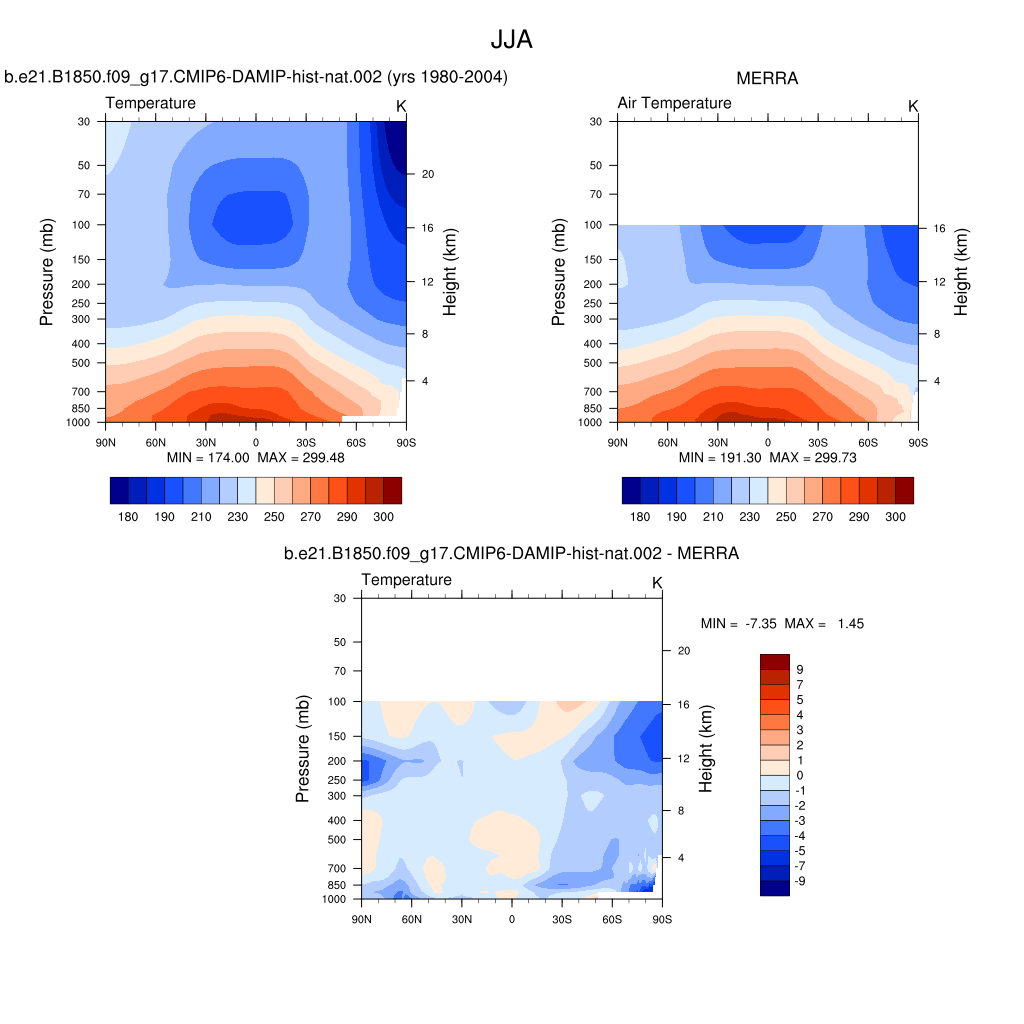
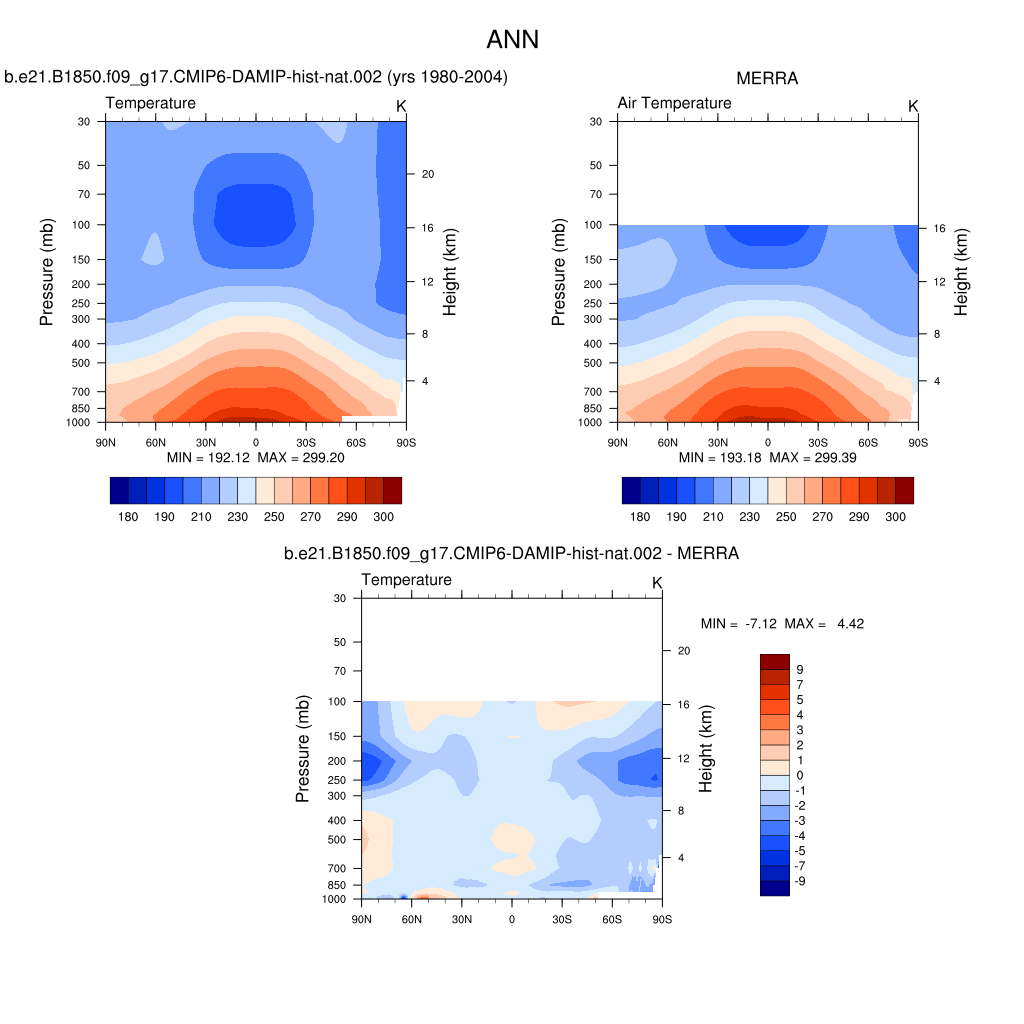
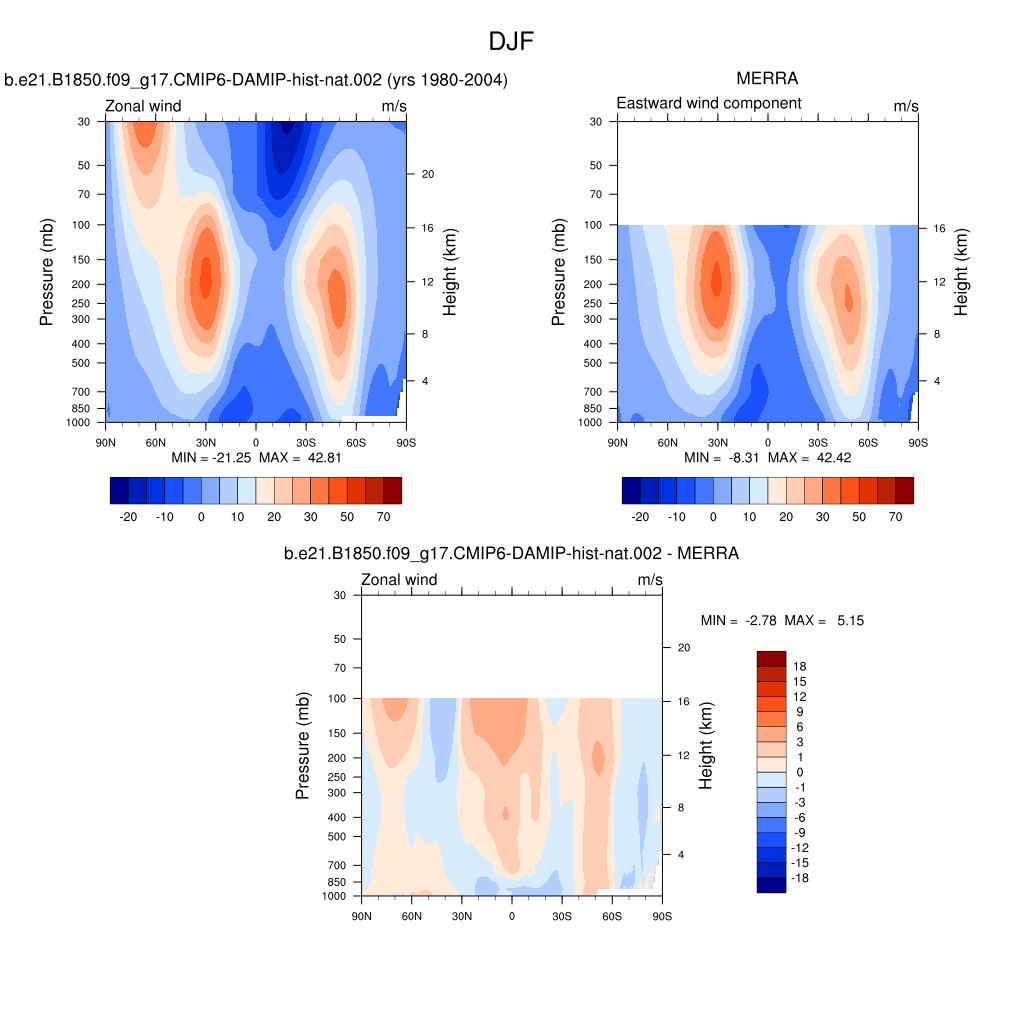
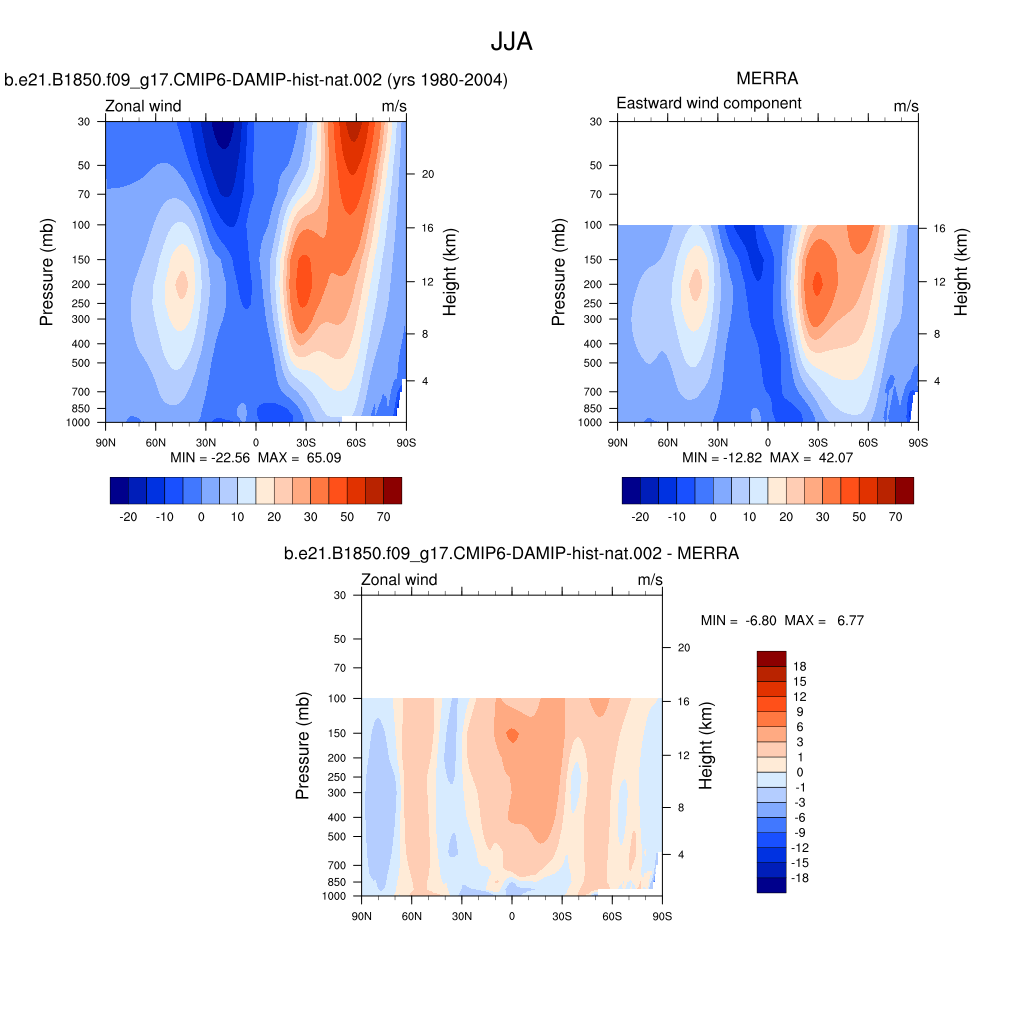
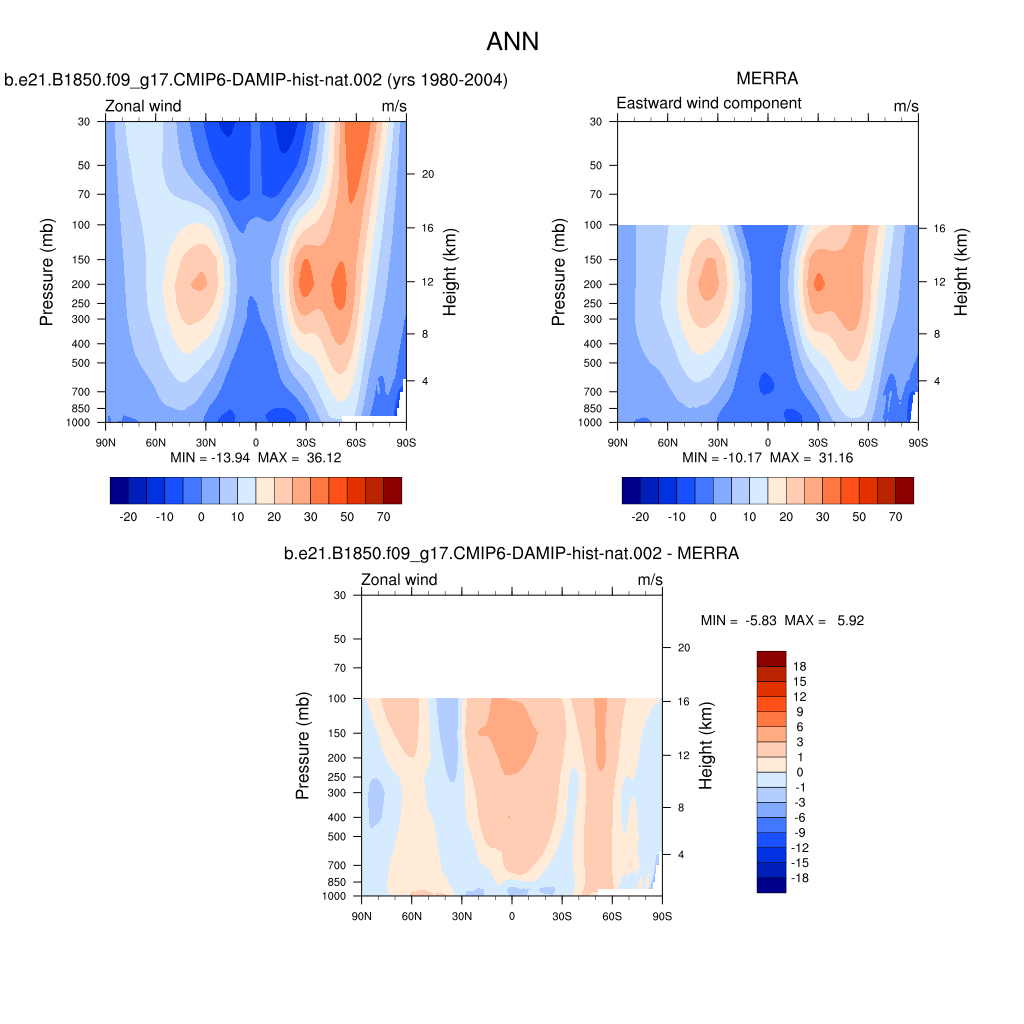
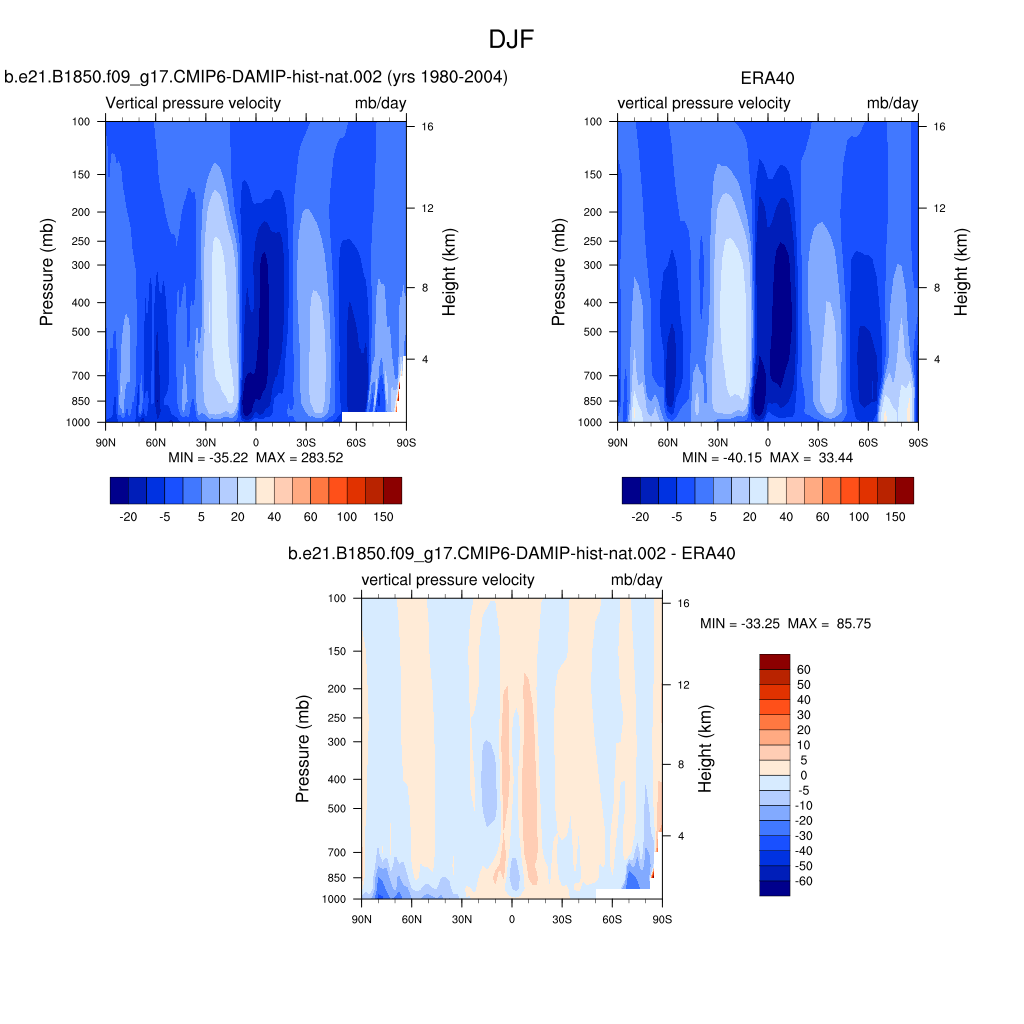
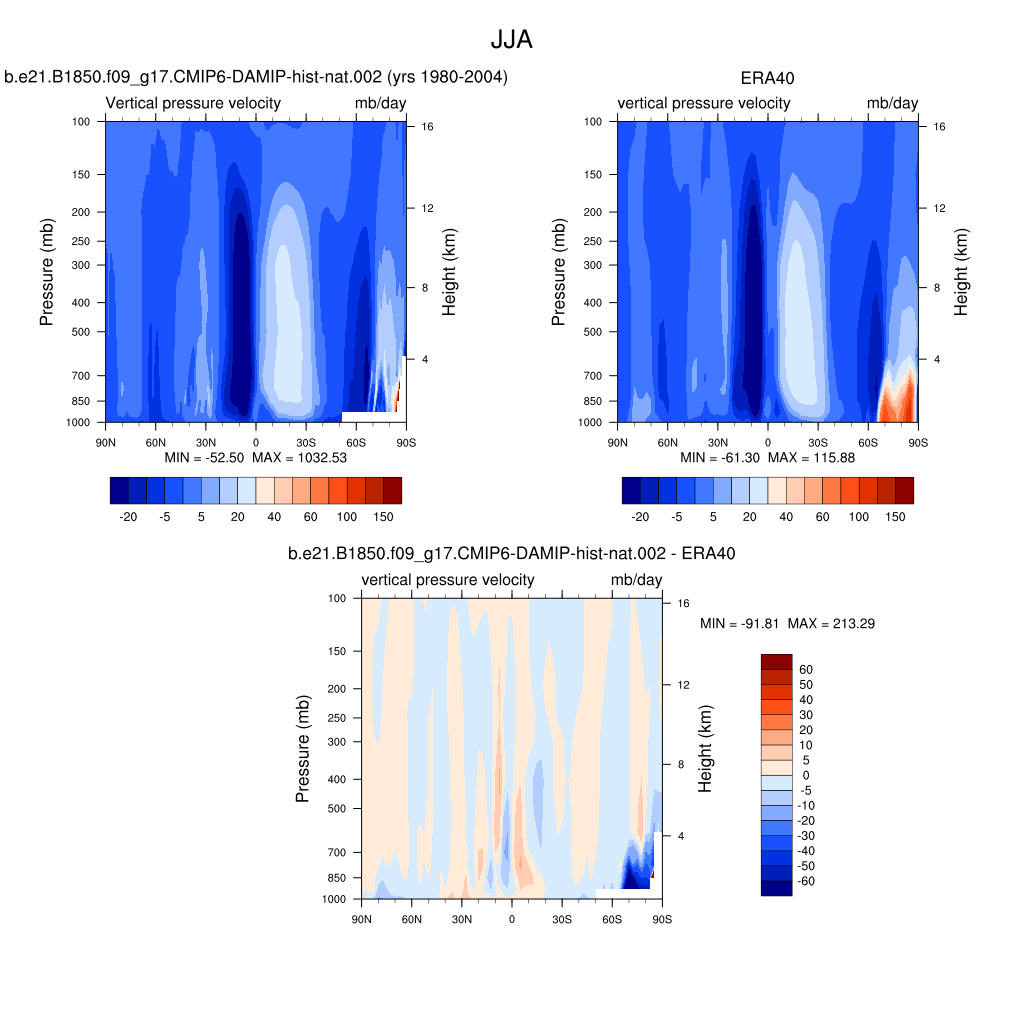
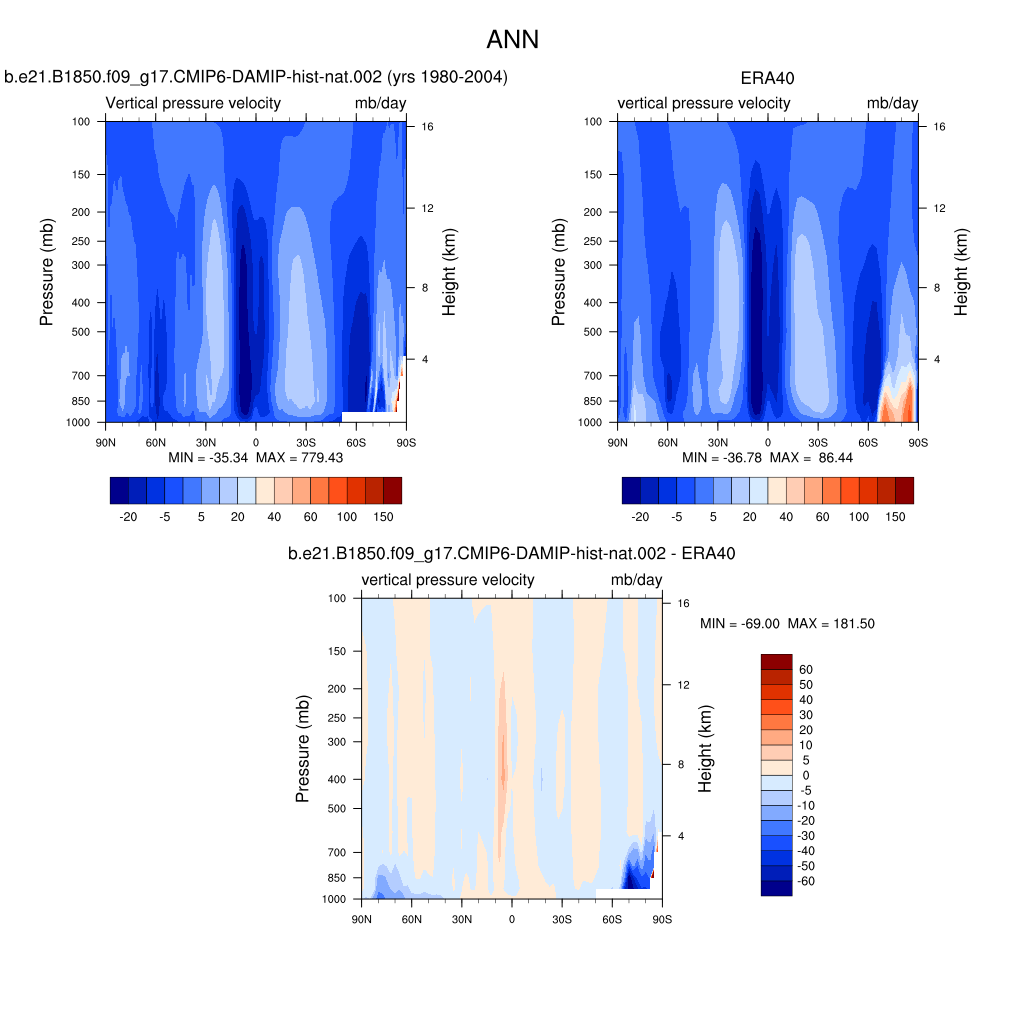
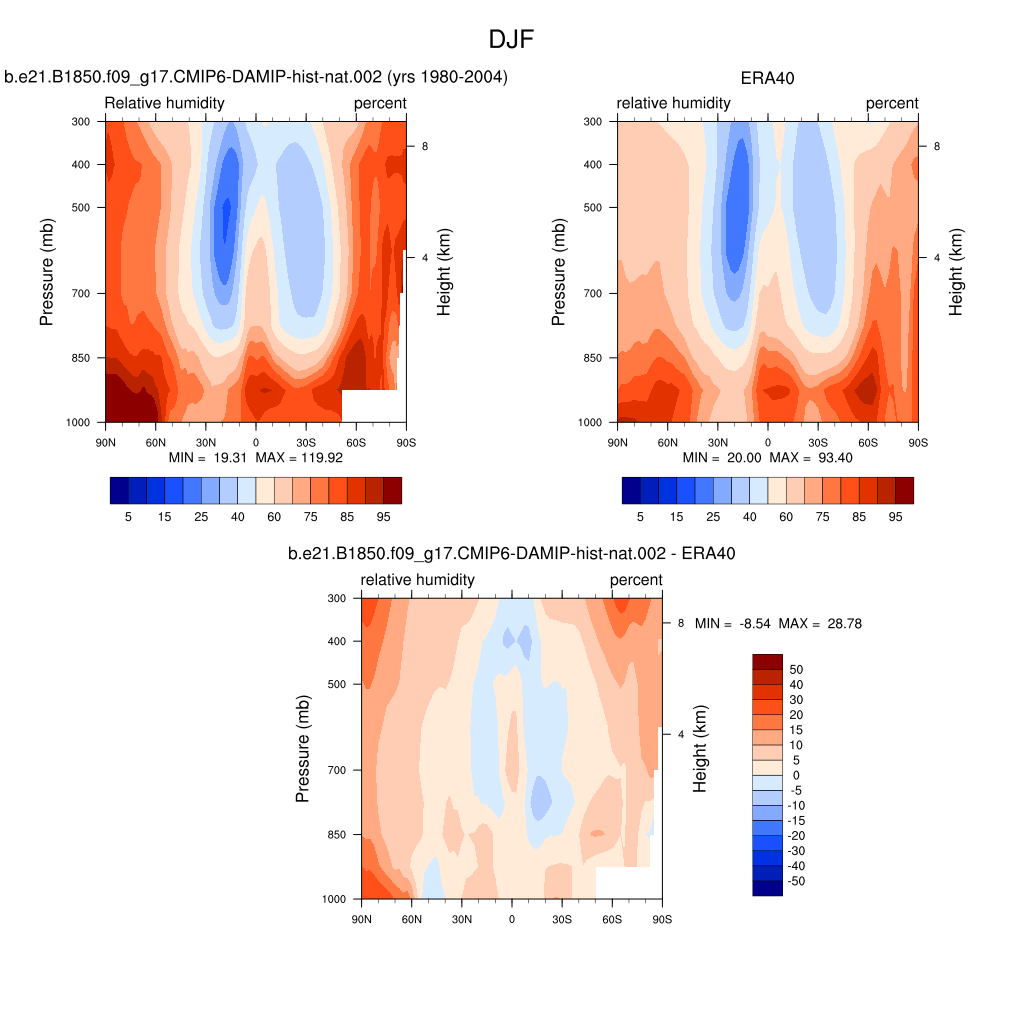
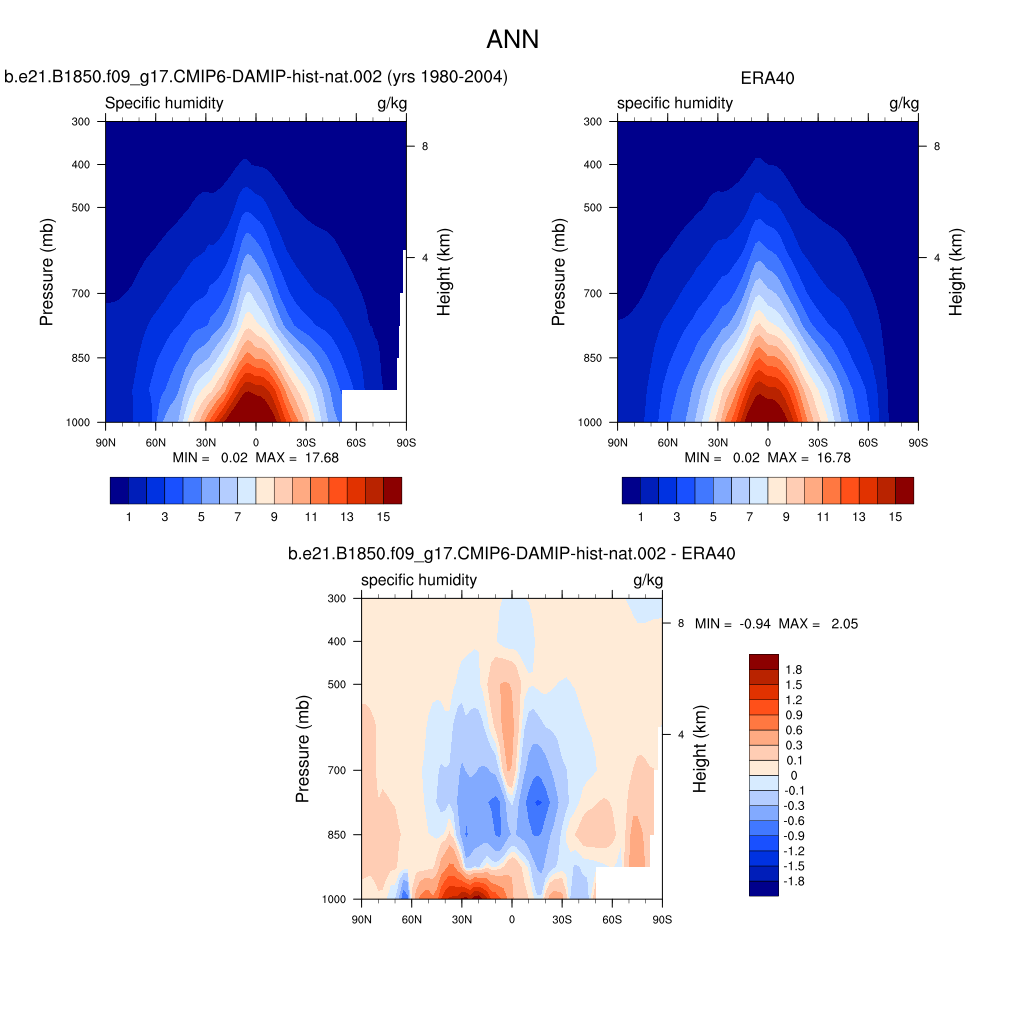
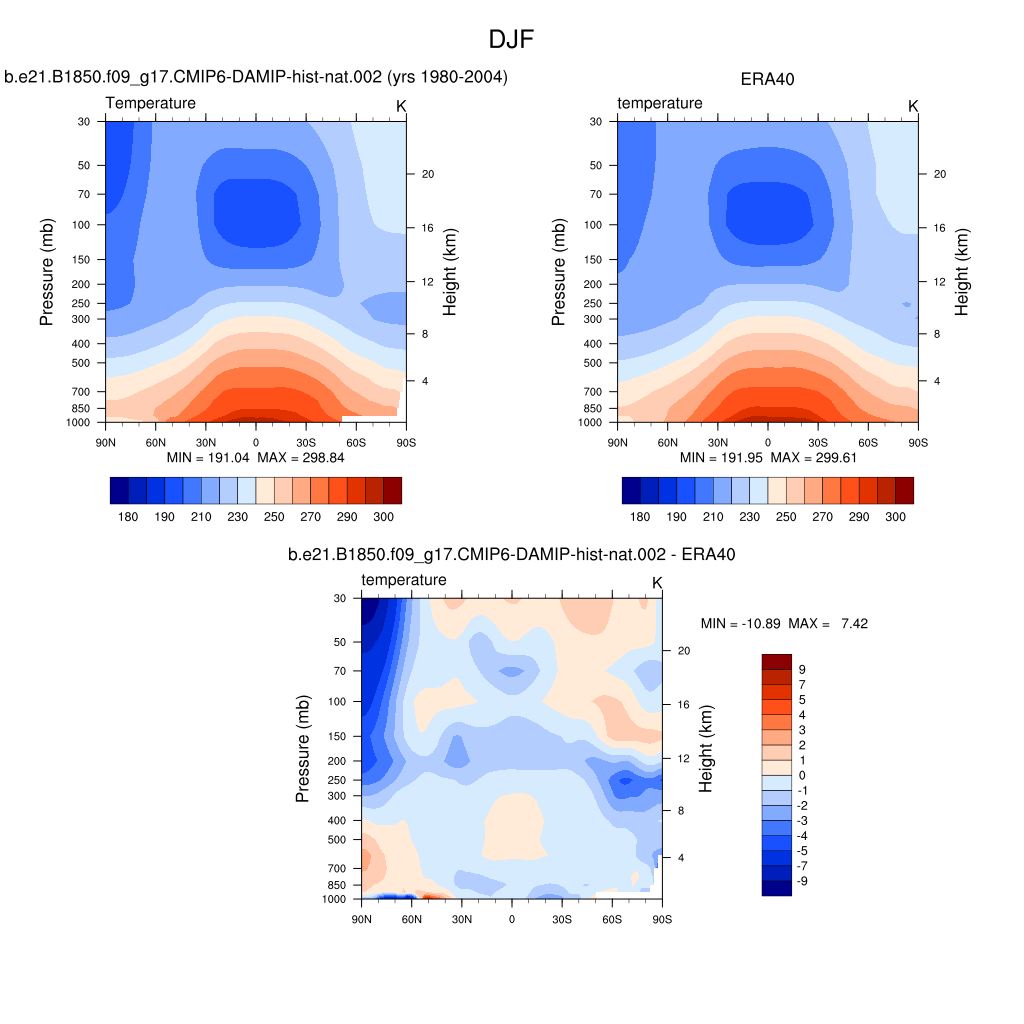
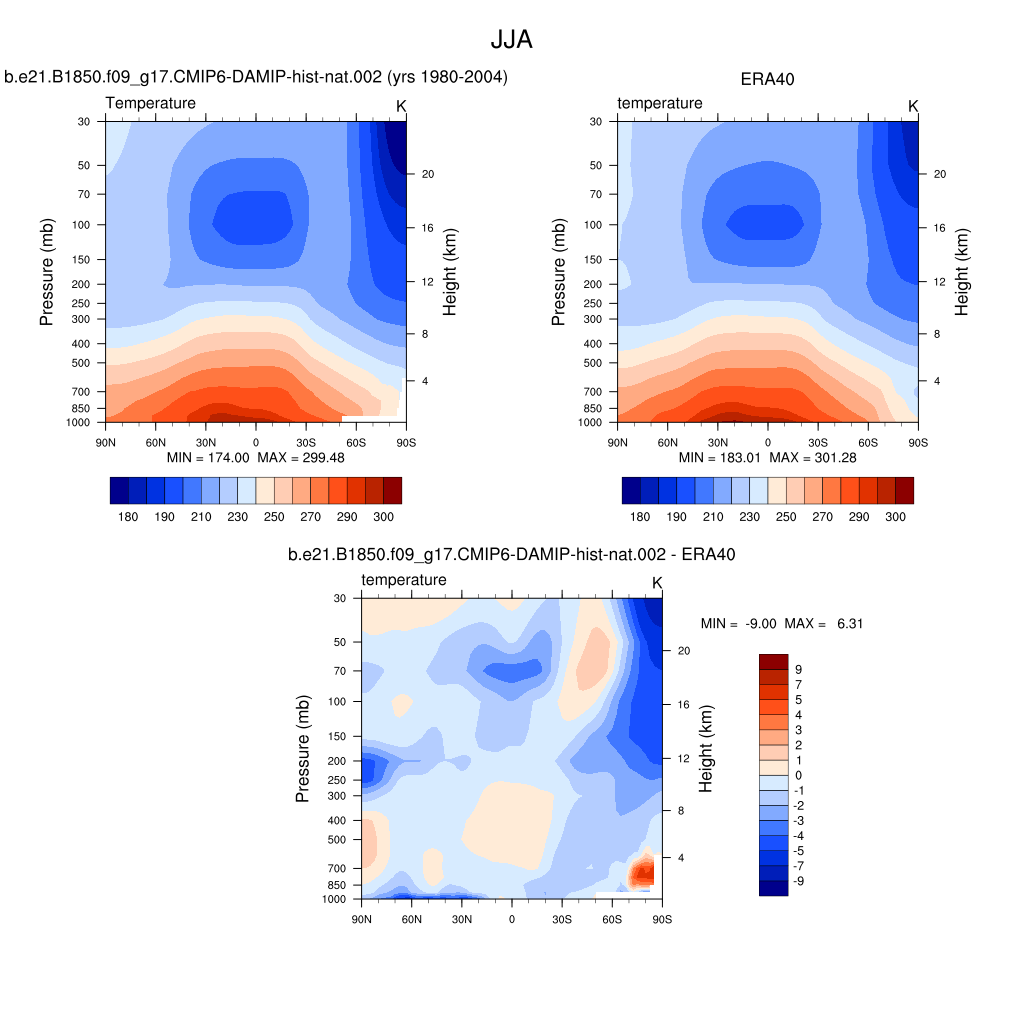
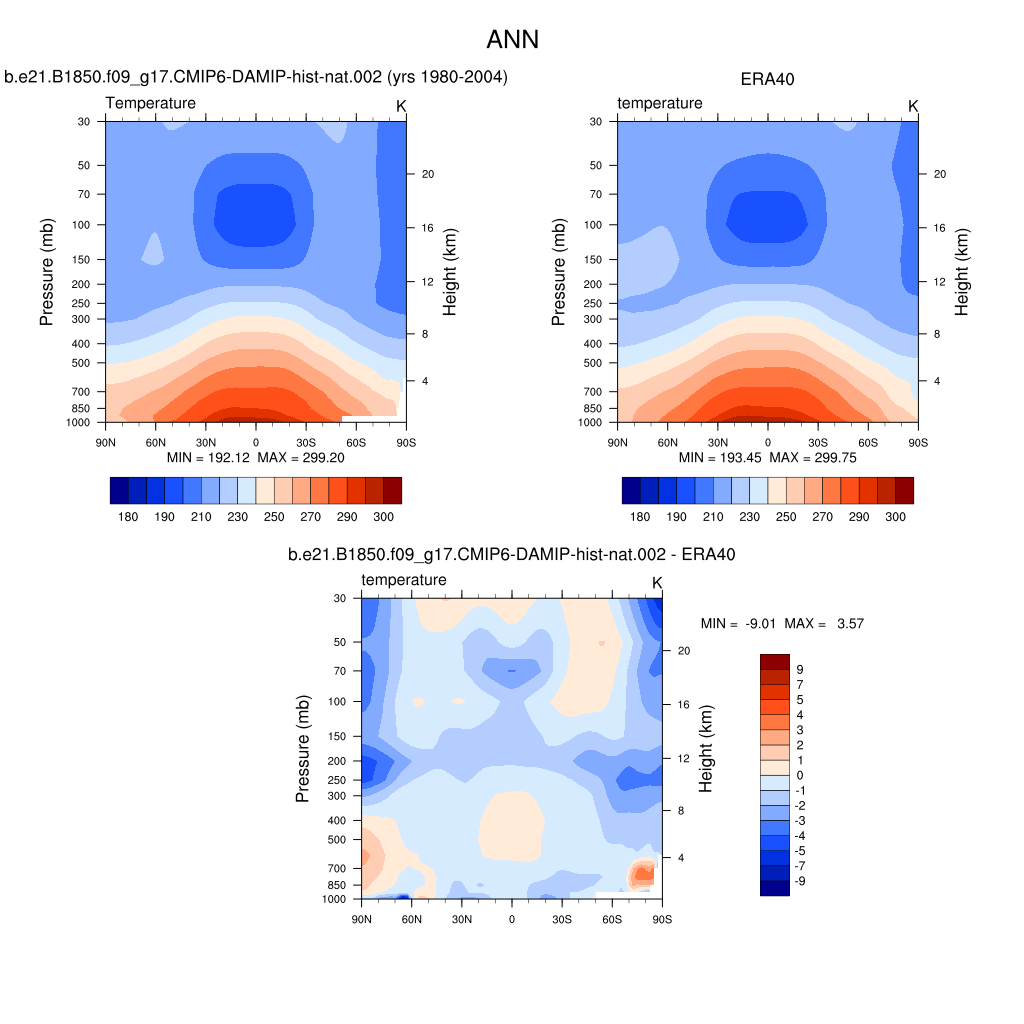
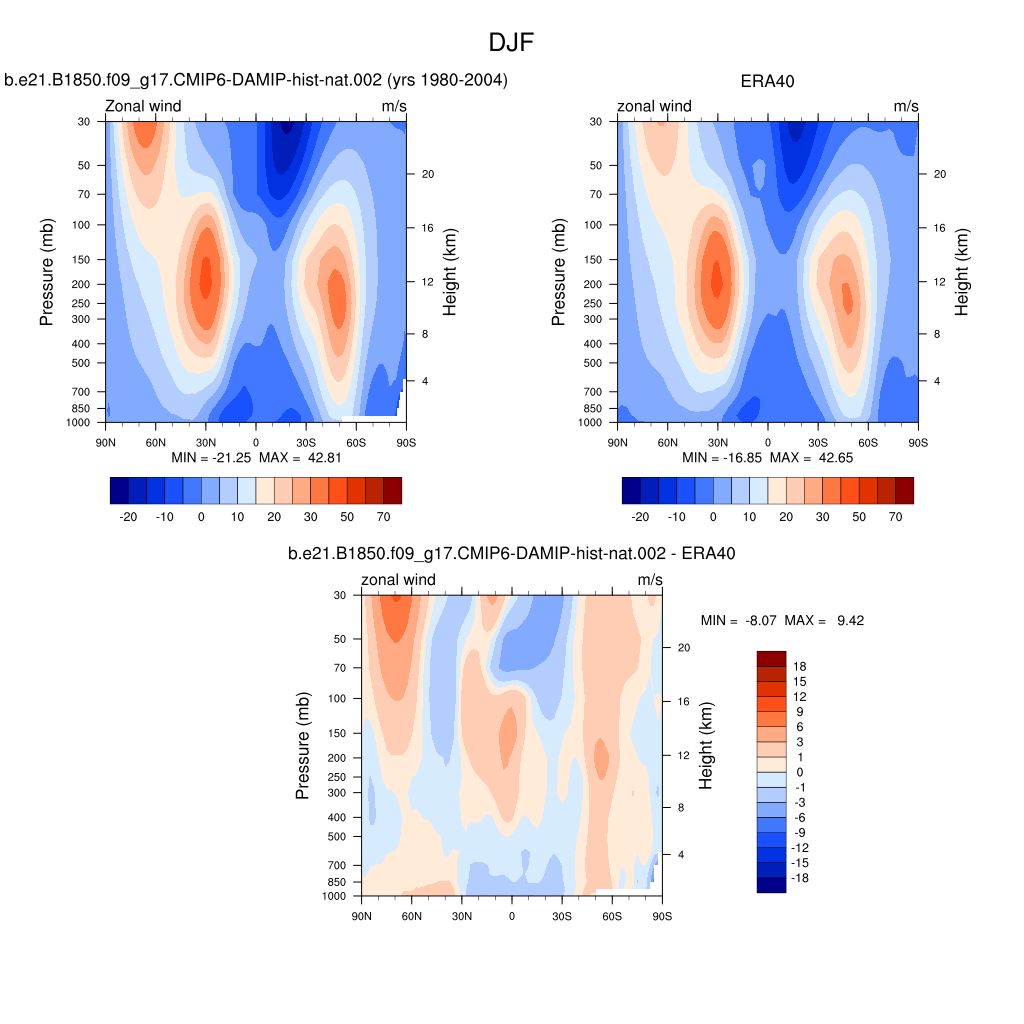
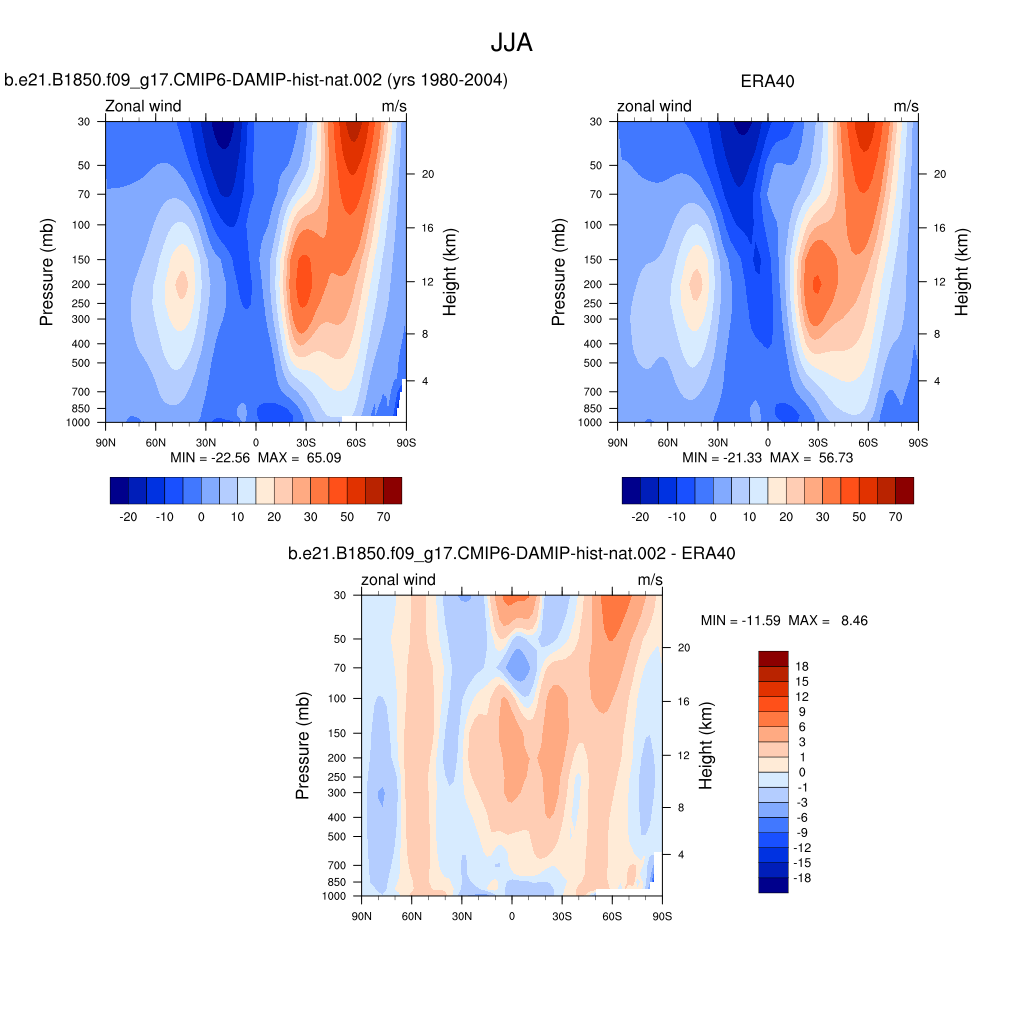
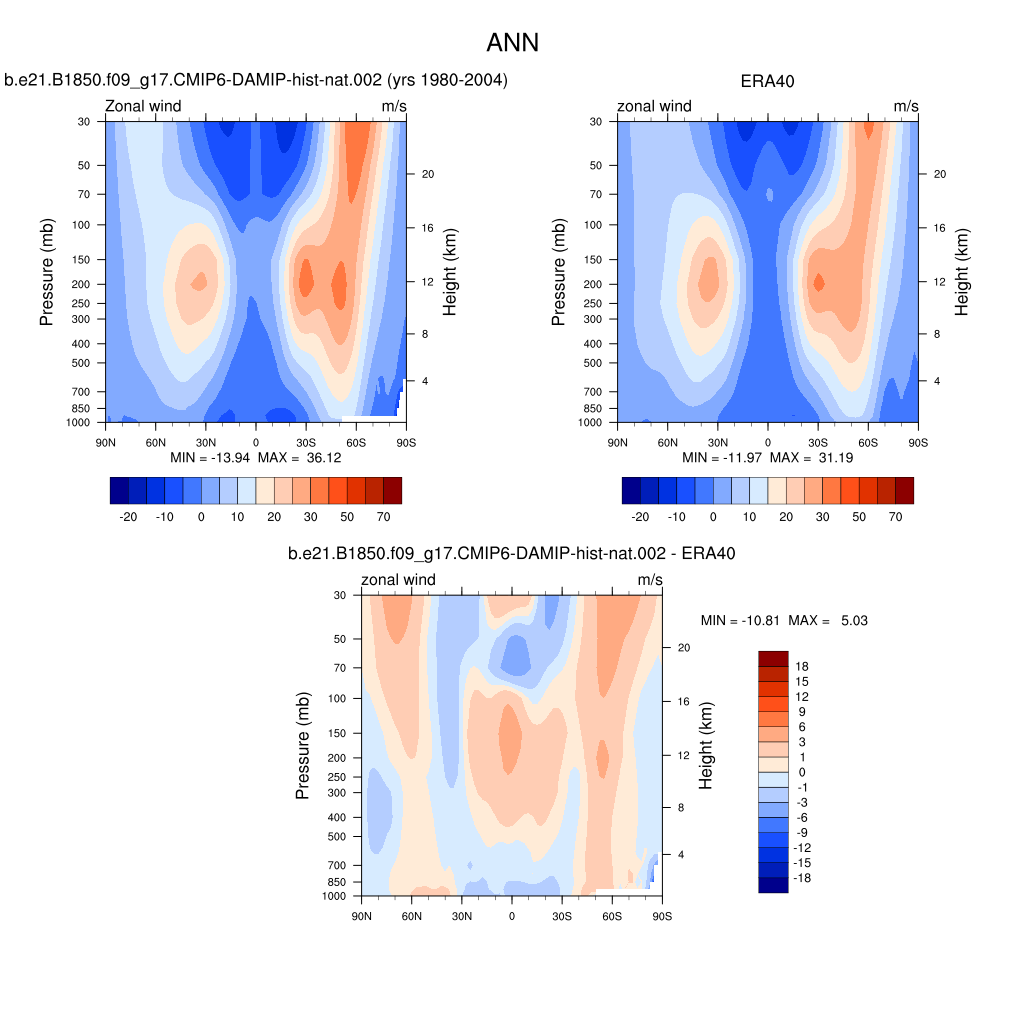
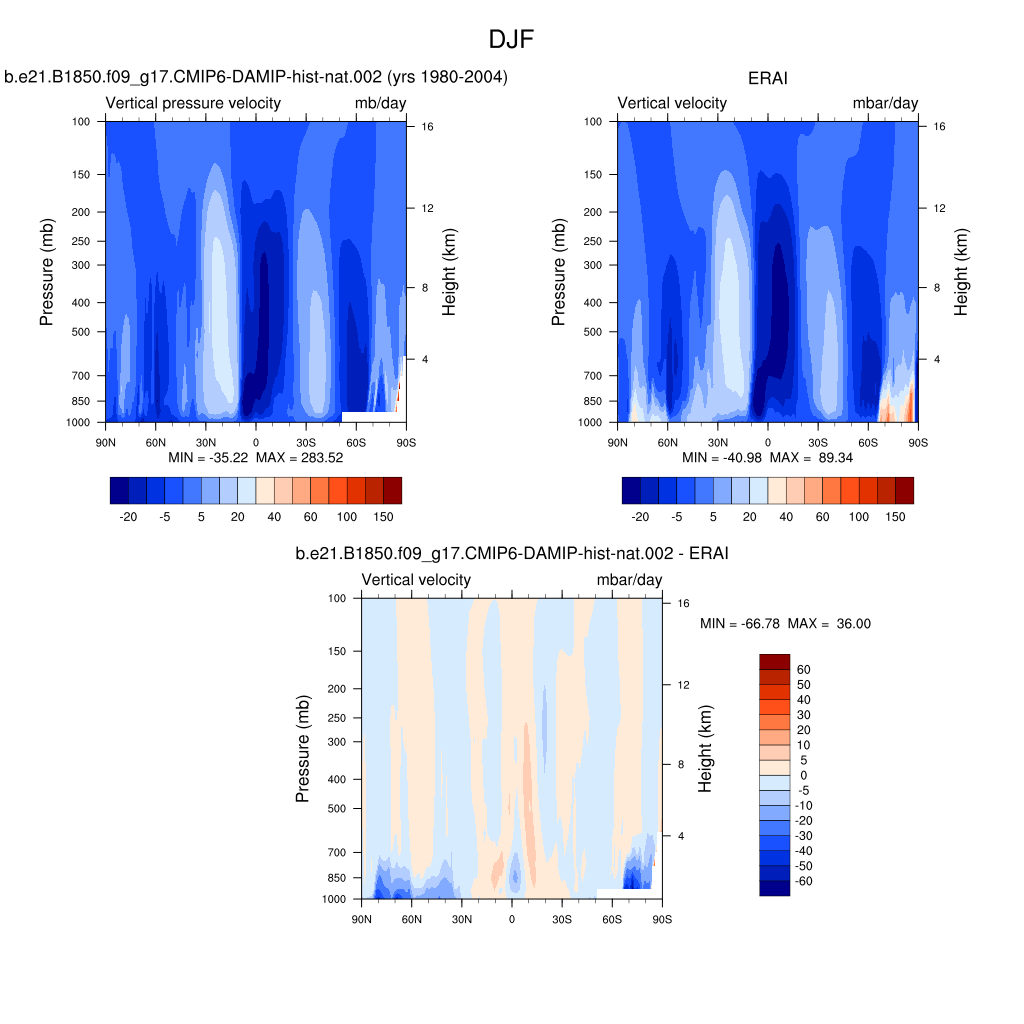
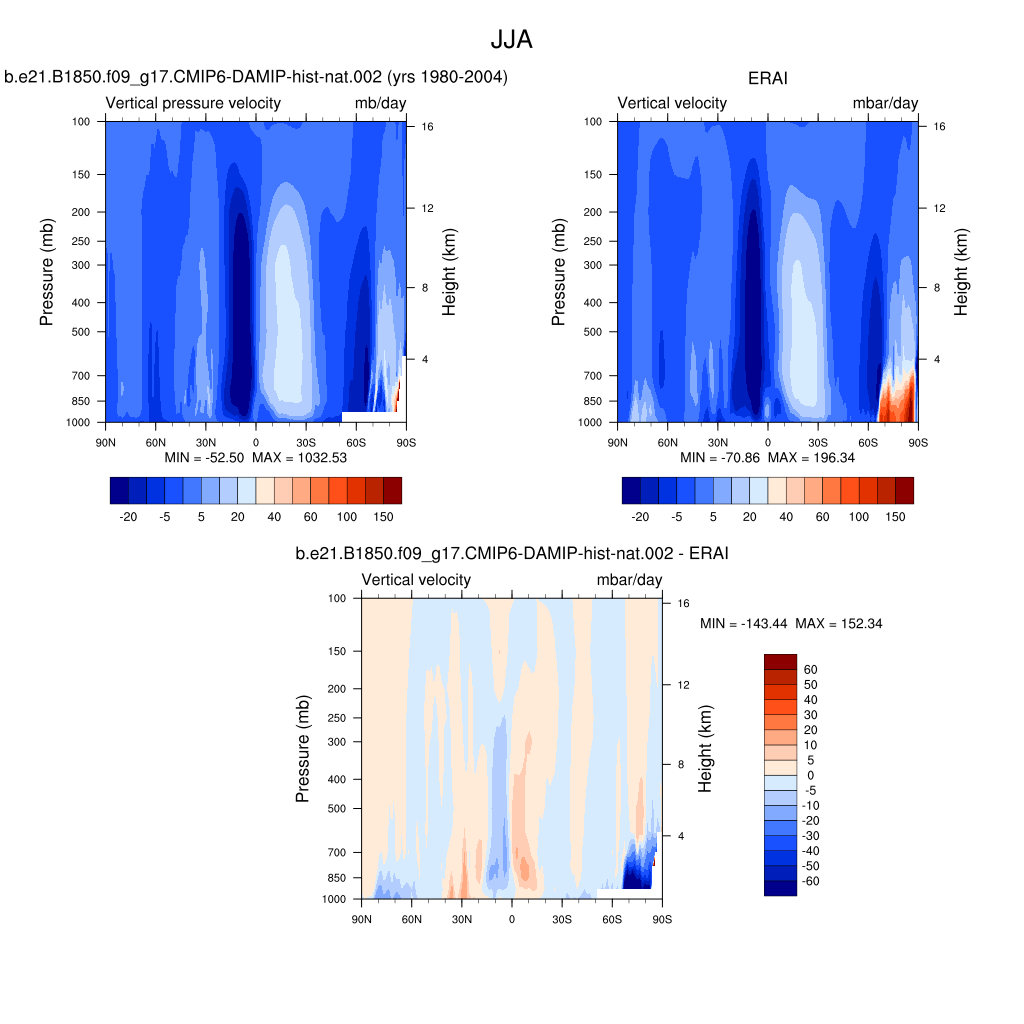
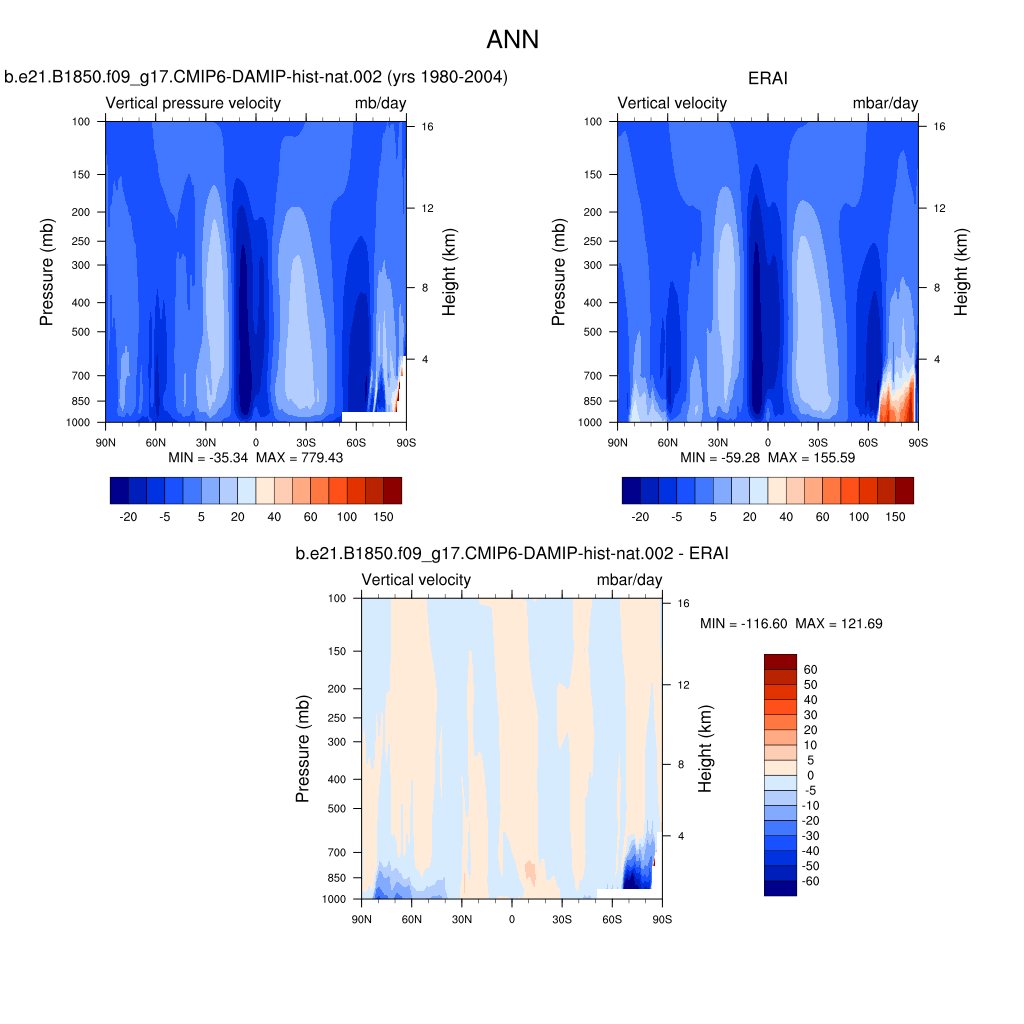
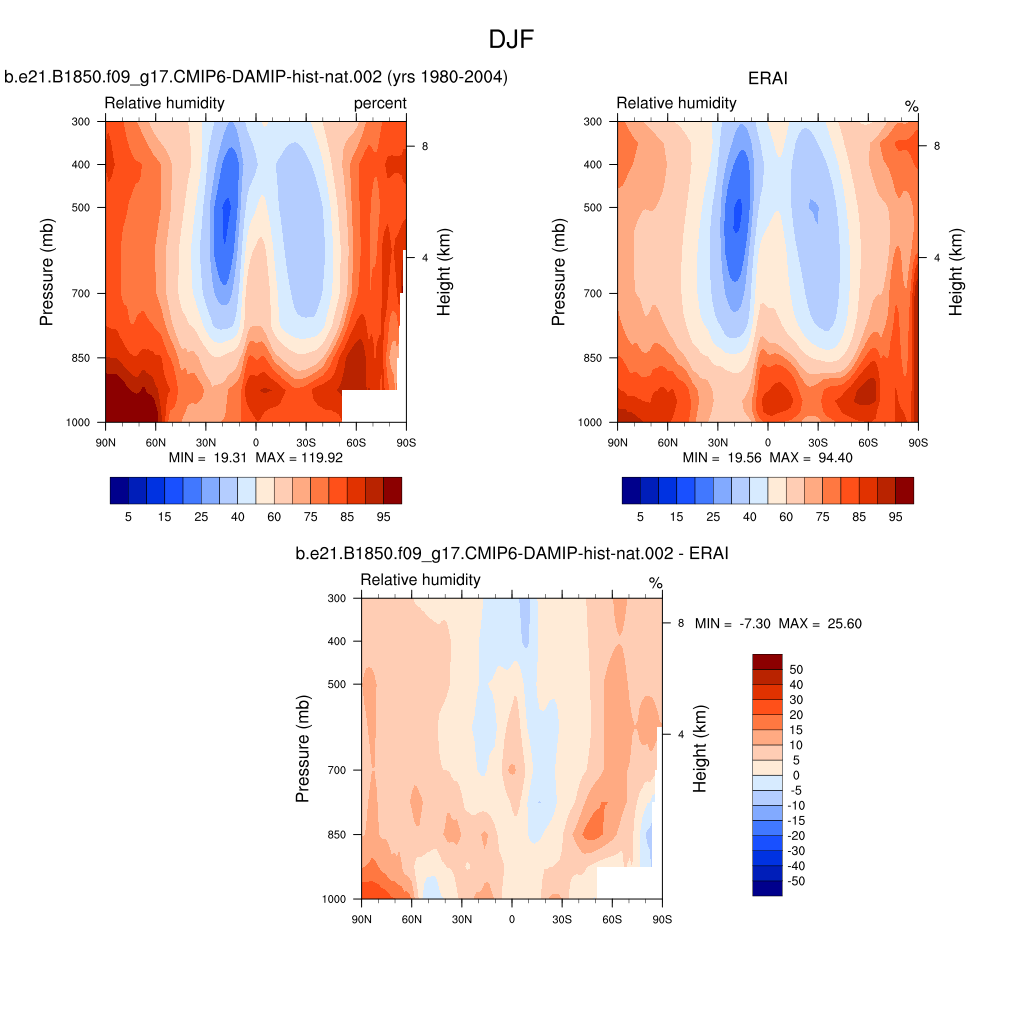
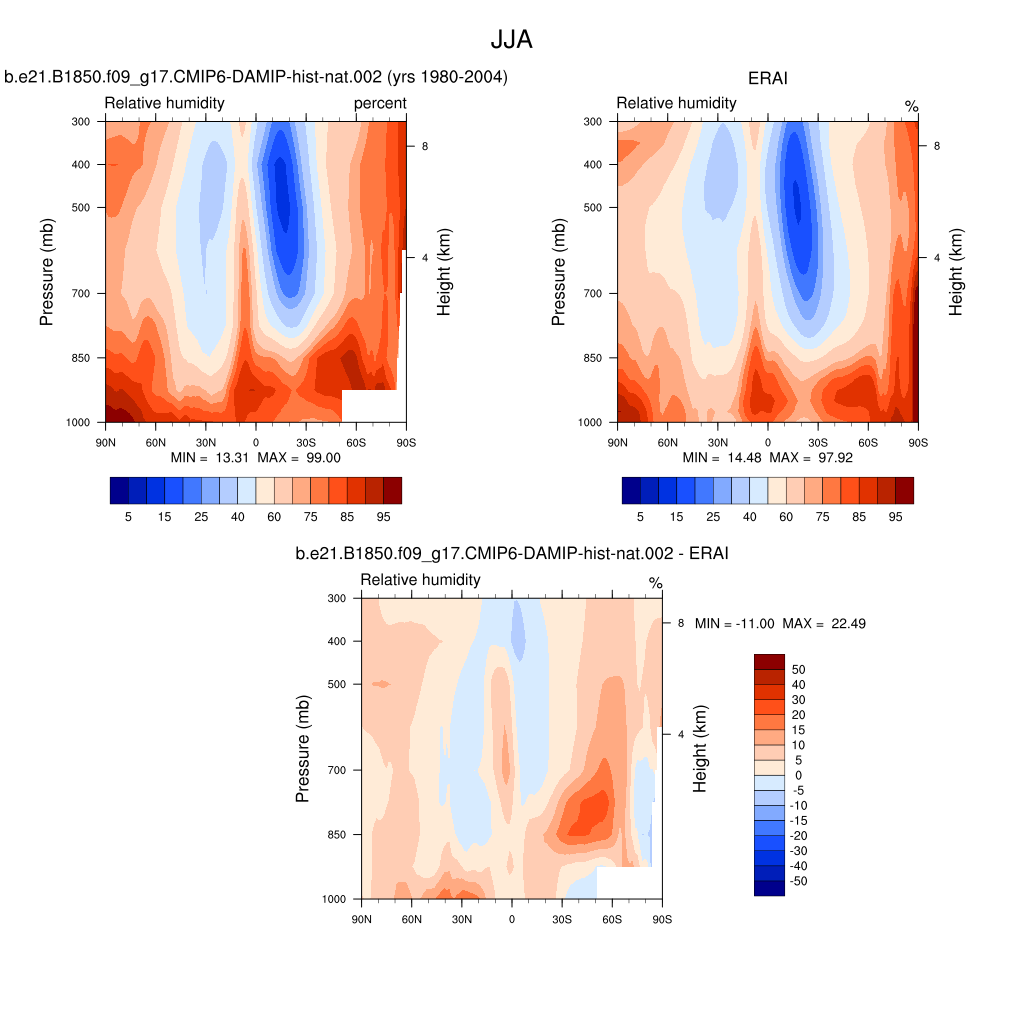
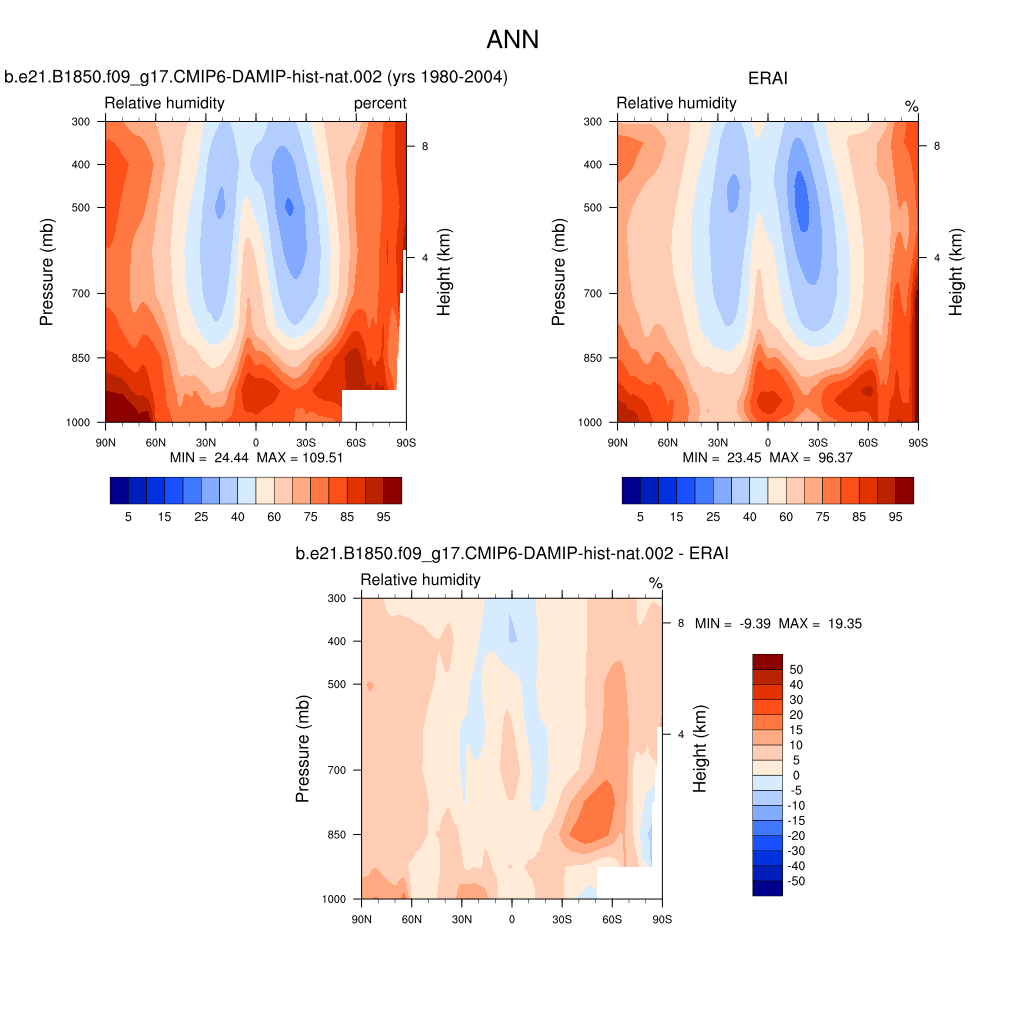
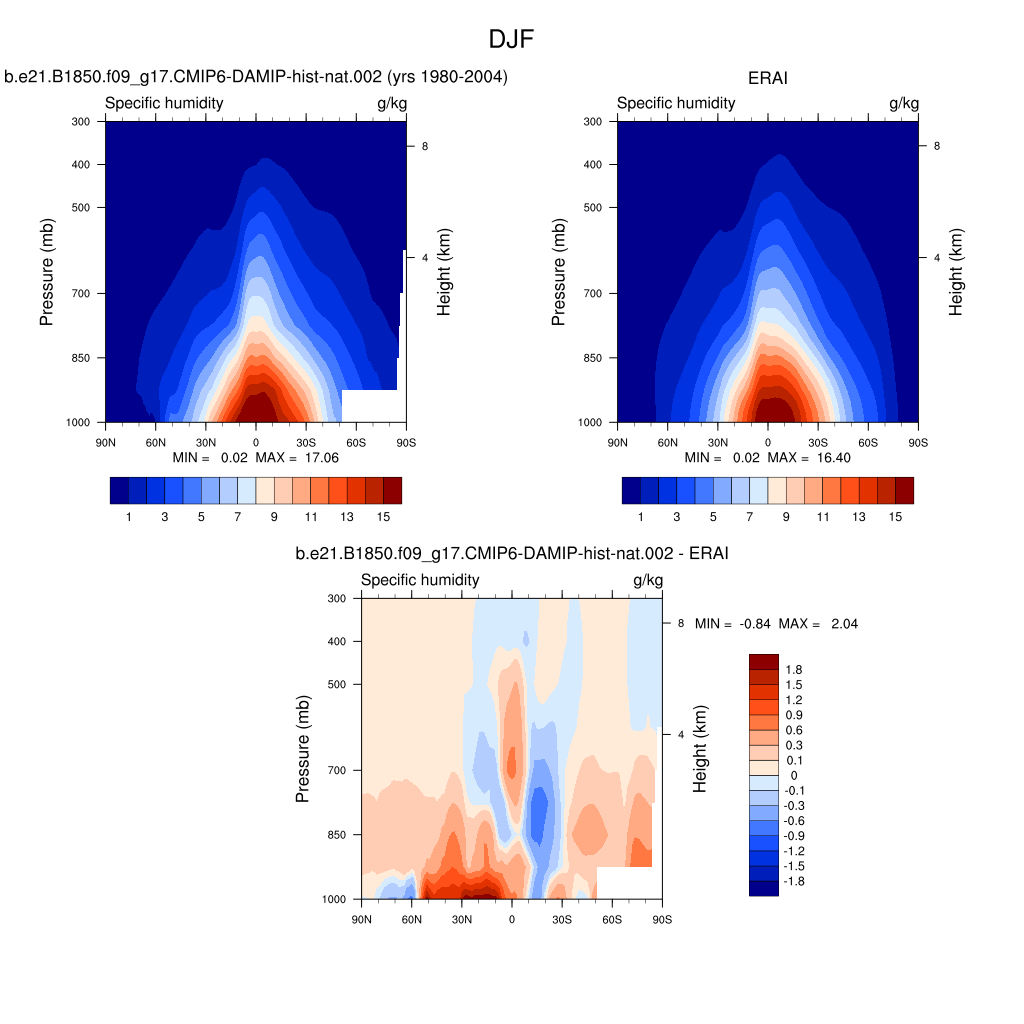
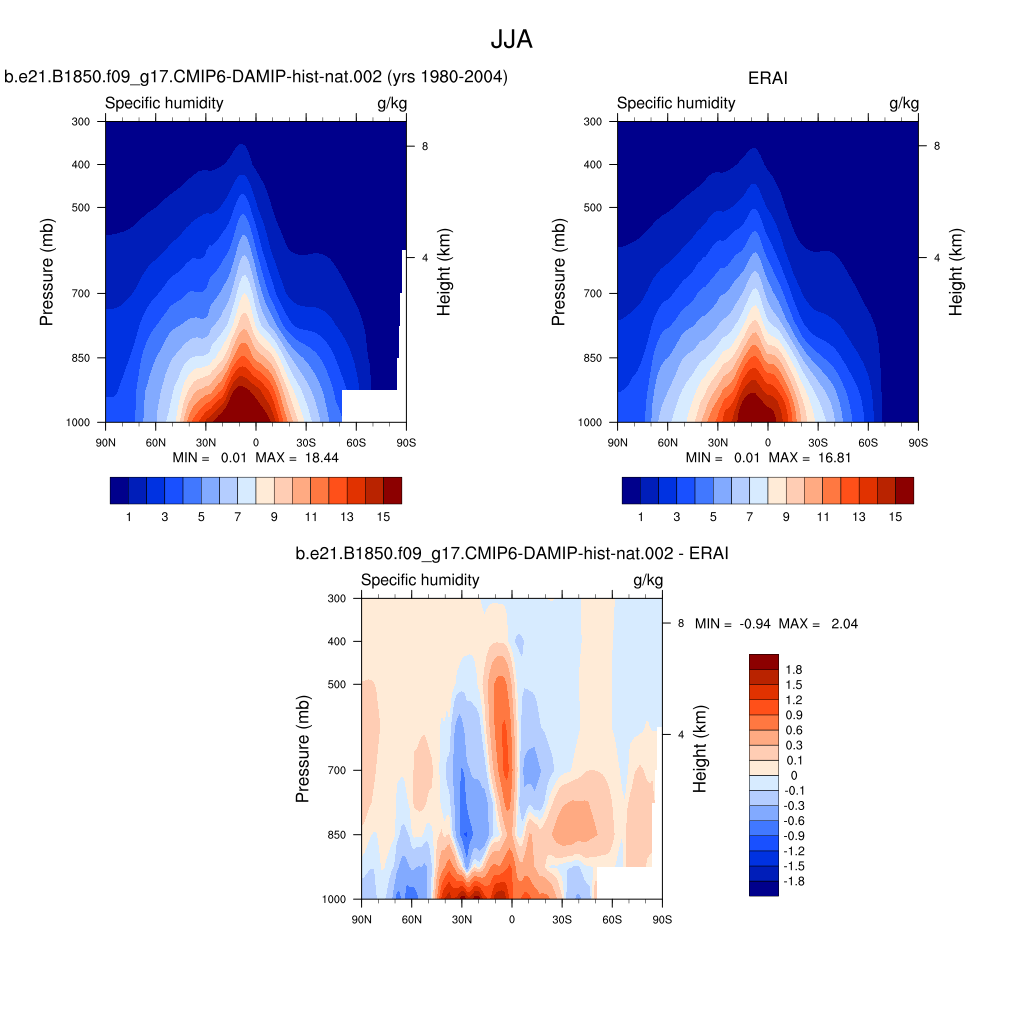
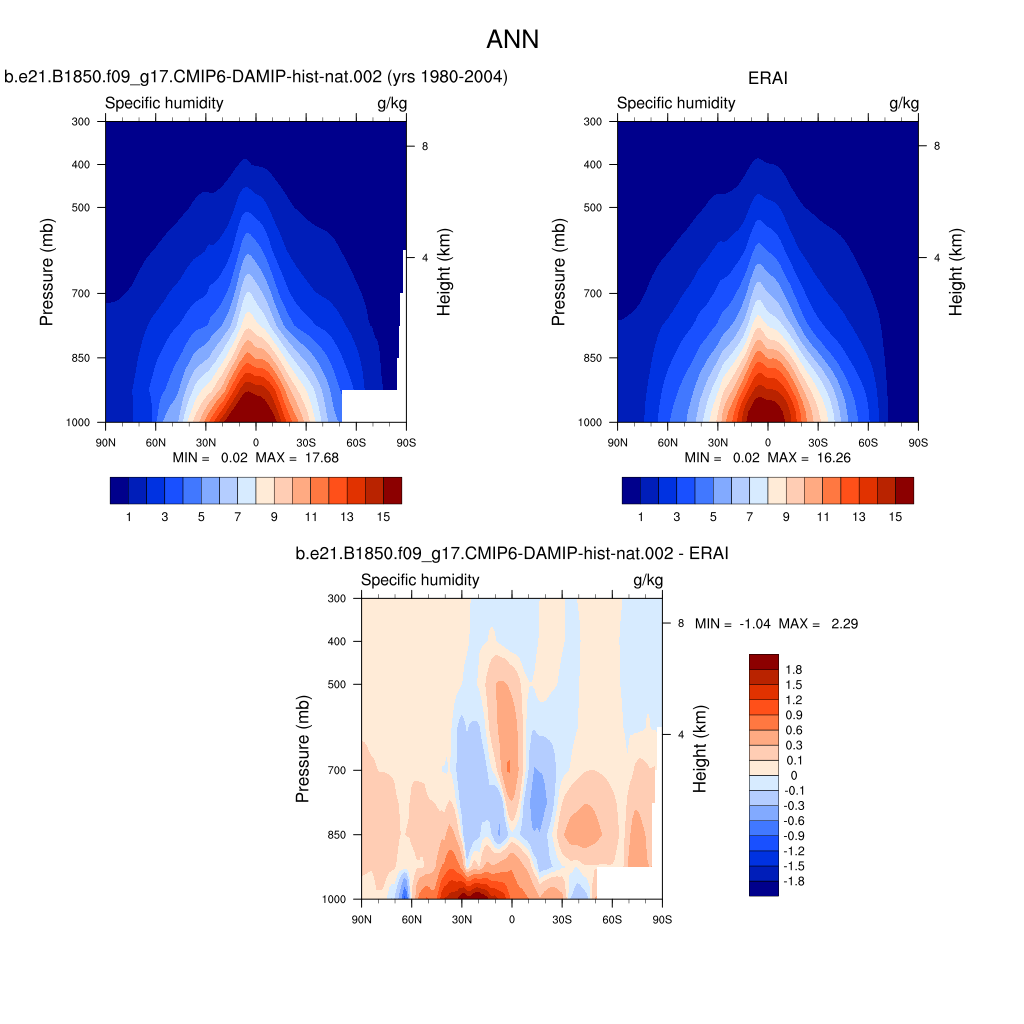
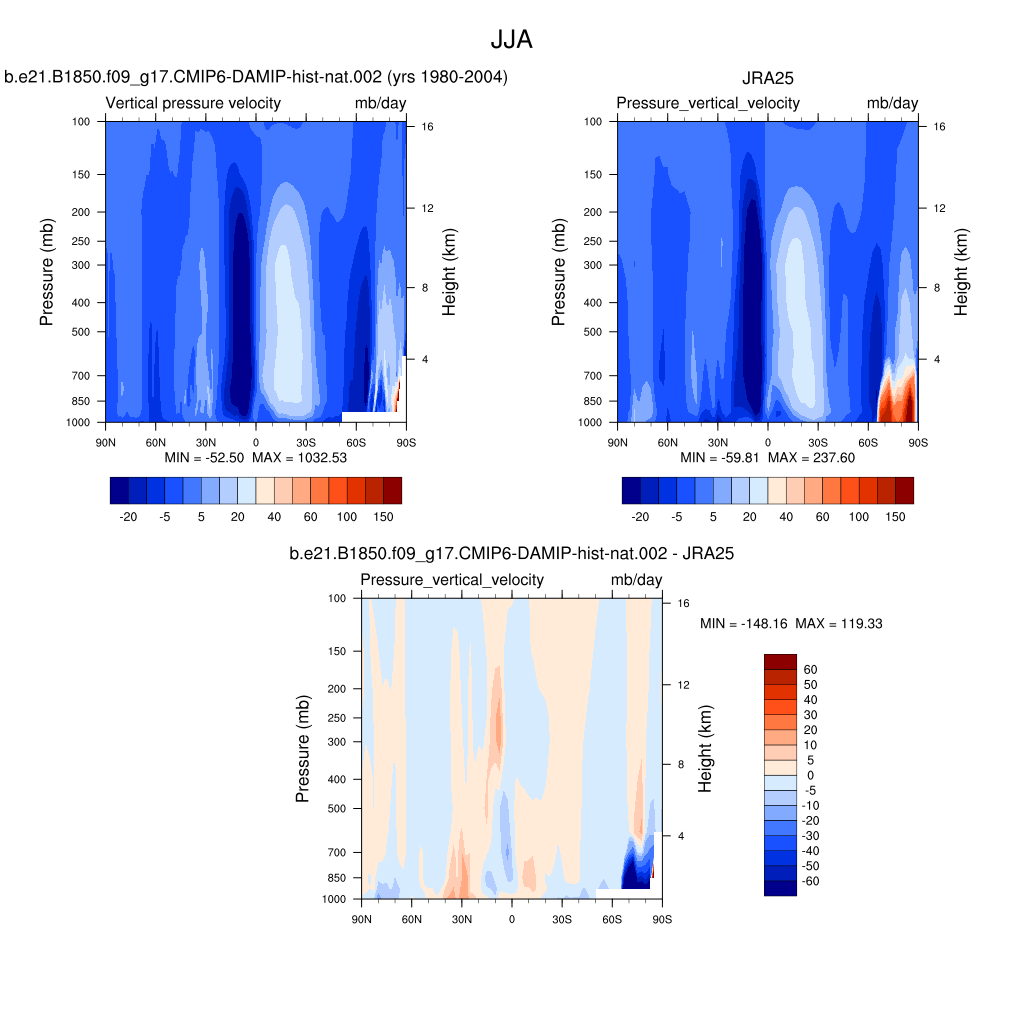
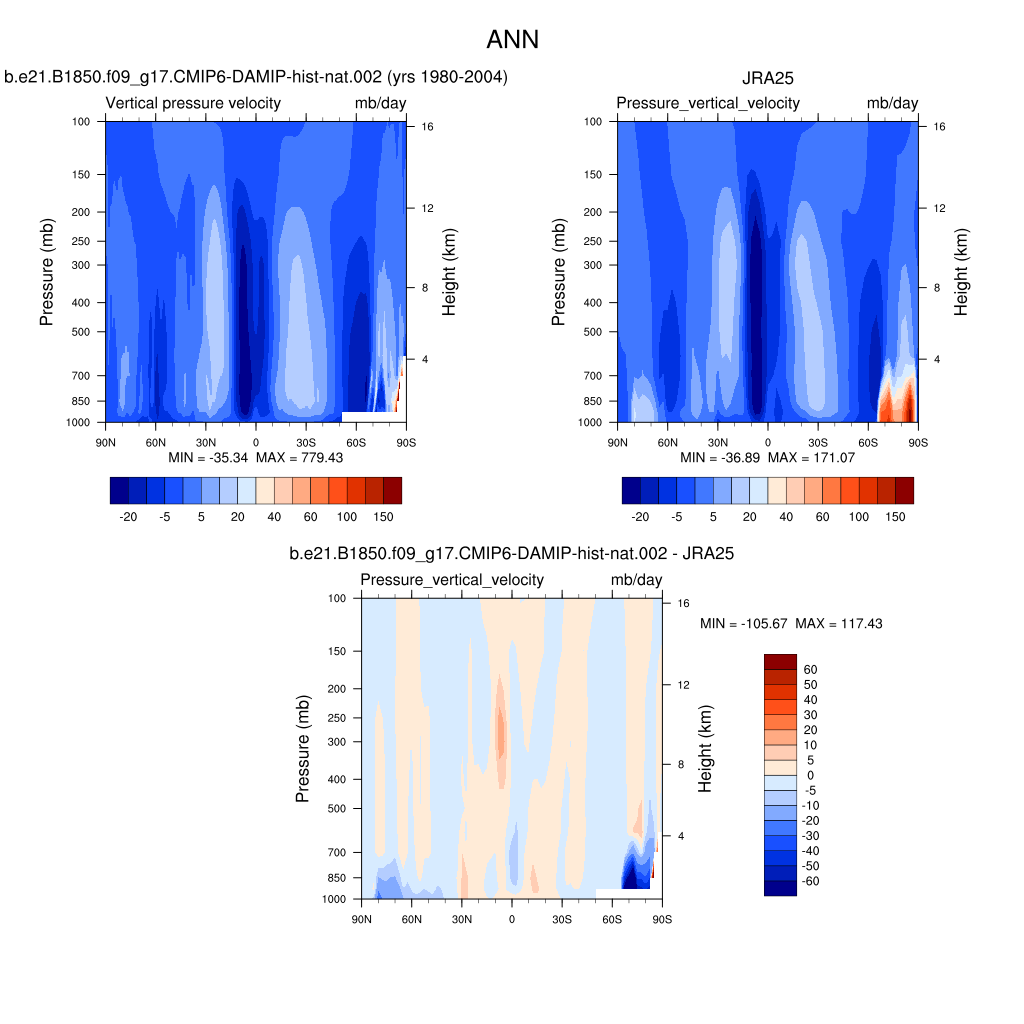
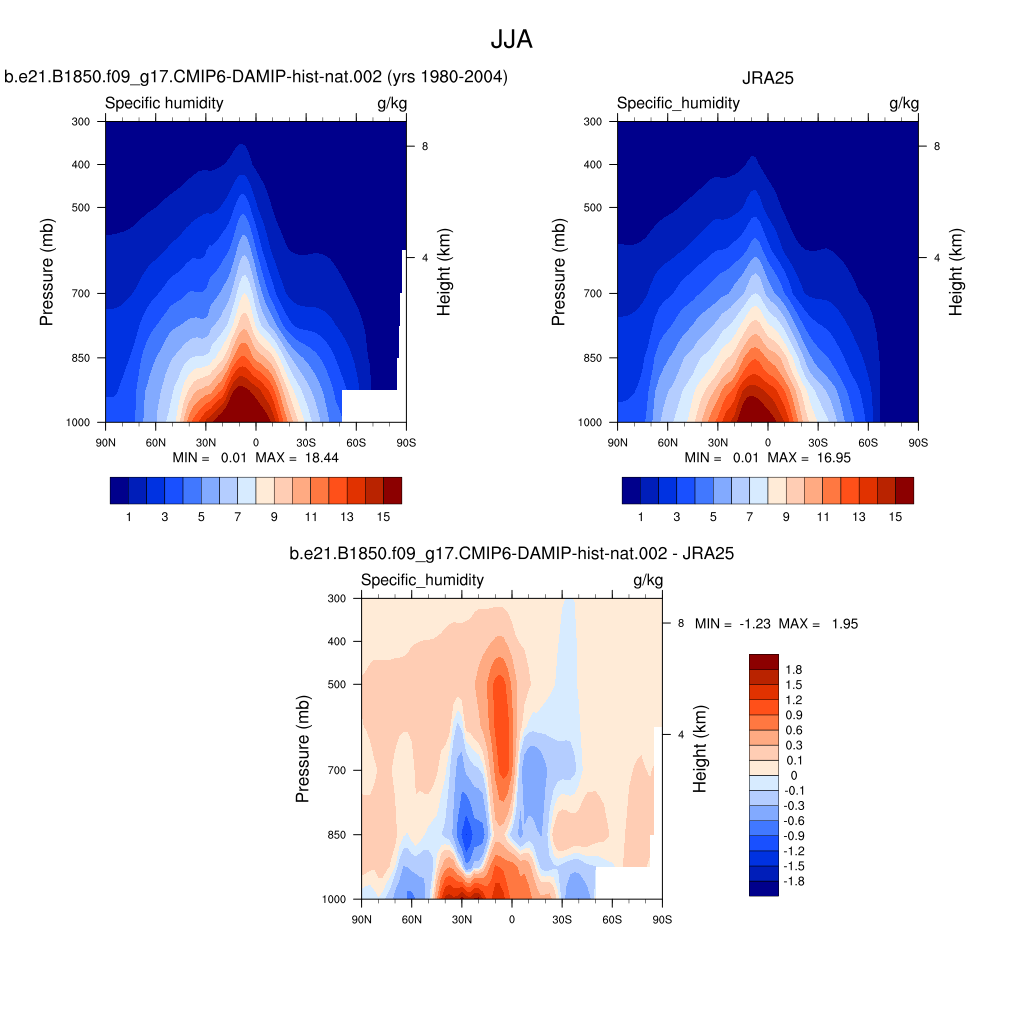
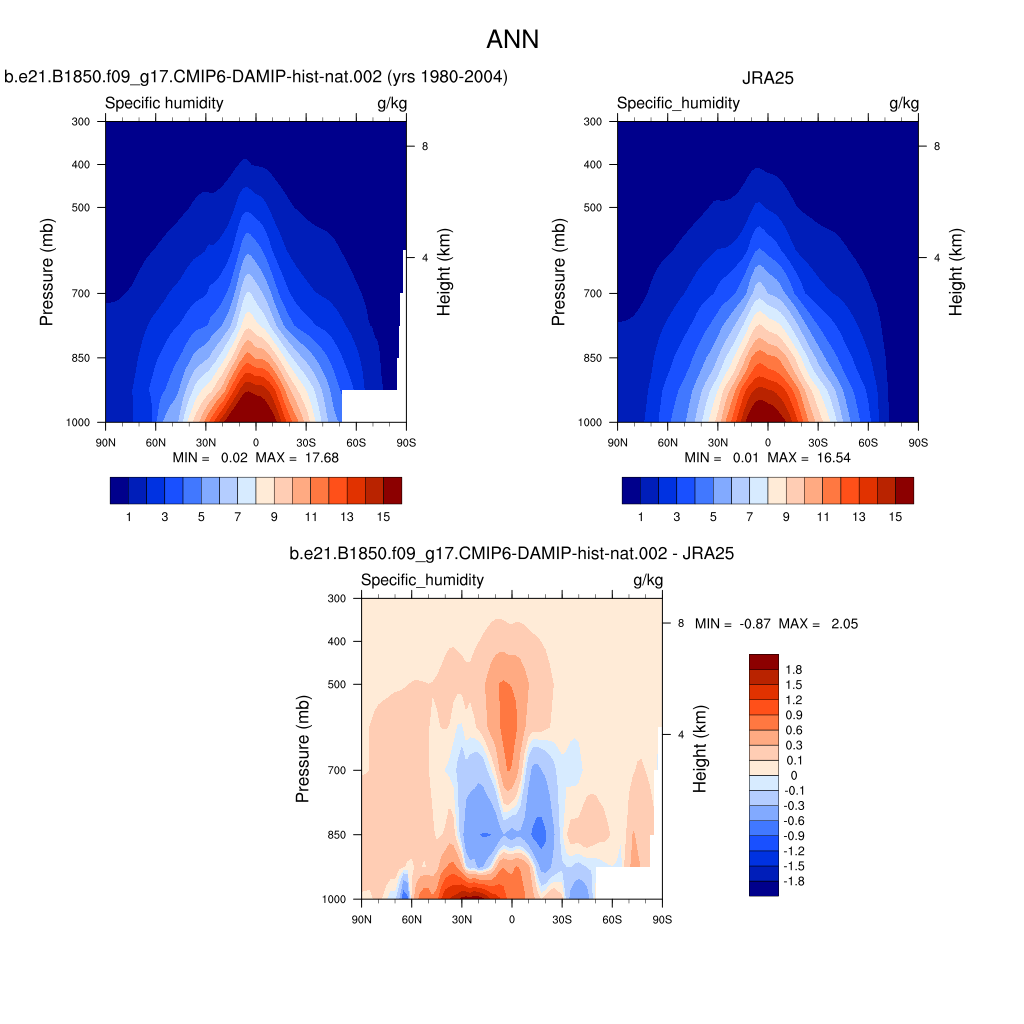
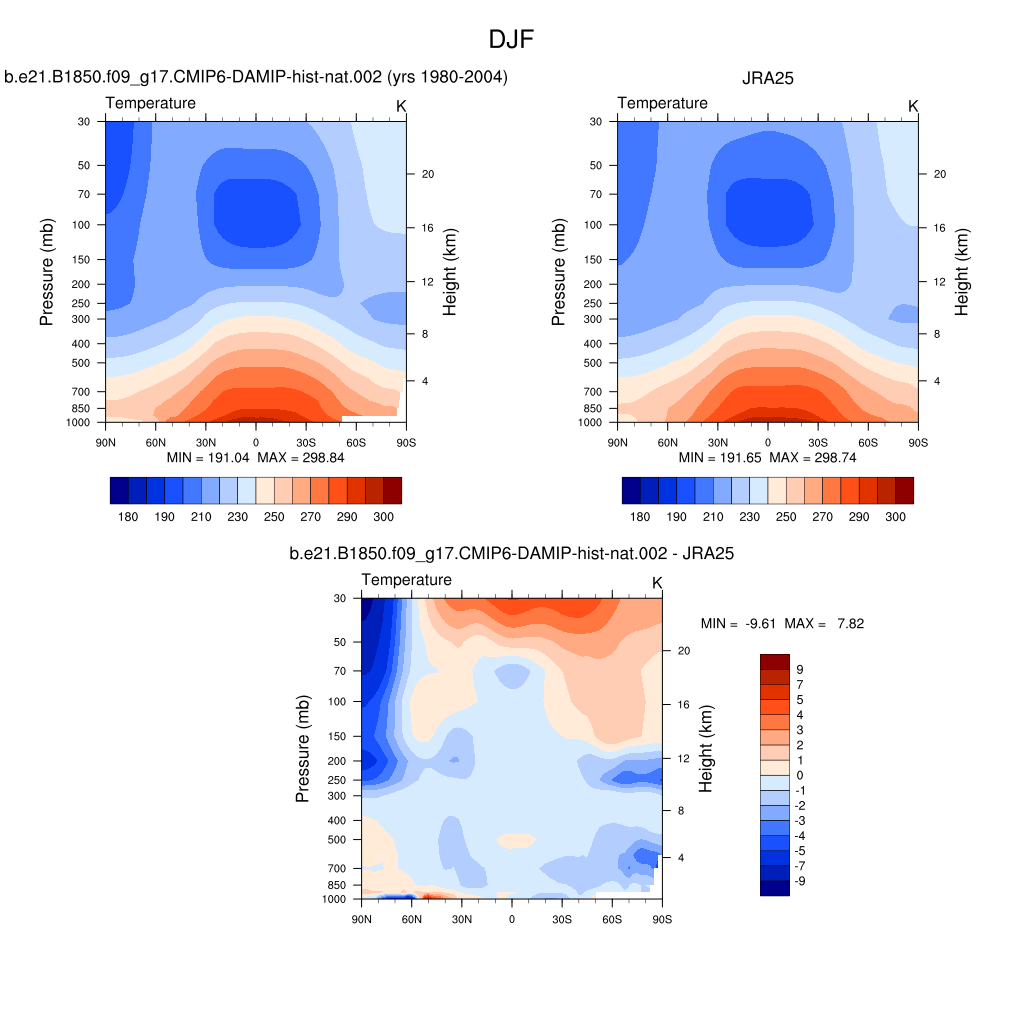
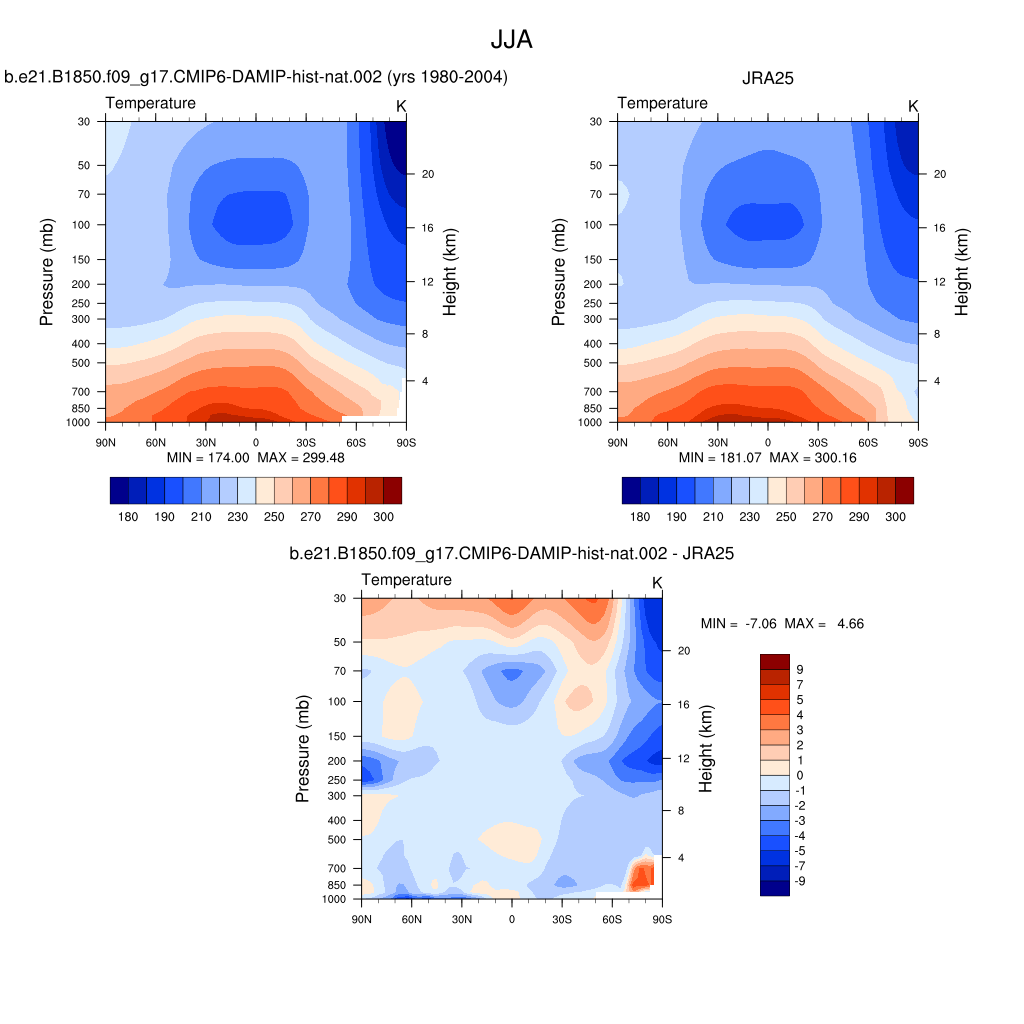
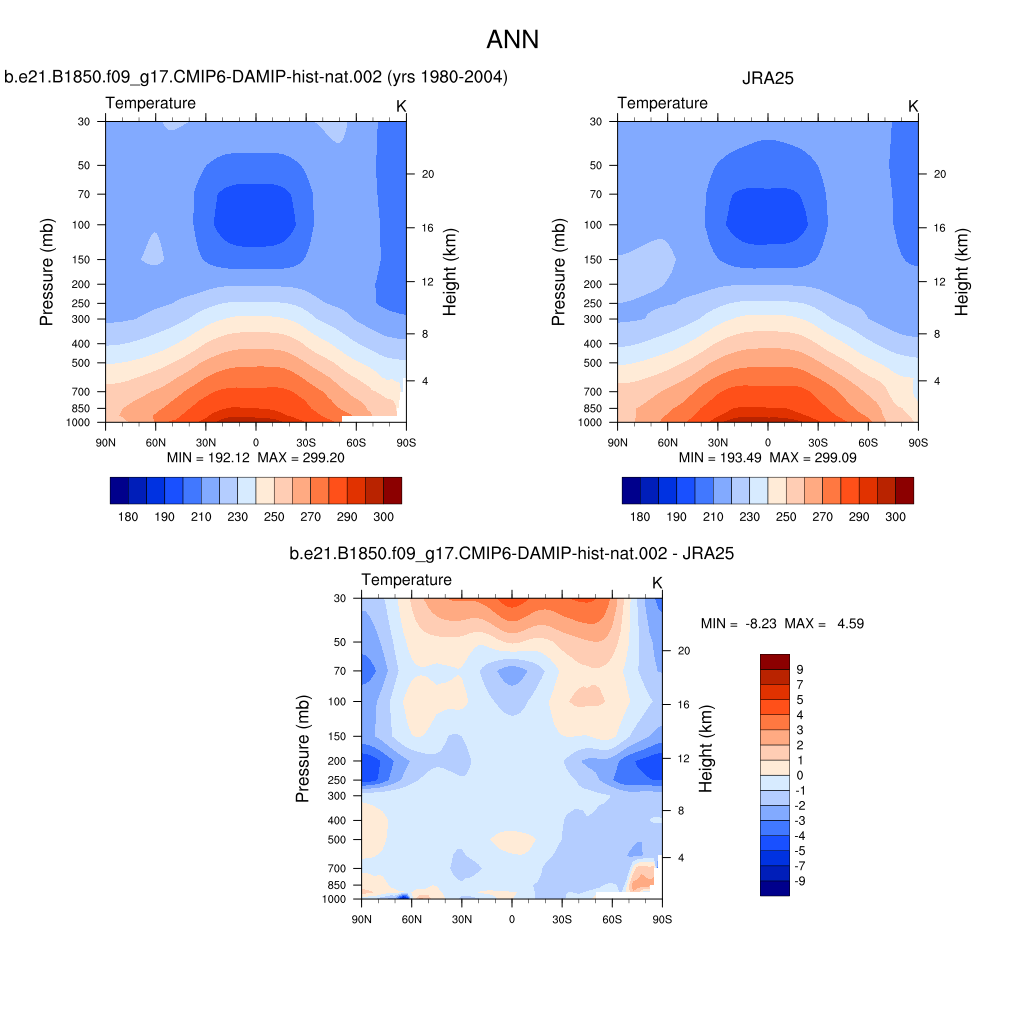
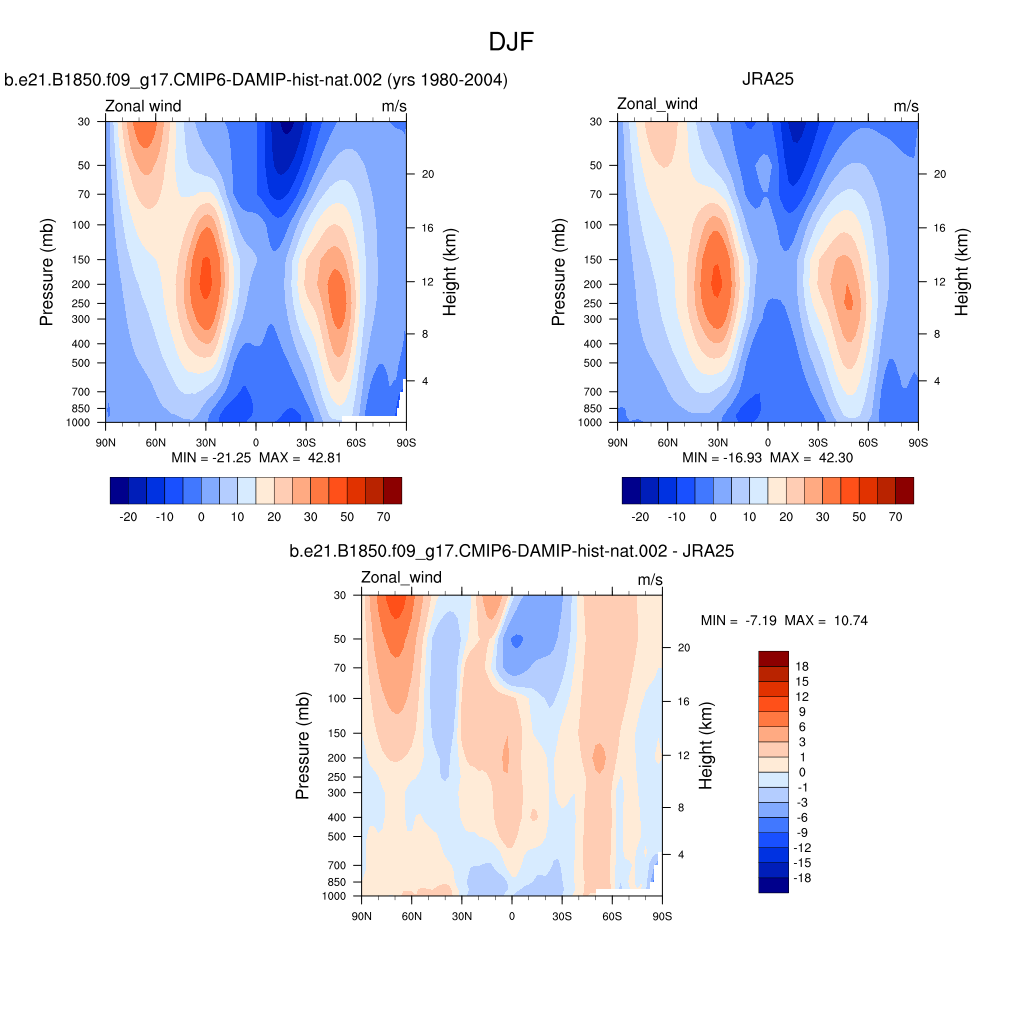
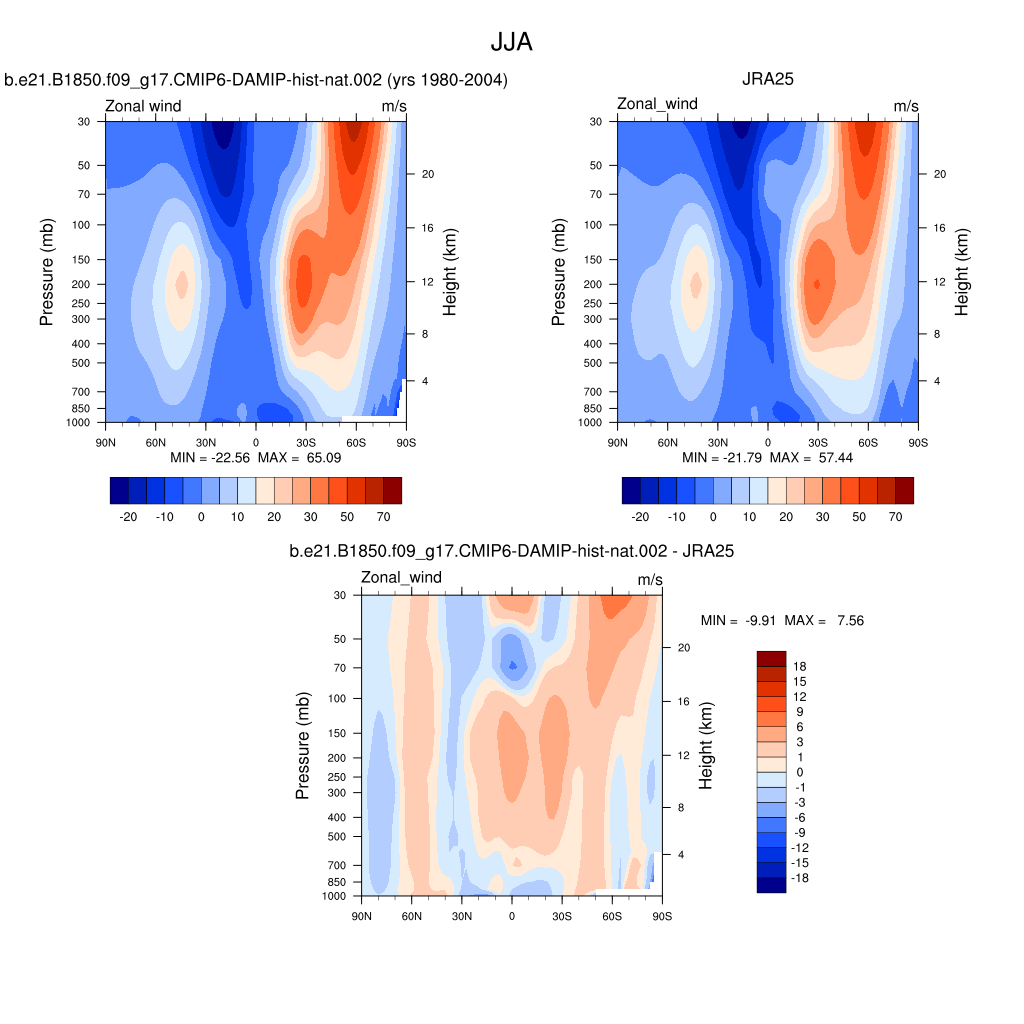
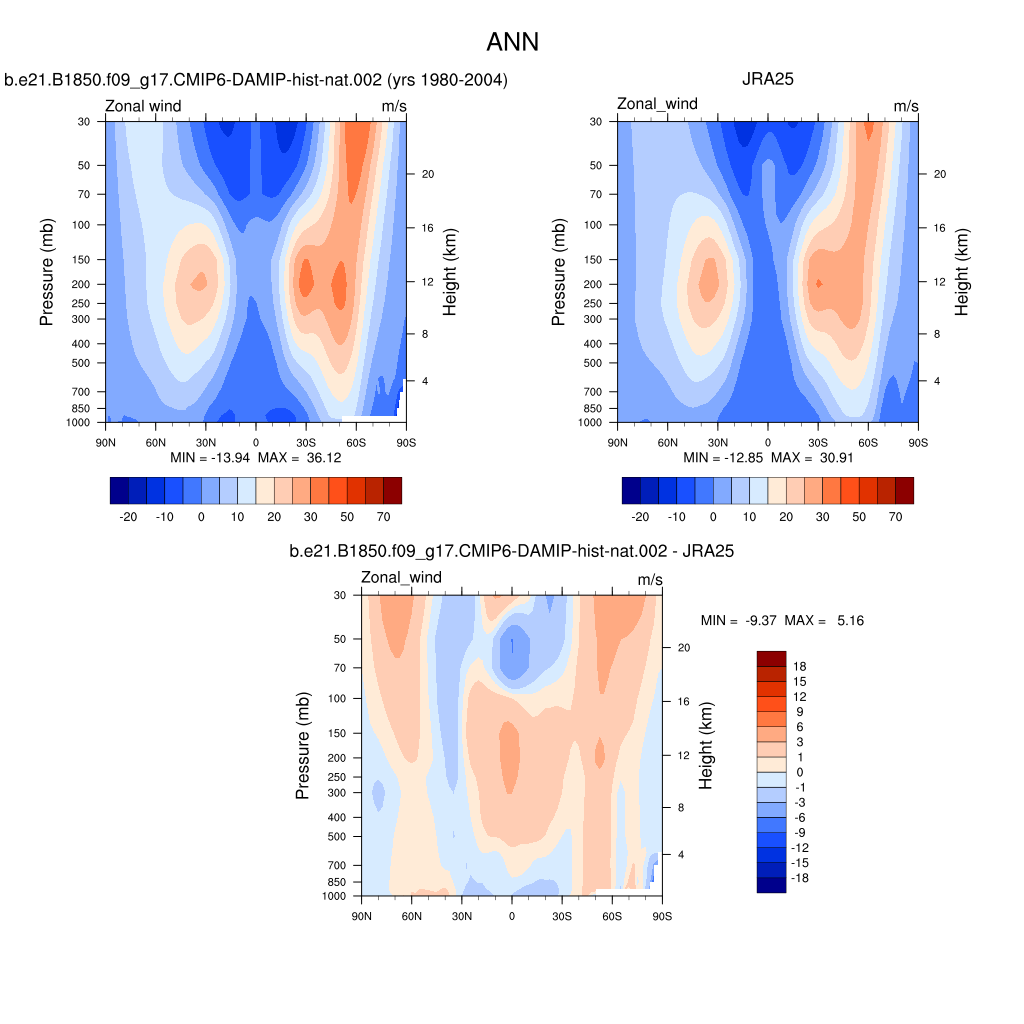
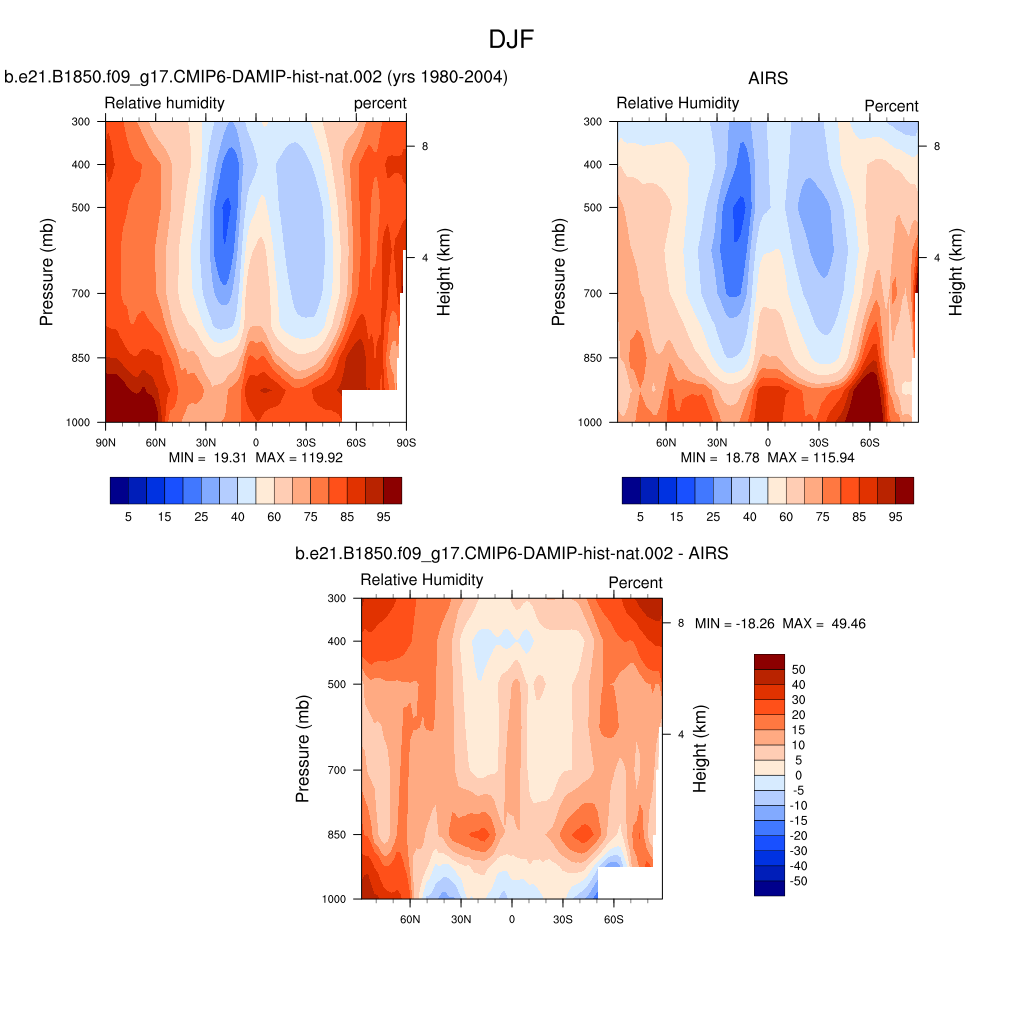
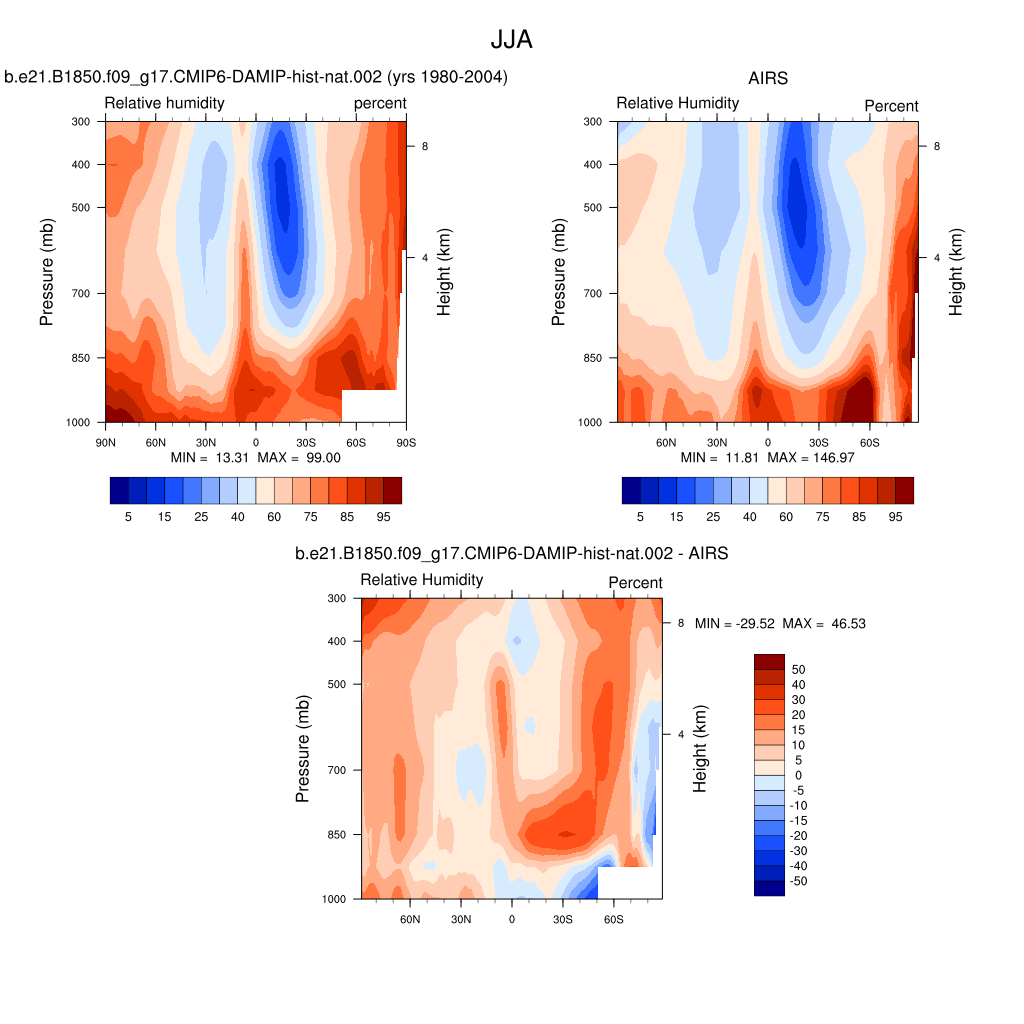
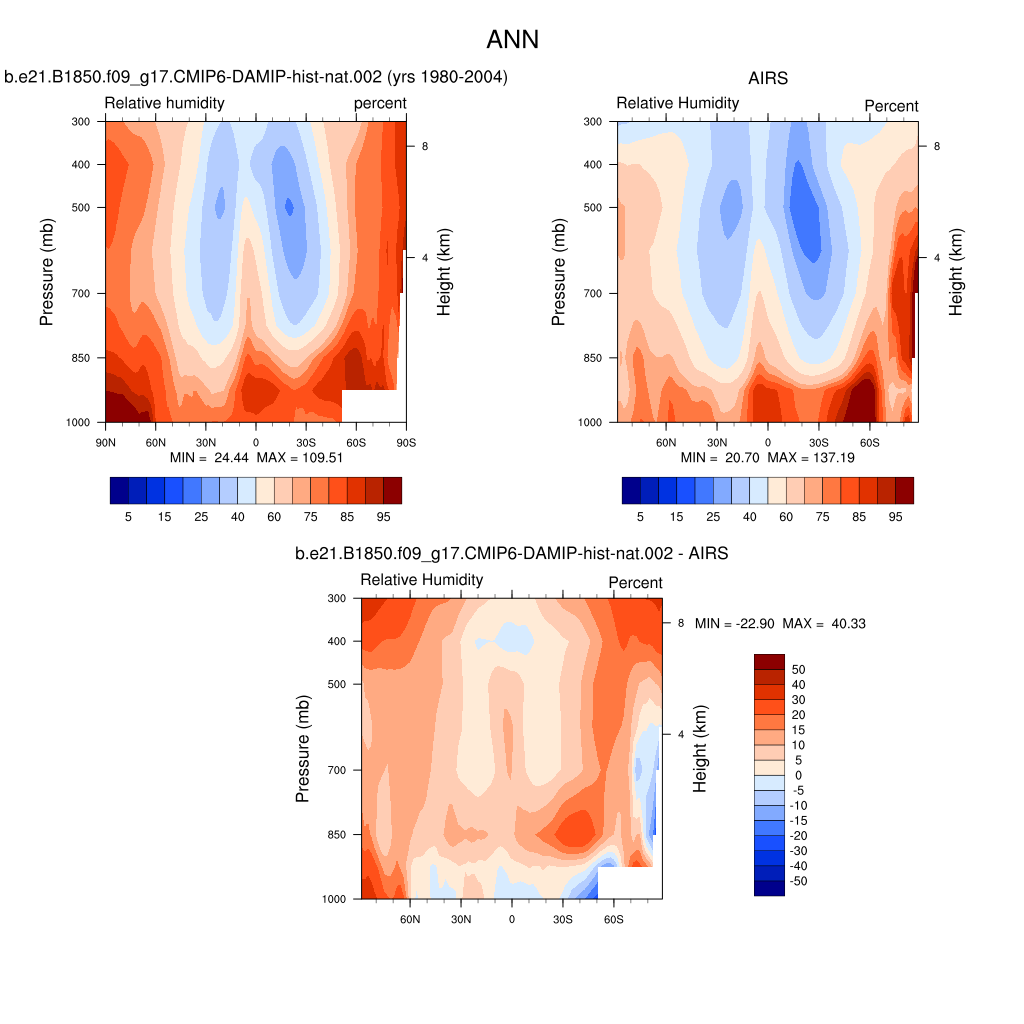
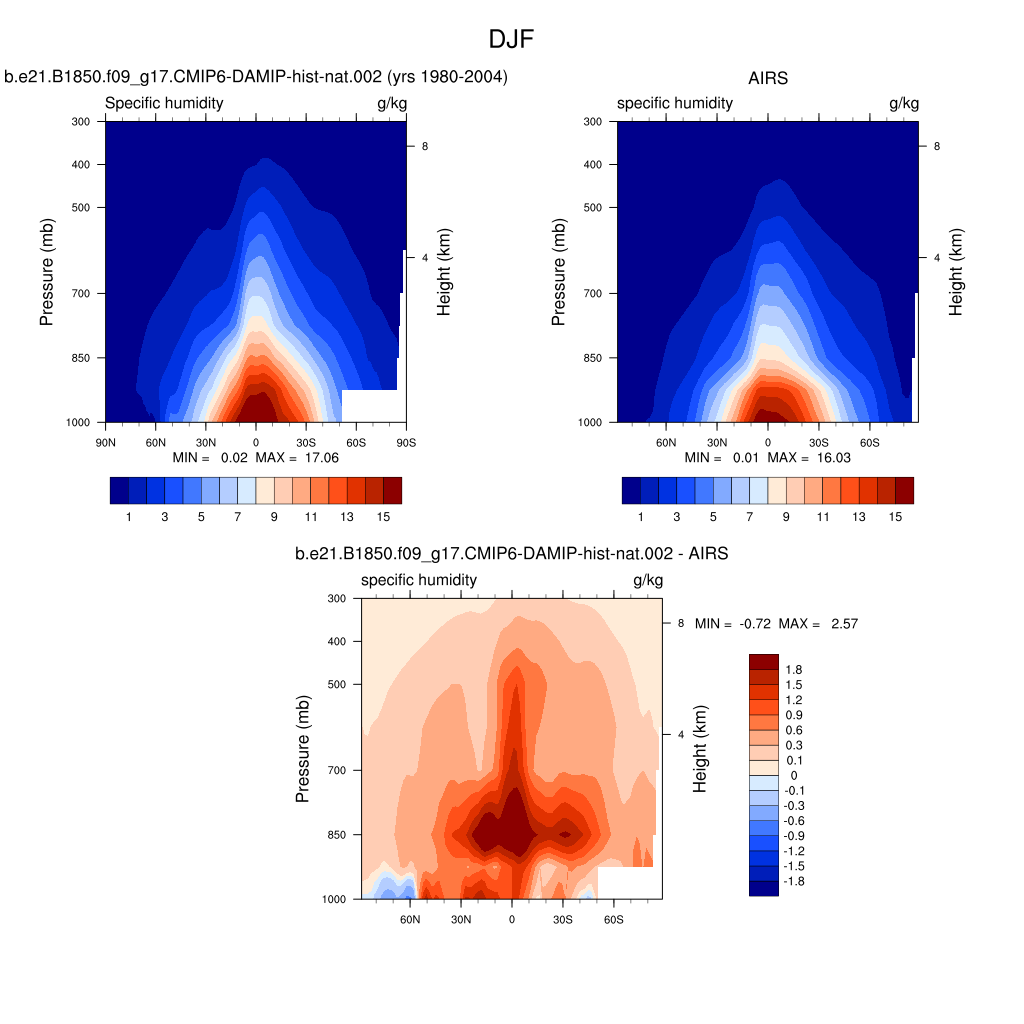
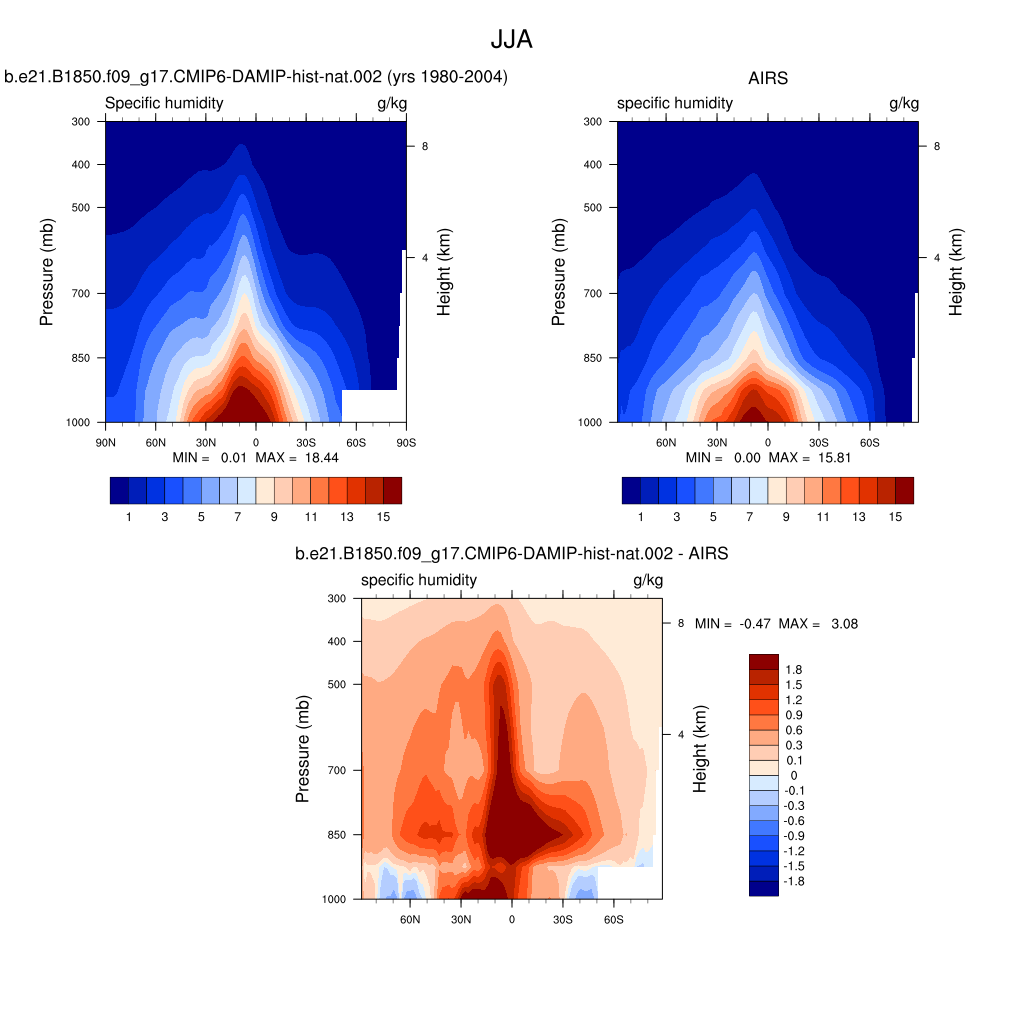
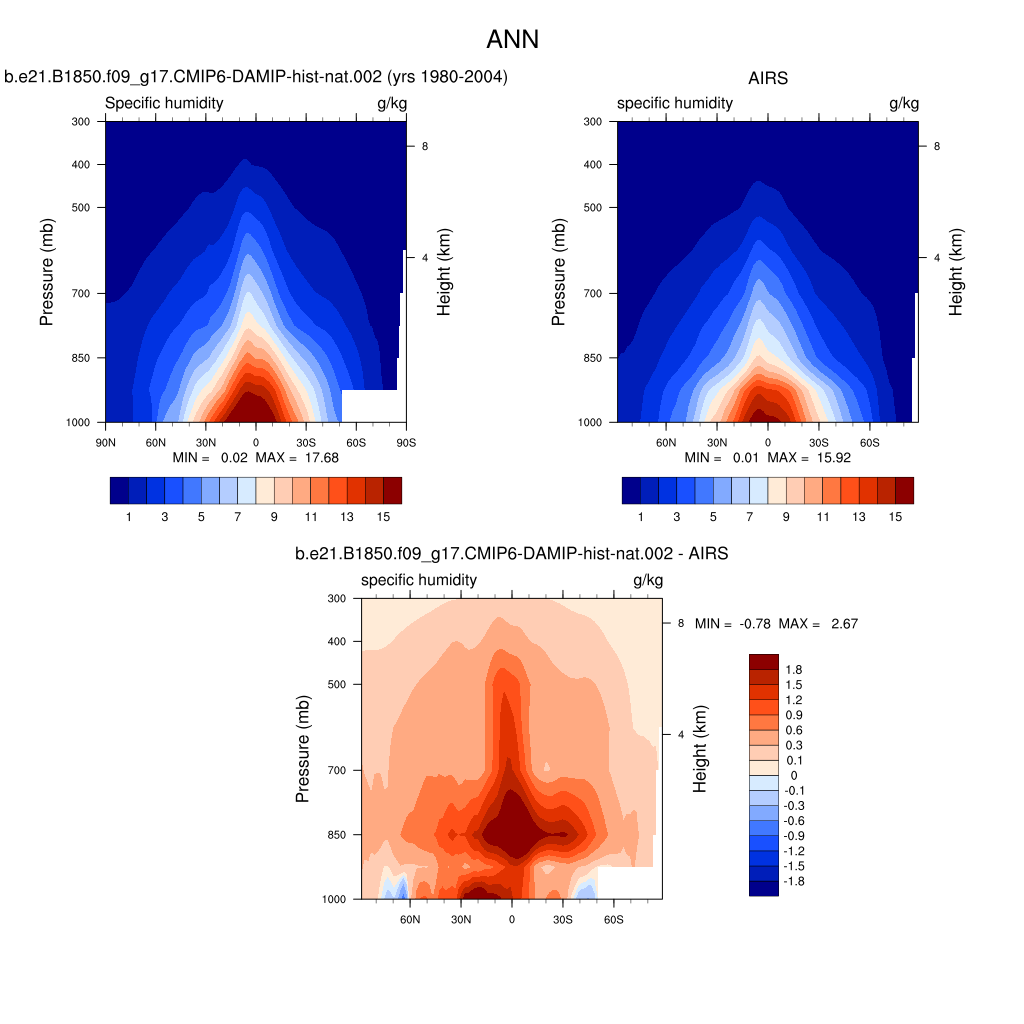
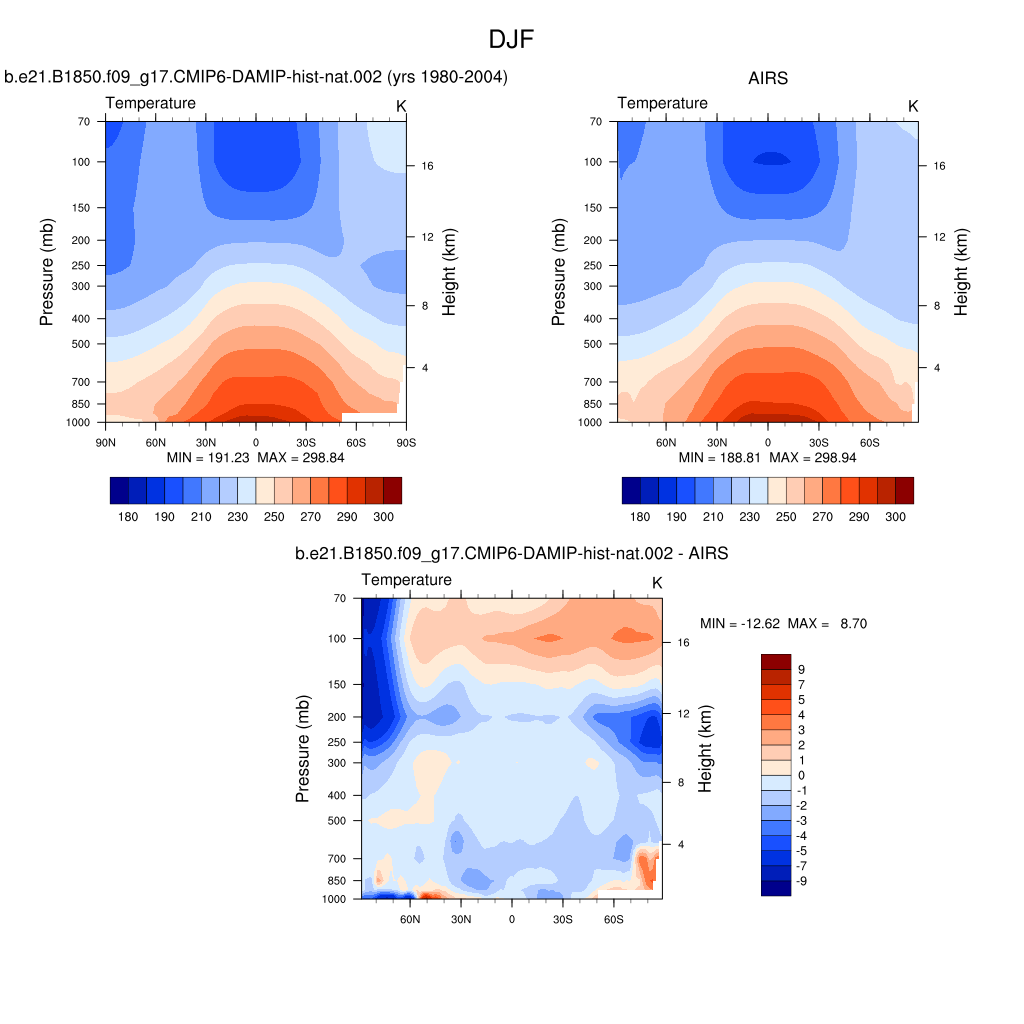
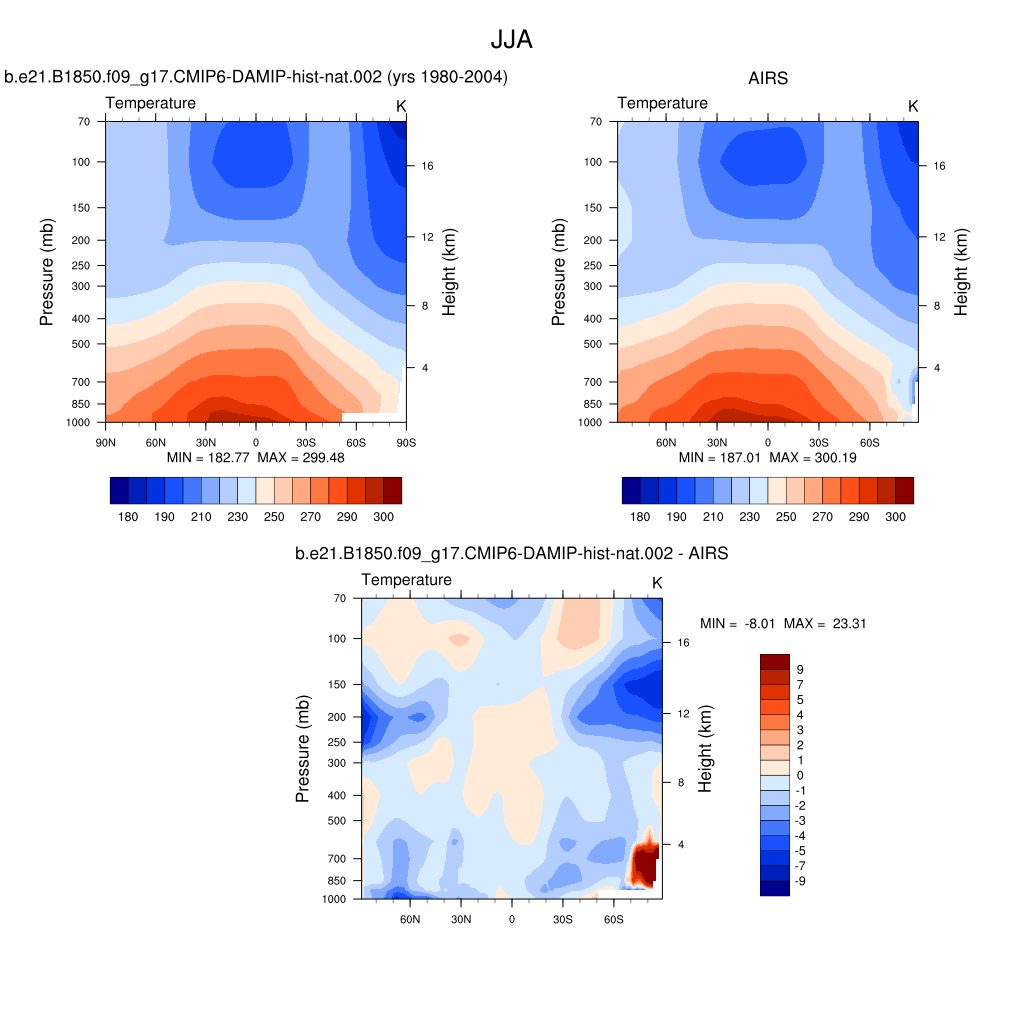
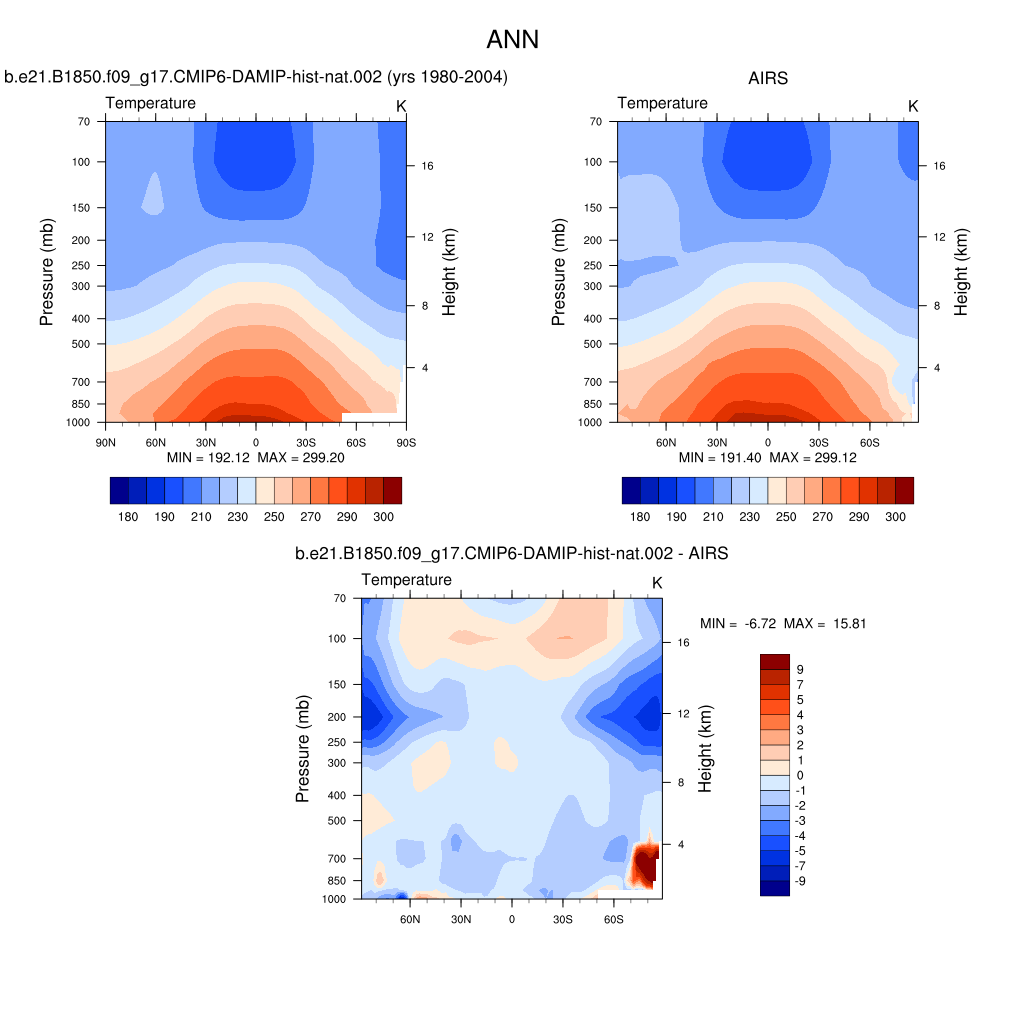
DIAG Set 4 - Vertical contour plots of DJF, JJA and ANN zonal means
| MERRA Analysis 1979-2013 (NASA) | DJF | JJA | ANN | |
|---|---|---|---|---|
| OMEGA * | Pressure vertical velocity | plot | plot | plot |
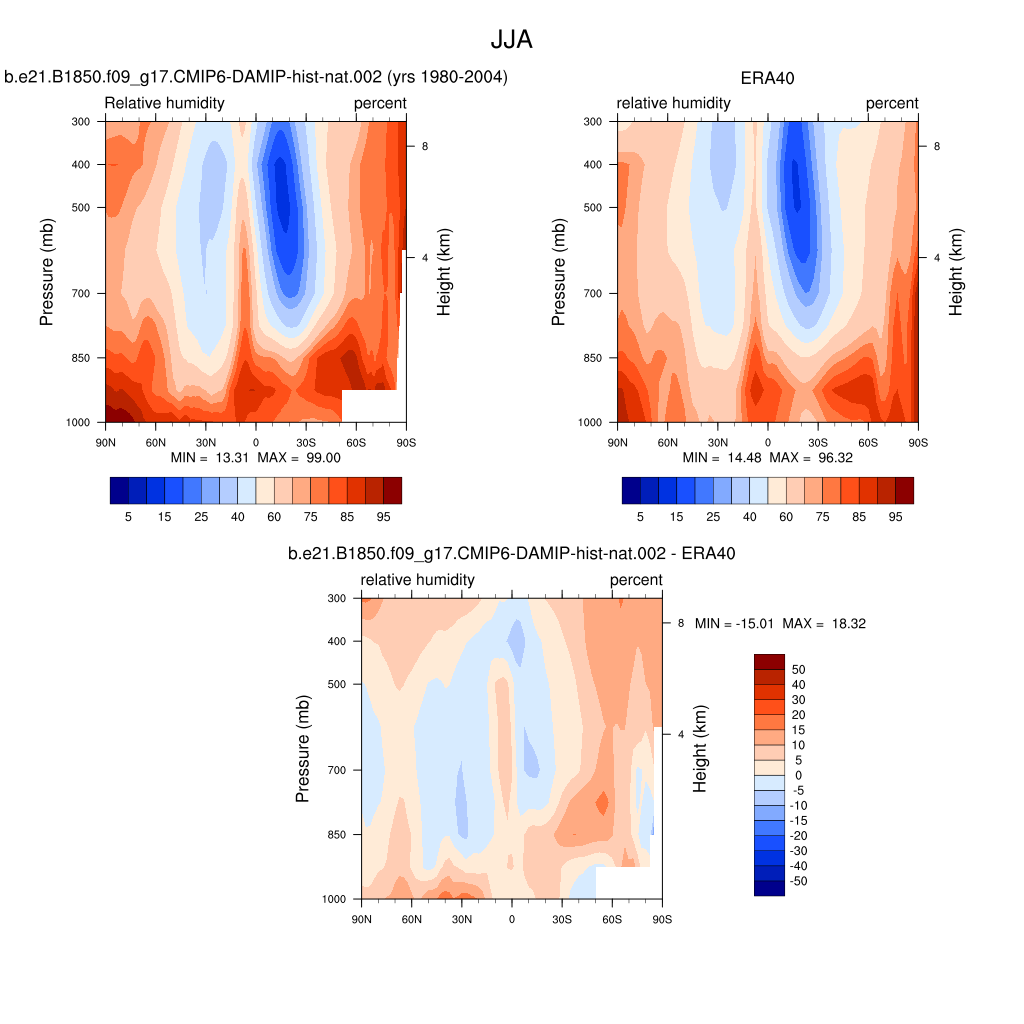
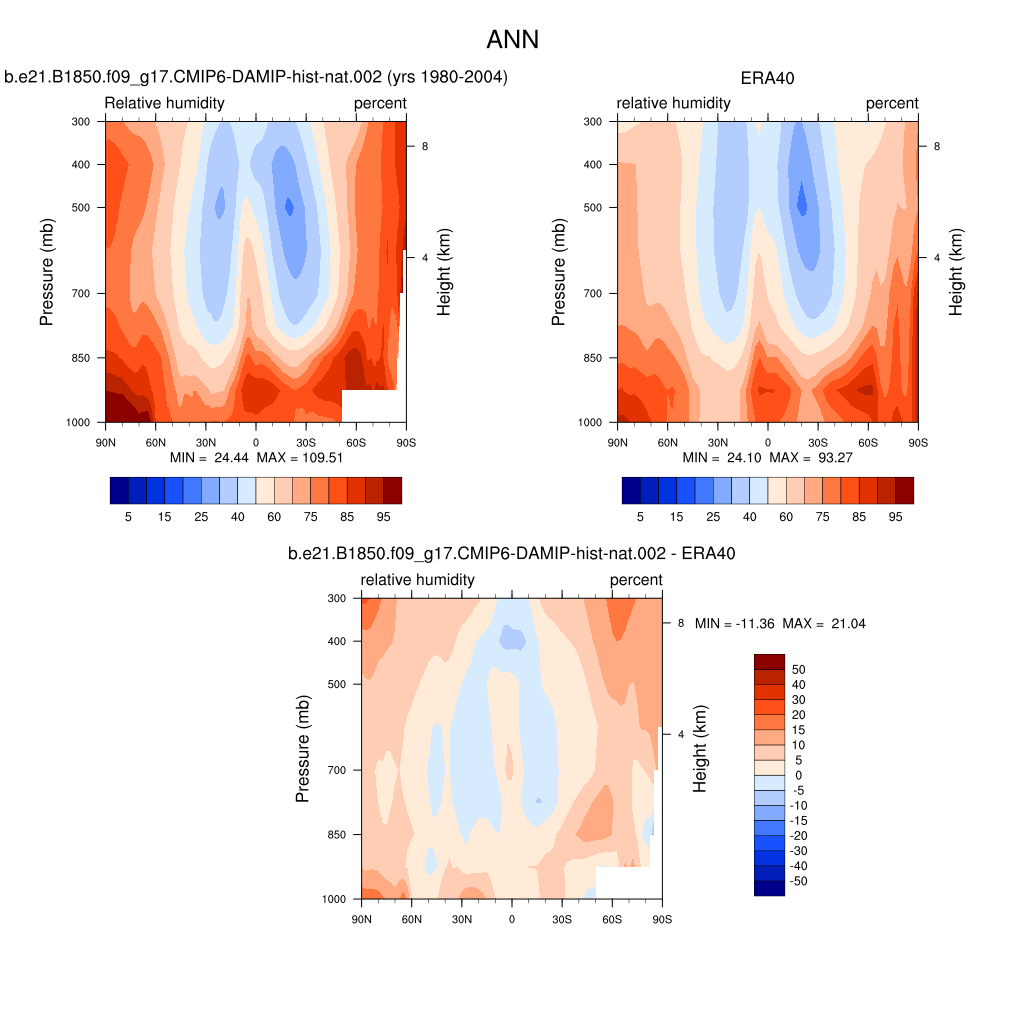
| RELHUM * | Relative humidity | plot | plot | plot |
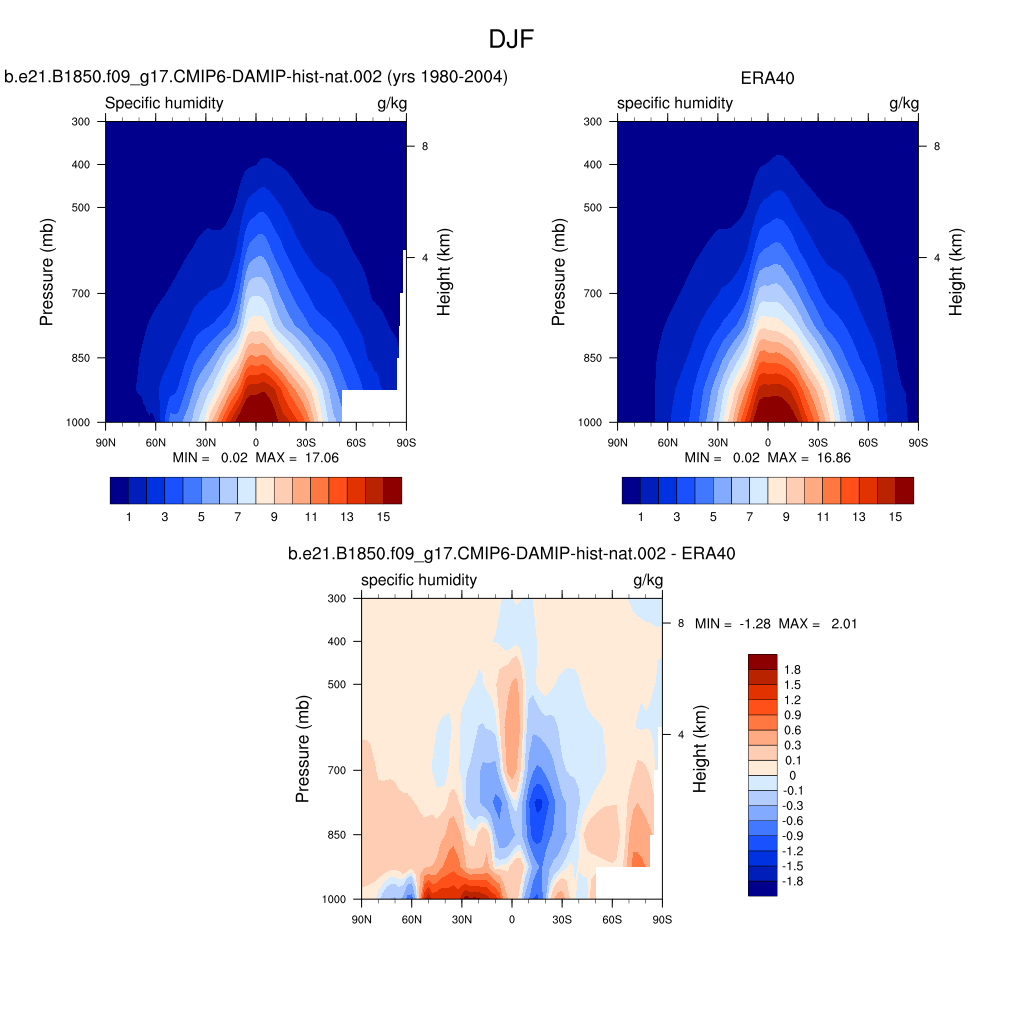
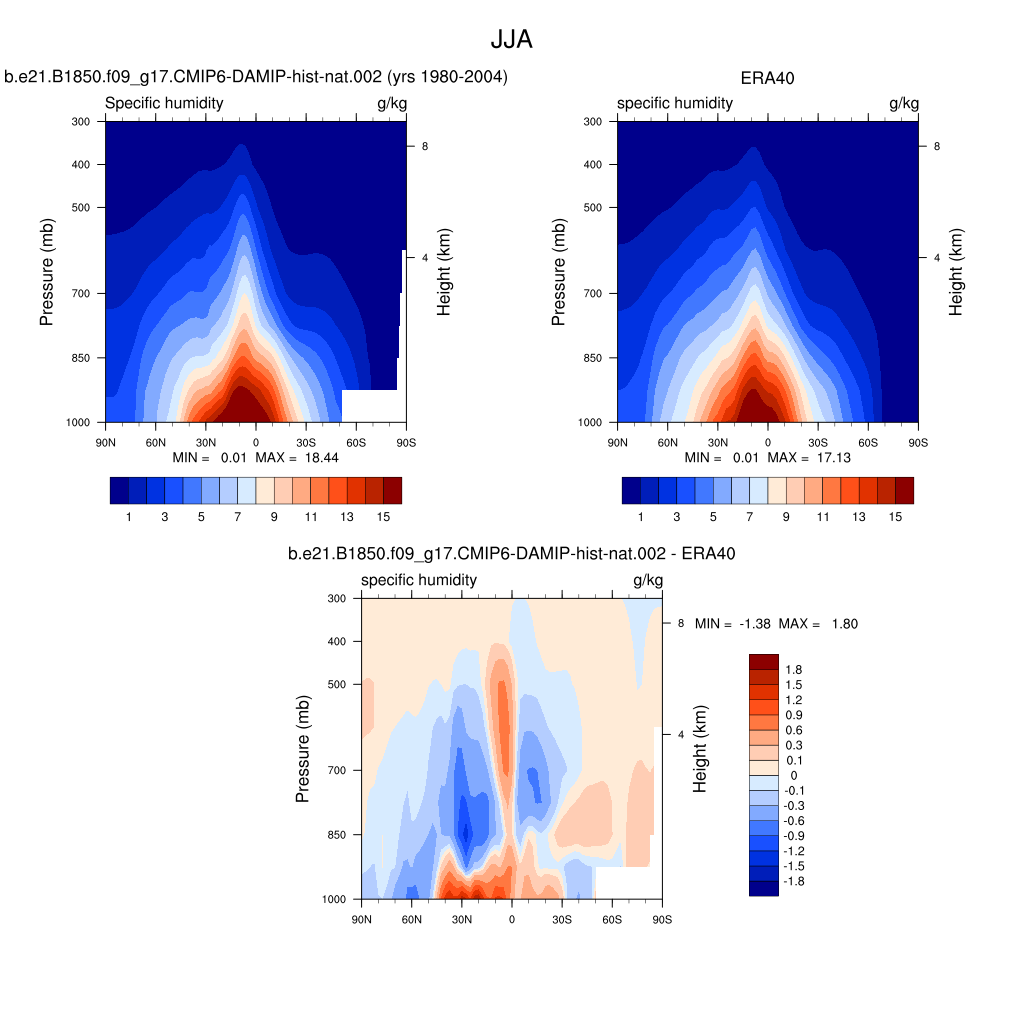
| SHUM * | Specific humidity | plot | plot | plot |
| T * | Temperature | plot | plot | plot |
| U * | Zonal wind | plot | plot | plot |
| ERA40 Reanalysis 1980-2001 | DJF | JJA | ANN | |
| OMEGA * | Pressure vertical velocity | plot | plot | plot |
| RELHUM * | Relative humidity | plot | plot | plot |
| SHUM * | Specific humidity | plot | plot | plot |
| T * | Temperature | plot | plot | plot |
| U * | Zonal wind | plot | plot | plot |
| ERA-Interim Reanalysis 1989-2005 | DJF | JJA | ANN | |
| OMEGA * | Pressure vertical velocity | plot | plot | plot |
| RELHUM * | Relative humidity | plot | plot | plot |
| SHUM * | Specific humidity | plot | plot | plot |
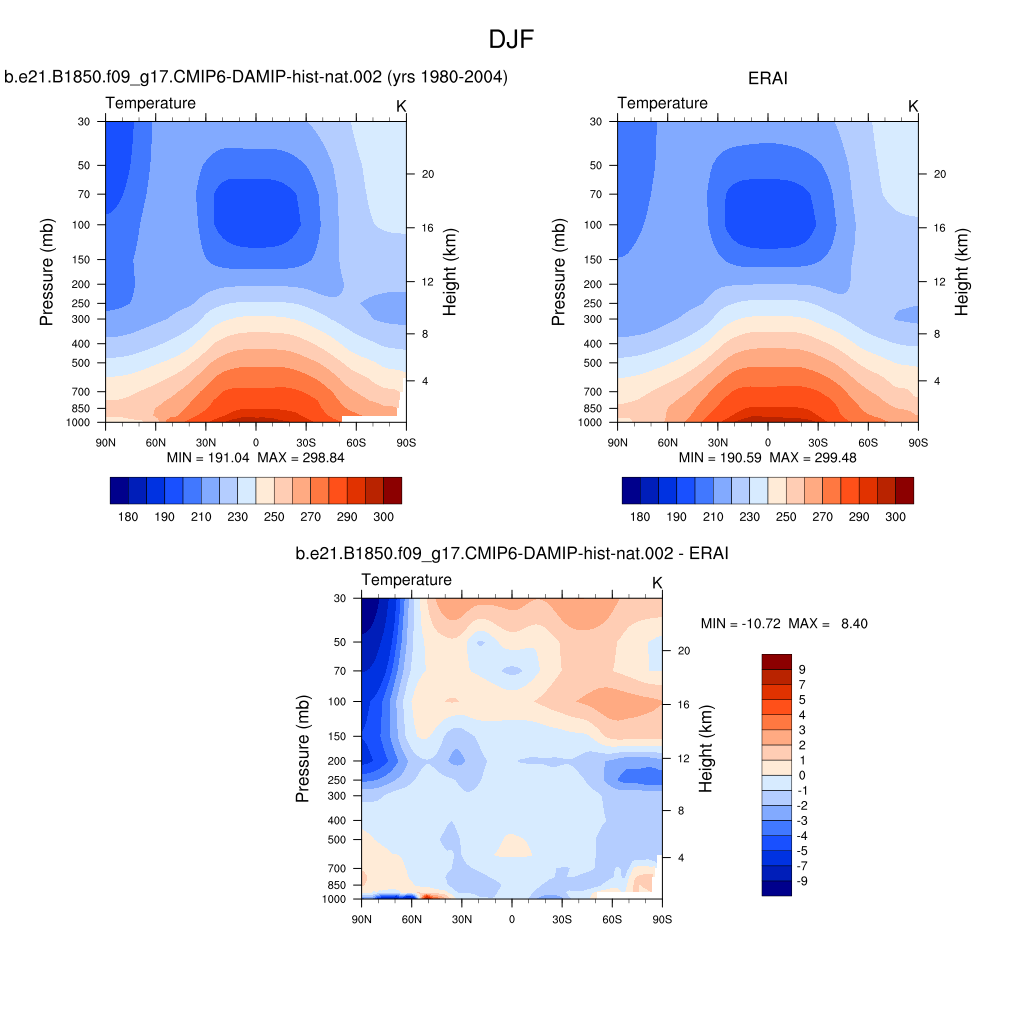
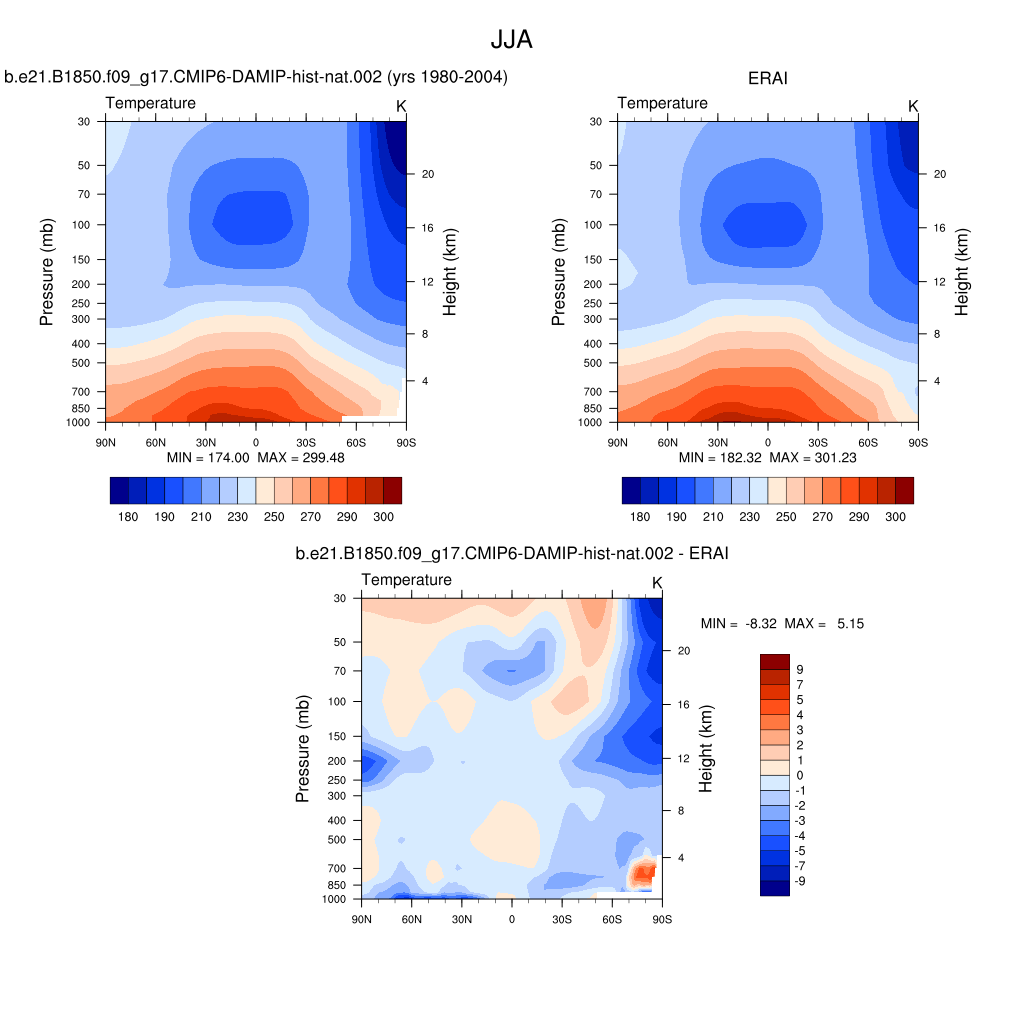
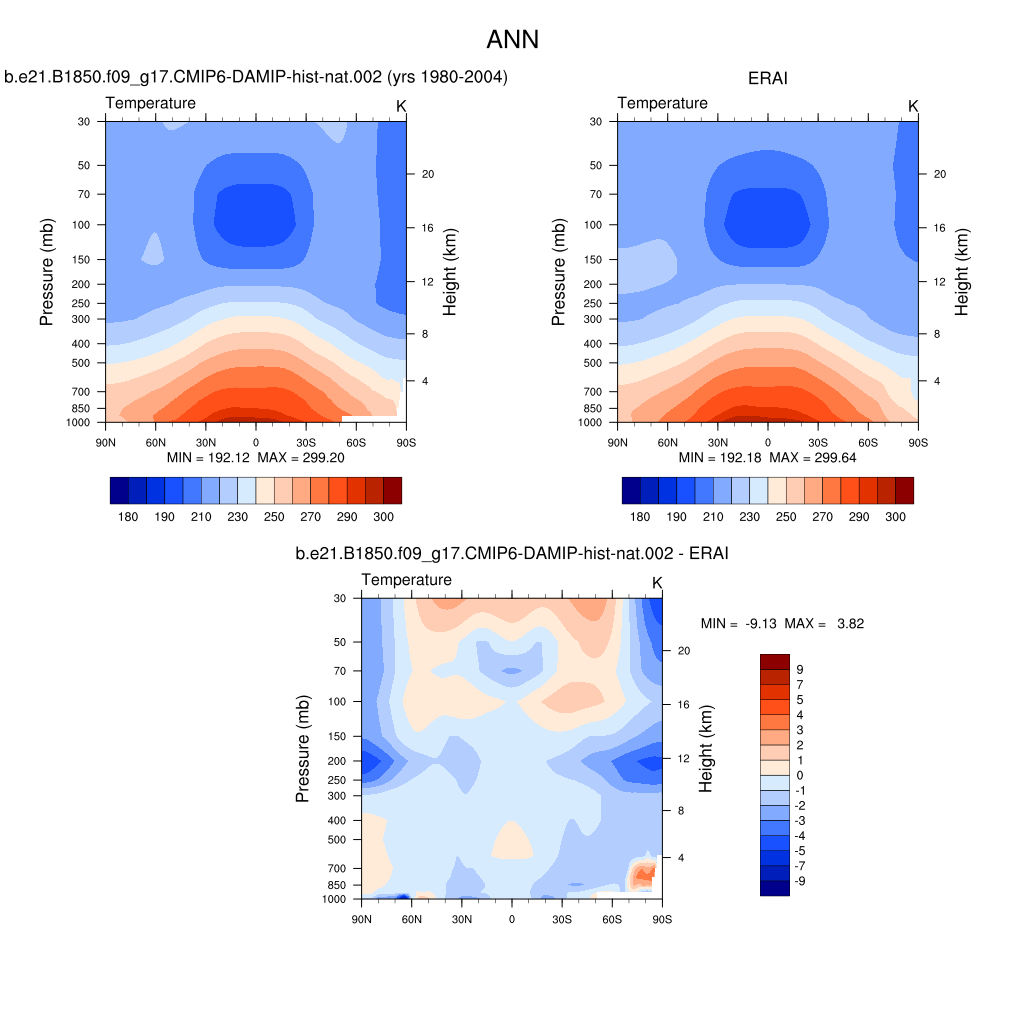
| T * | Temperature | plot | plot | plot |
| JRA25 Reanalysis 1979-04 | DJF | JJA | ANN | |
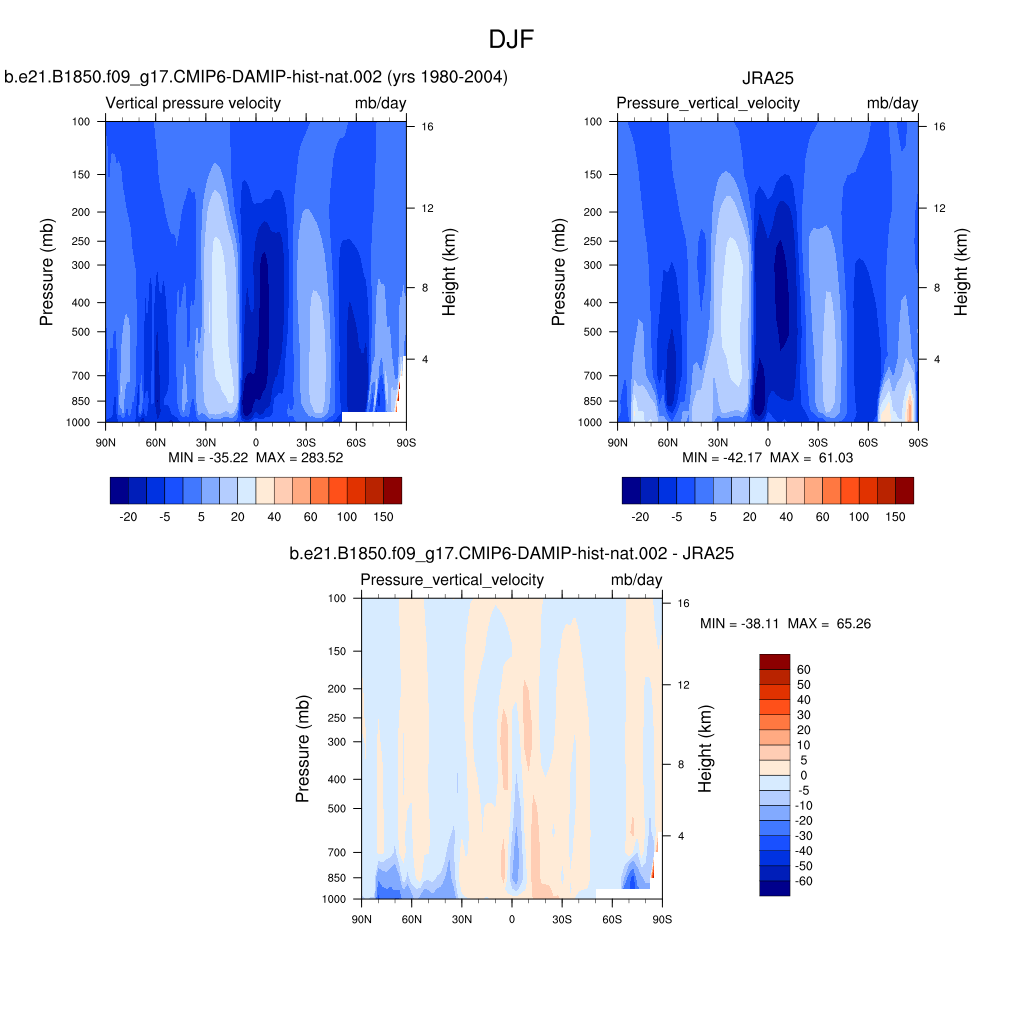
| OMEGA * | Pressure vertical velocity | plot | plot | plot |
| SHUM * | Specific humidity | plot | plot | plot |
| T * | Temperature | plot | plot | plot |
| U * | Zonal wind | plot | plot | plot |
| AIRS IR Sounder 2002-06 | DJF | JJA | ANN | |
| RELHUM * | Relative humidity | plot | plot | plot |
| SHUM * | Specific humidity | plot | plot | plot |
| T * | Temperature | plot | plot | plot |
| CFMIP Observation Simulator Package (COSP) | ||||
| CLOUDSAT-COSP From Level 2 GEOPROF Jun2006-Nov2010 | DJF | JJA | ANN | |
| CFAD_DBZE94_CS | Hydrometeor occurrence (dBZe > -25) (COSP) | plot | plot | plot |