 b.e21.B1PCT.f09_g17.CMIP6-1pctCO2-bgc.001
and
OBS data (info)
b.e21.B1PCT.f09_g17.CMIP6-1pctCO2-bgc.001
and
OBS data (info)
DIAG Sets 5 & 6 - Horizontal contour/vector plots of DJF, JJA and ANN means
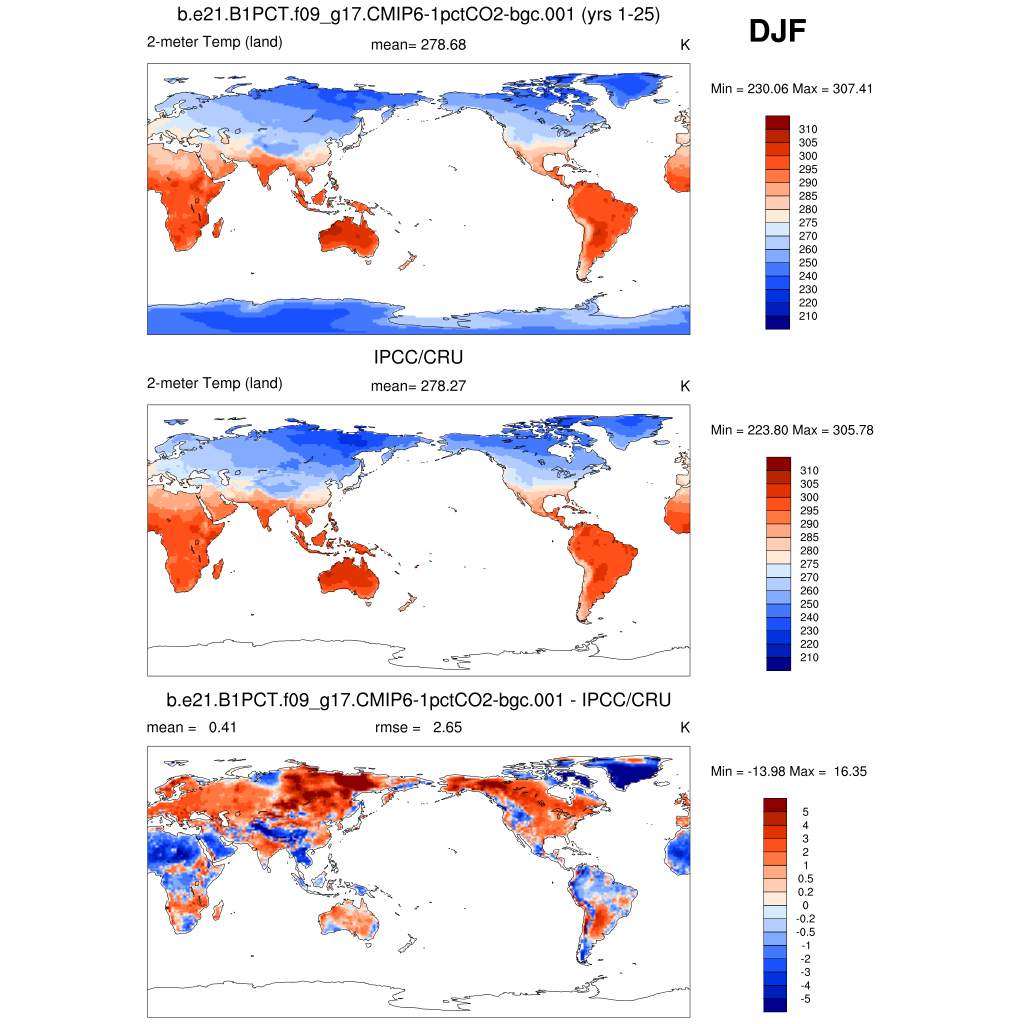
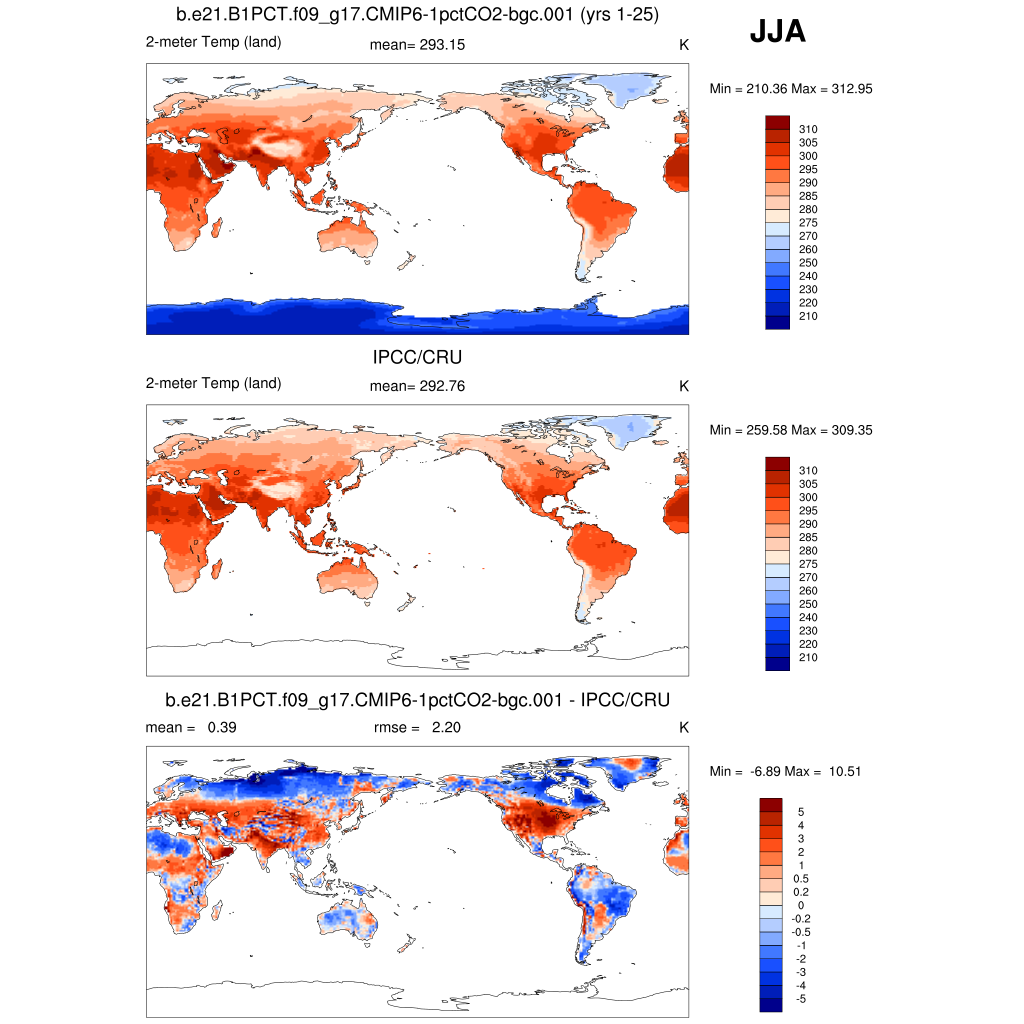
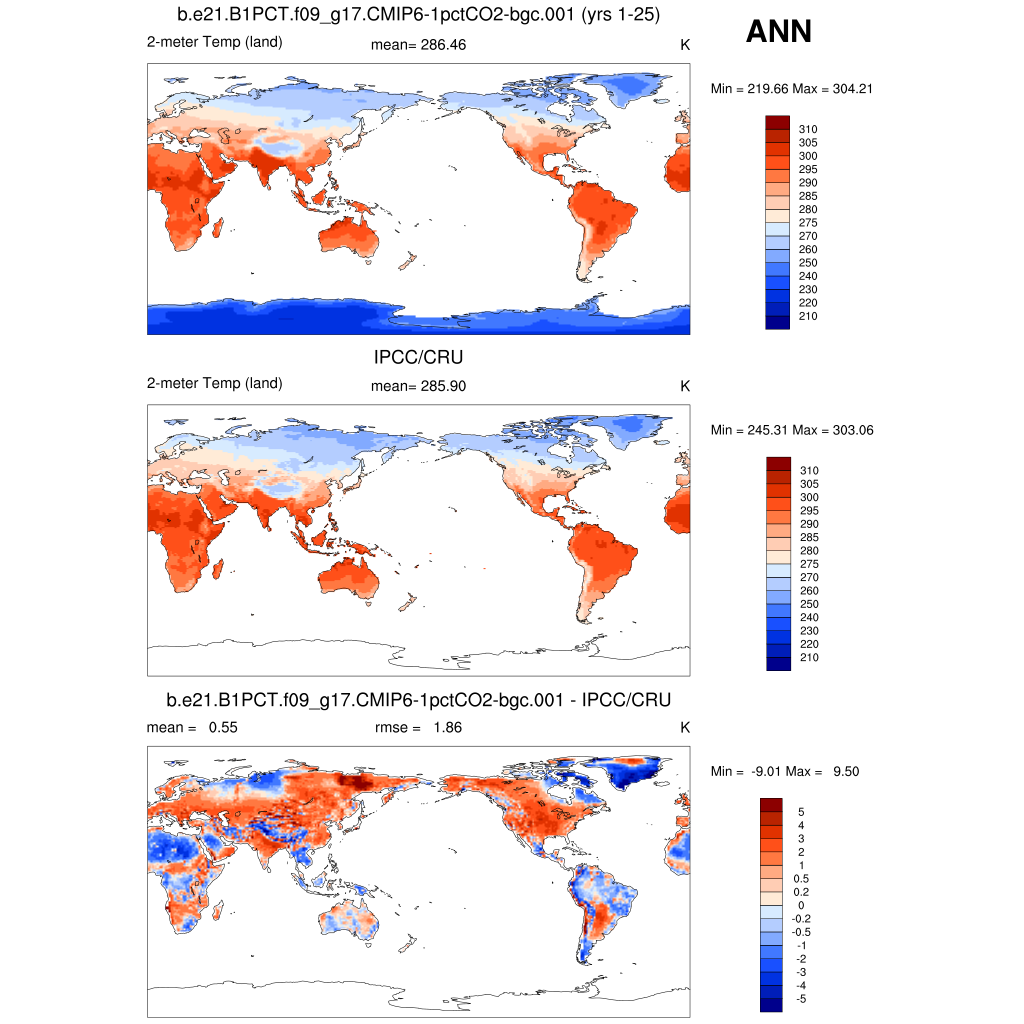
| IPCC/CRU climatology 1961-90 | DJF | JJA | ANN | |
|---|---|---|---|---|
| TREFHT | 2-meter air temperature (land) | plot | plot | plot |
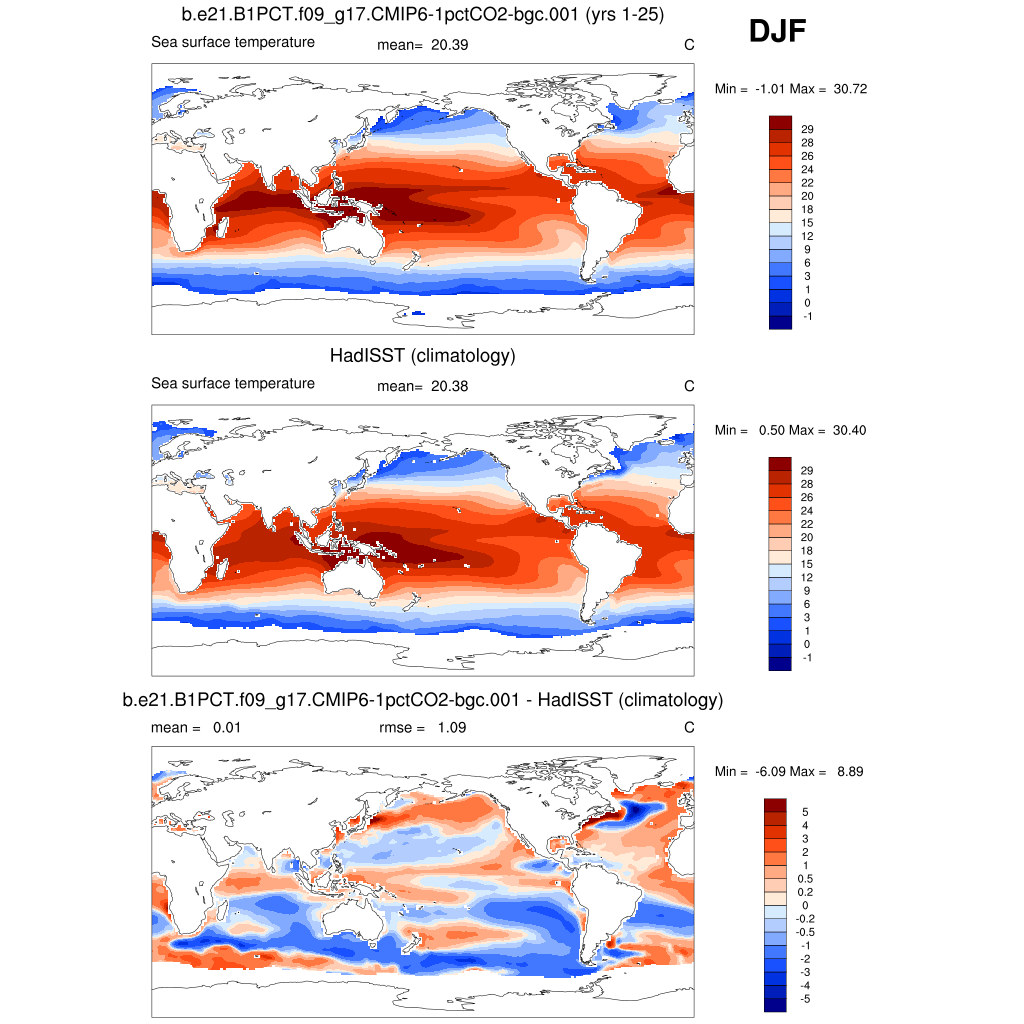
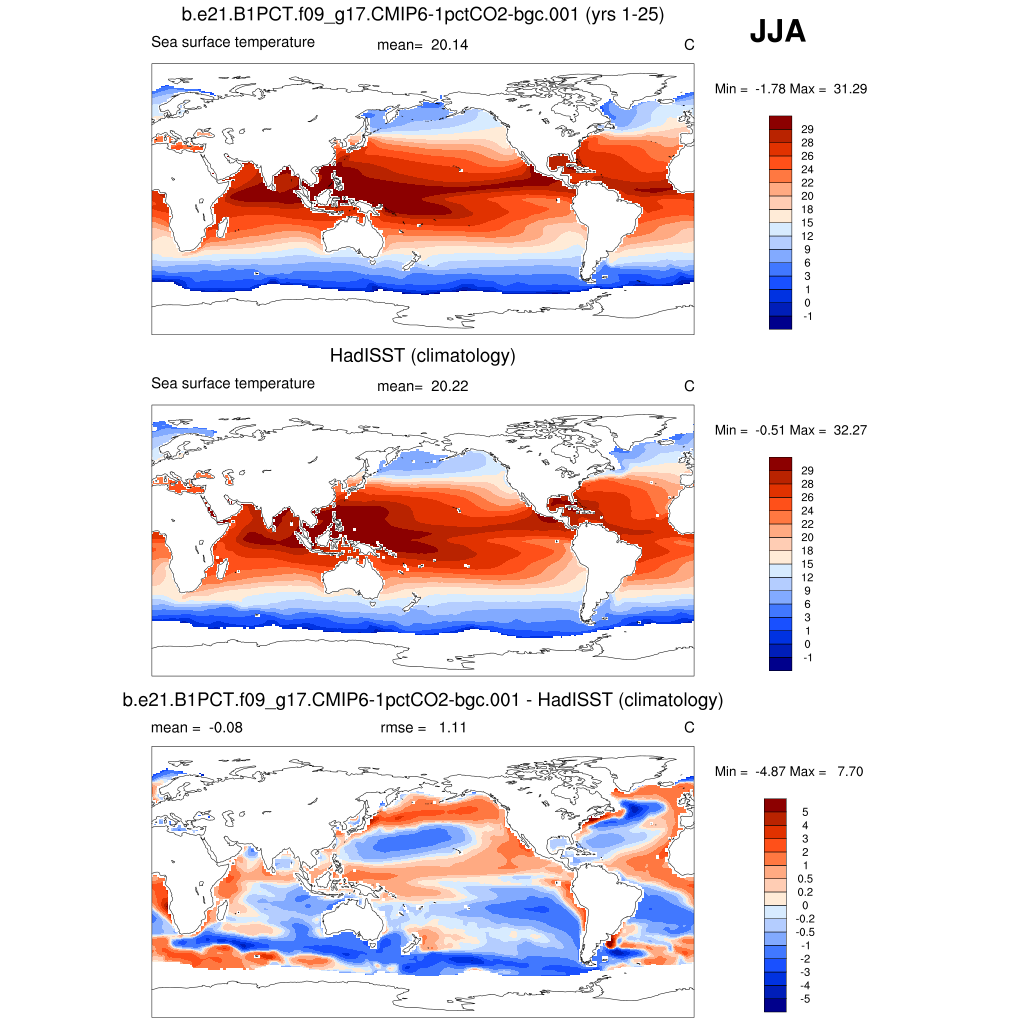
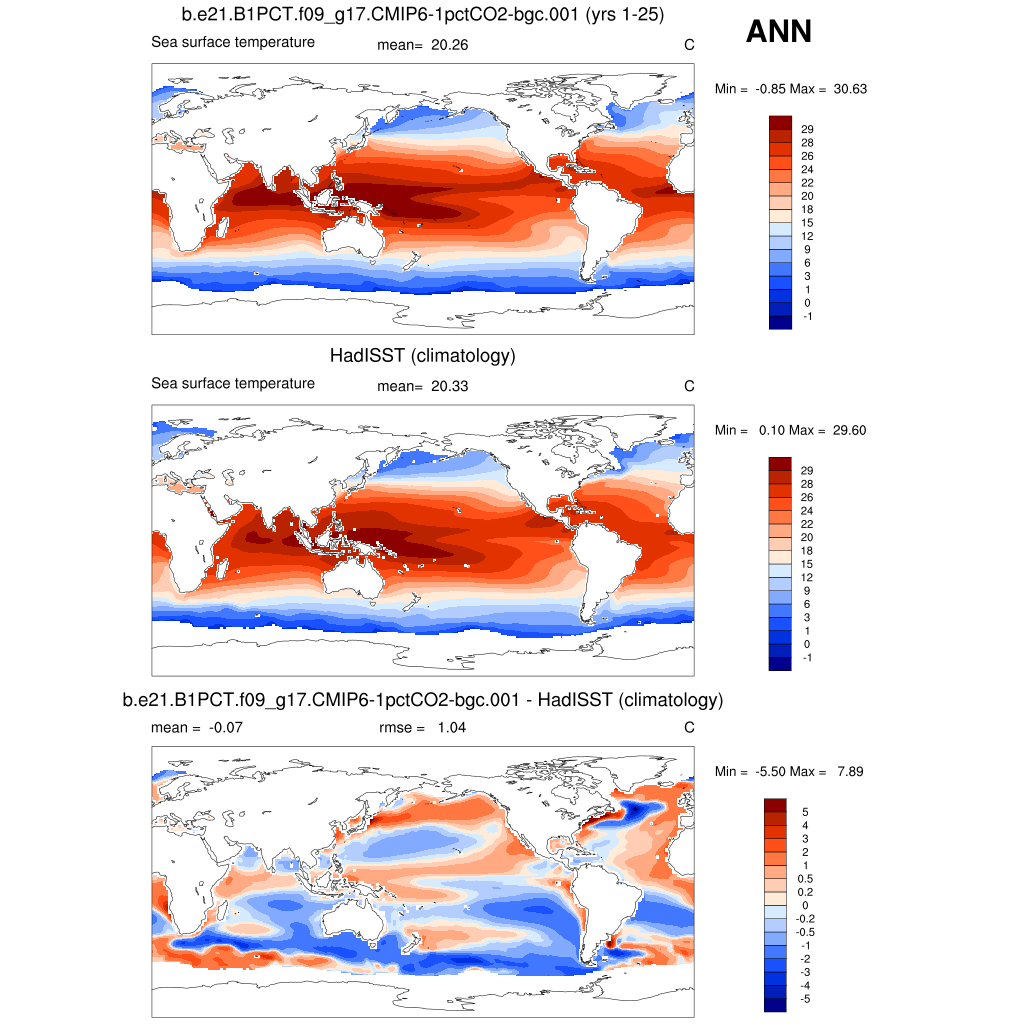
| HadISST/OI.v2 (Climatology) 1982-2001 | DJF | JJA | ANN | |
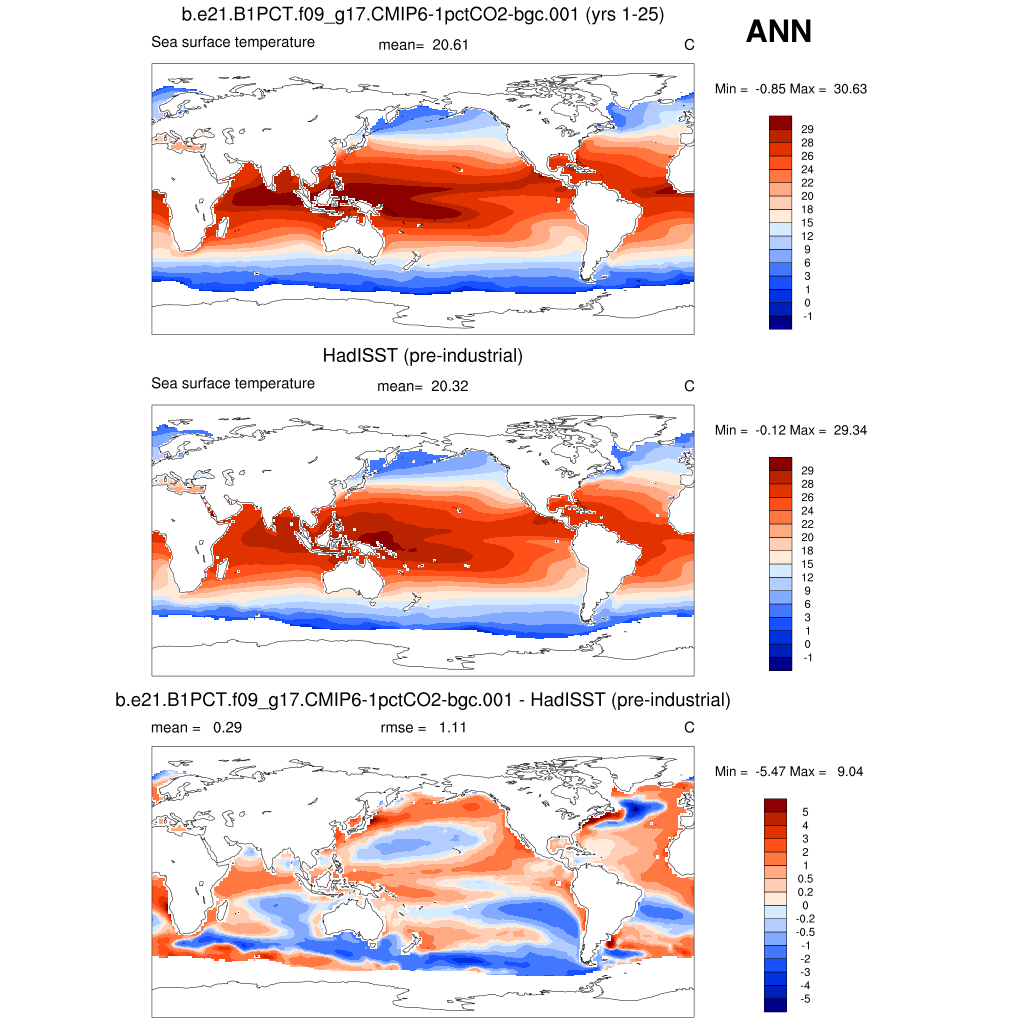
| SST | sea surface temperature | plot | plot | plot |
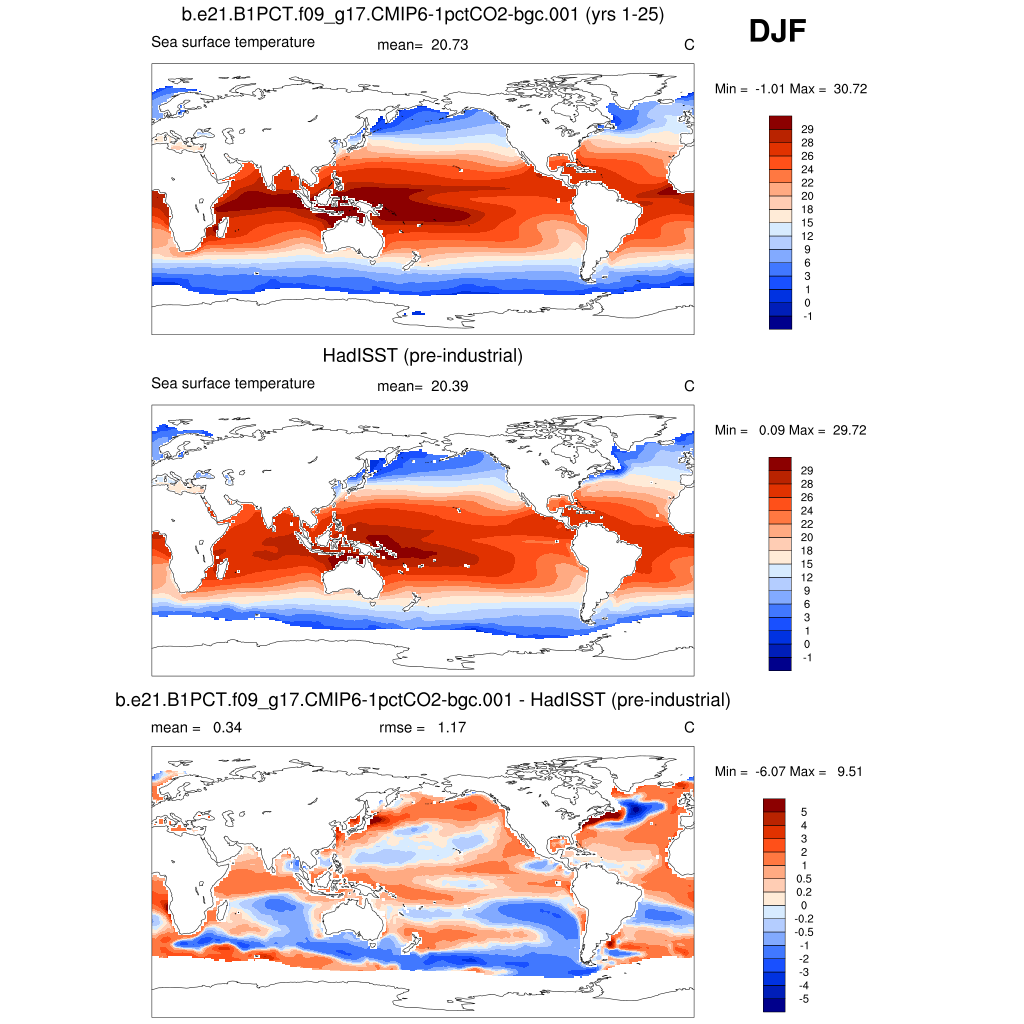
| HadISST/OI.v2 (Pre-Indust) 1870-1900 | DJF | JJA | ANN | |
| SST | sea surface temperature | plot | plot | plot |
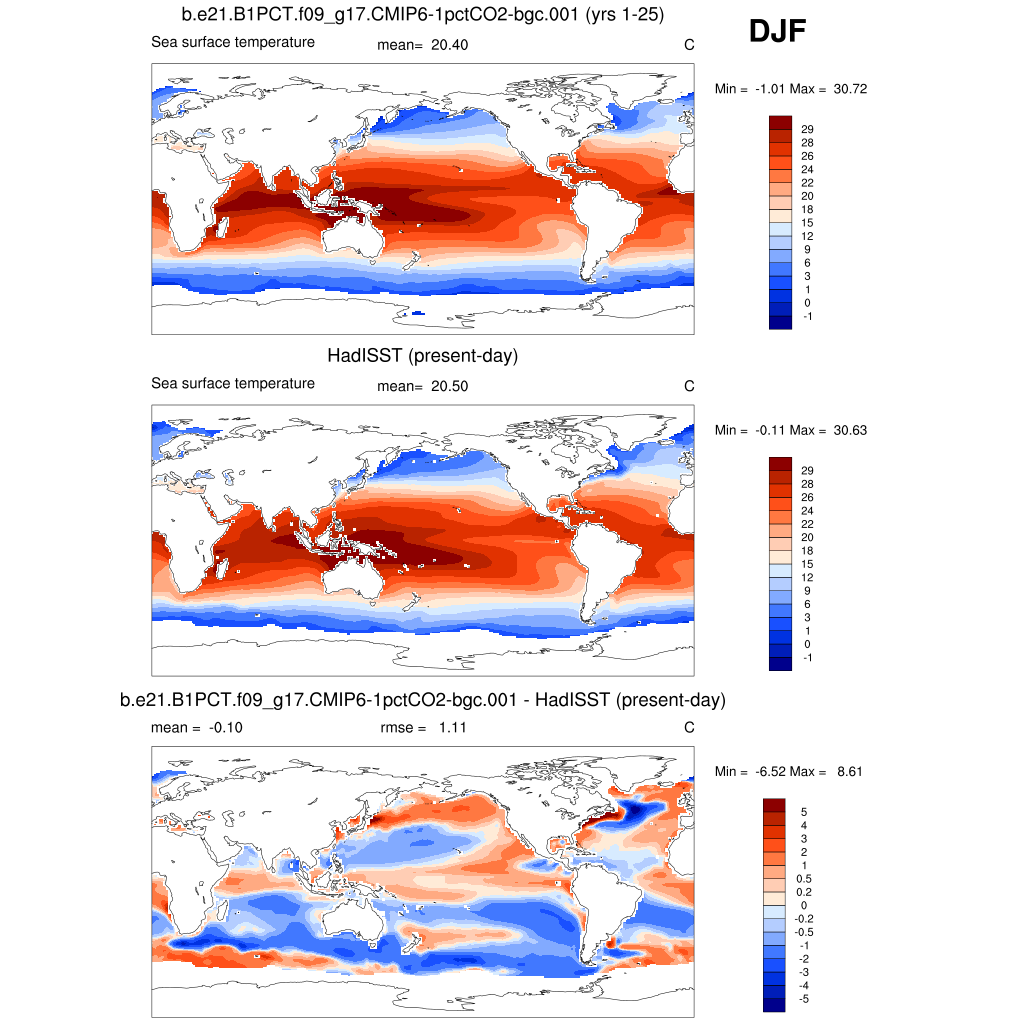
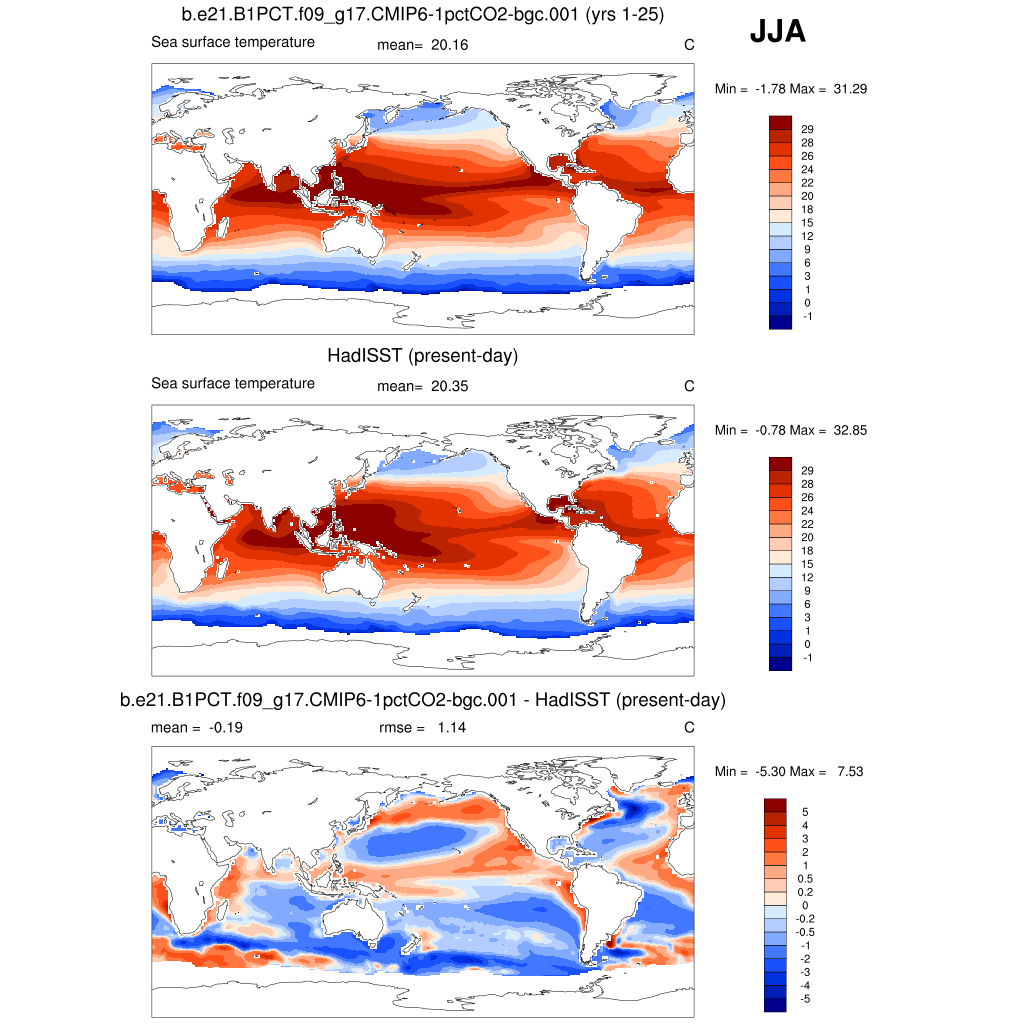
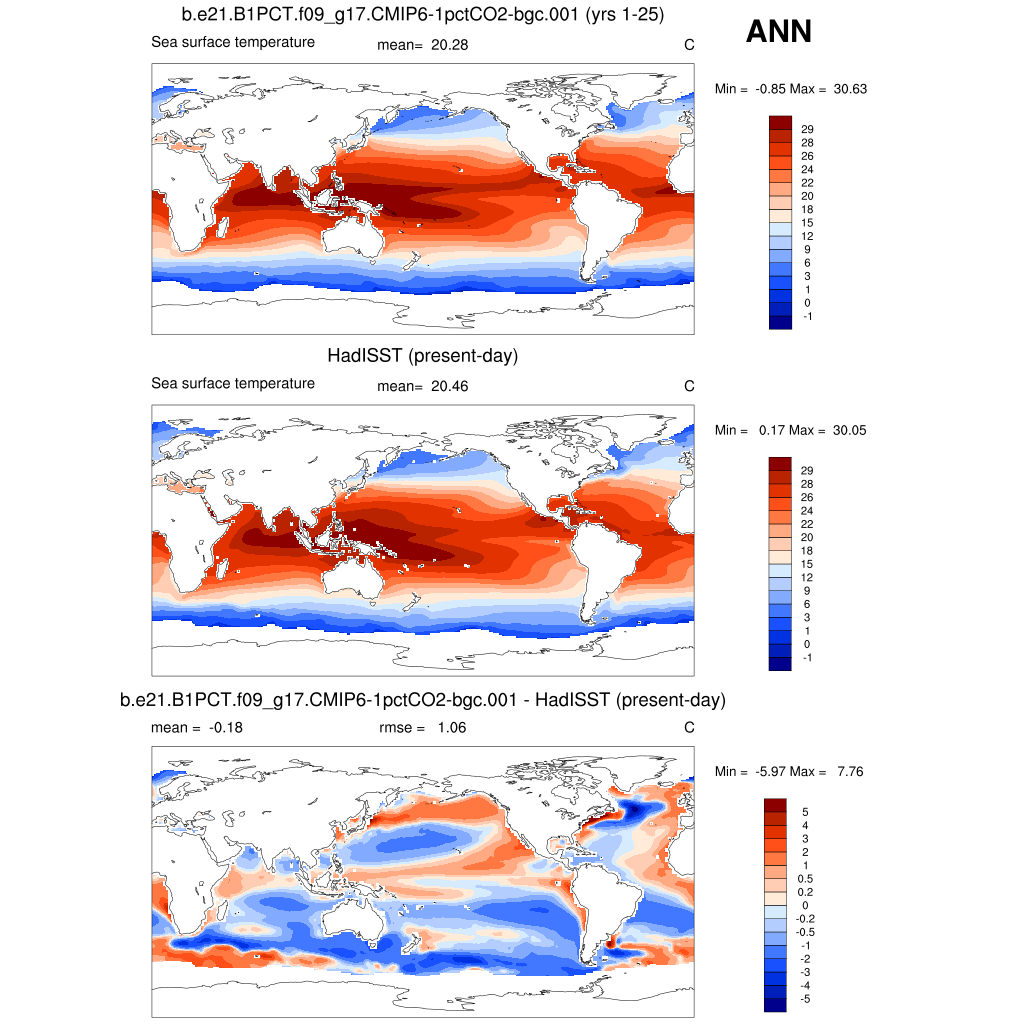
| HadISST/OI.v2 (Present Day) 1999-2008 | DJF | JJA | ANN | |
| SST | sea surface temperature | plot | plot | plot |
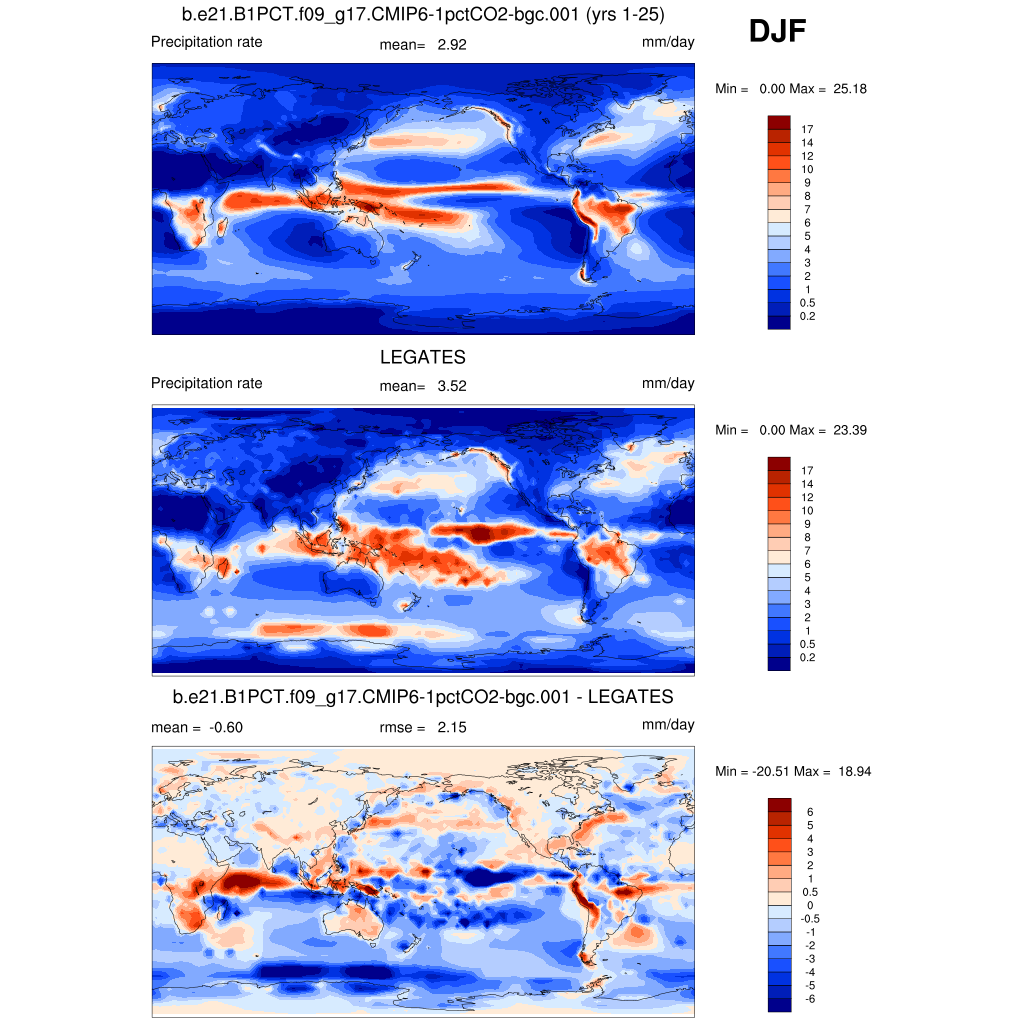
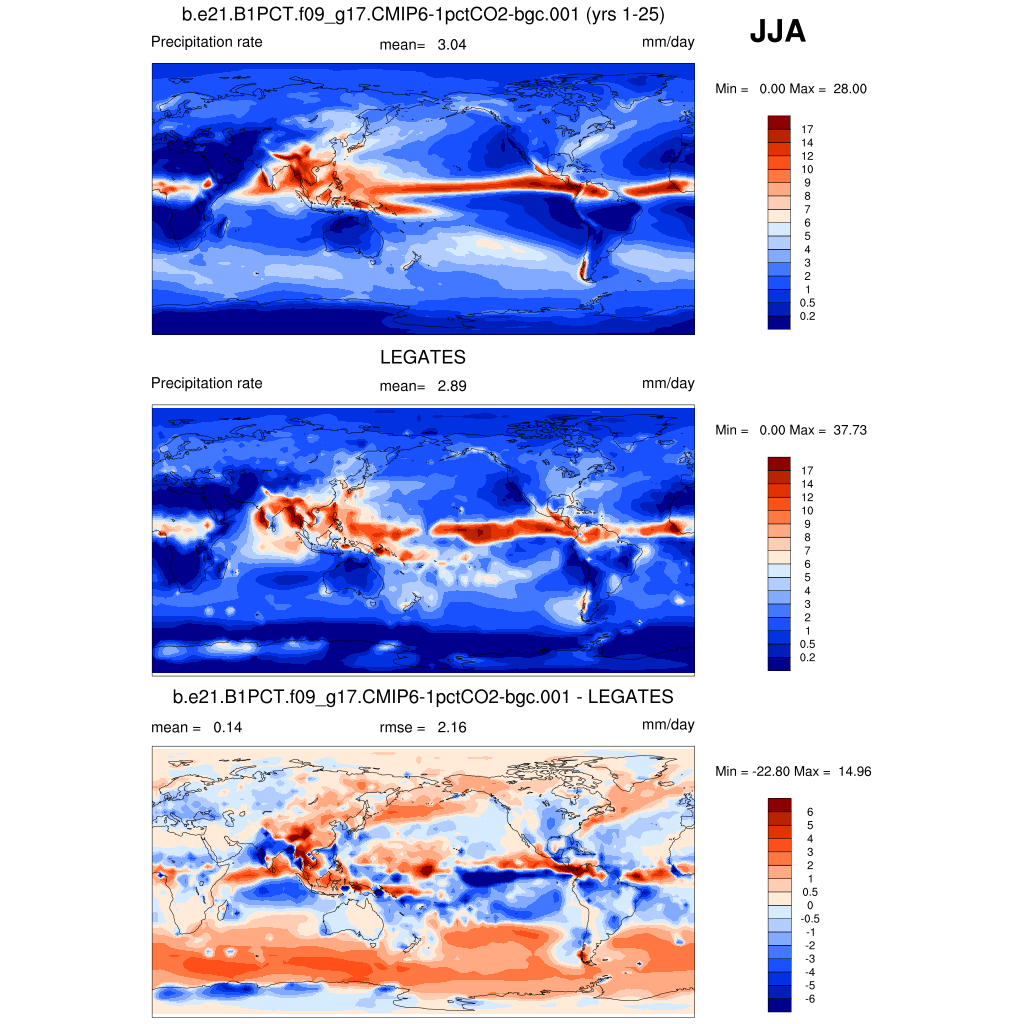
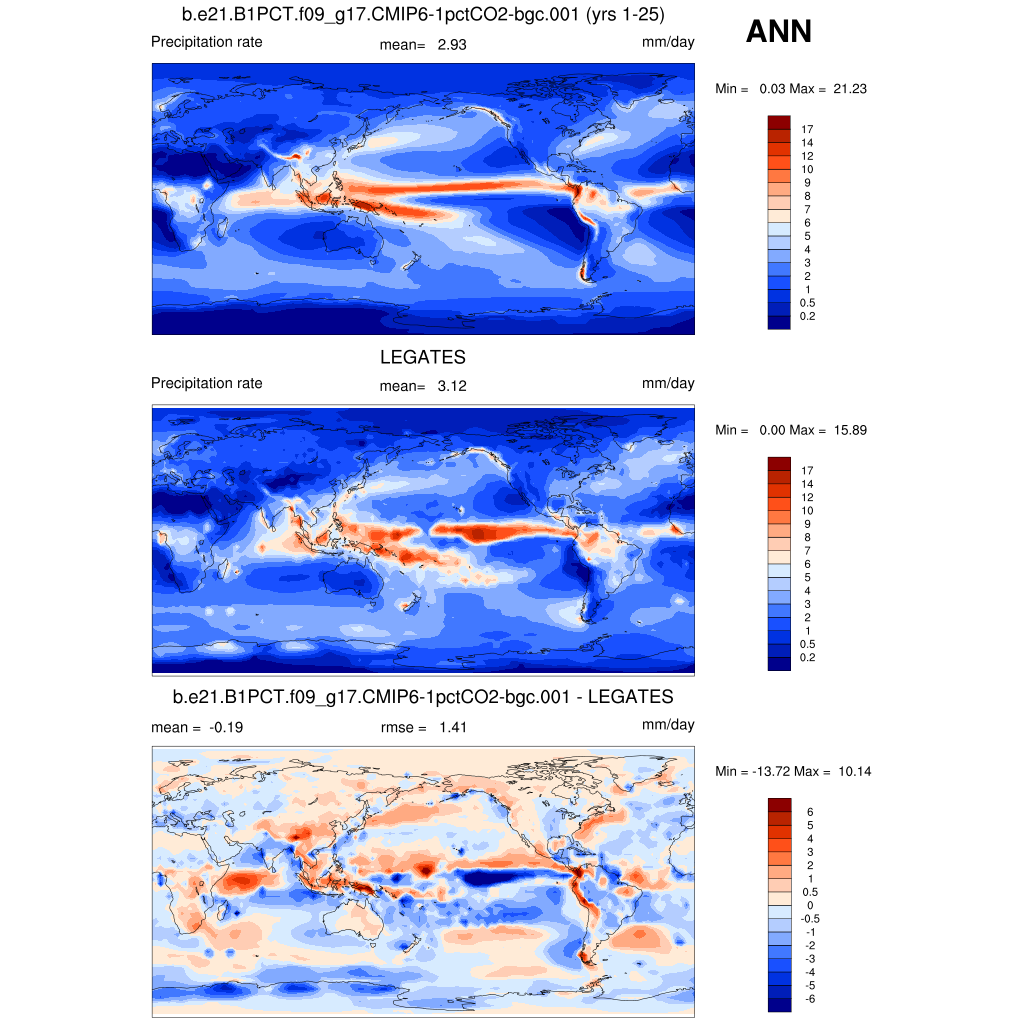
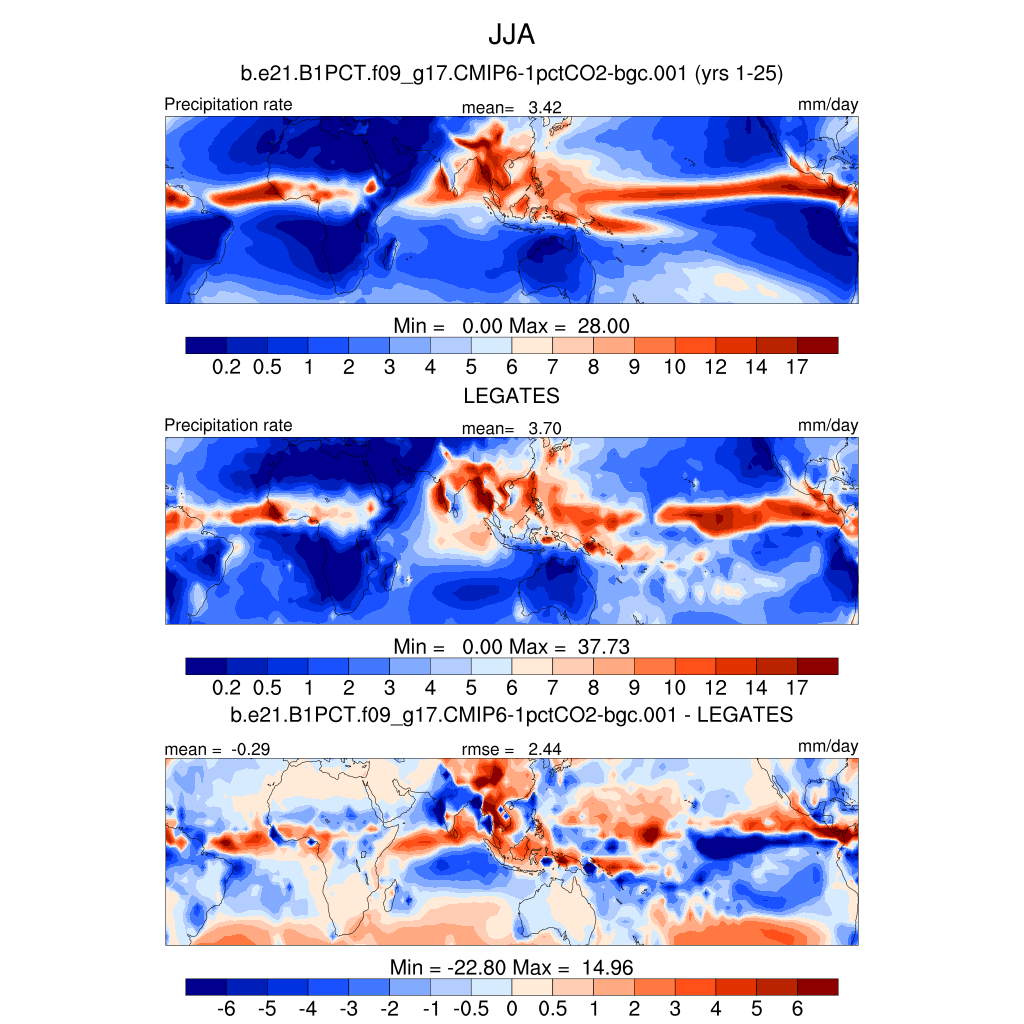
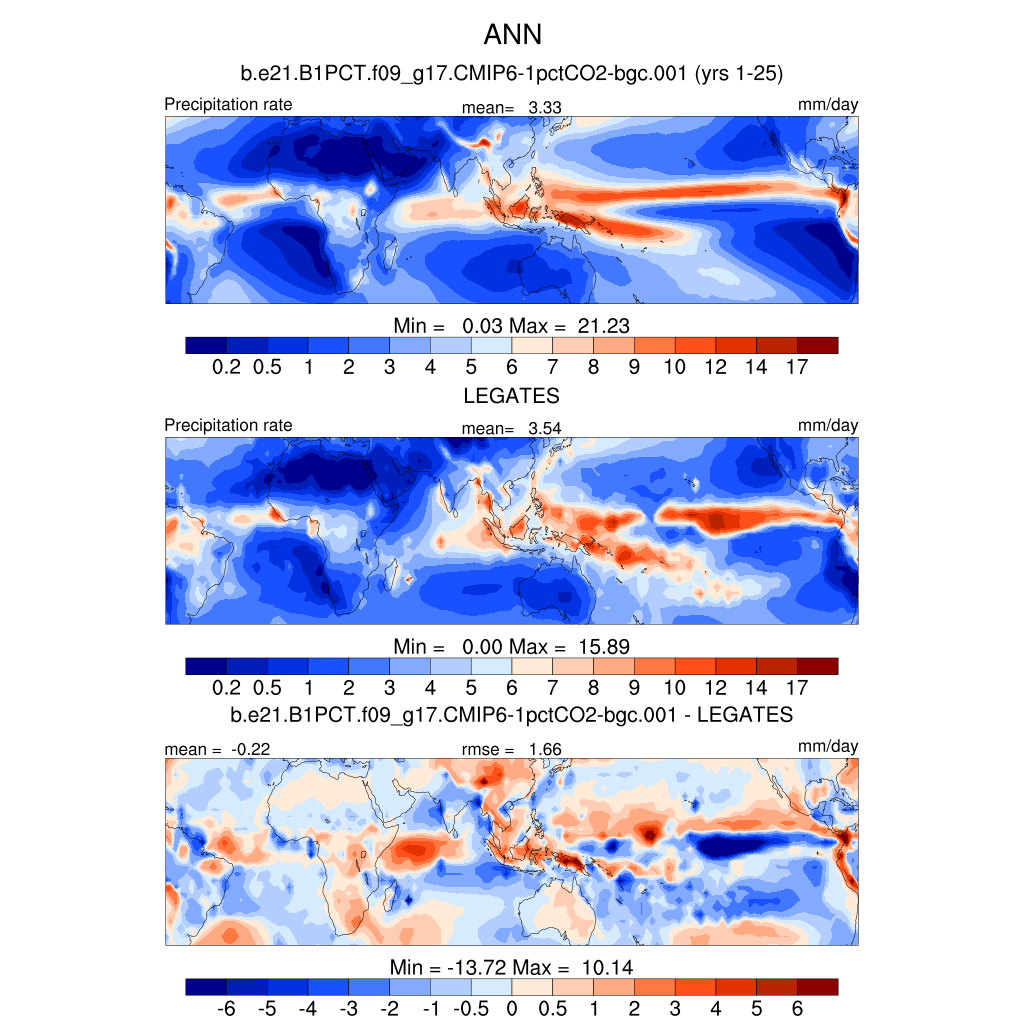
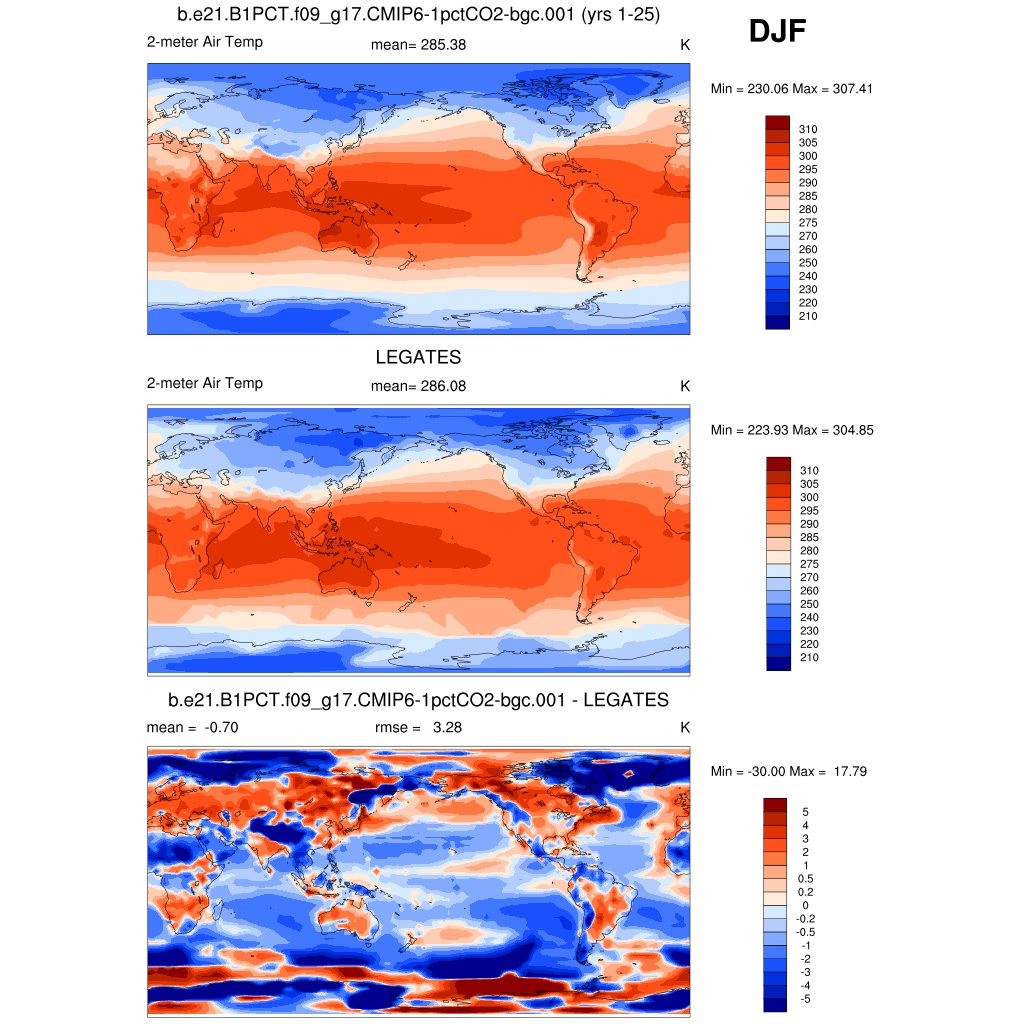
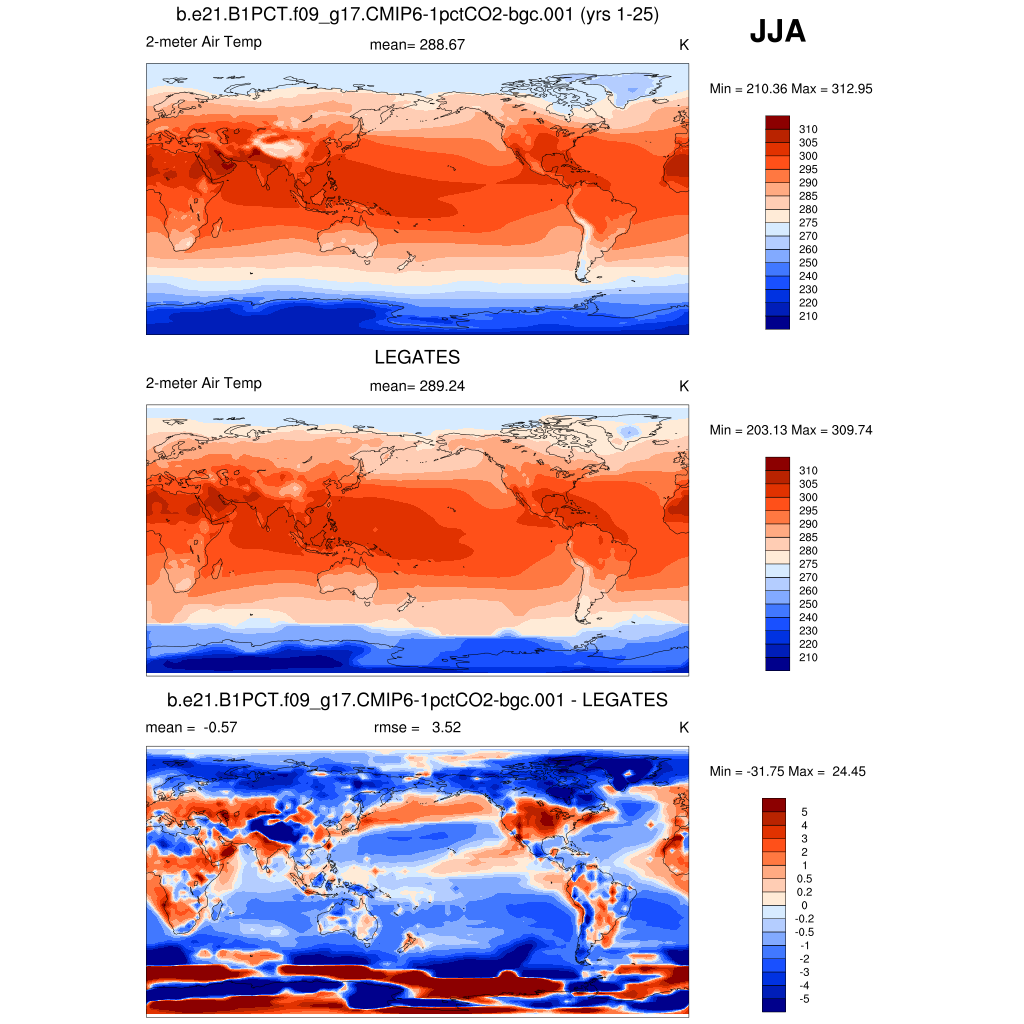
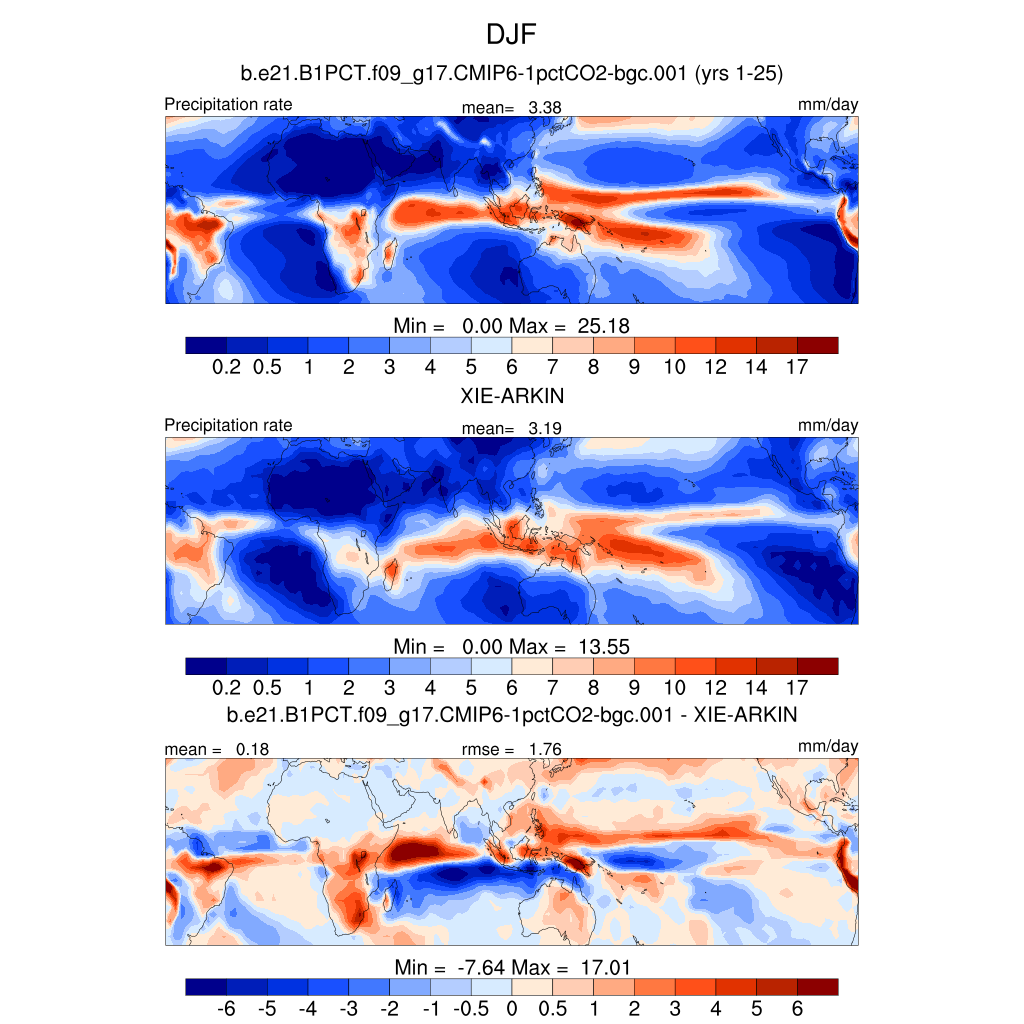
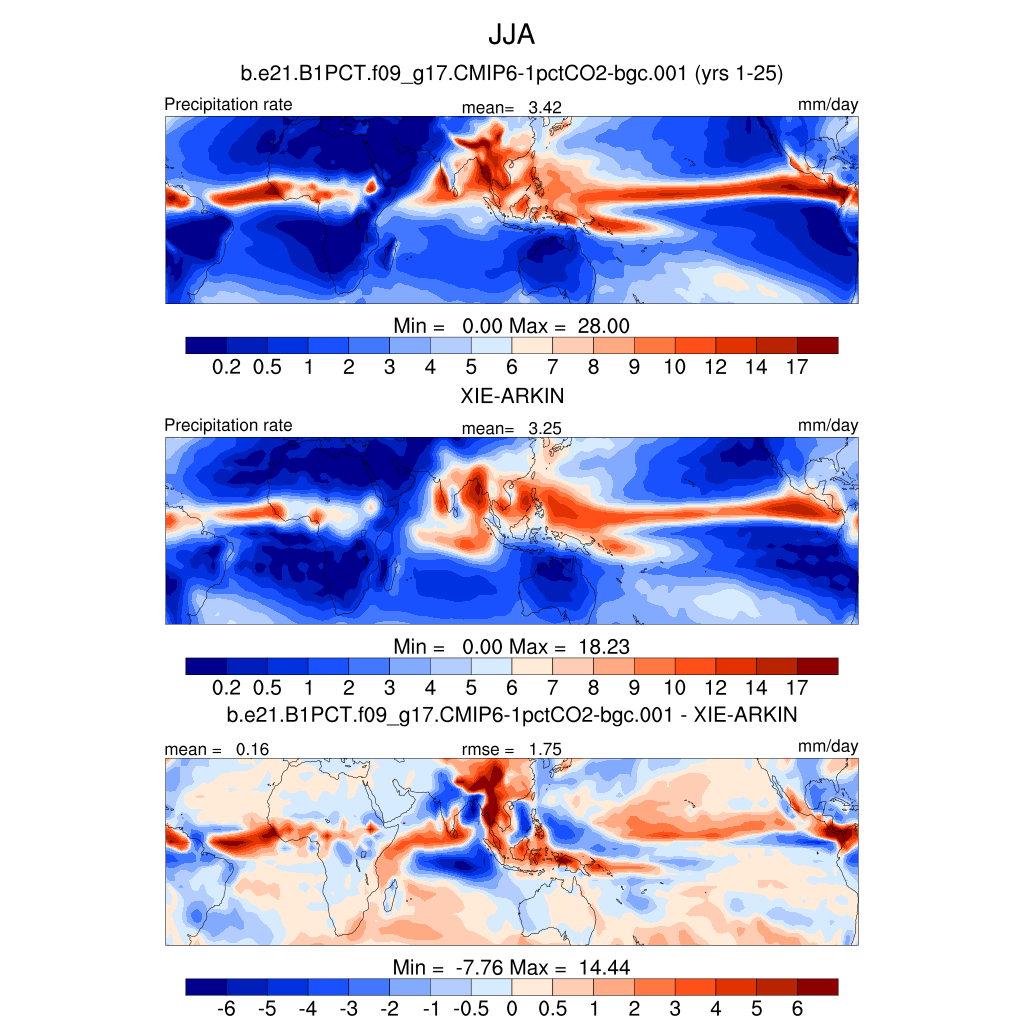
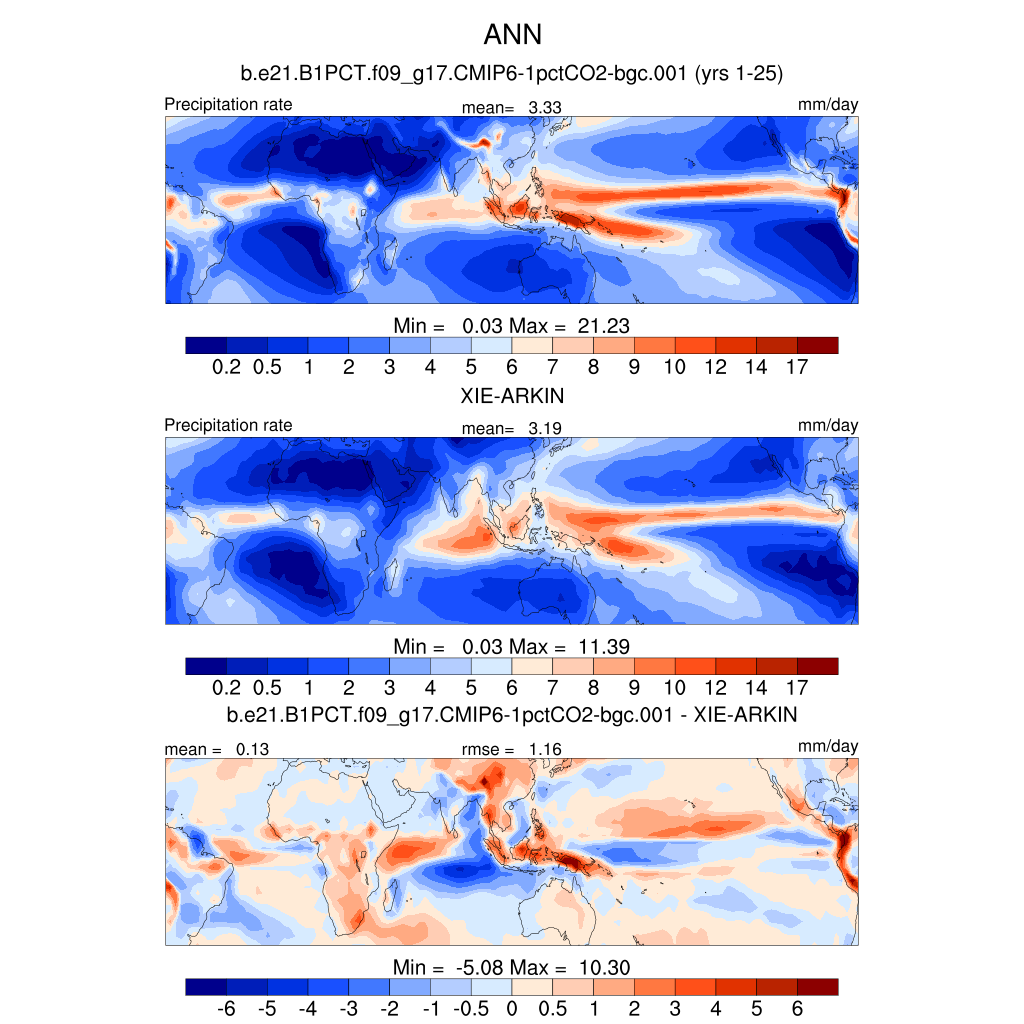
| Legates & Willmott 1920-80 | DJF | JJA | ANN | |
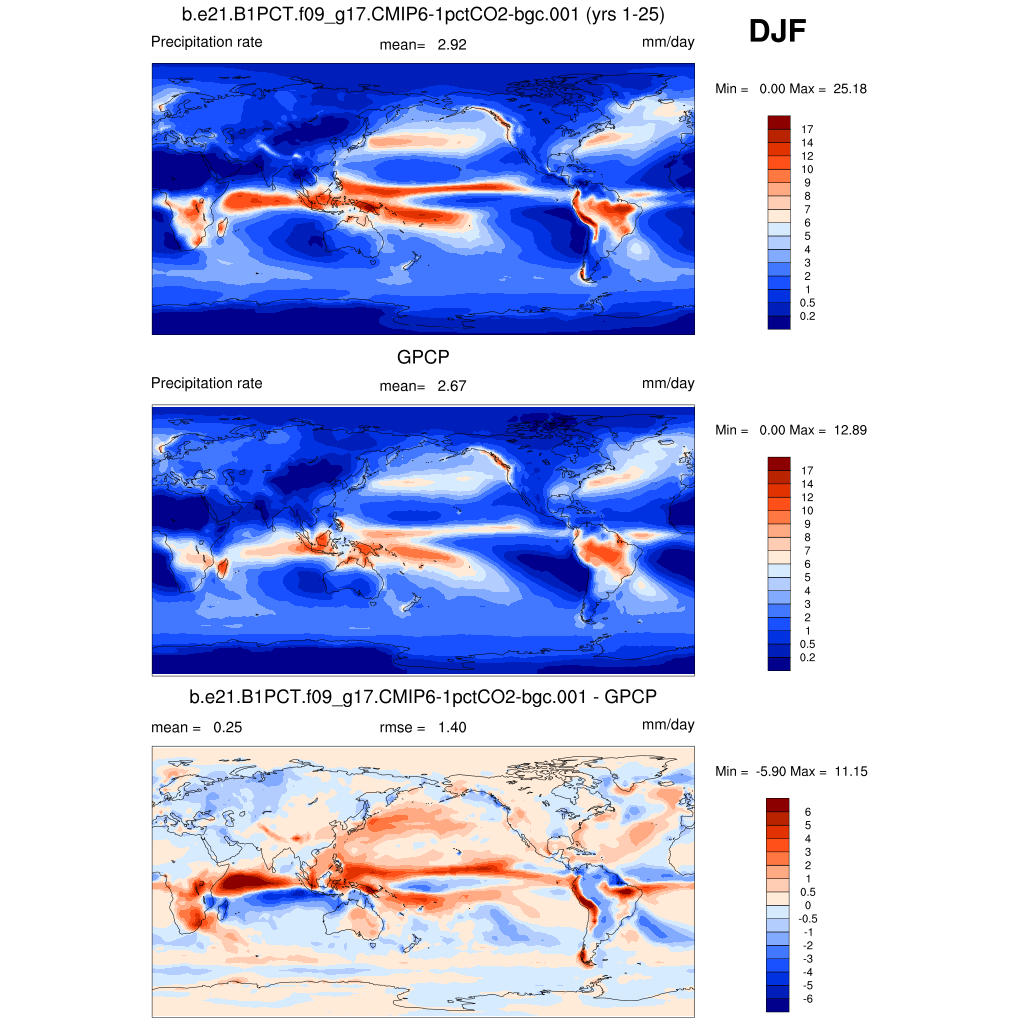
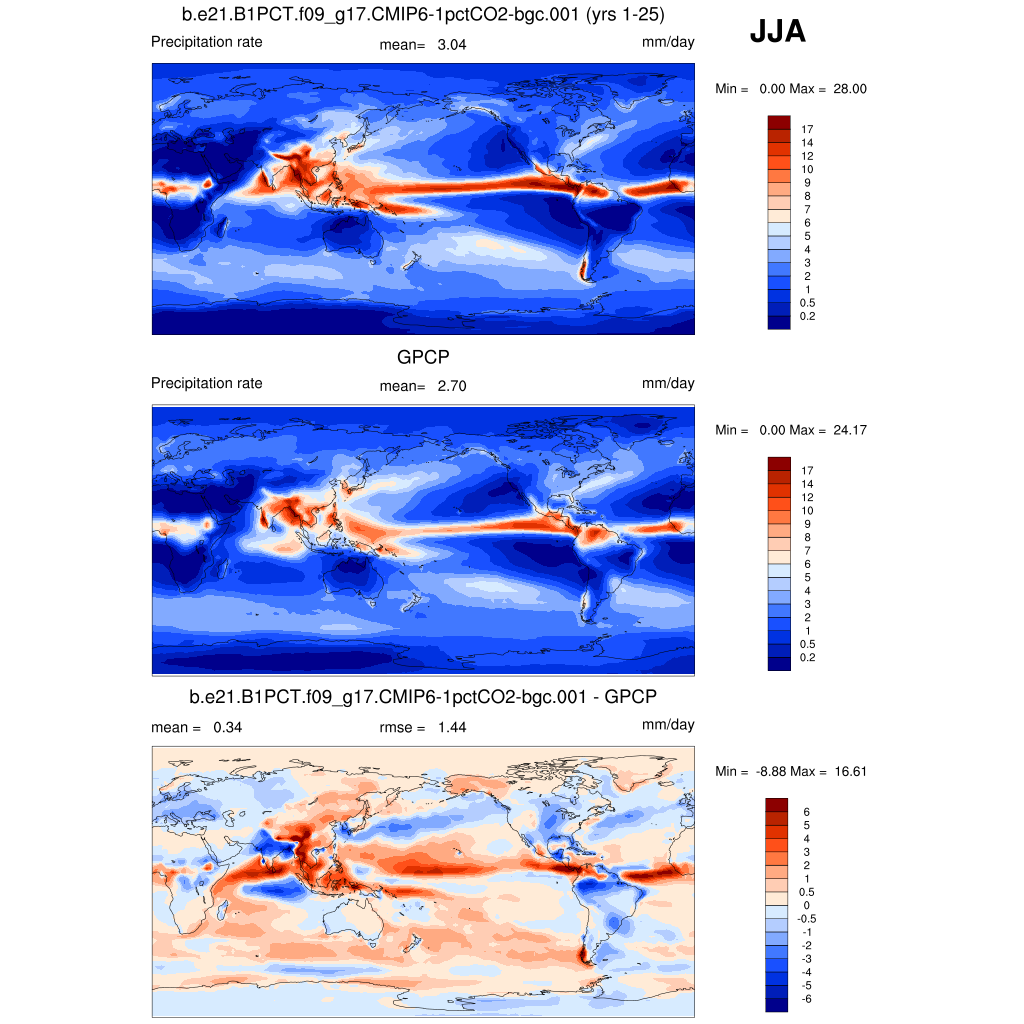
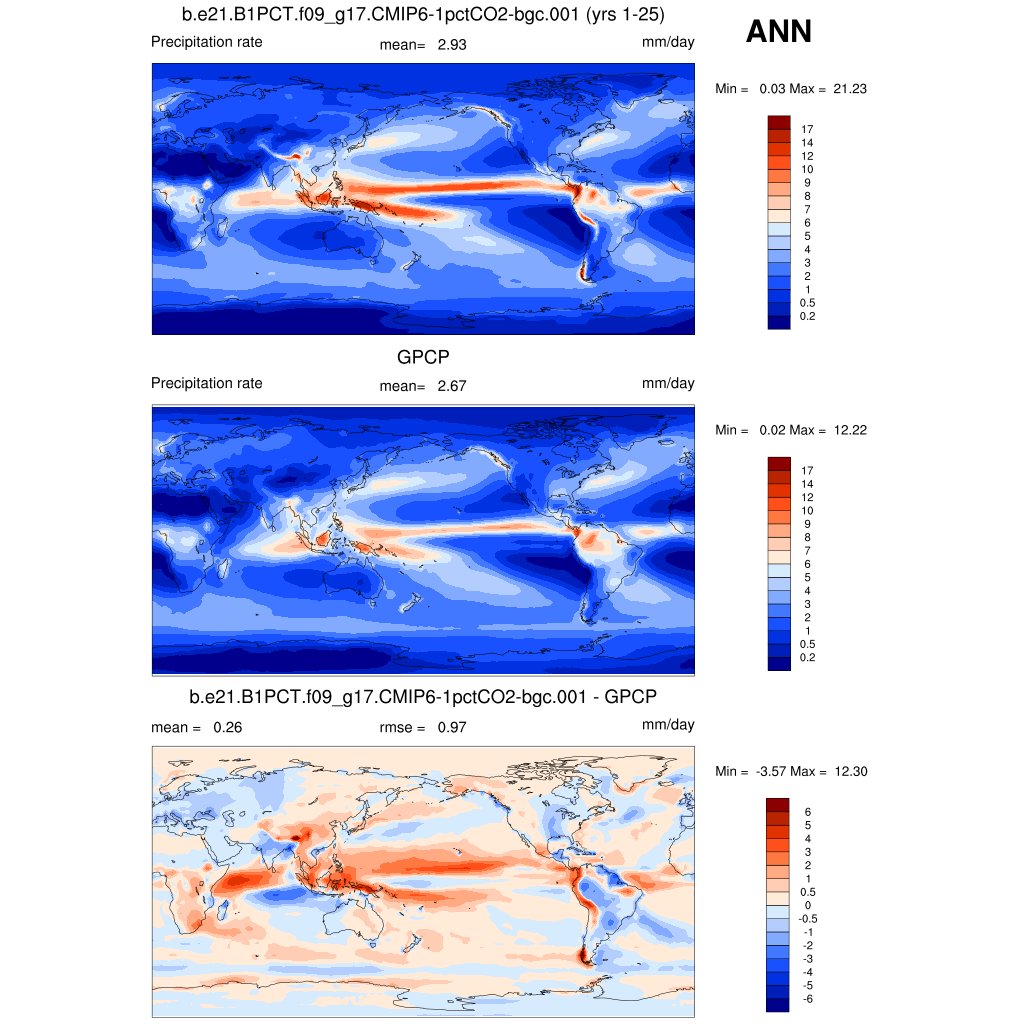
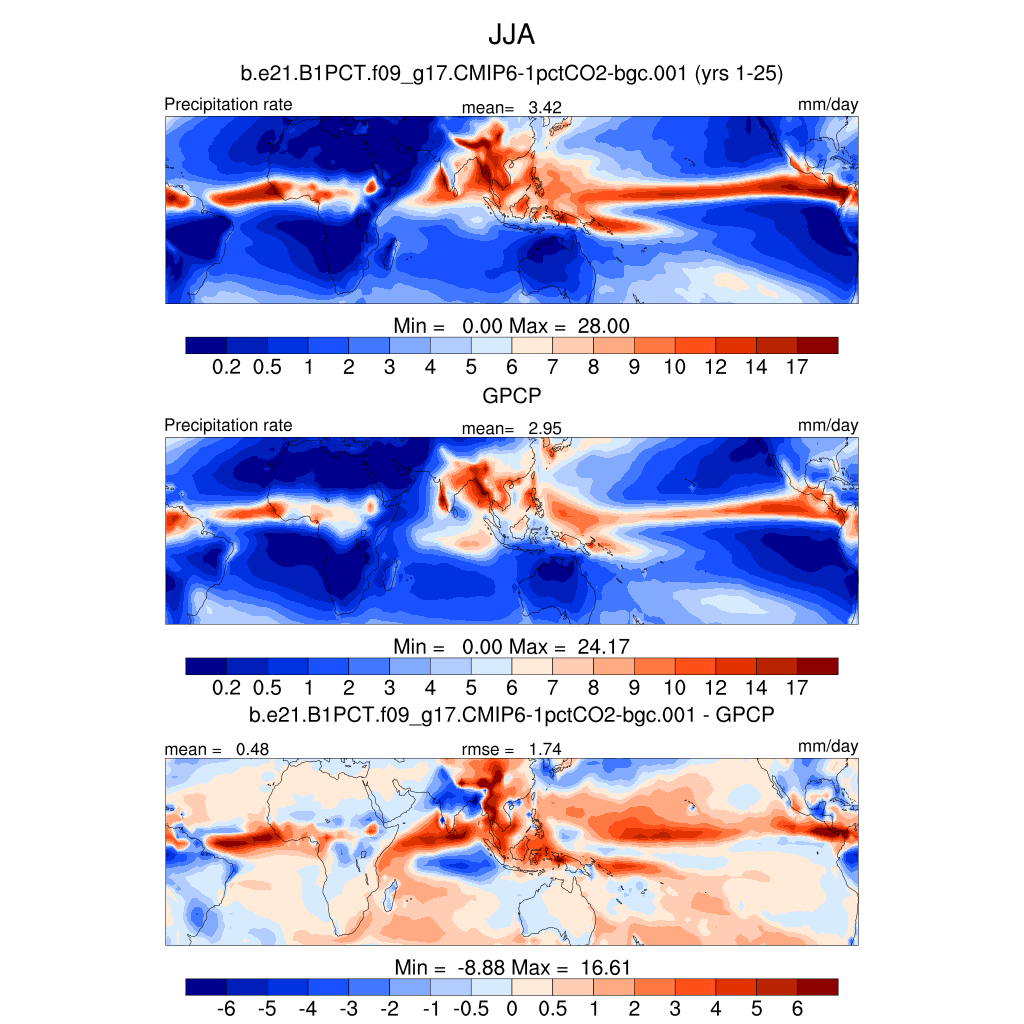
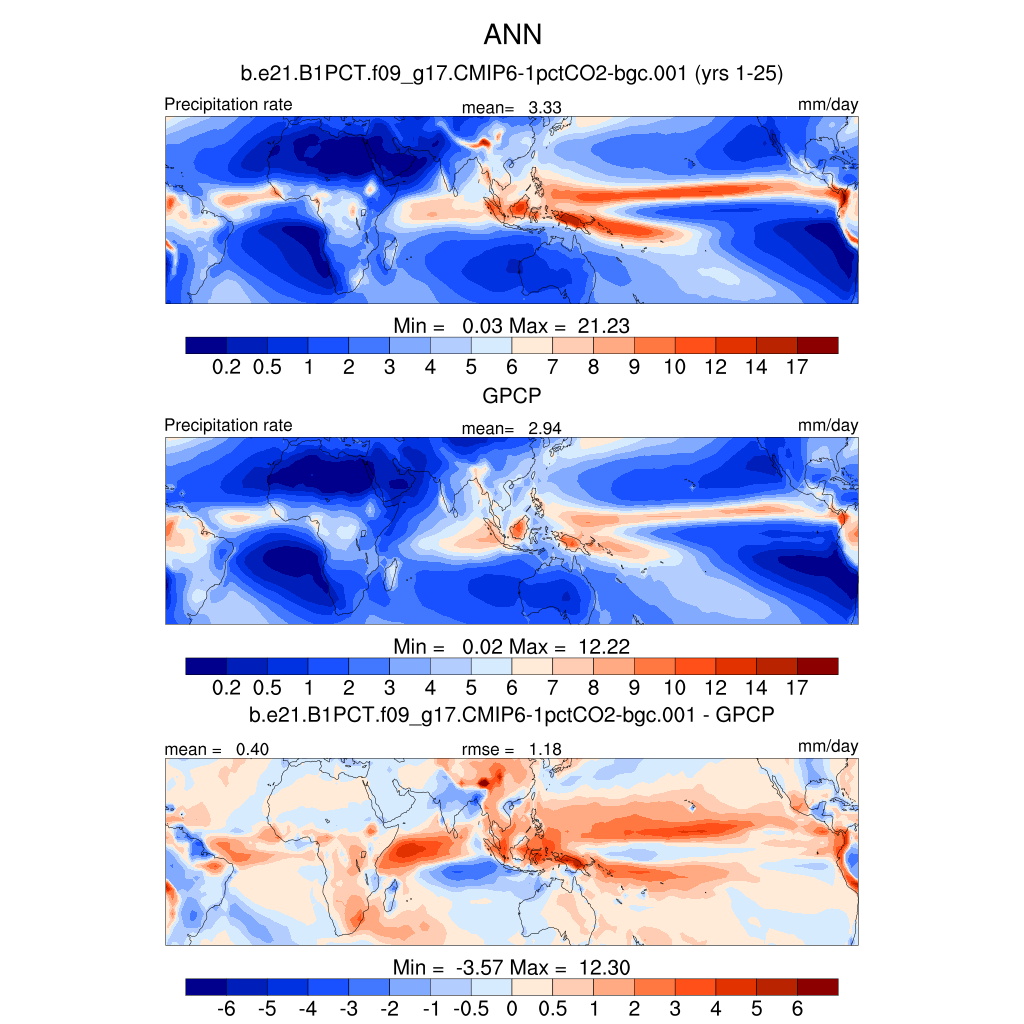
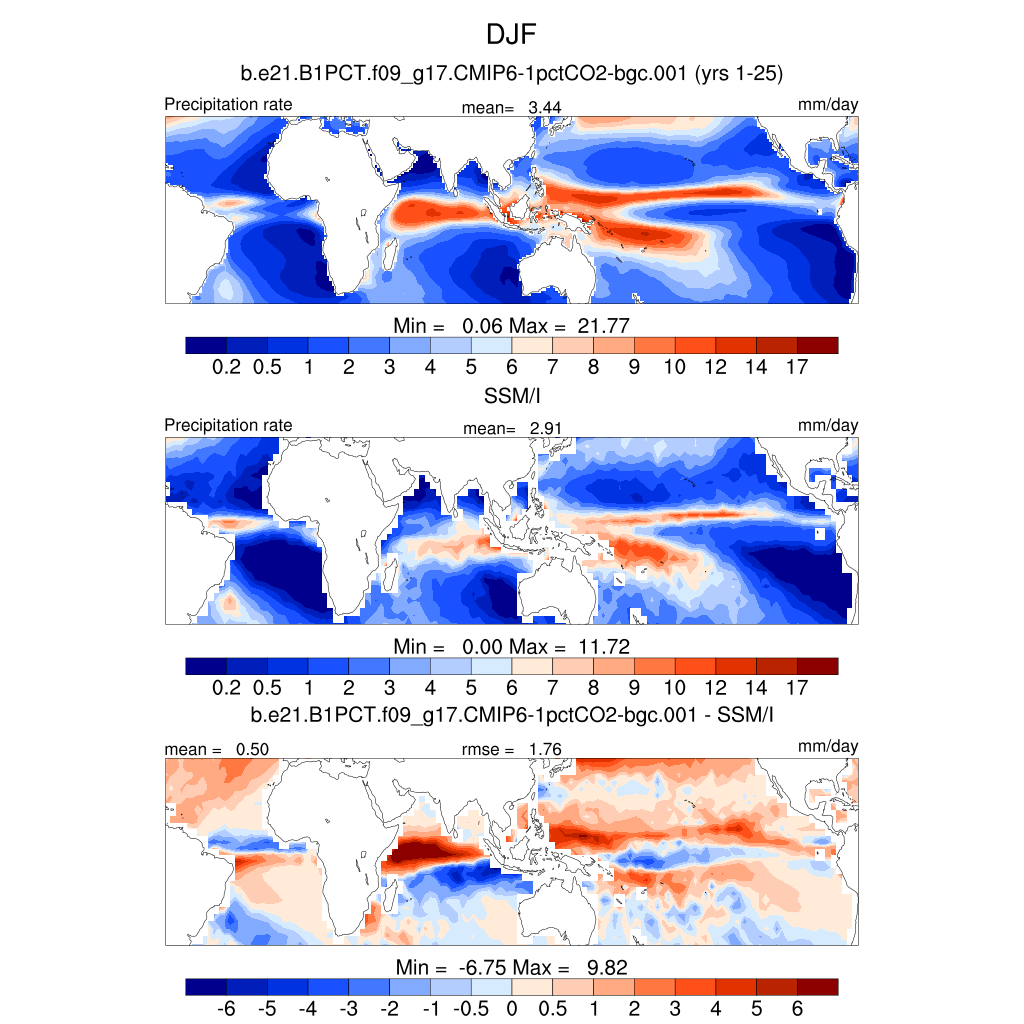
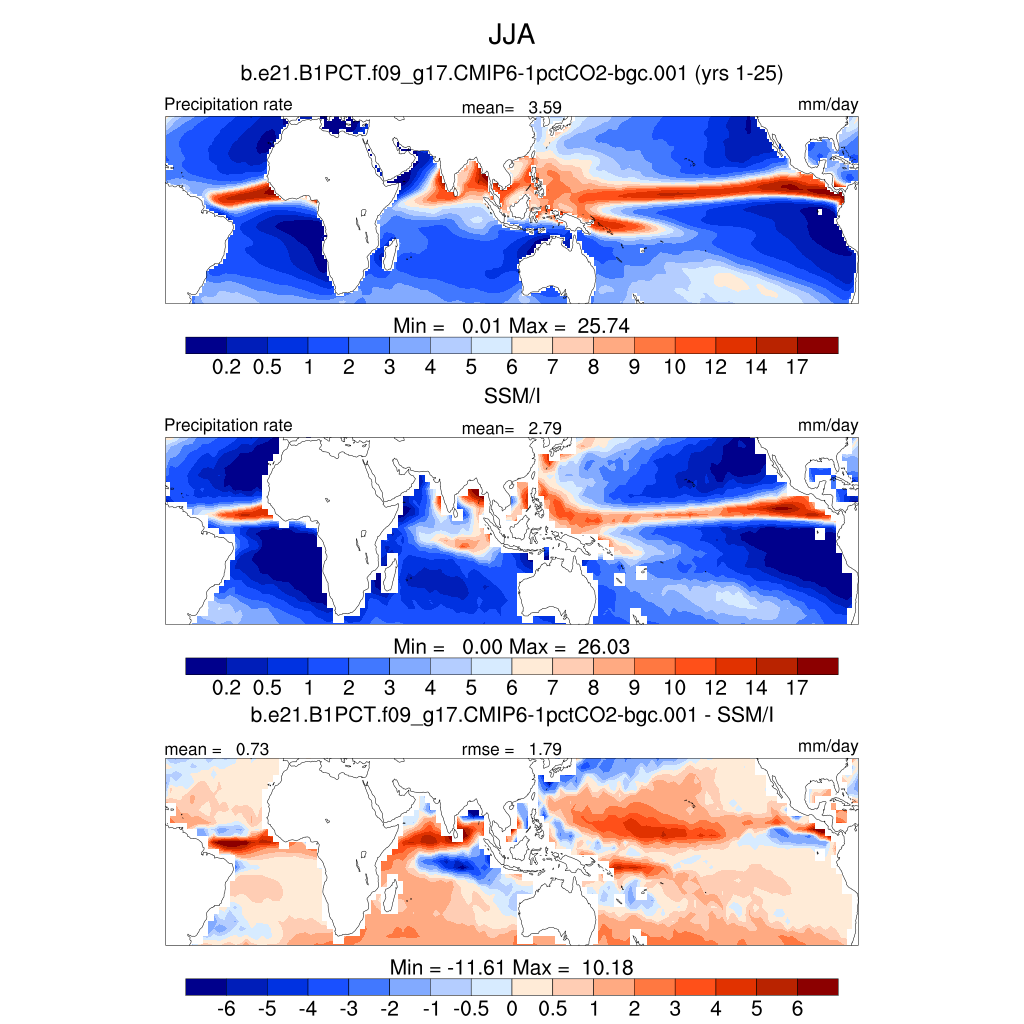
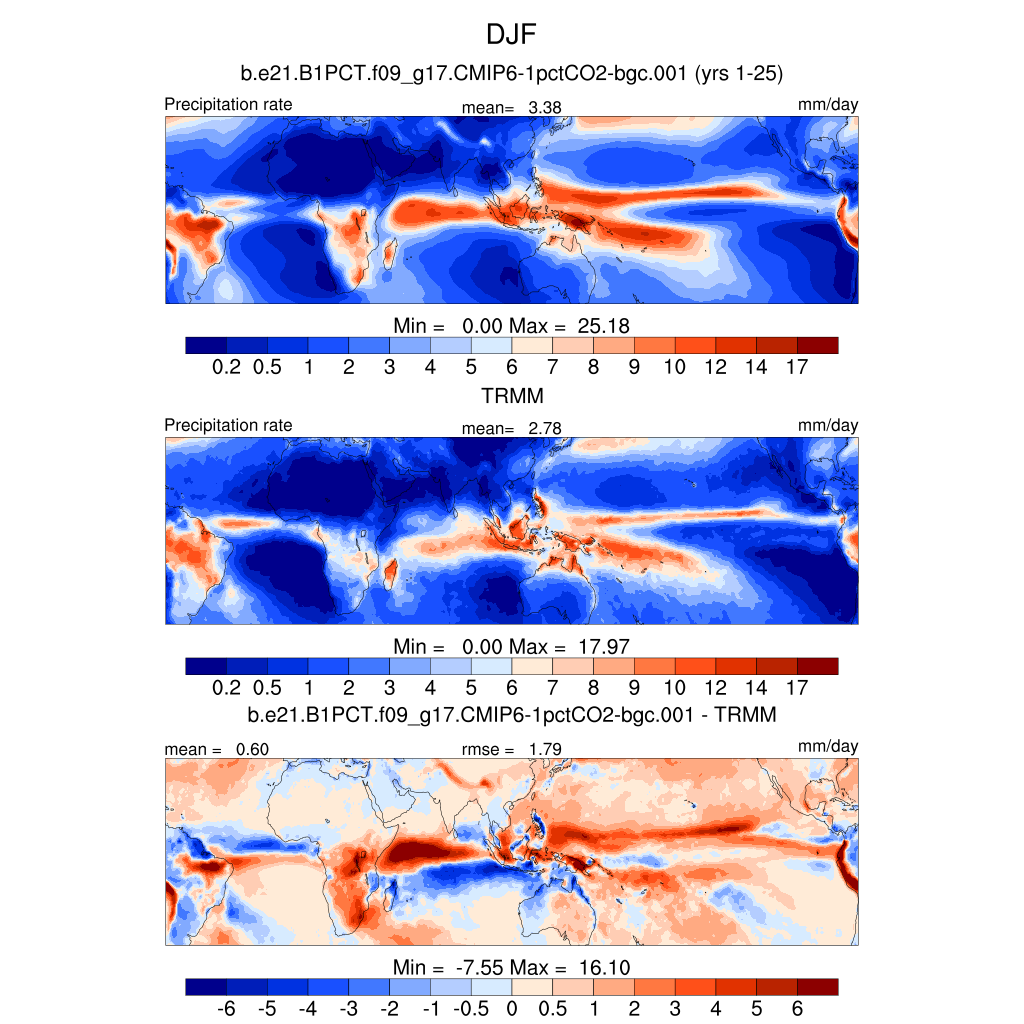
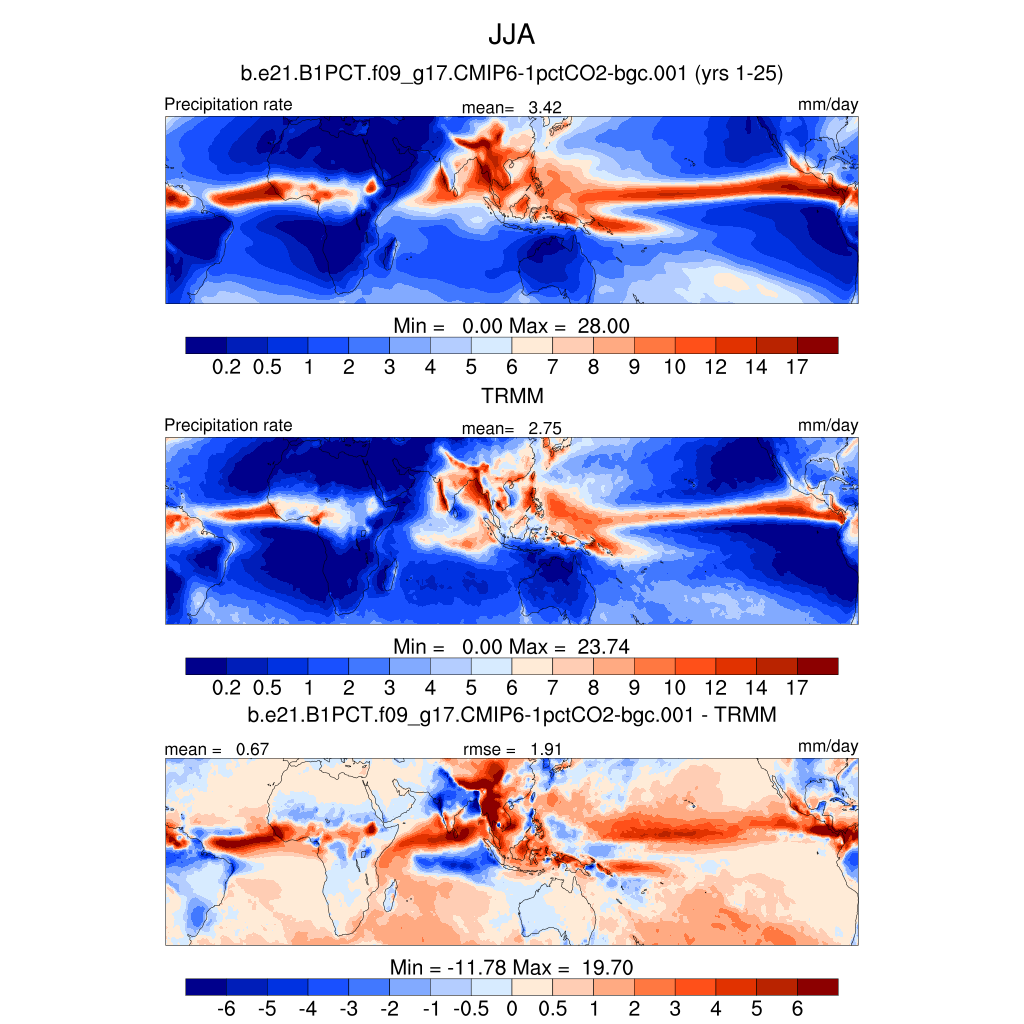
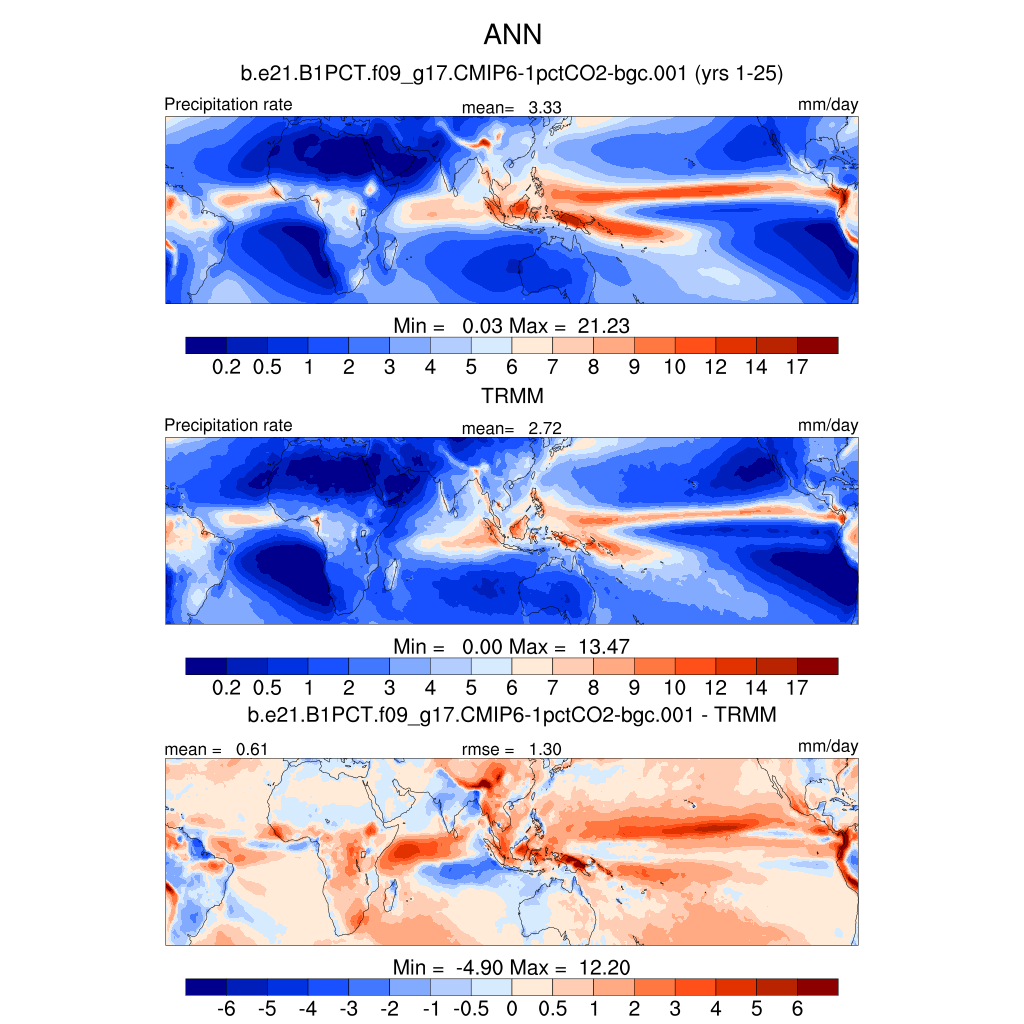
| PRECT * | Precipitation rate | plot | plot | plot |
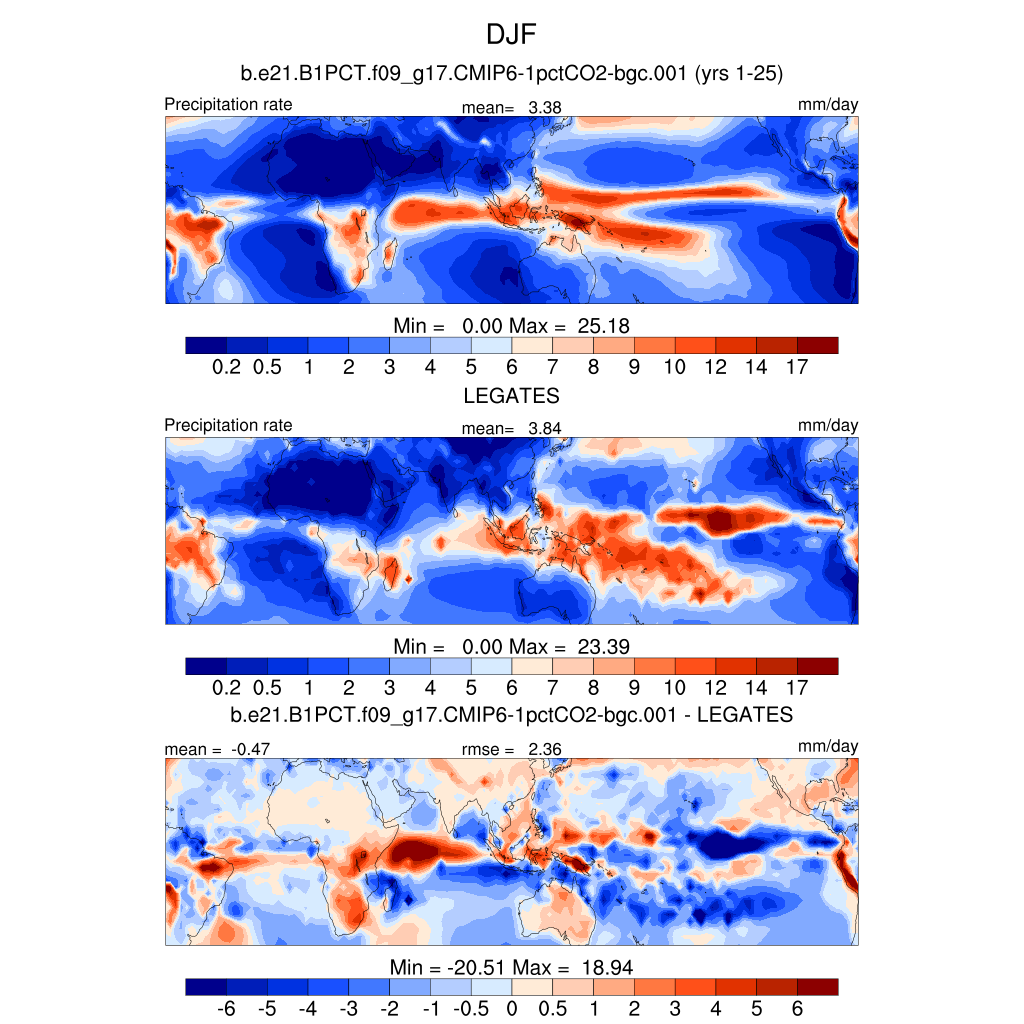
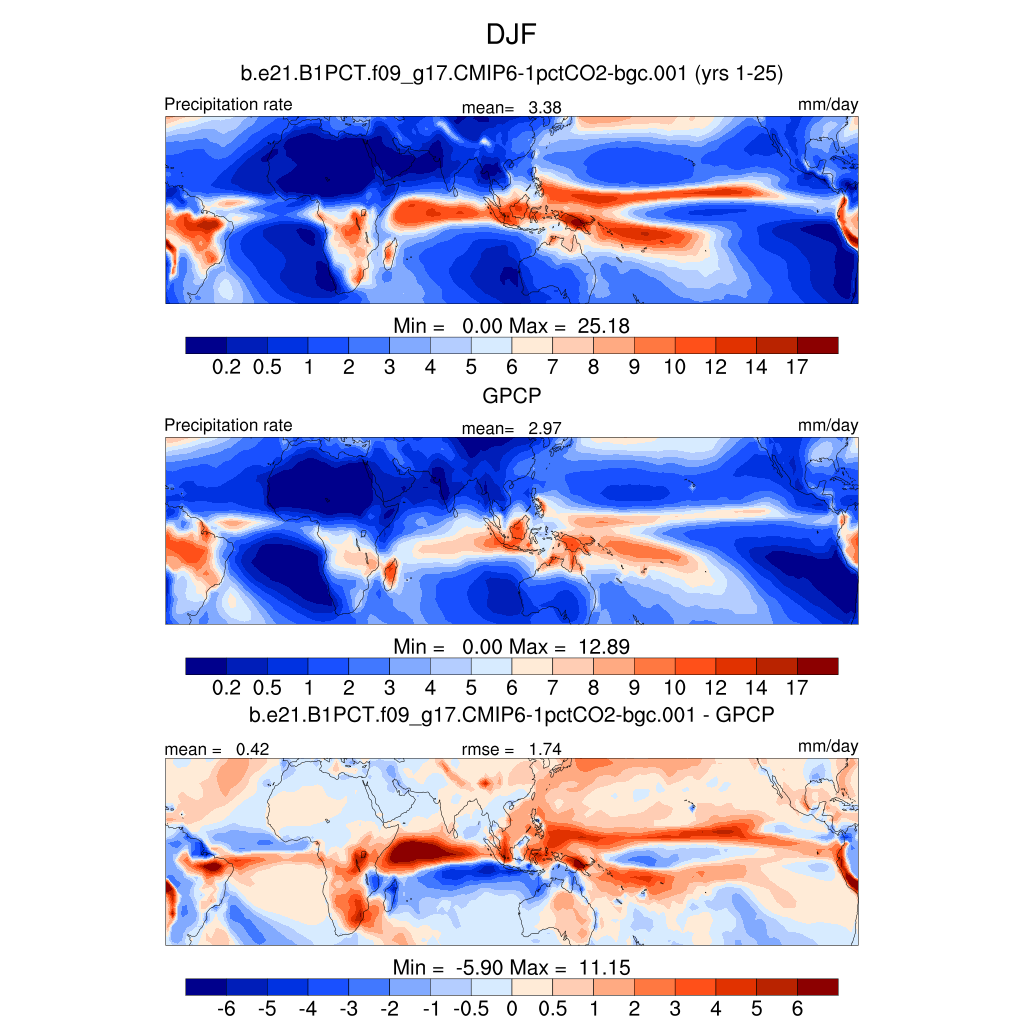
| PRECT TROP | Tropical precipitation rate | plot | plot | plot |
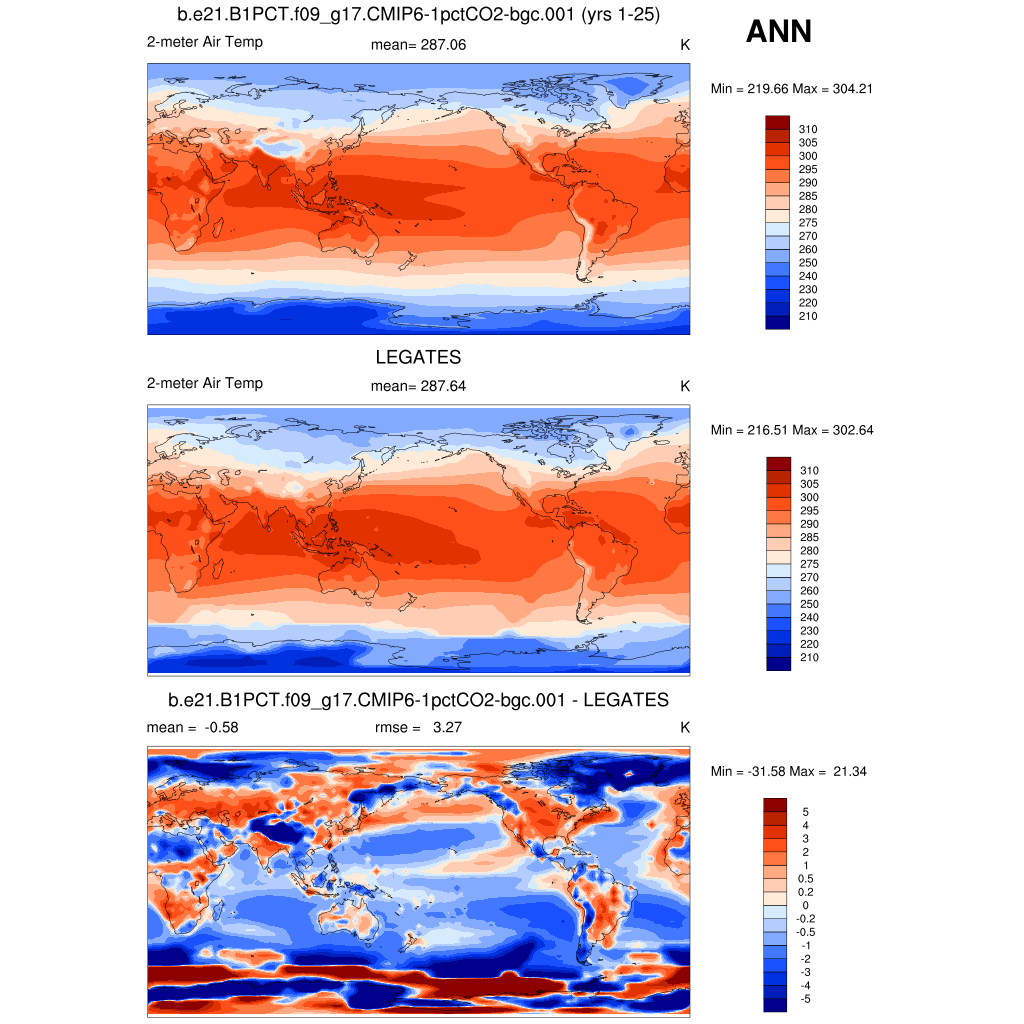
| TREFHT * | 2-meter air temperature | plot | plot | plot |
| Willmott & Matsuura 1950-99 | DJF | JJA | ANN | |
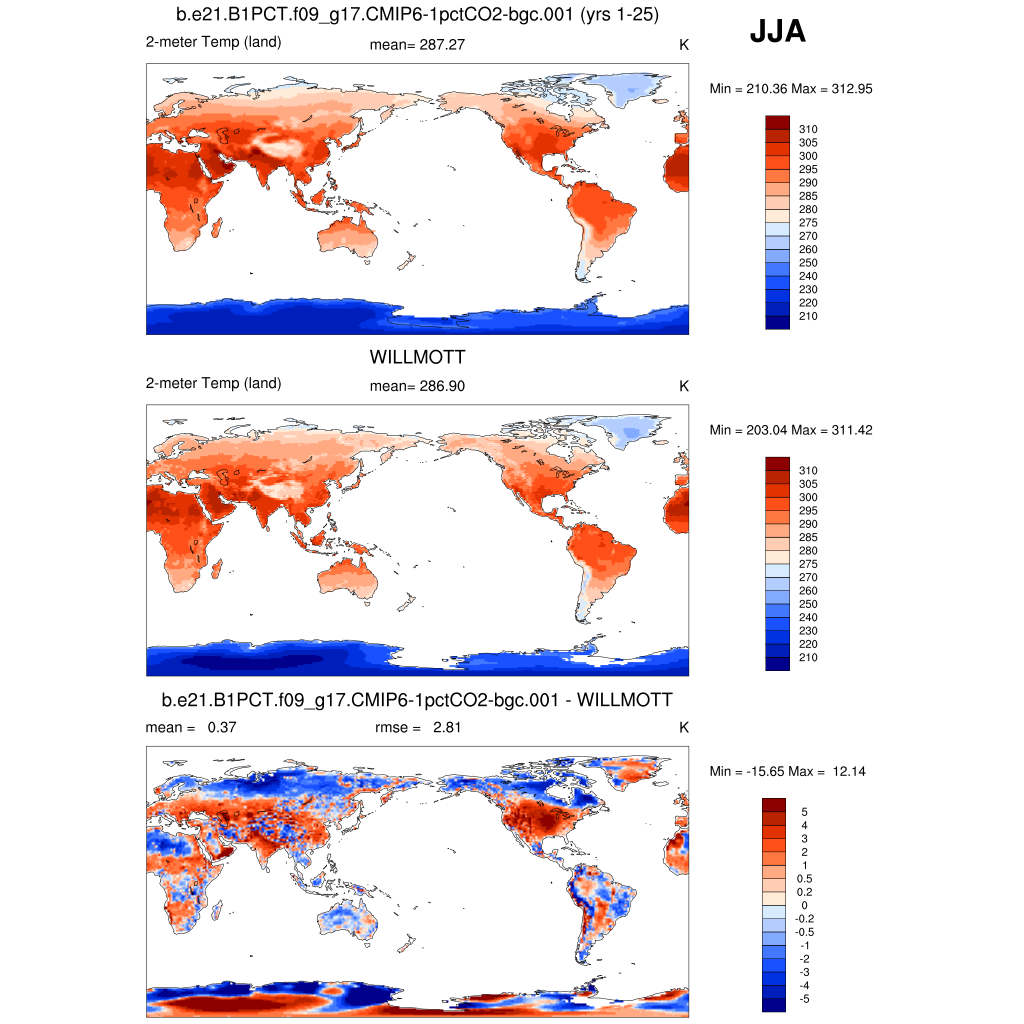
| TREFHT | 2-meter air temperature (land) | plot | plot | plot |
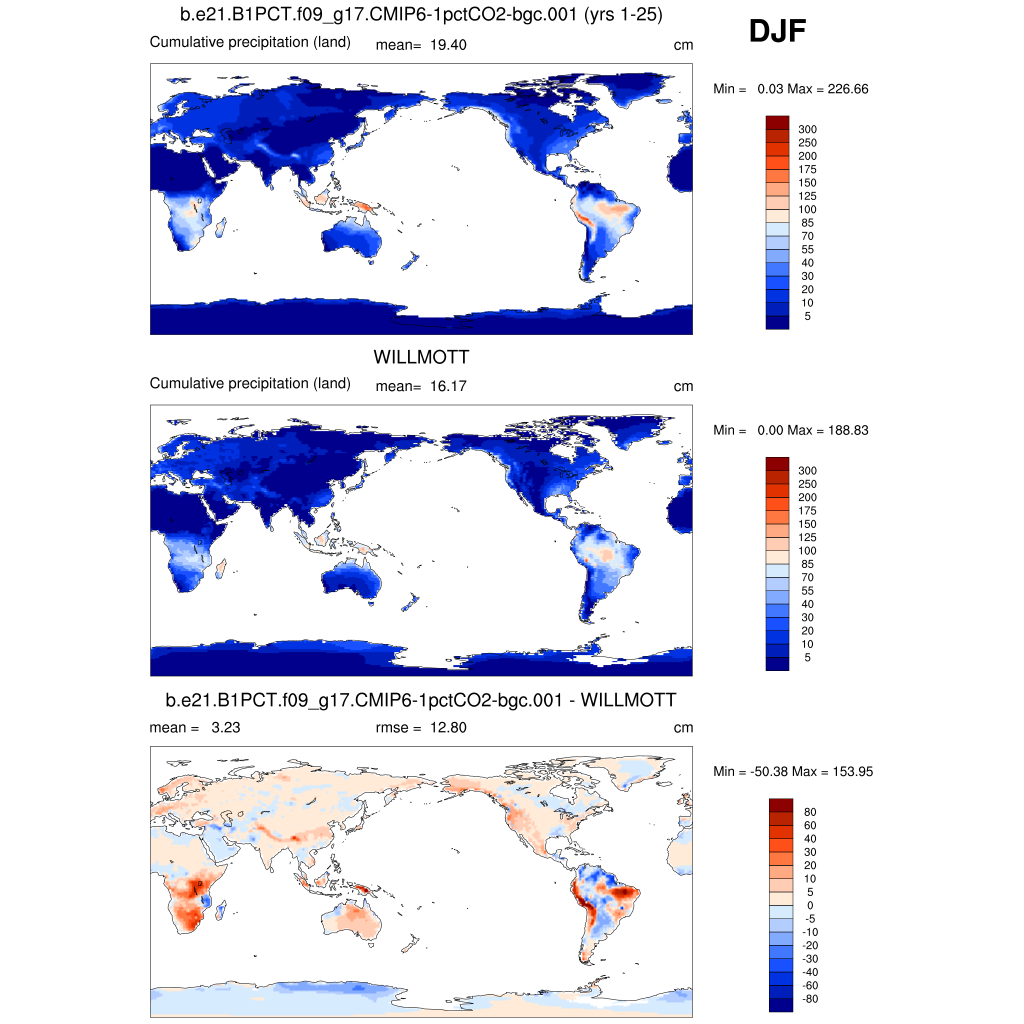
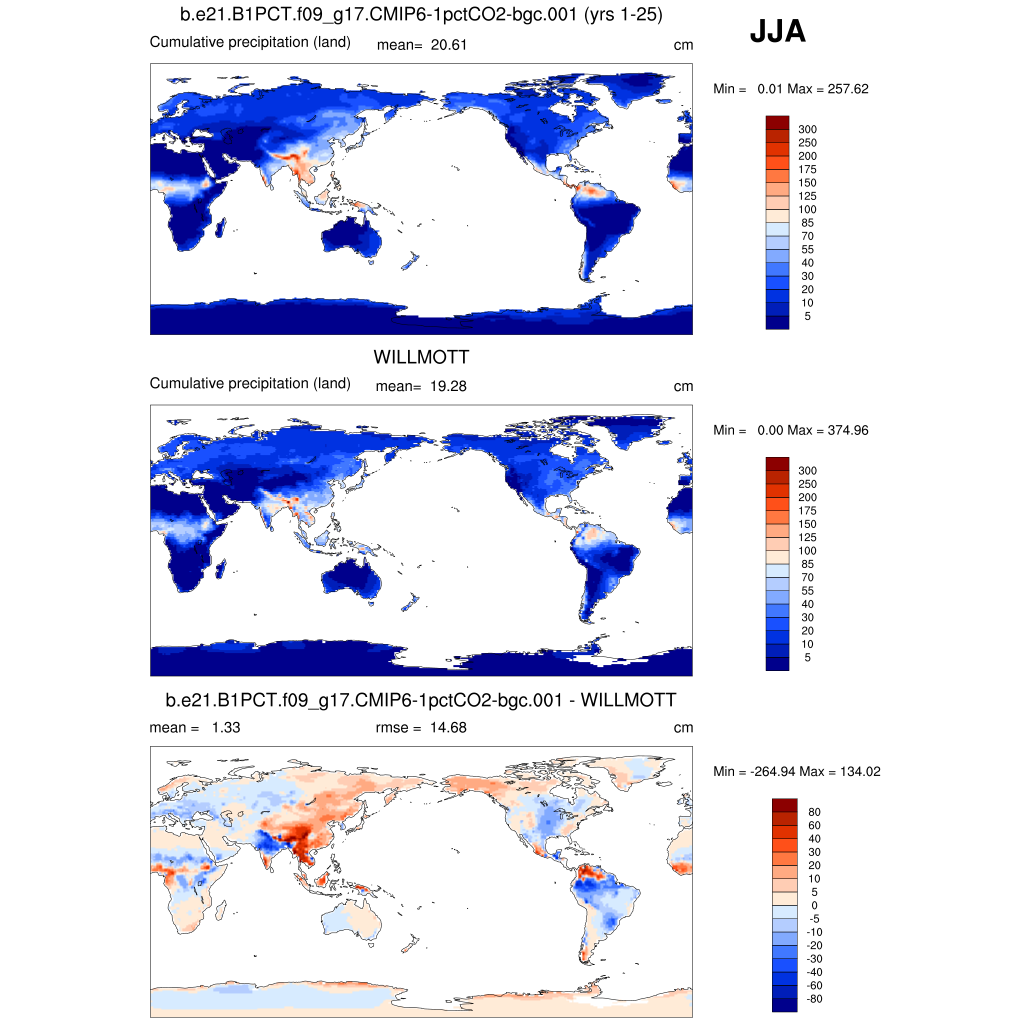
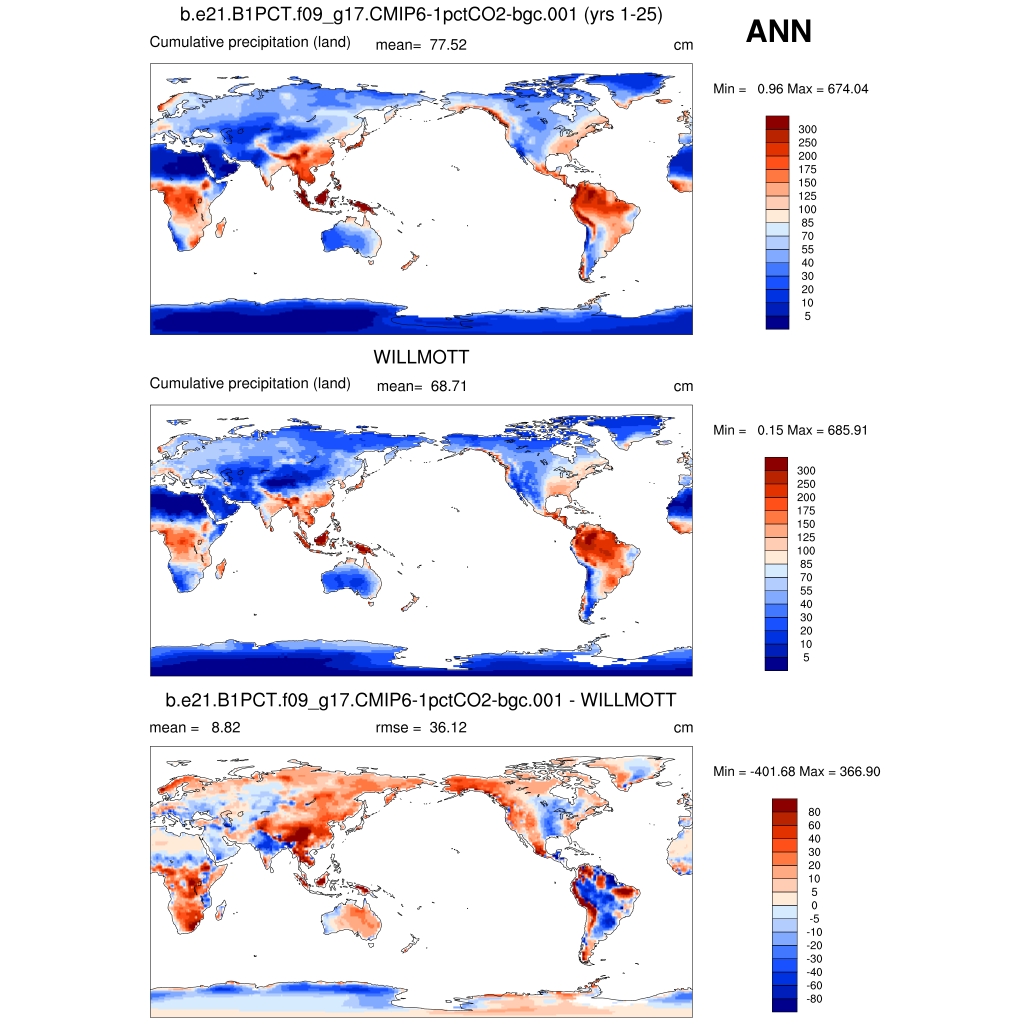
| PRECIP | Cumulative precipitation (land) | plot | plot | plot |
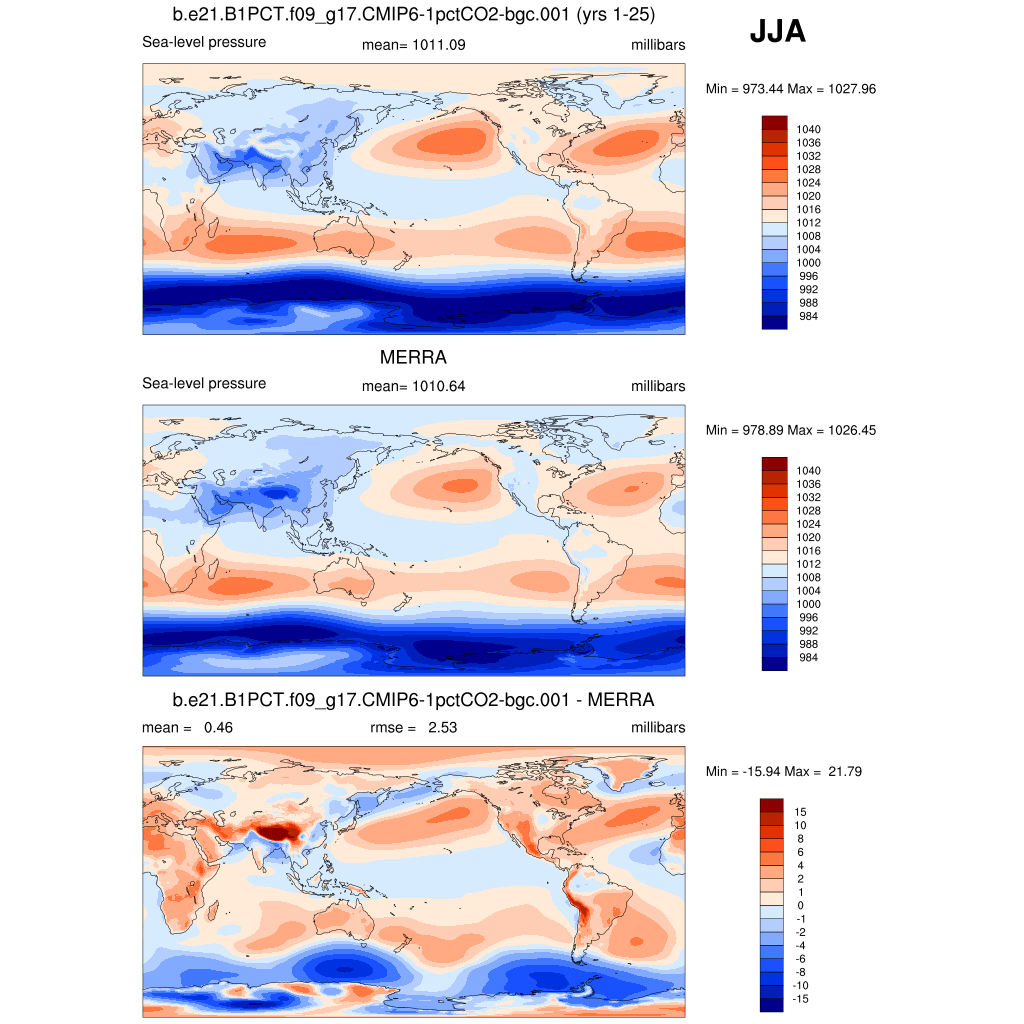
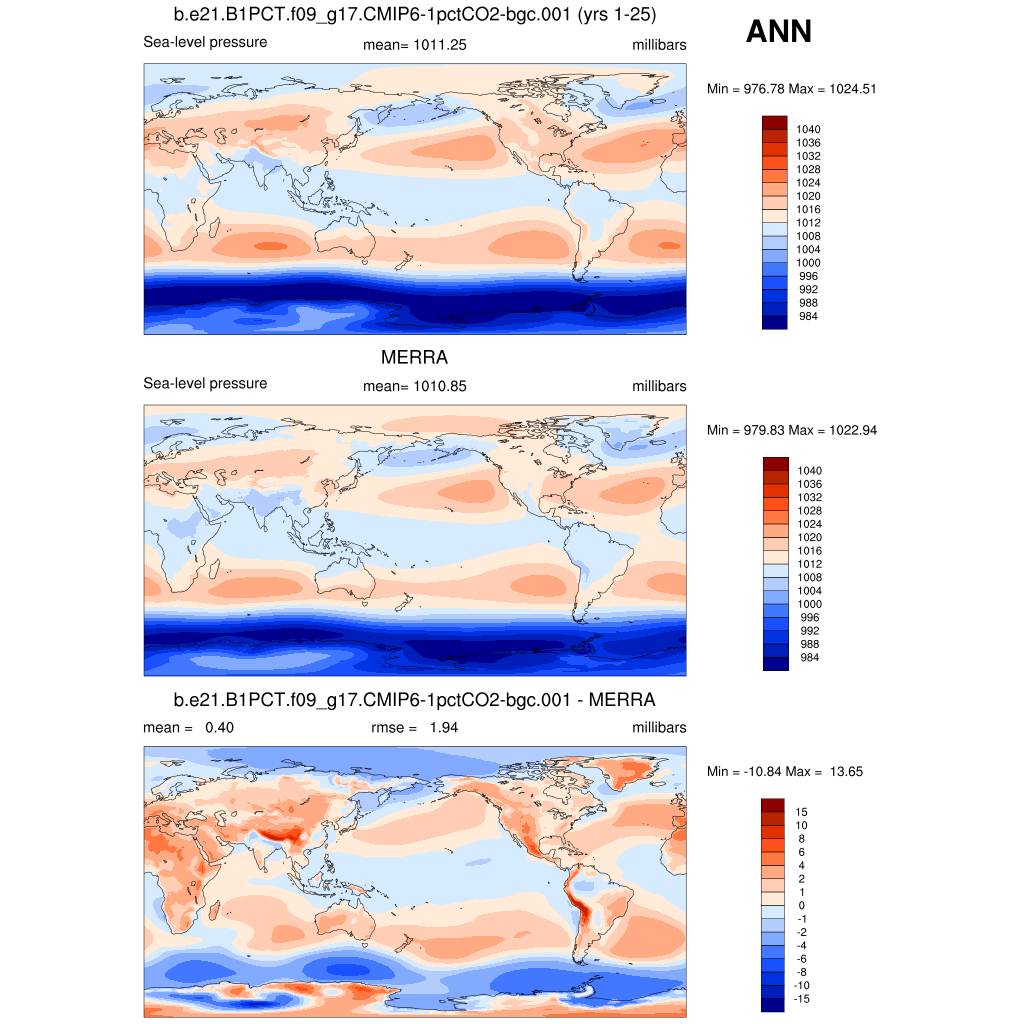
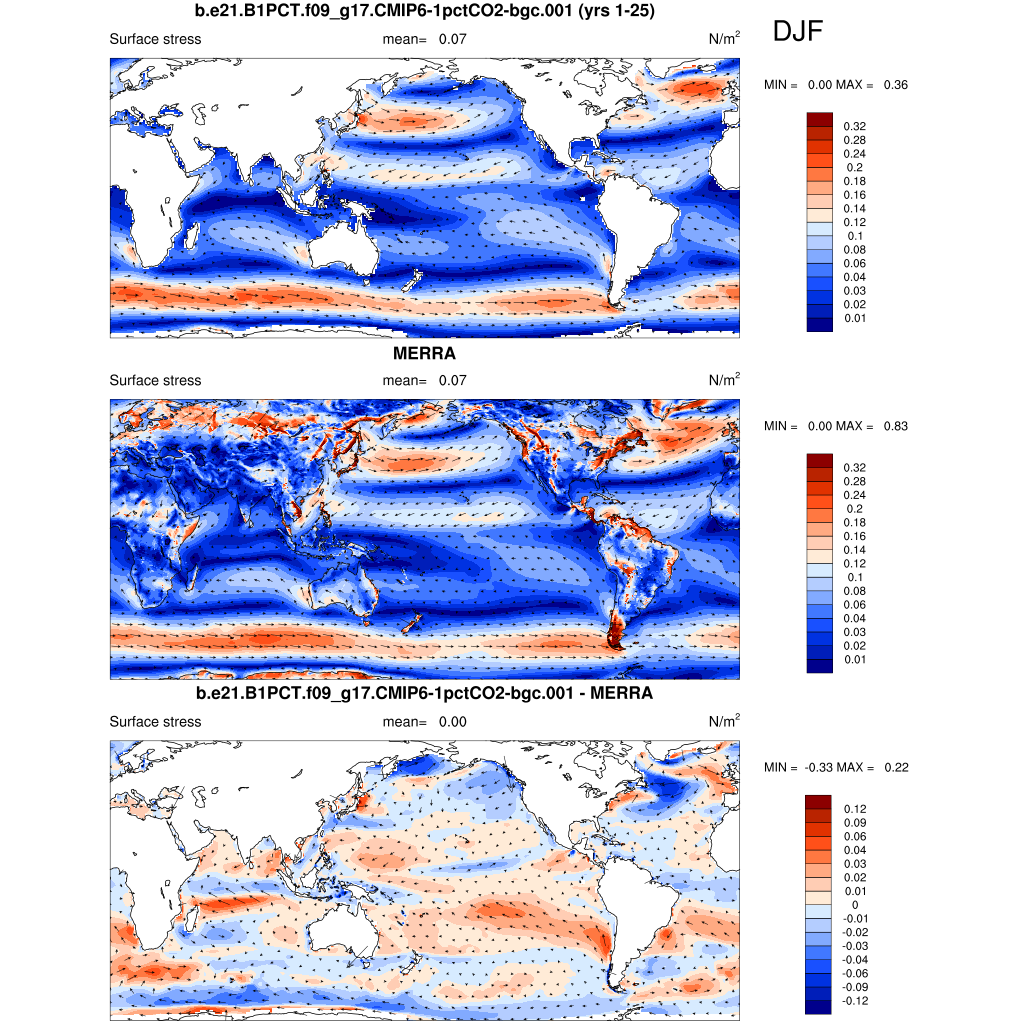
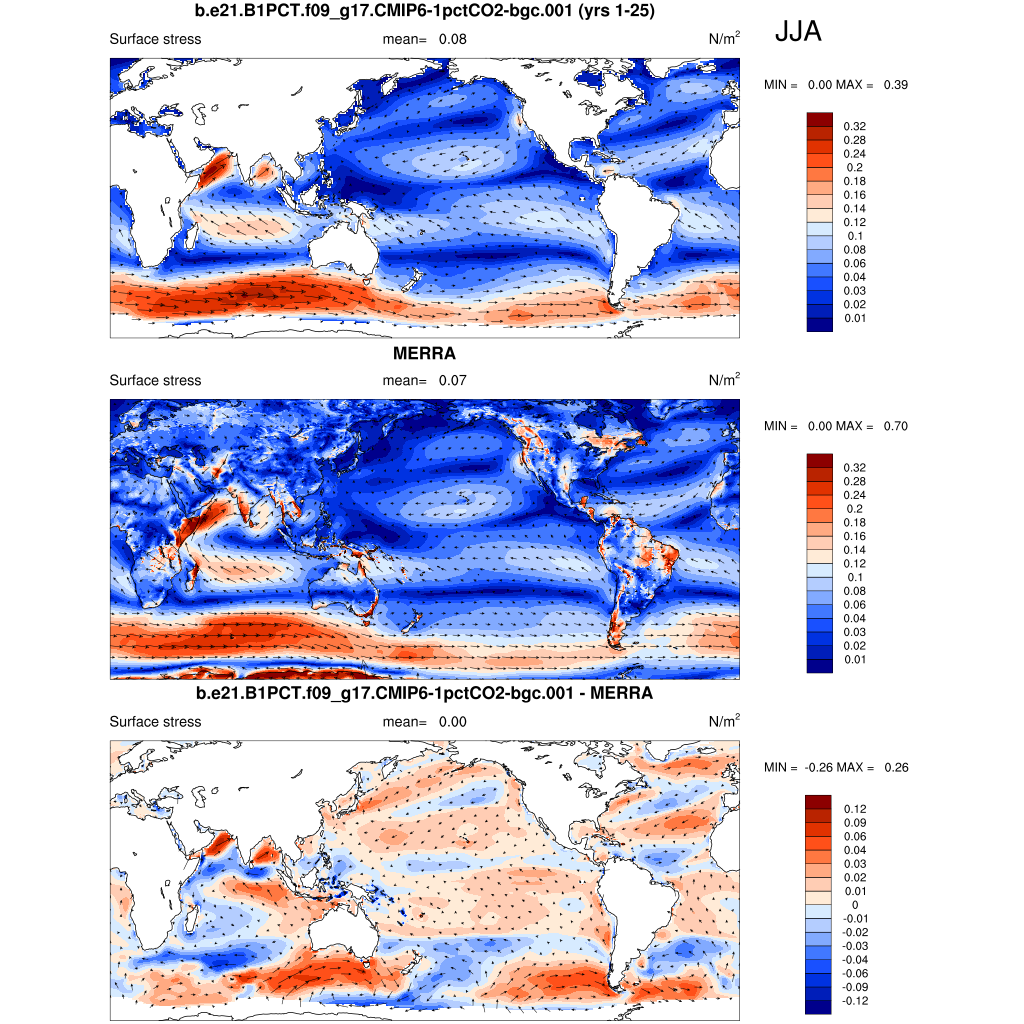
| MERRA Analysis 1979-2013 (NASA) | DJF | JJA | ANN | |
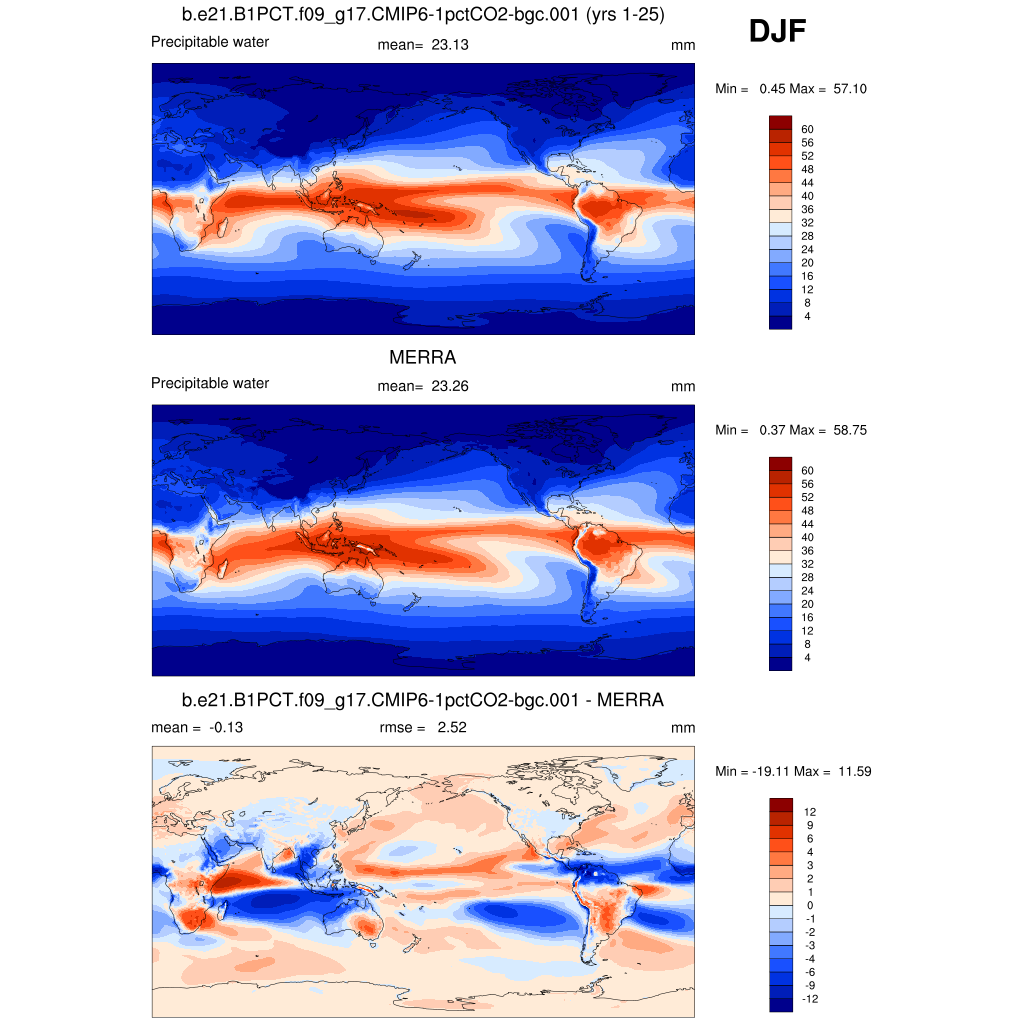
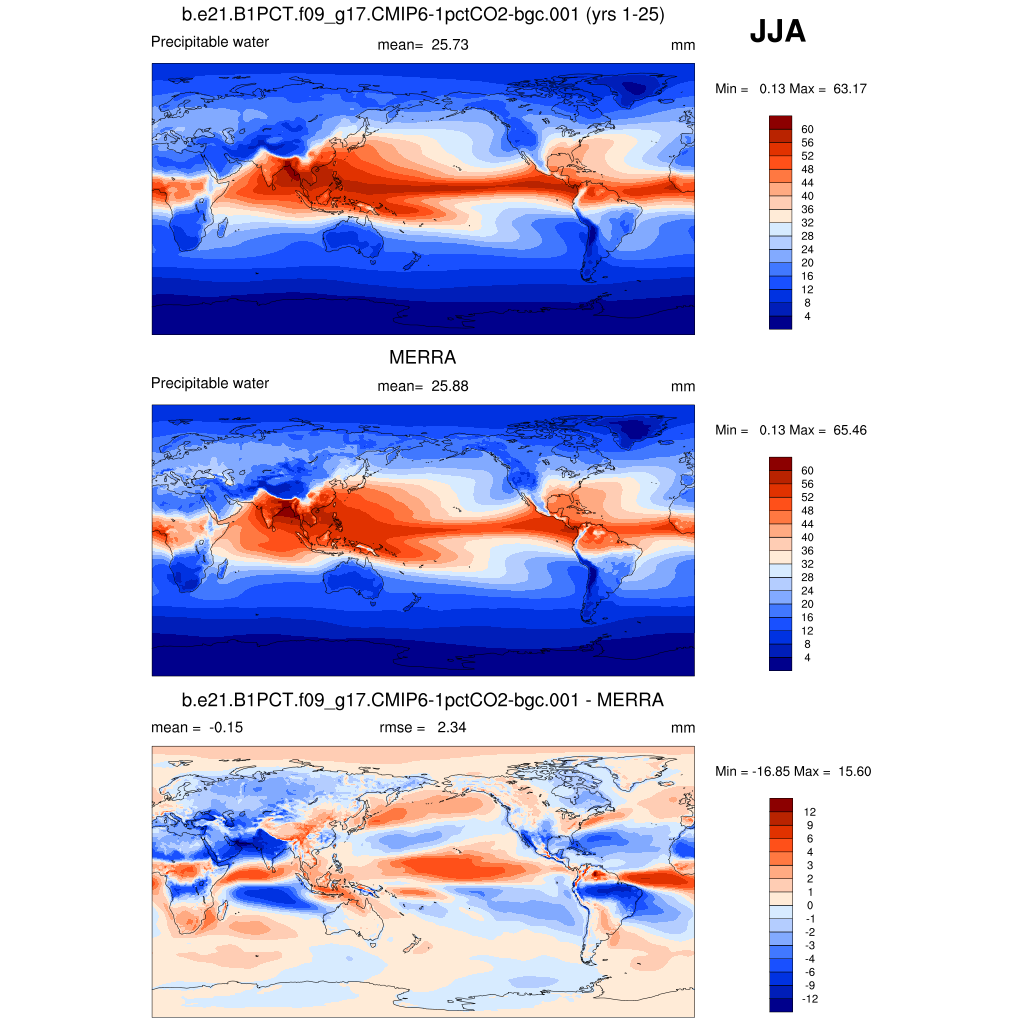
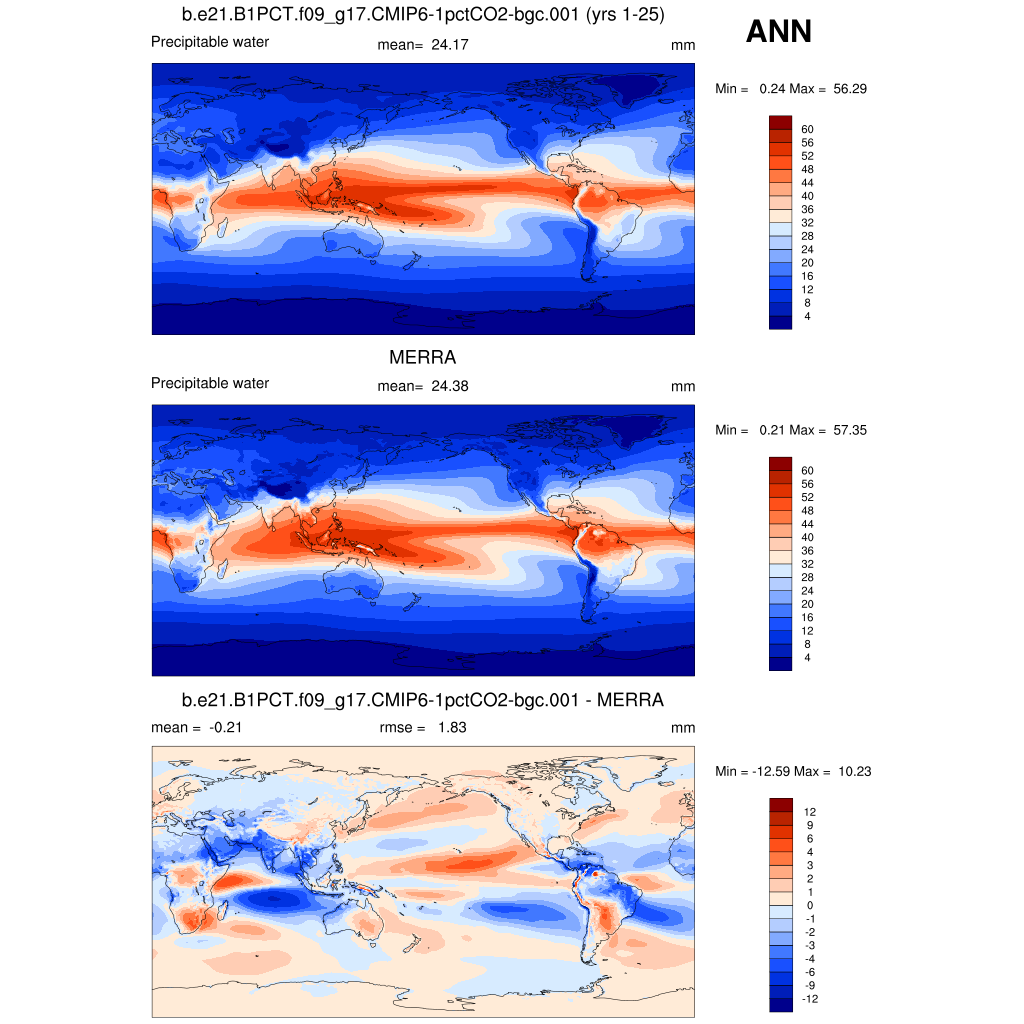
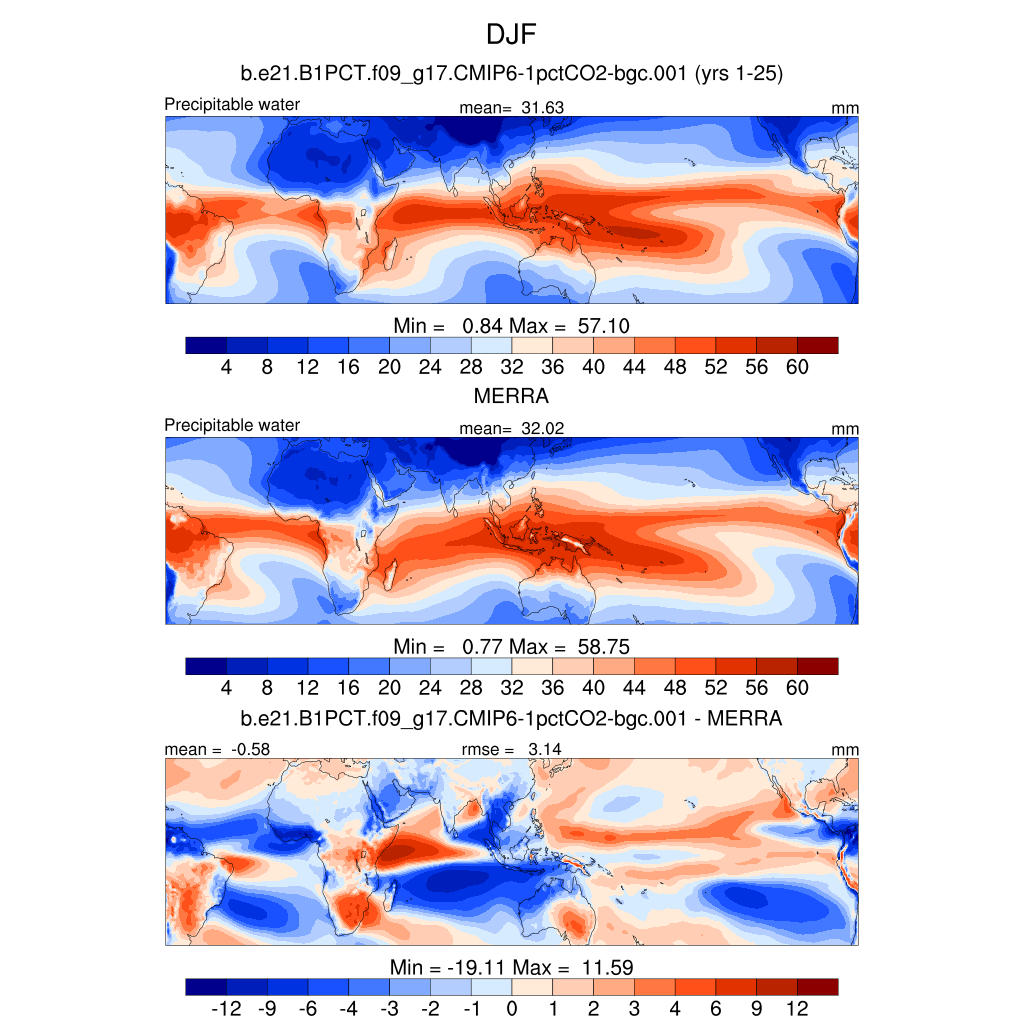
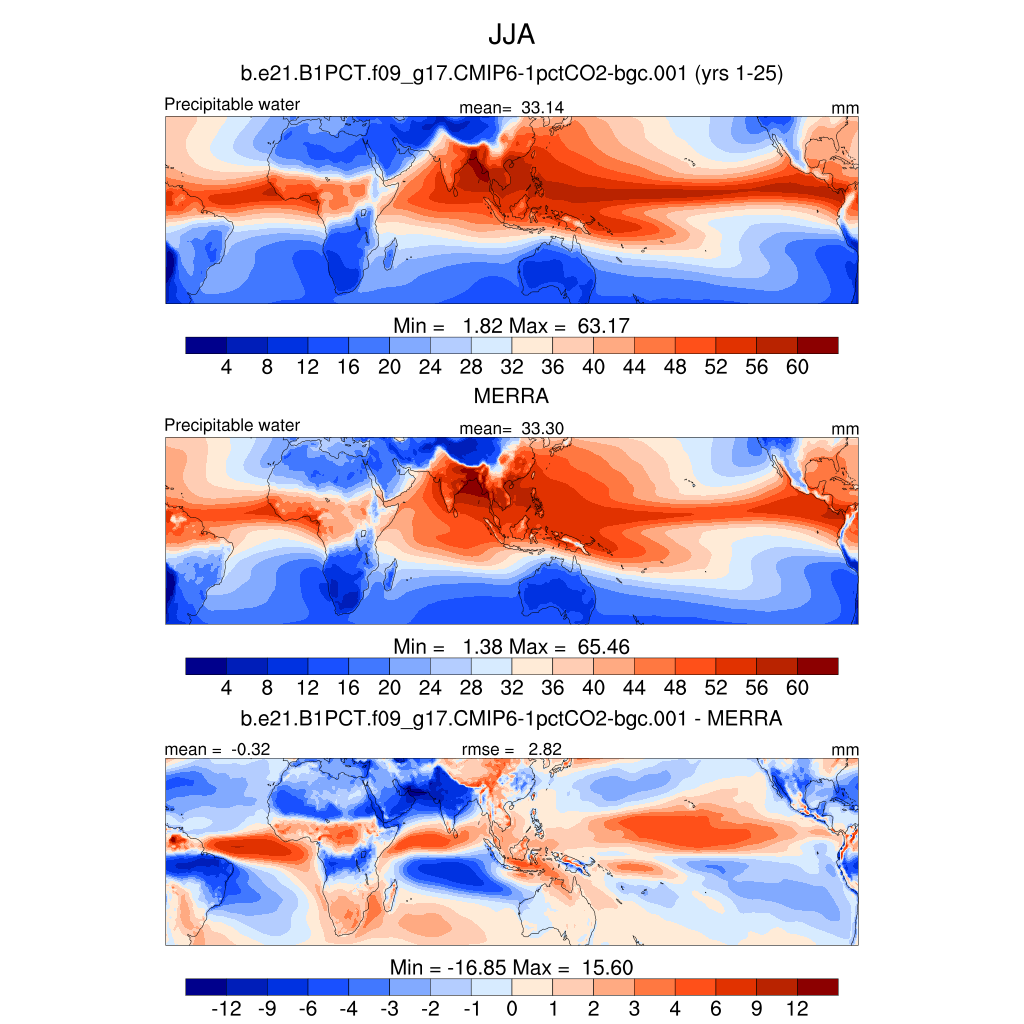
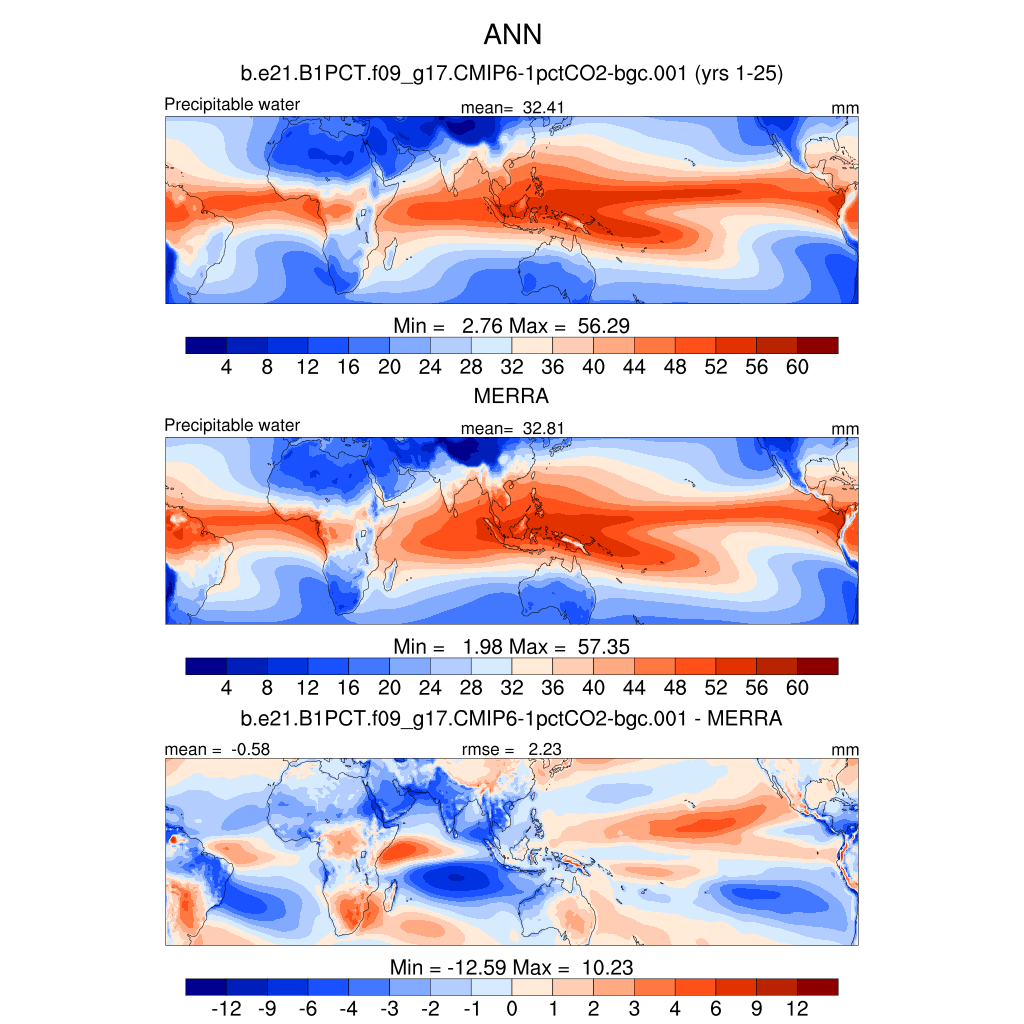
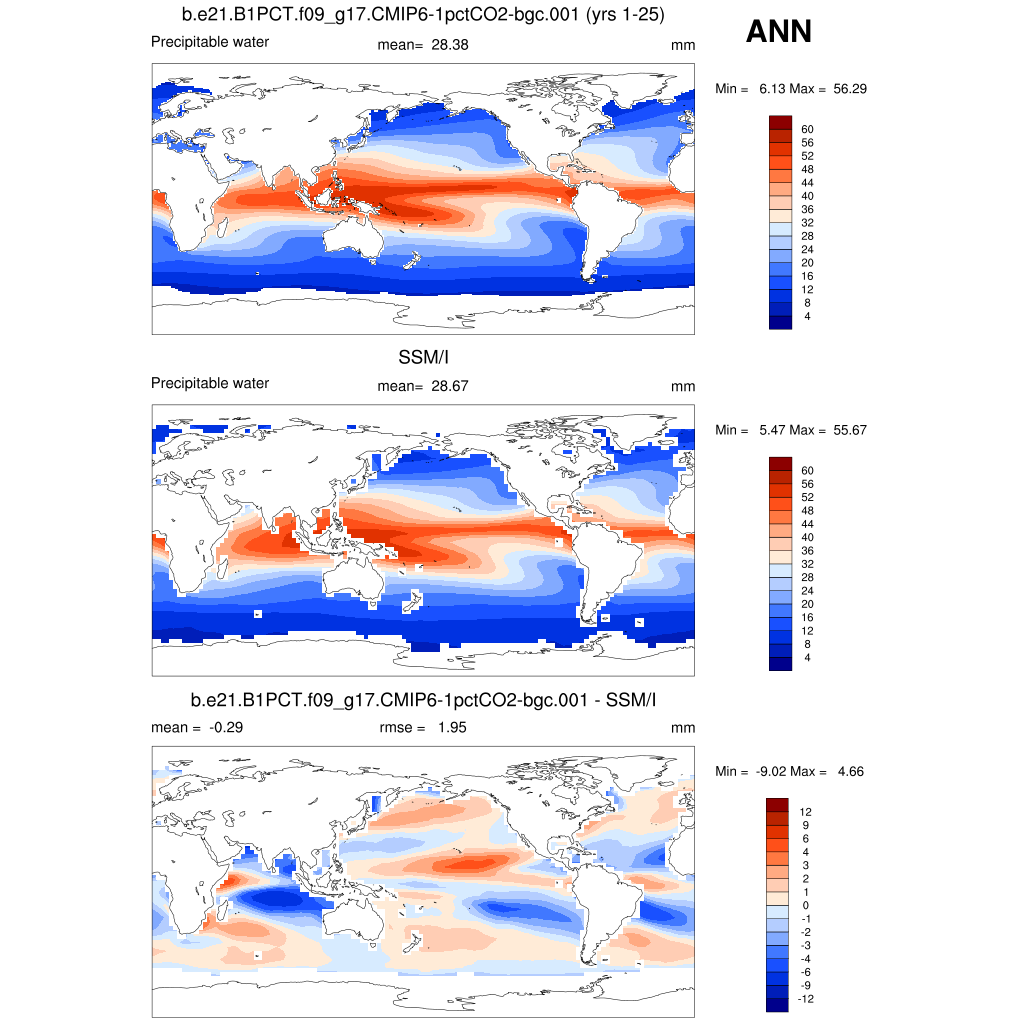
| PREH2O * | Total precipitable water | plot | plot | plot |
| PREH2O TROP | Tropical precipitable water | plot | plot | plot |
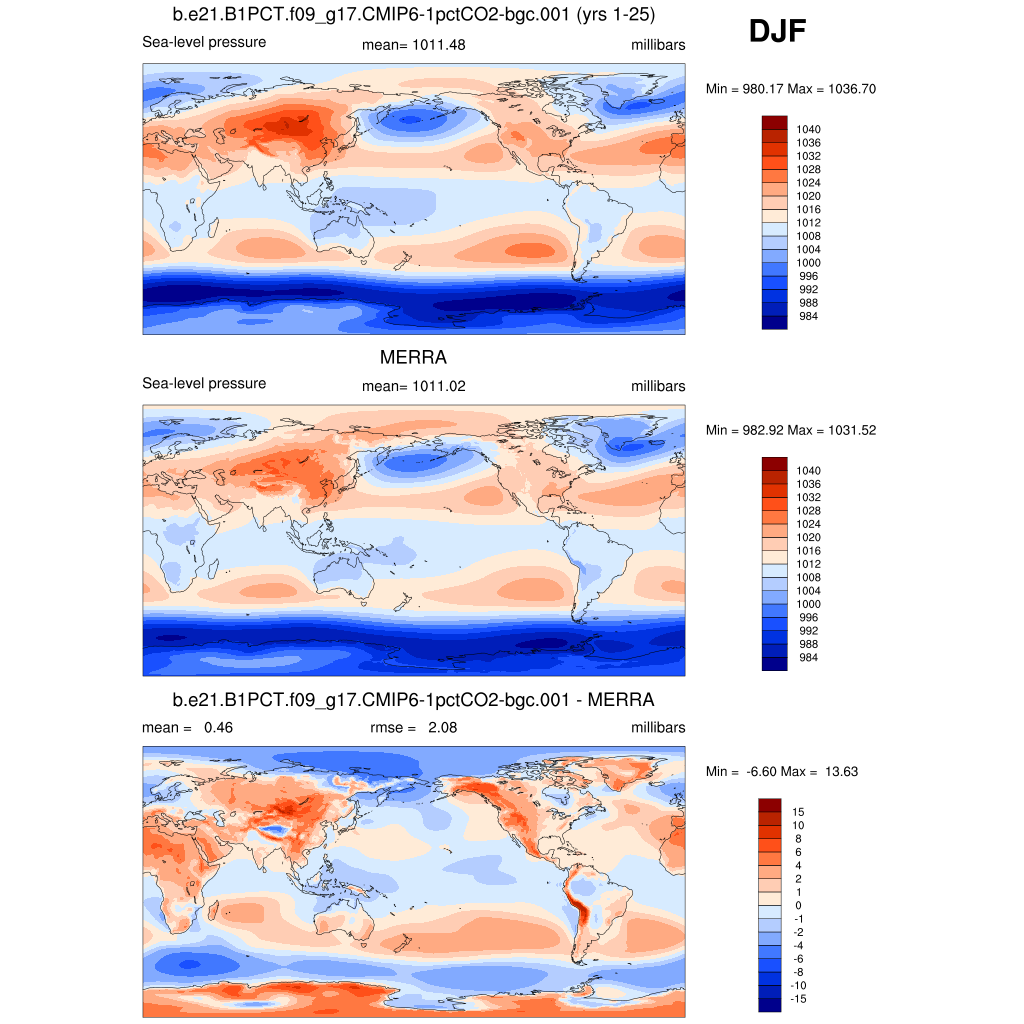
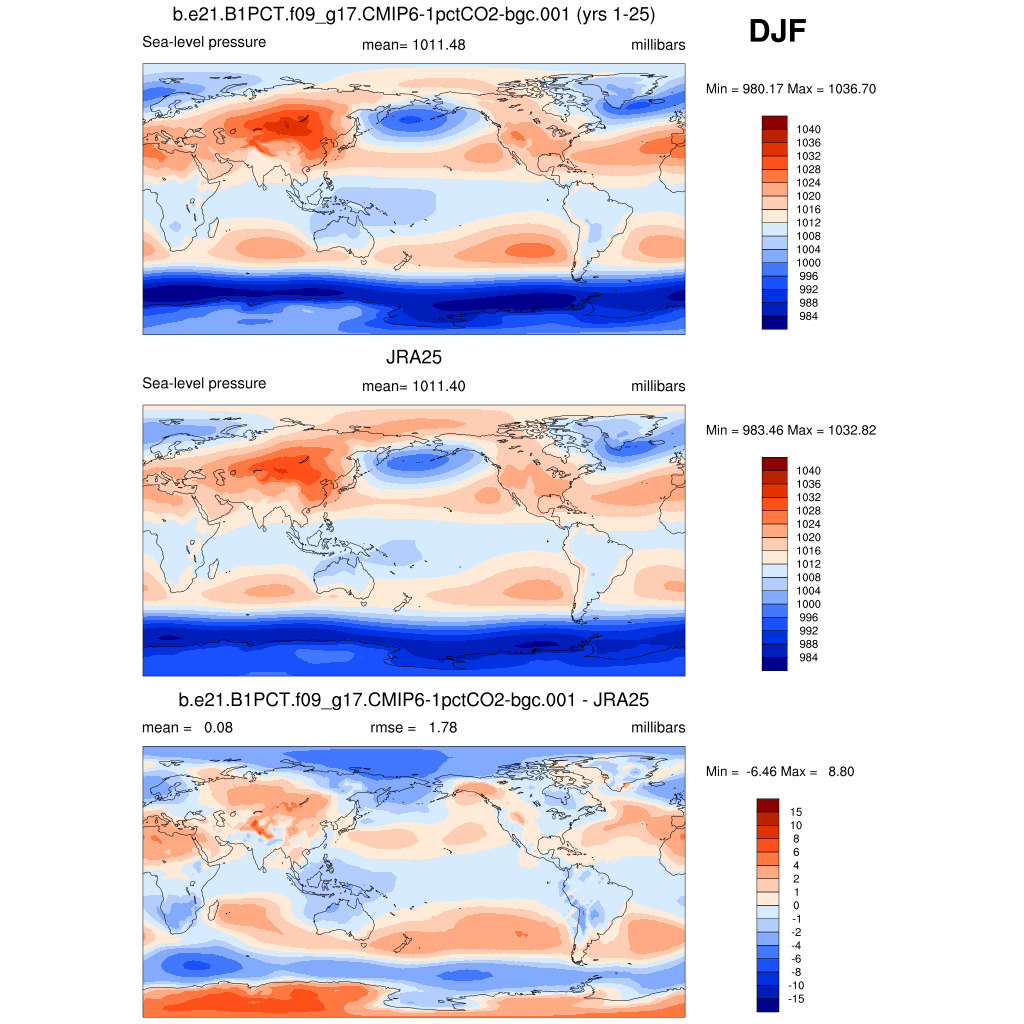
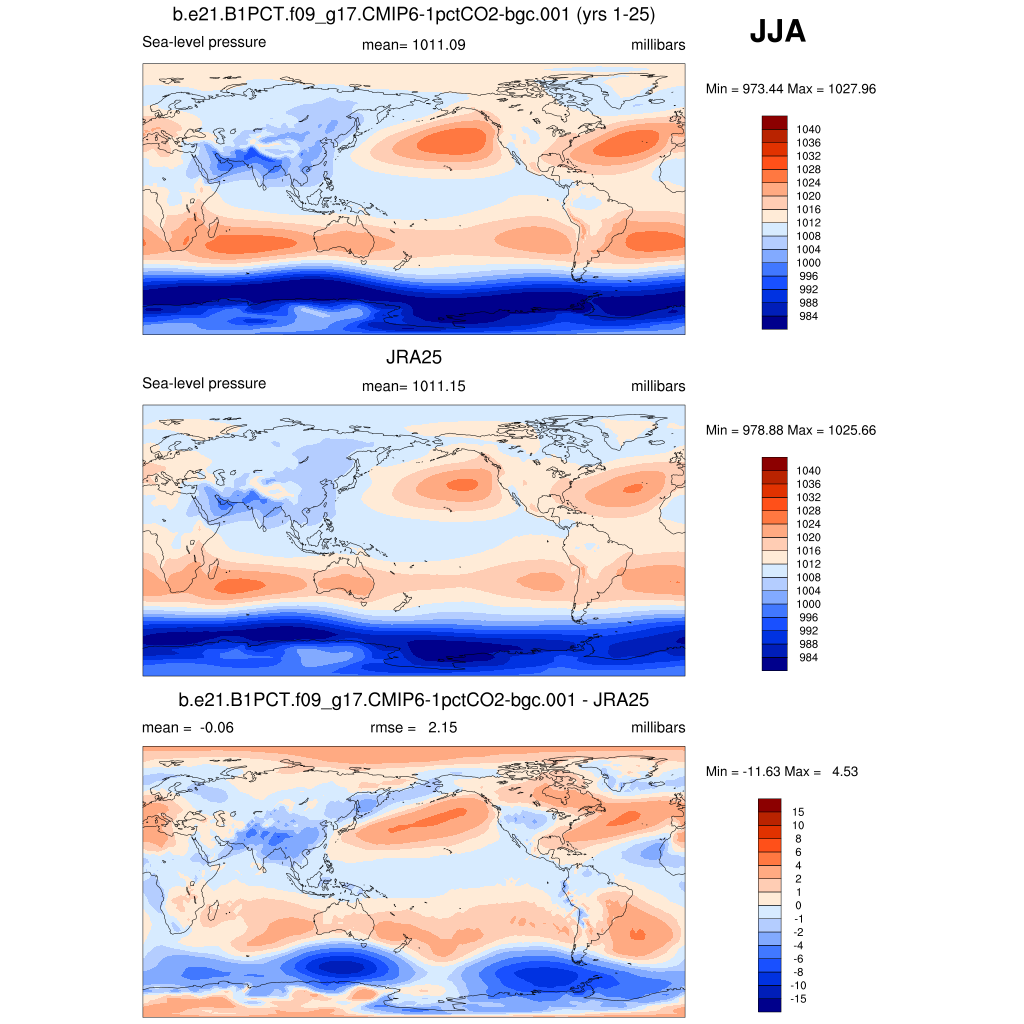
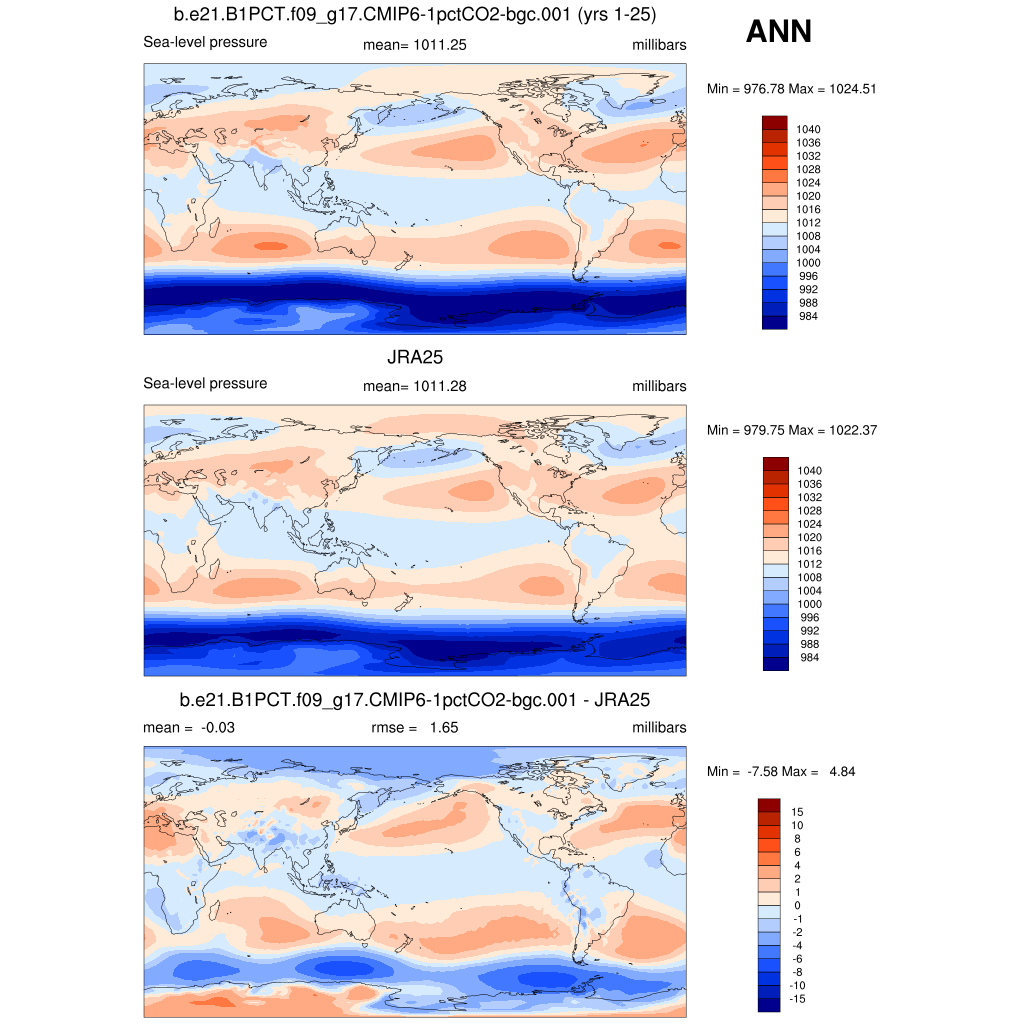
| PSL * | Sea-level pressure | plot | plot | plot |
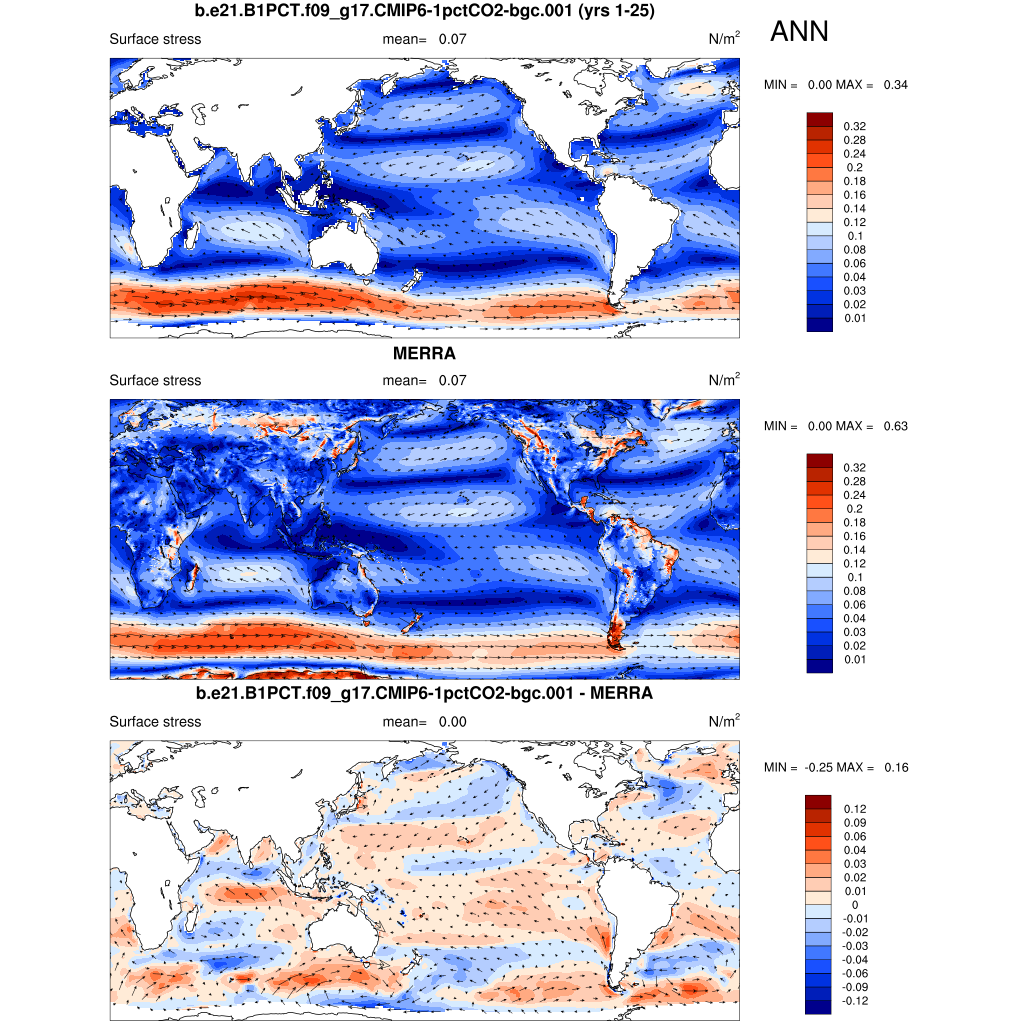
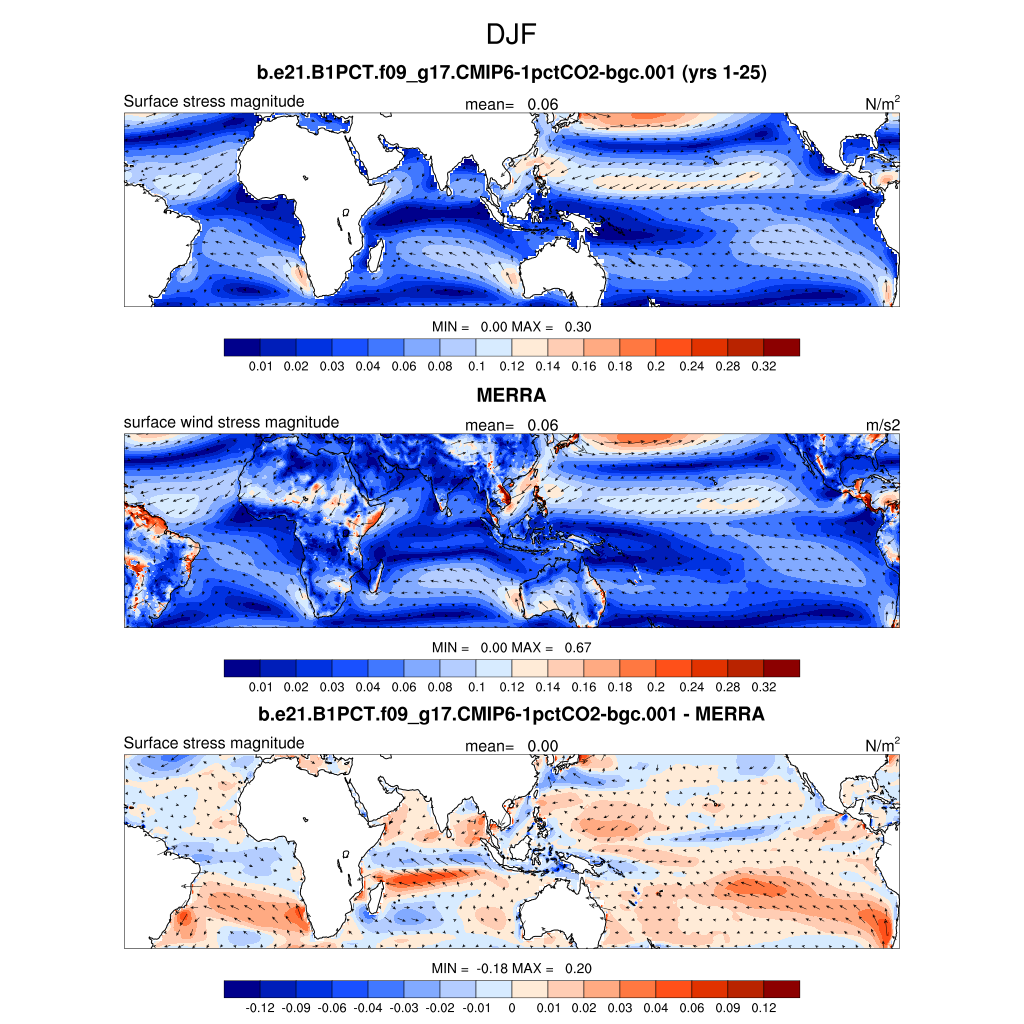
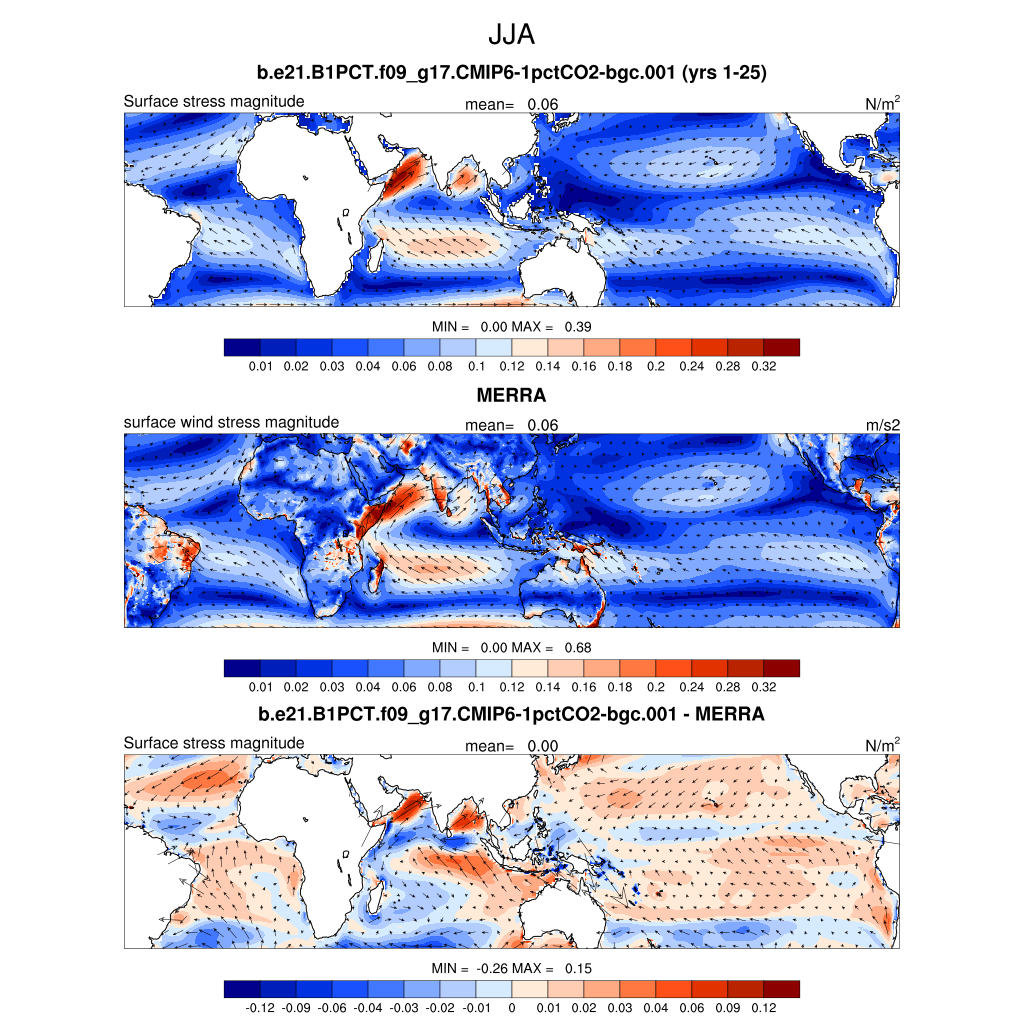
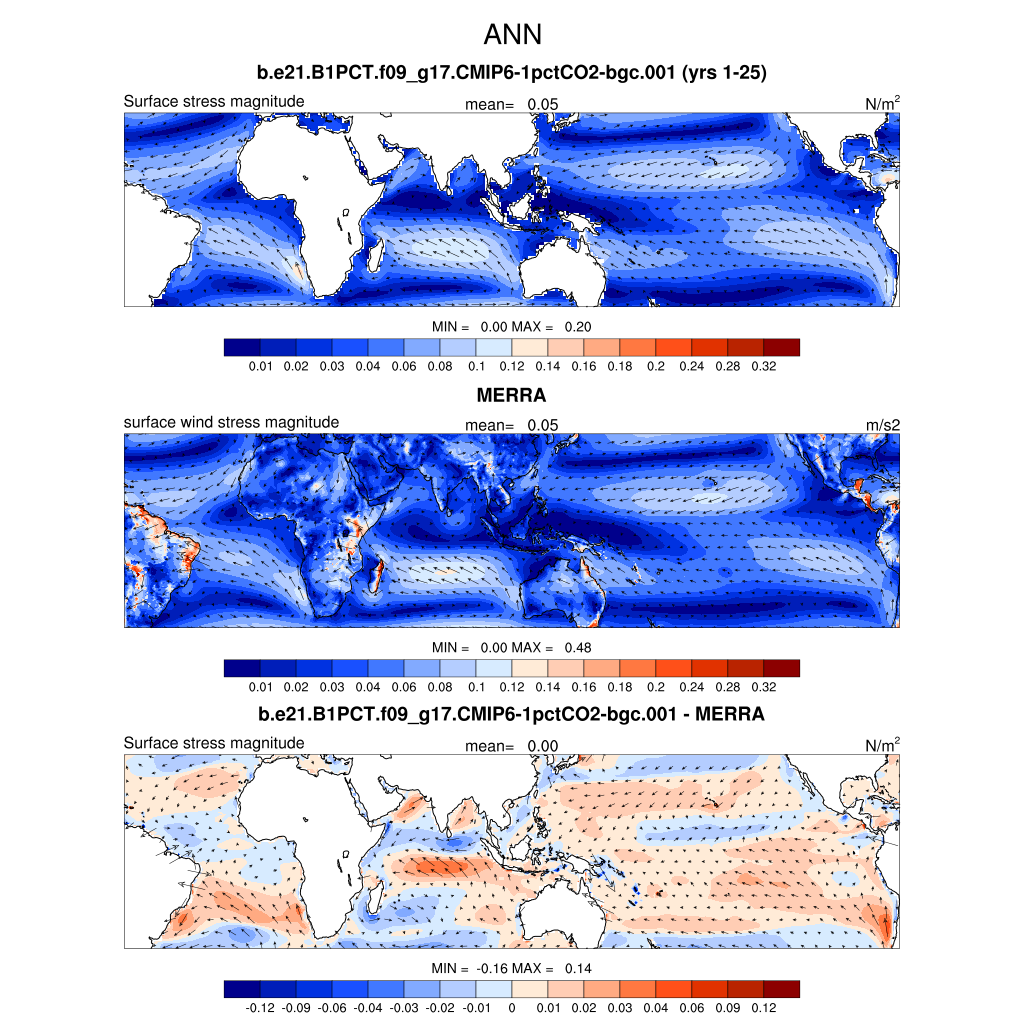
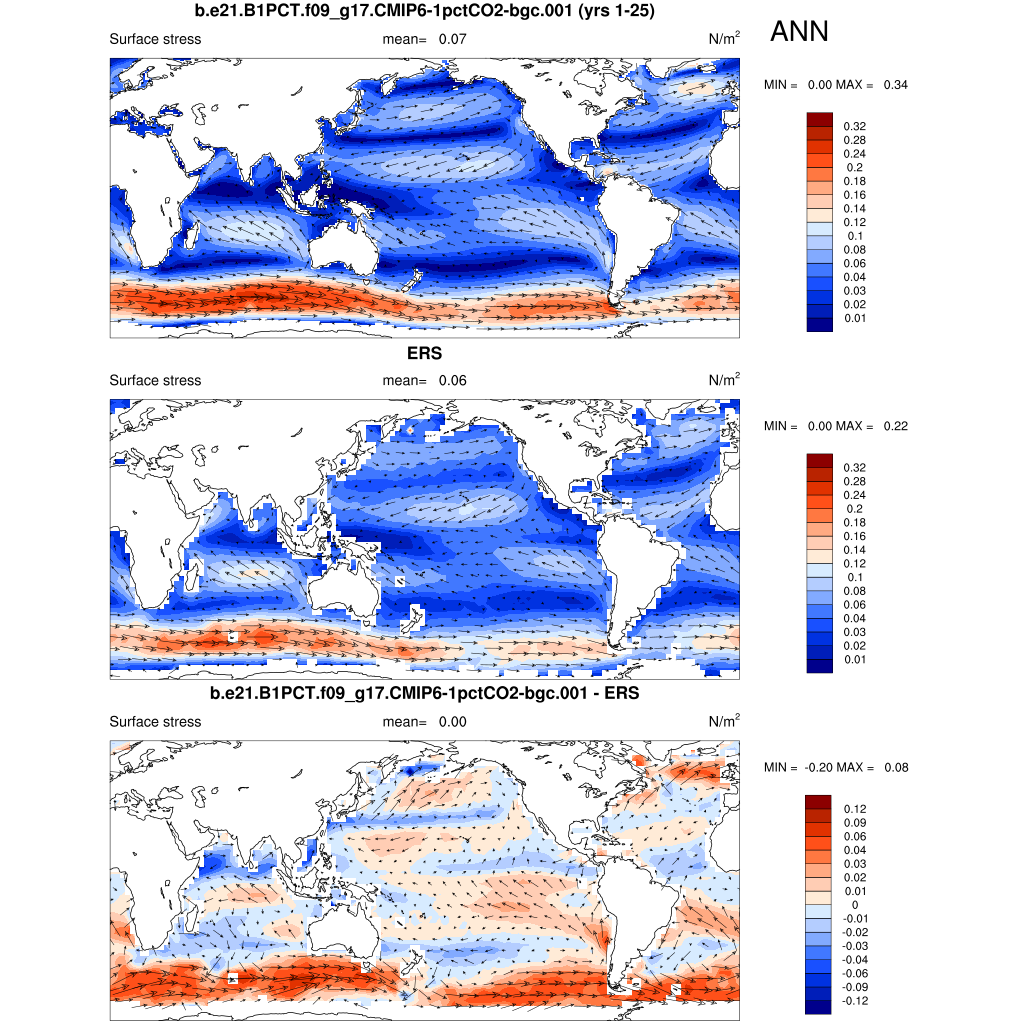
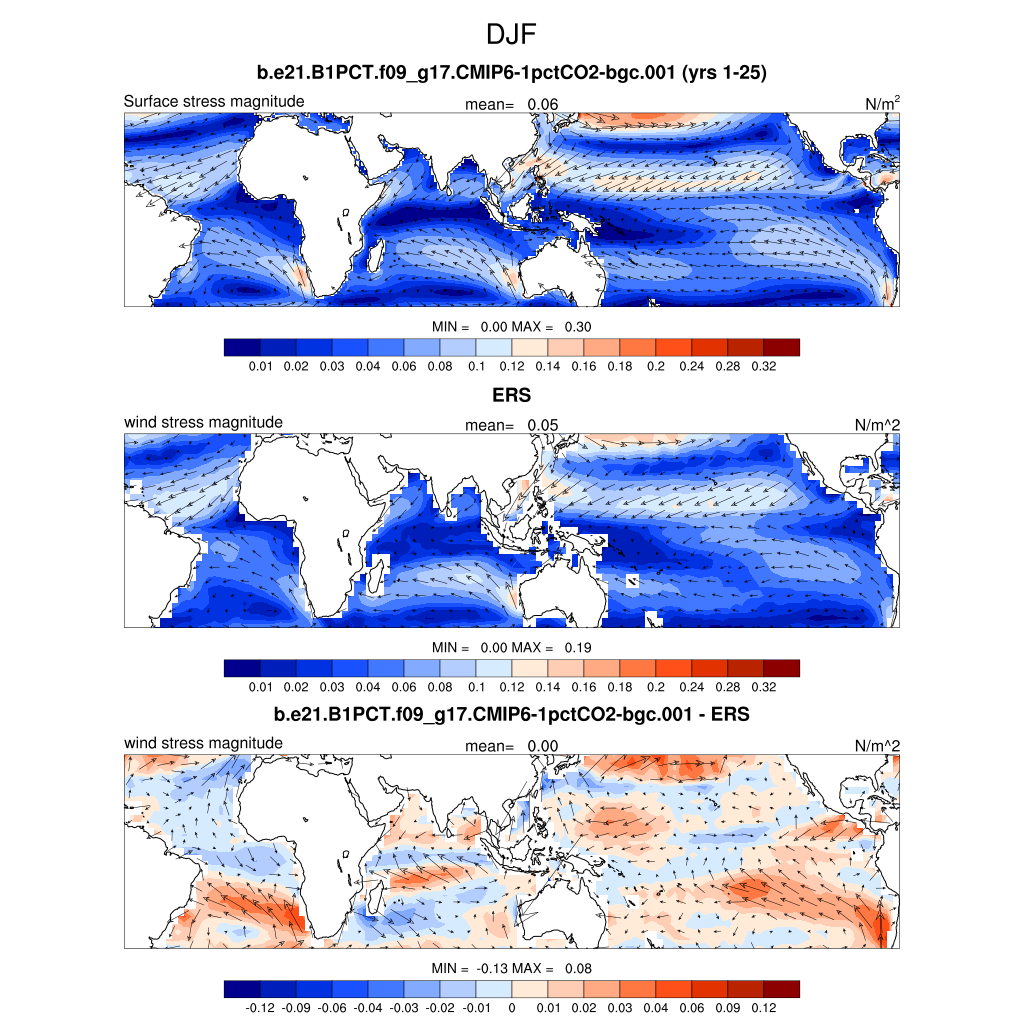
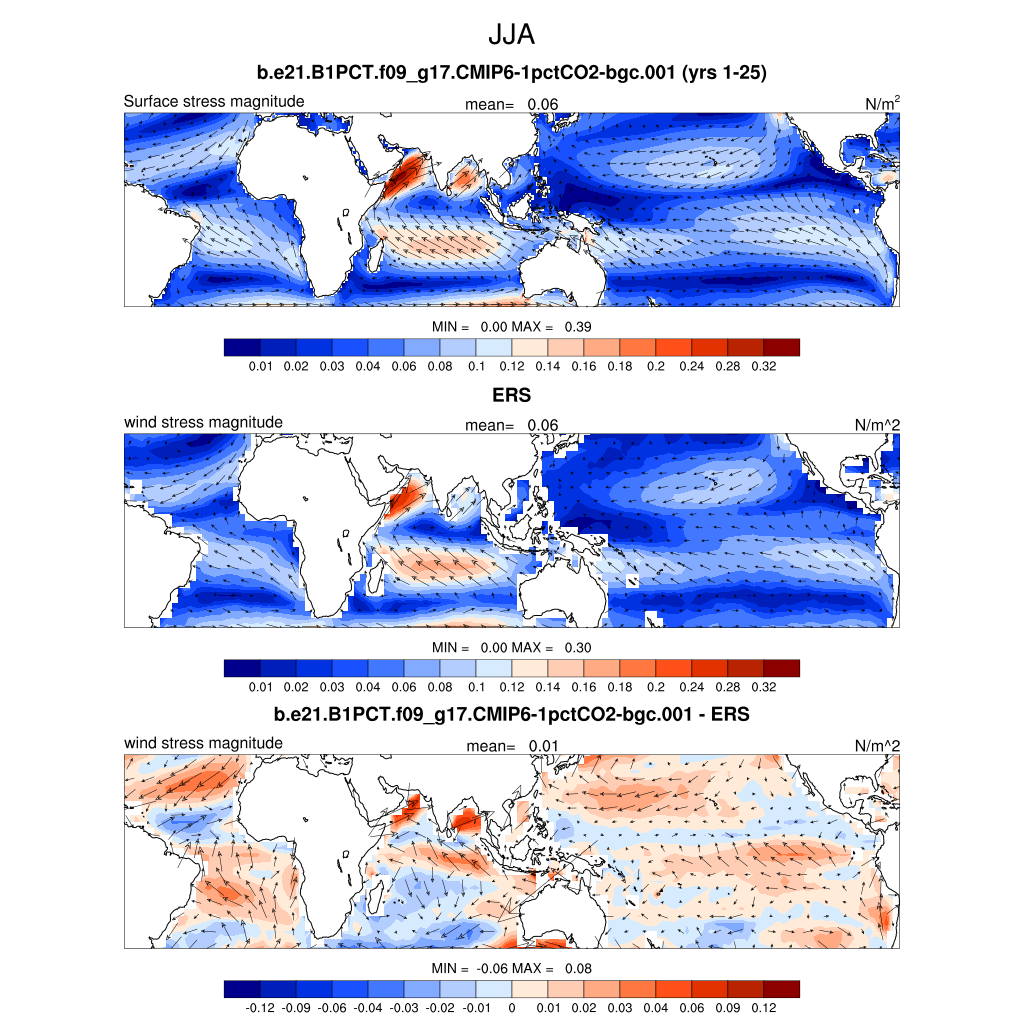
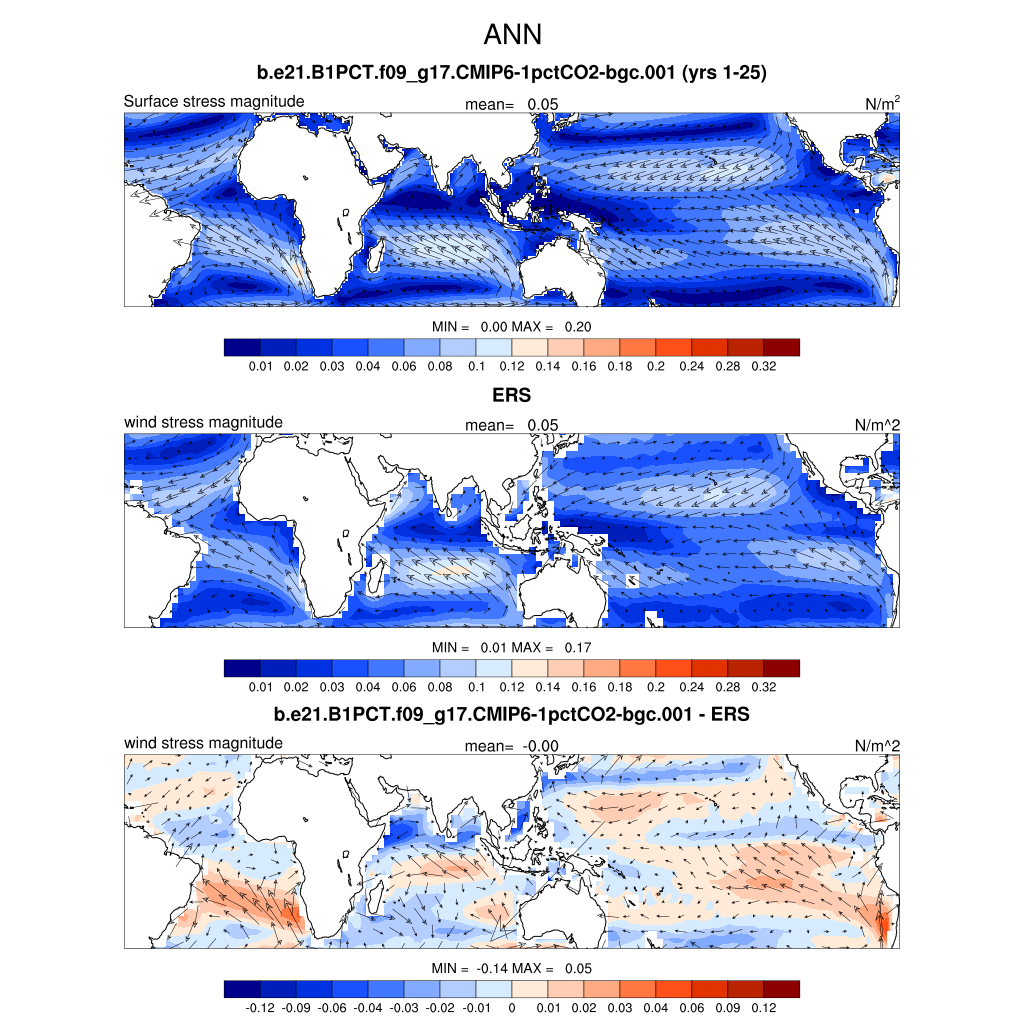
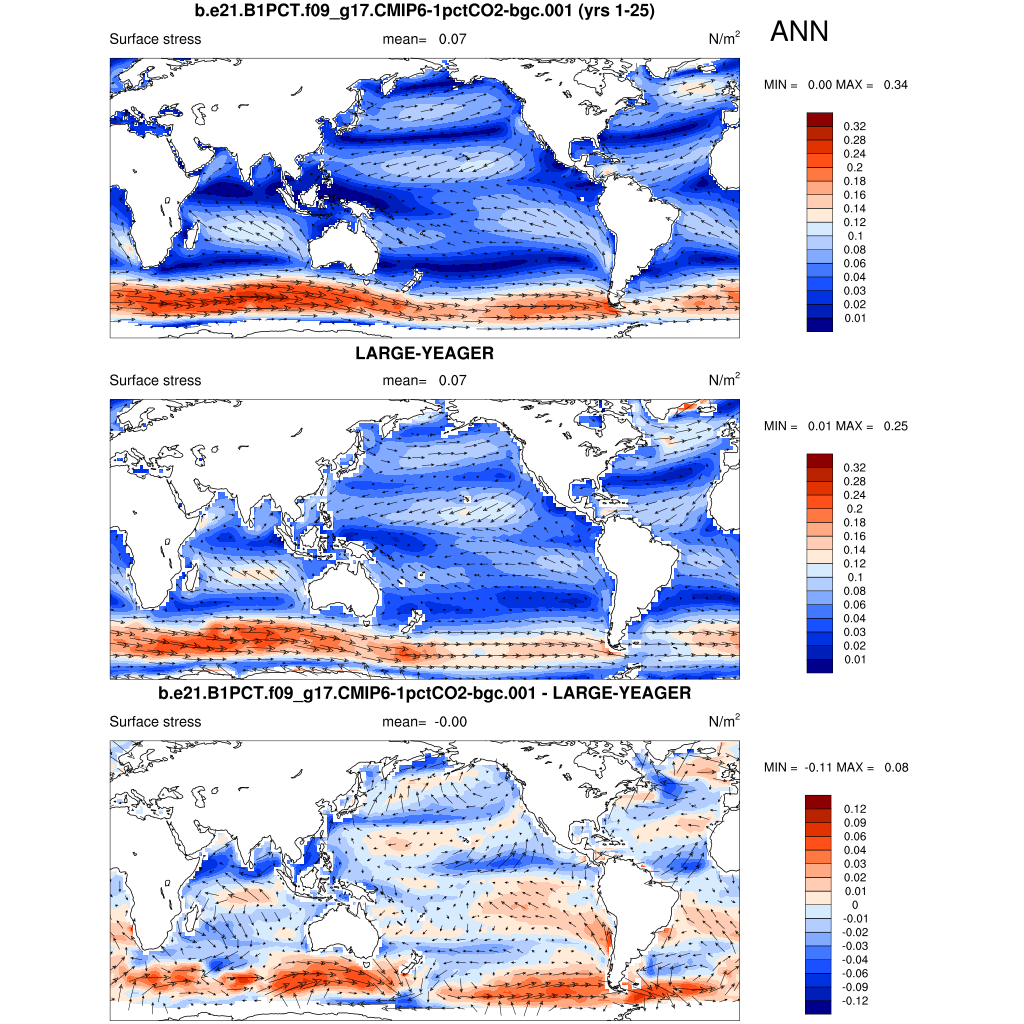
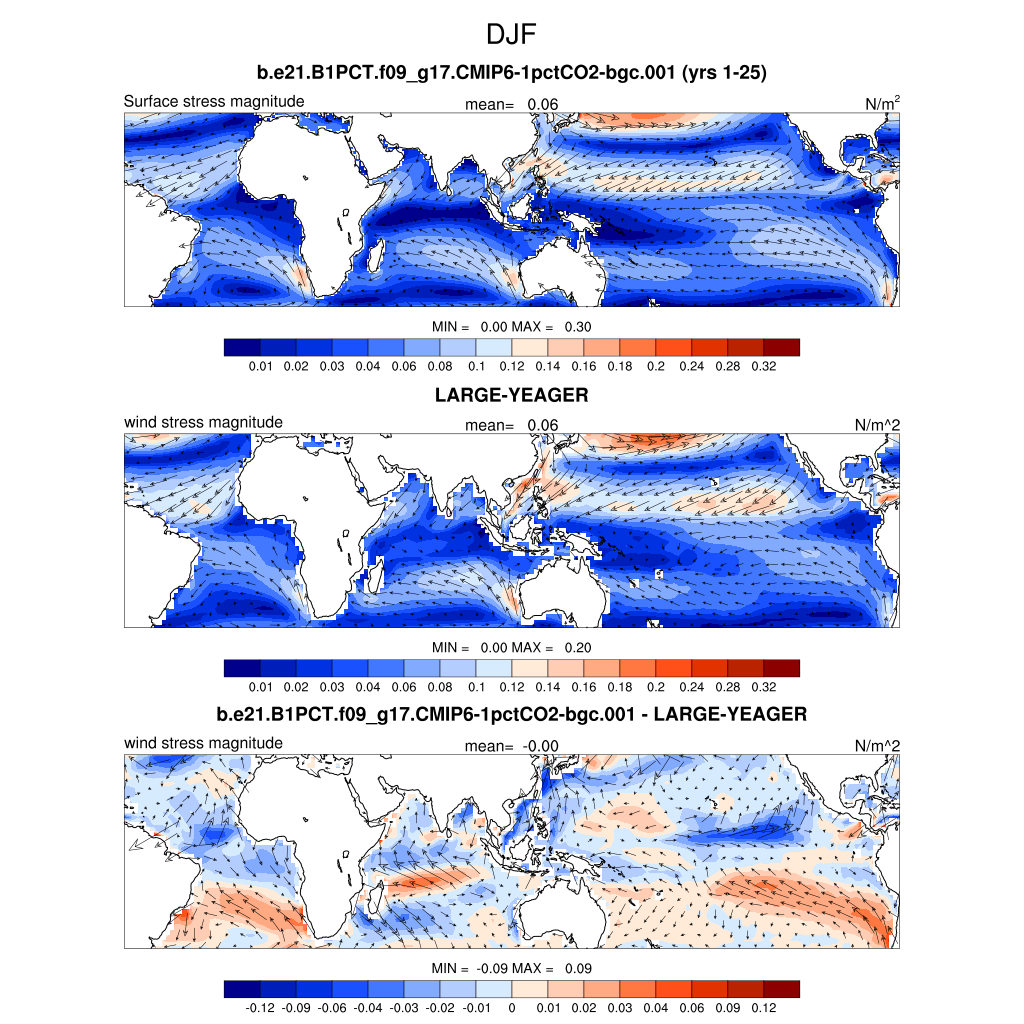
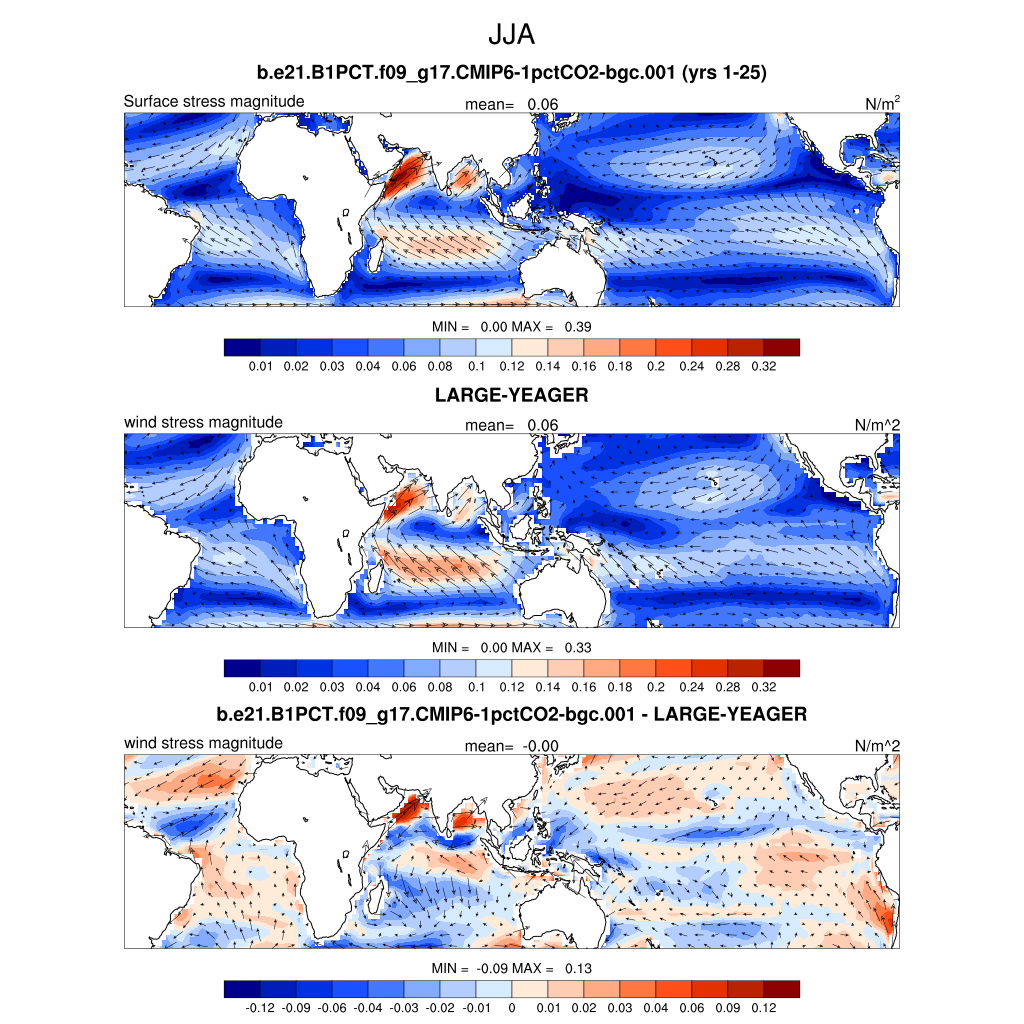
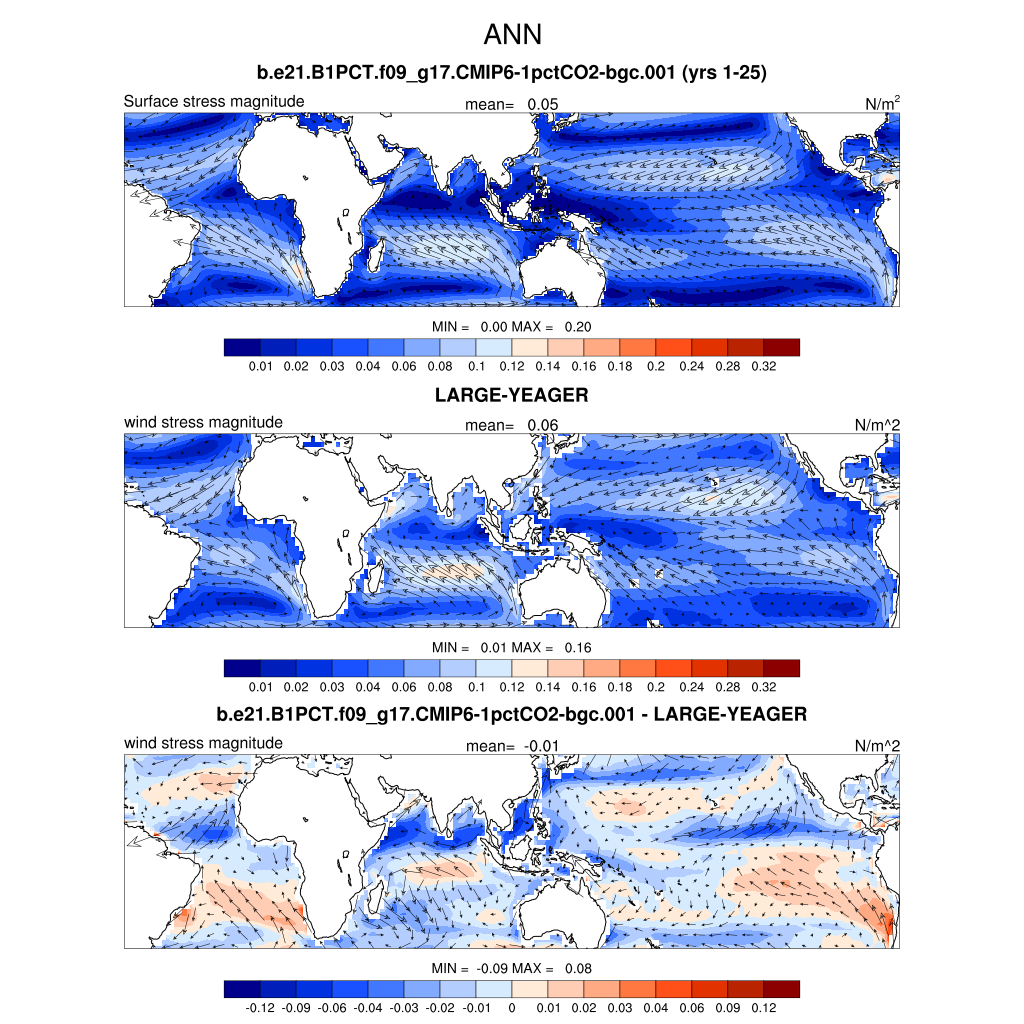
| SURF STRESS * | Surface wind stress (ocean) | plot | plot | plot |
| SURF STRESS TROP | Tropical surface wind stress (ocean) | plot | plot | plot |
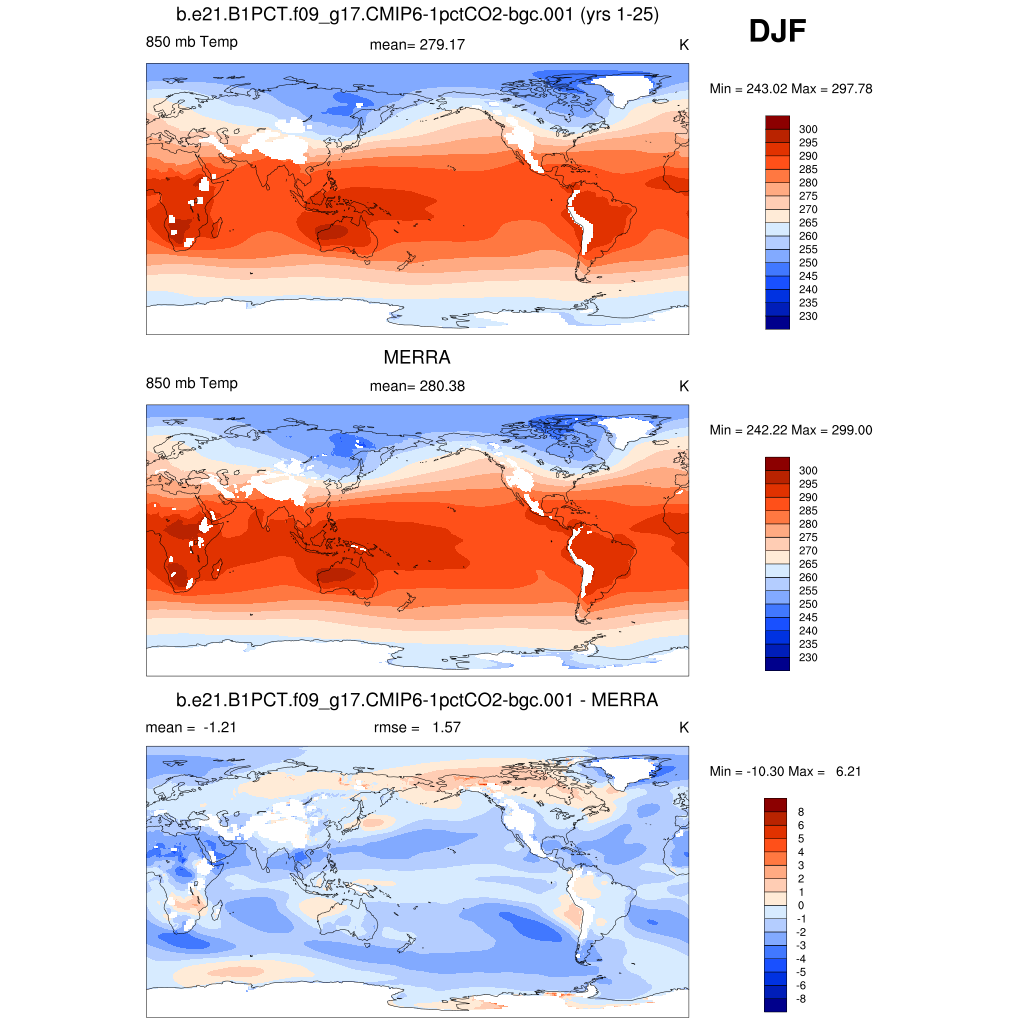
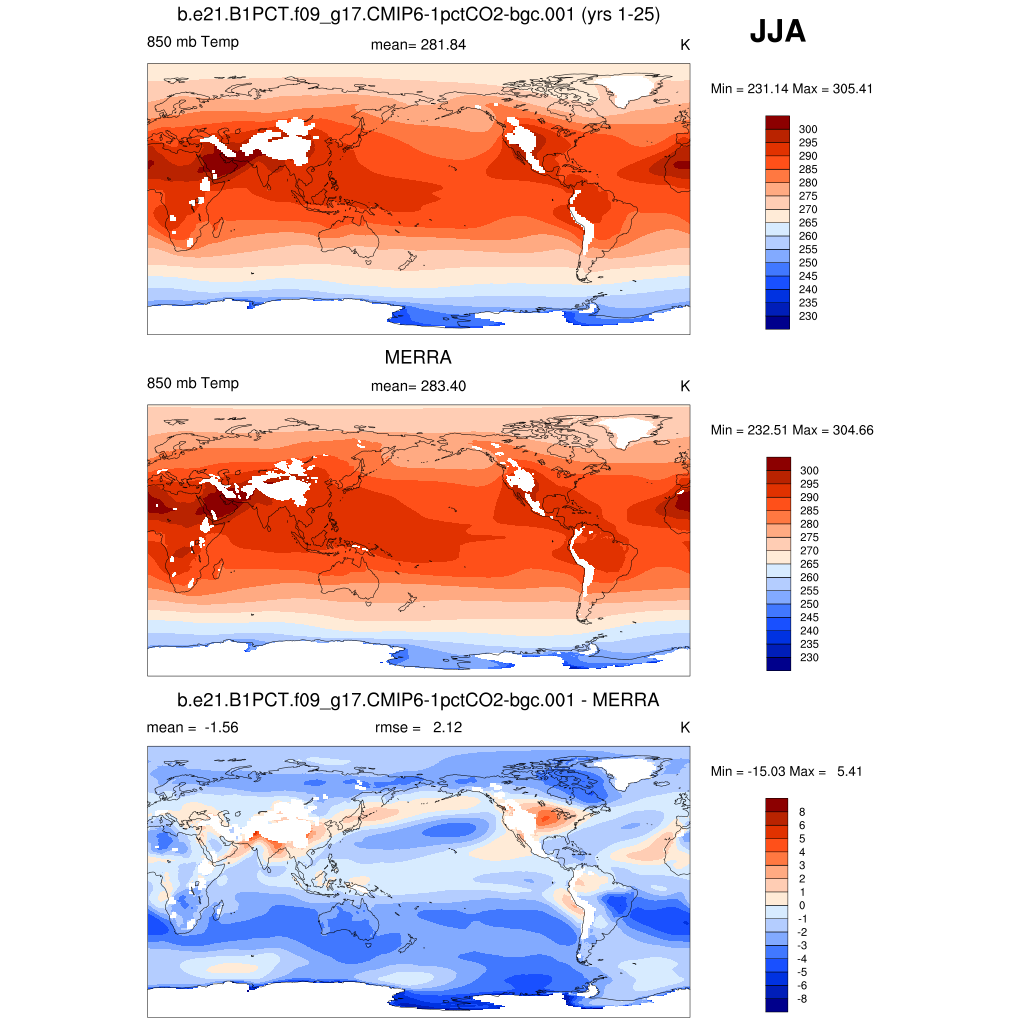
| T 850 * | 850 mb temperature | plot | plot | plot |
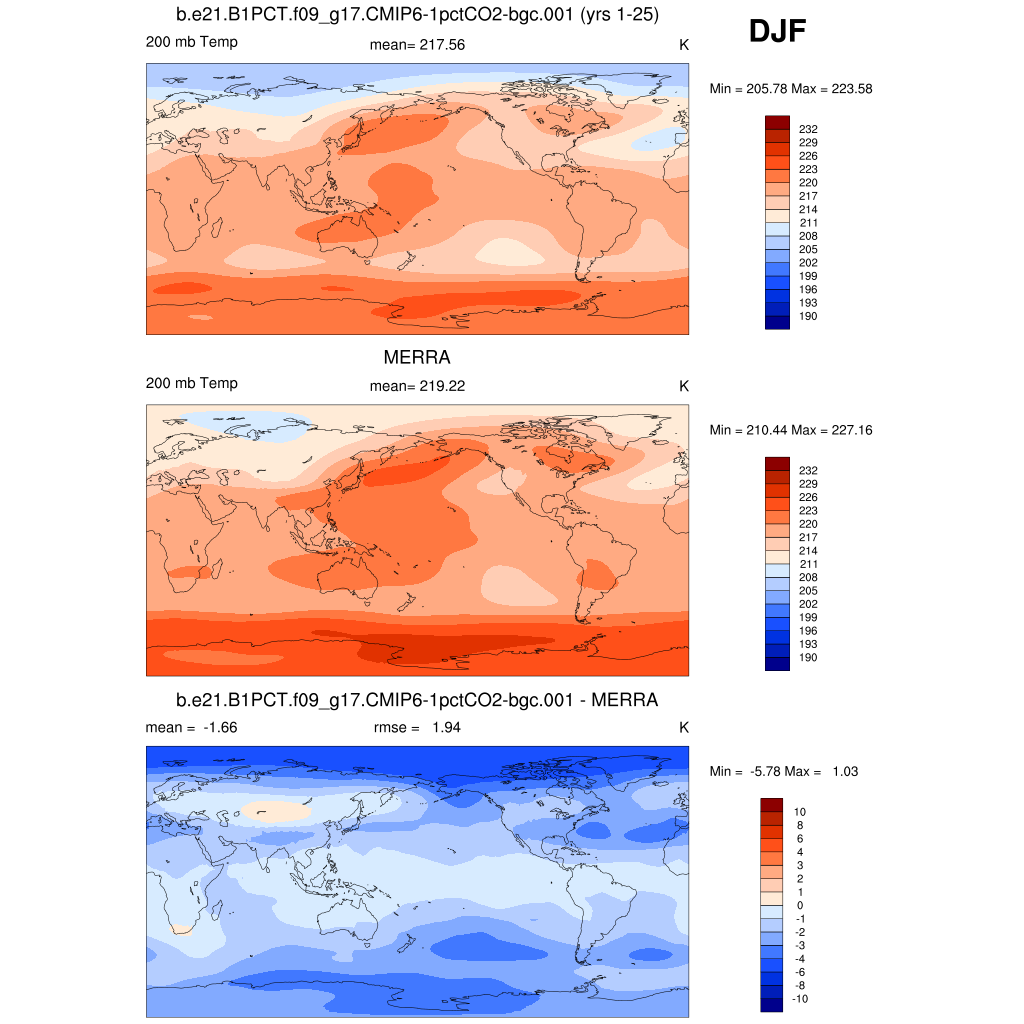
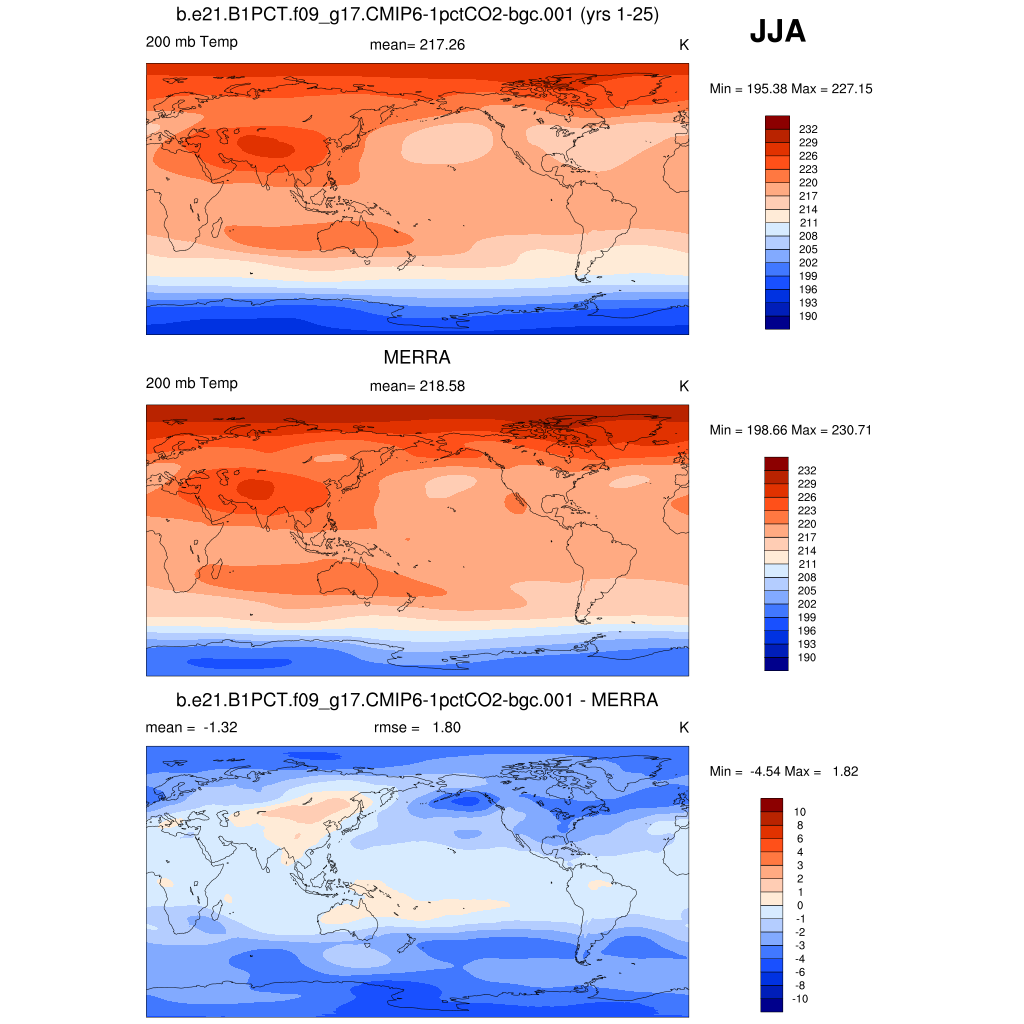
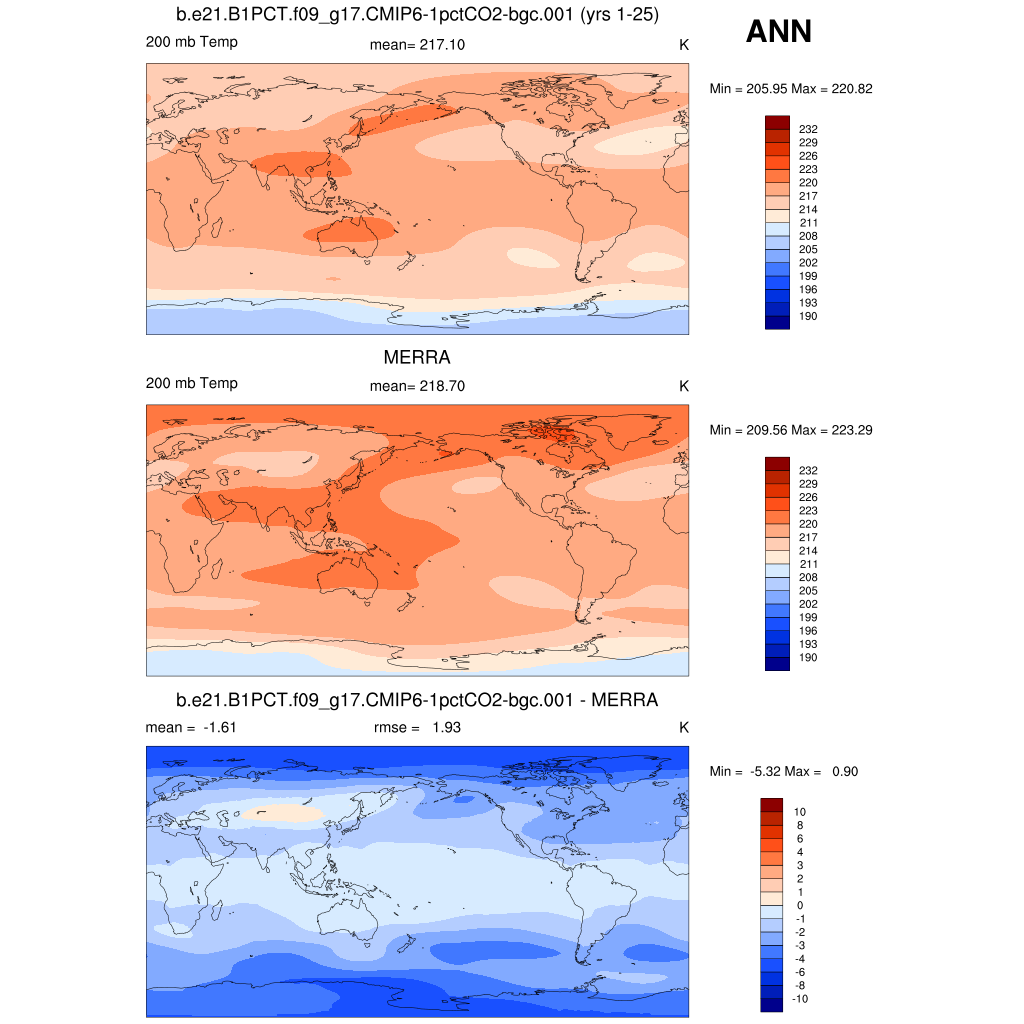
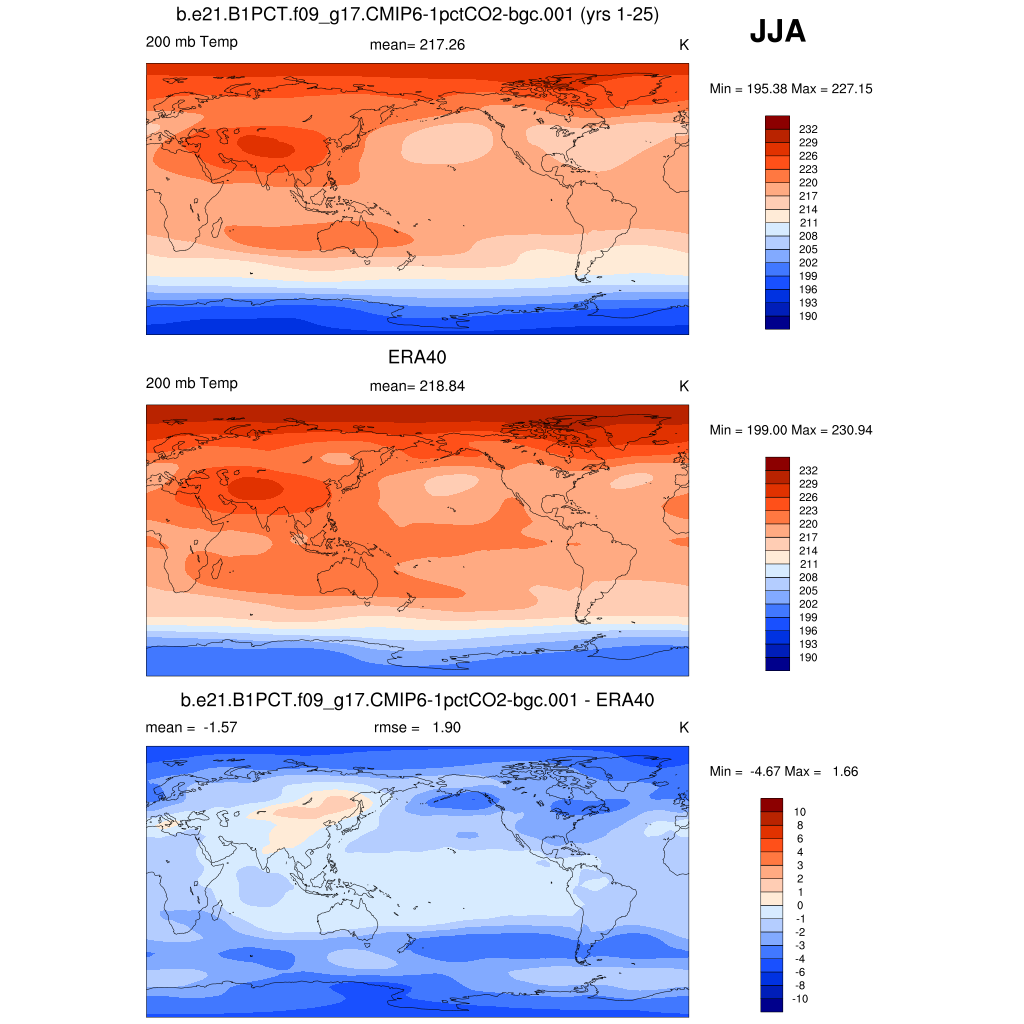
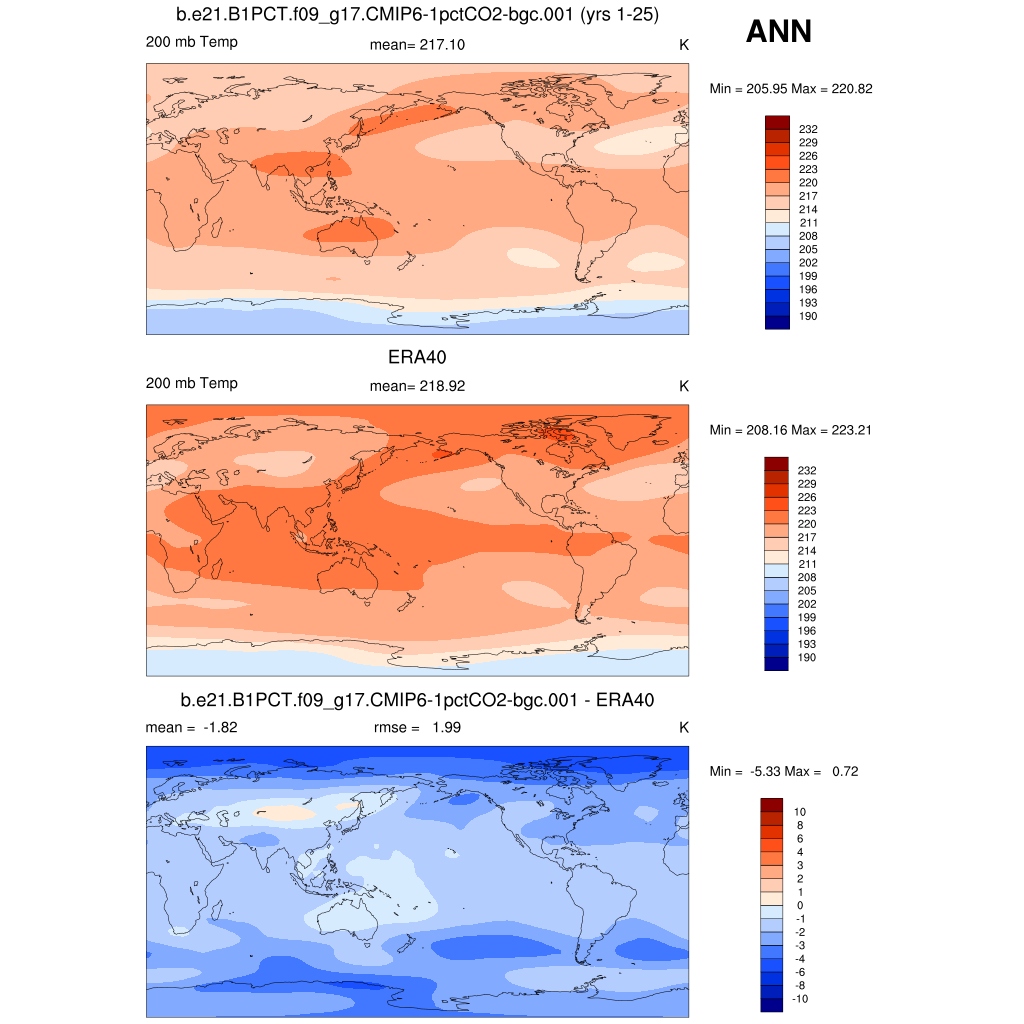
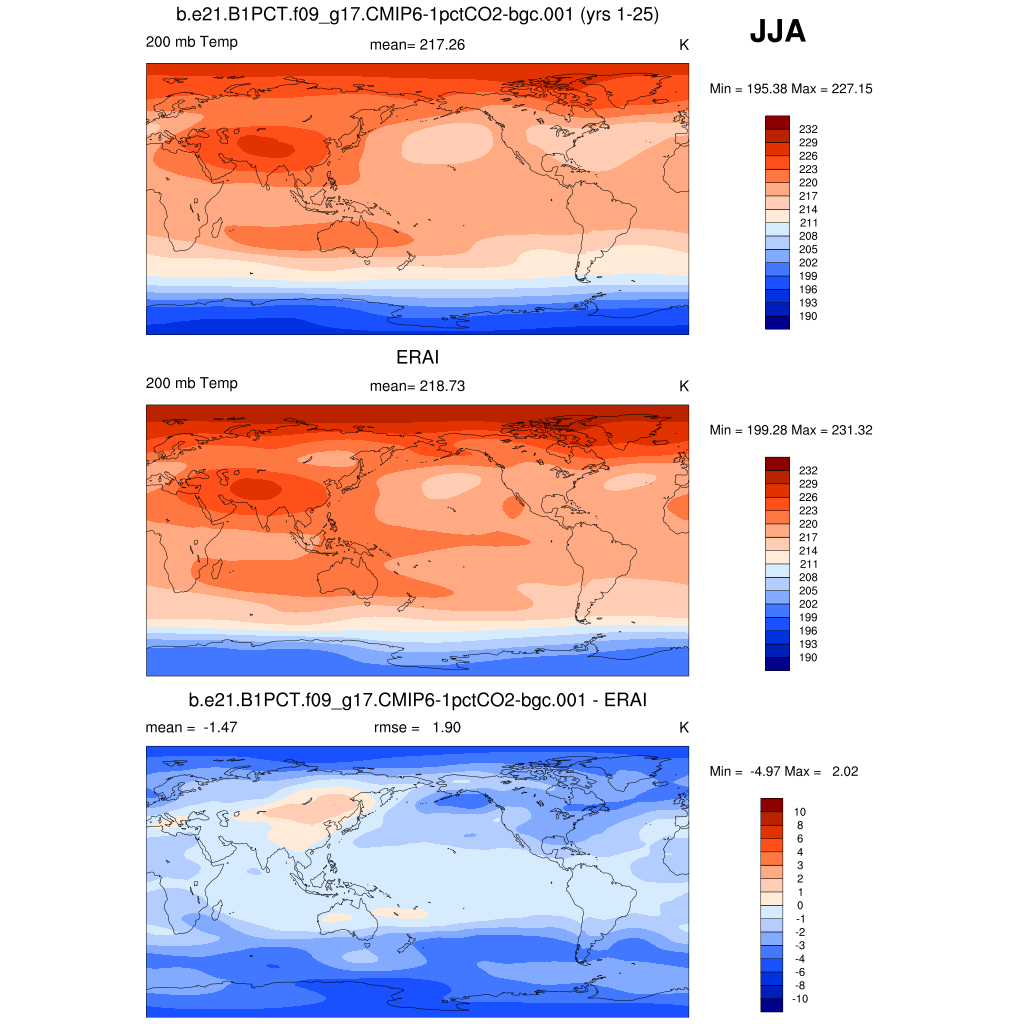
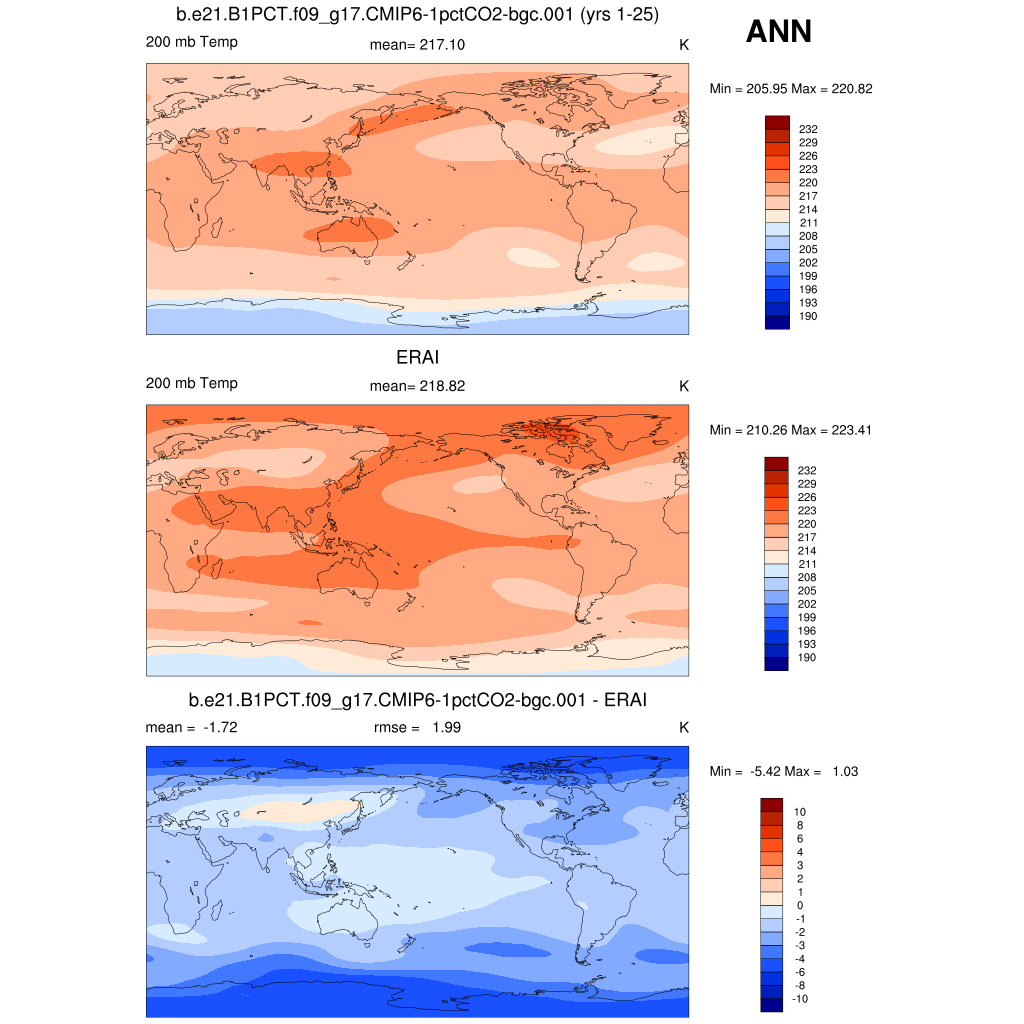
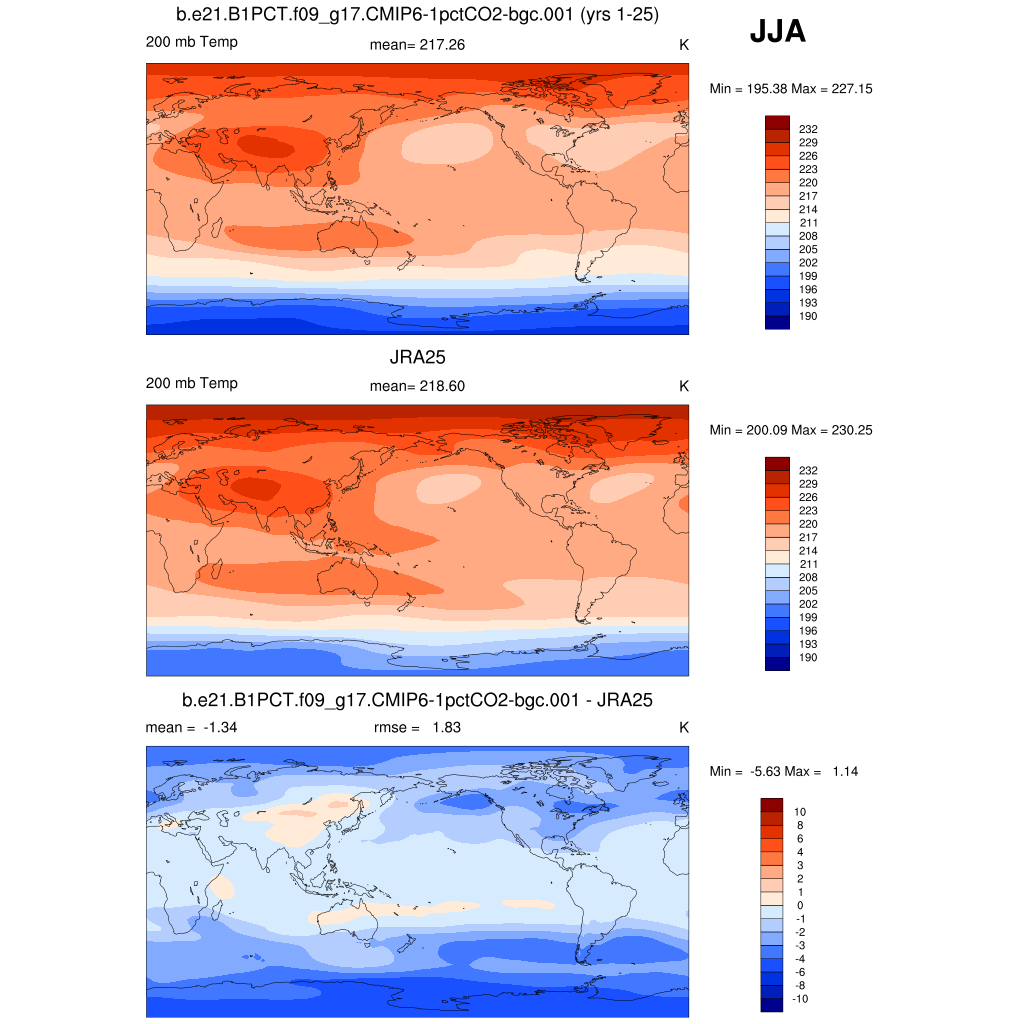
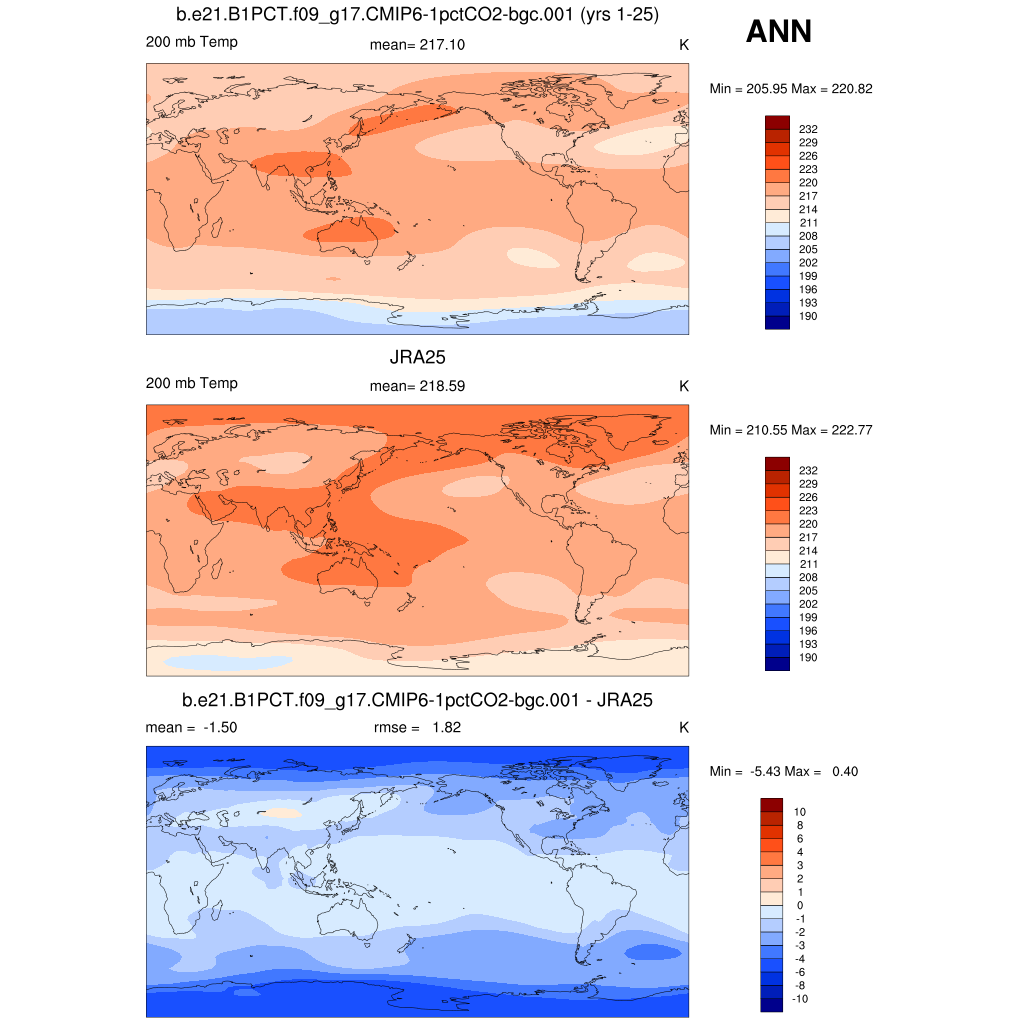
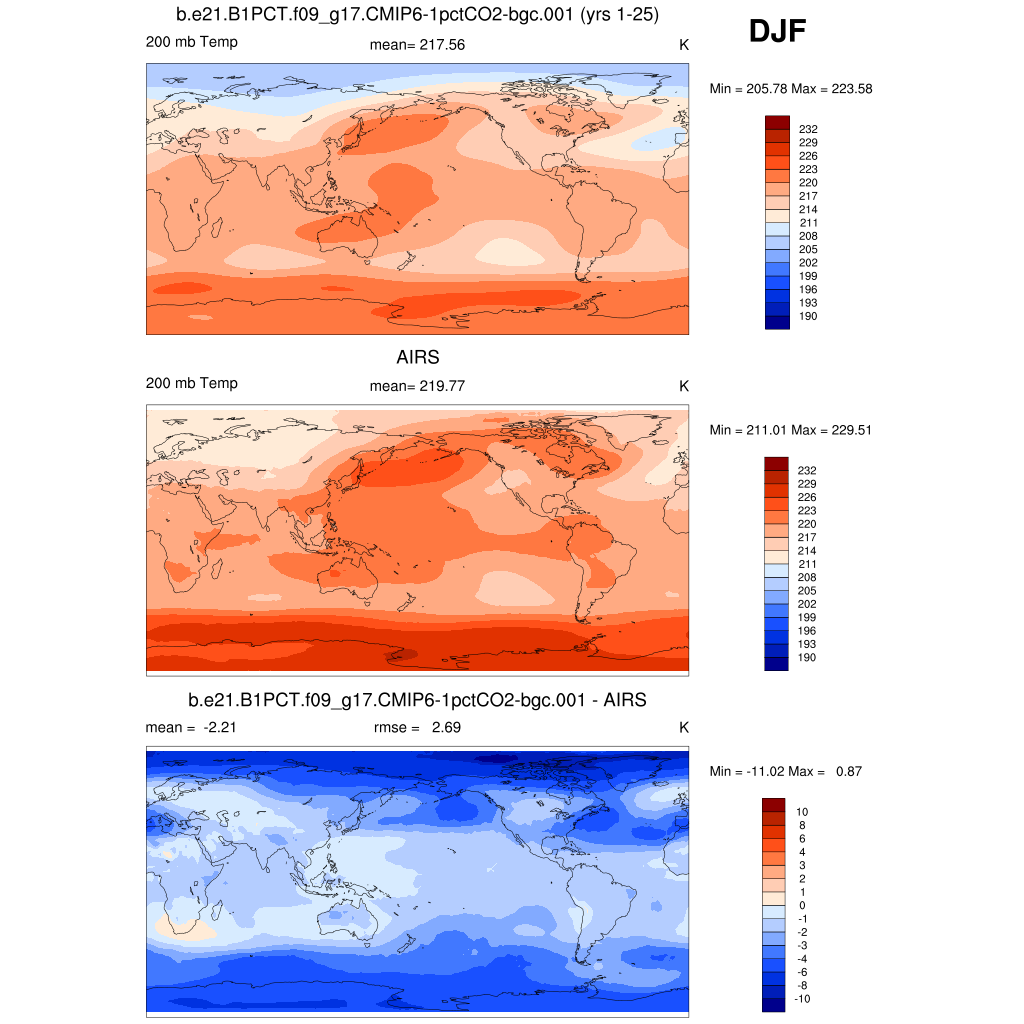
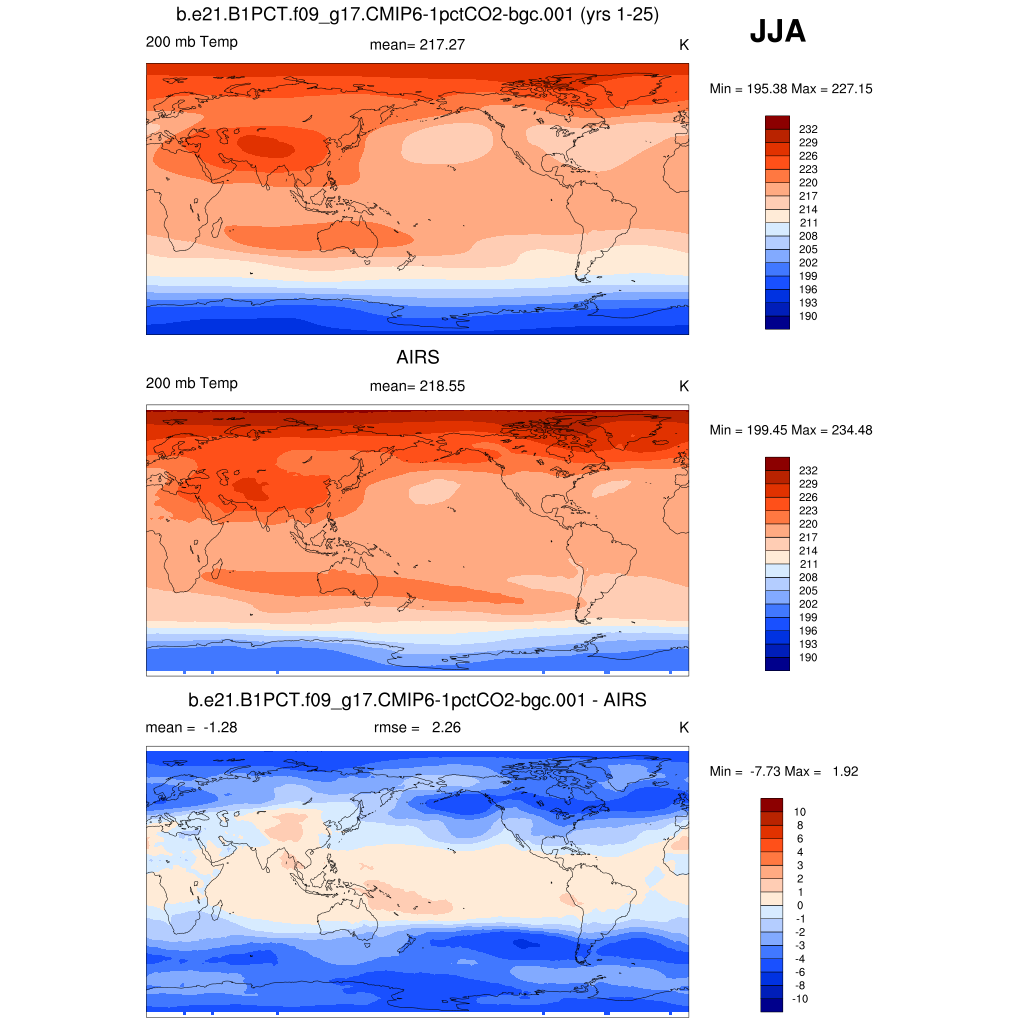
| T 200 | 200 mb temperature | plot | plot | plot |
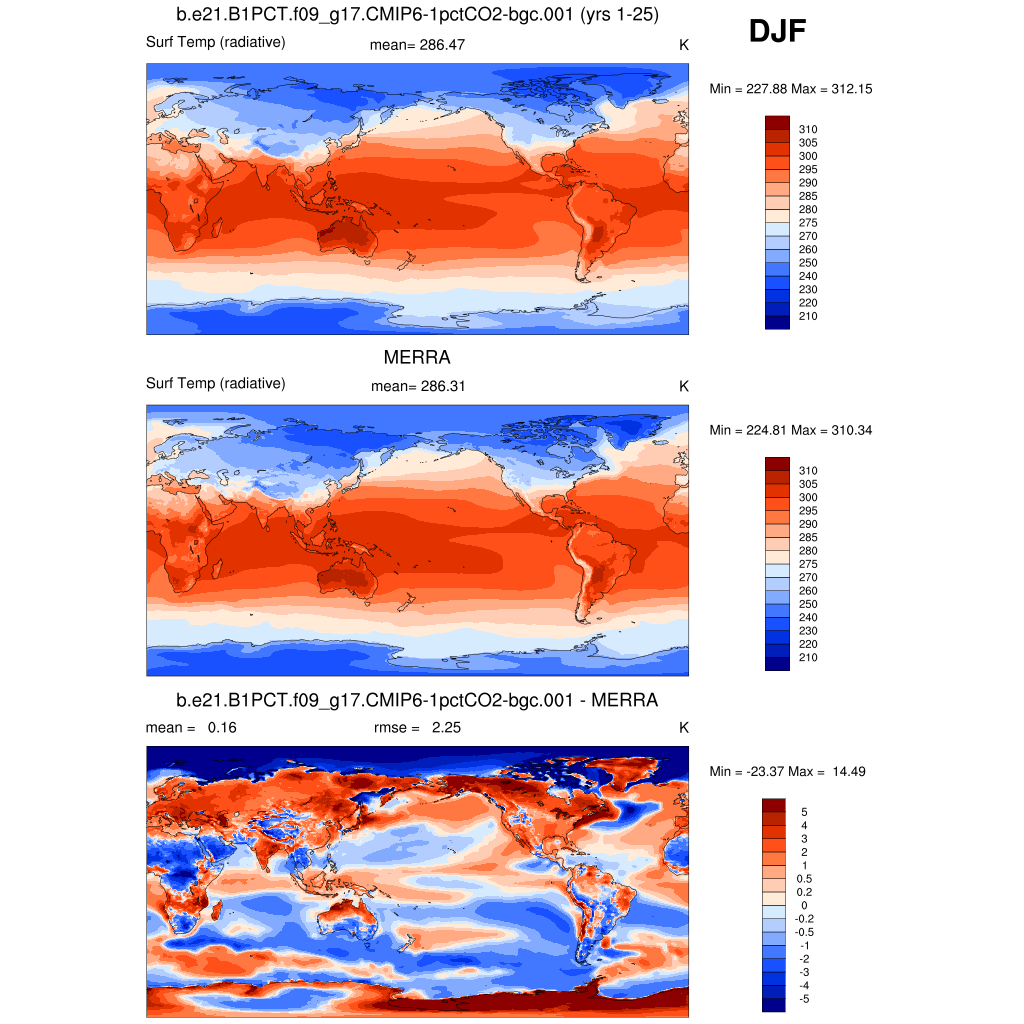
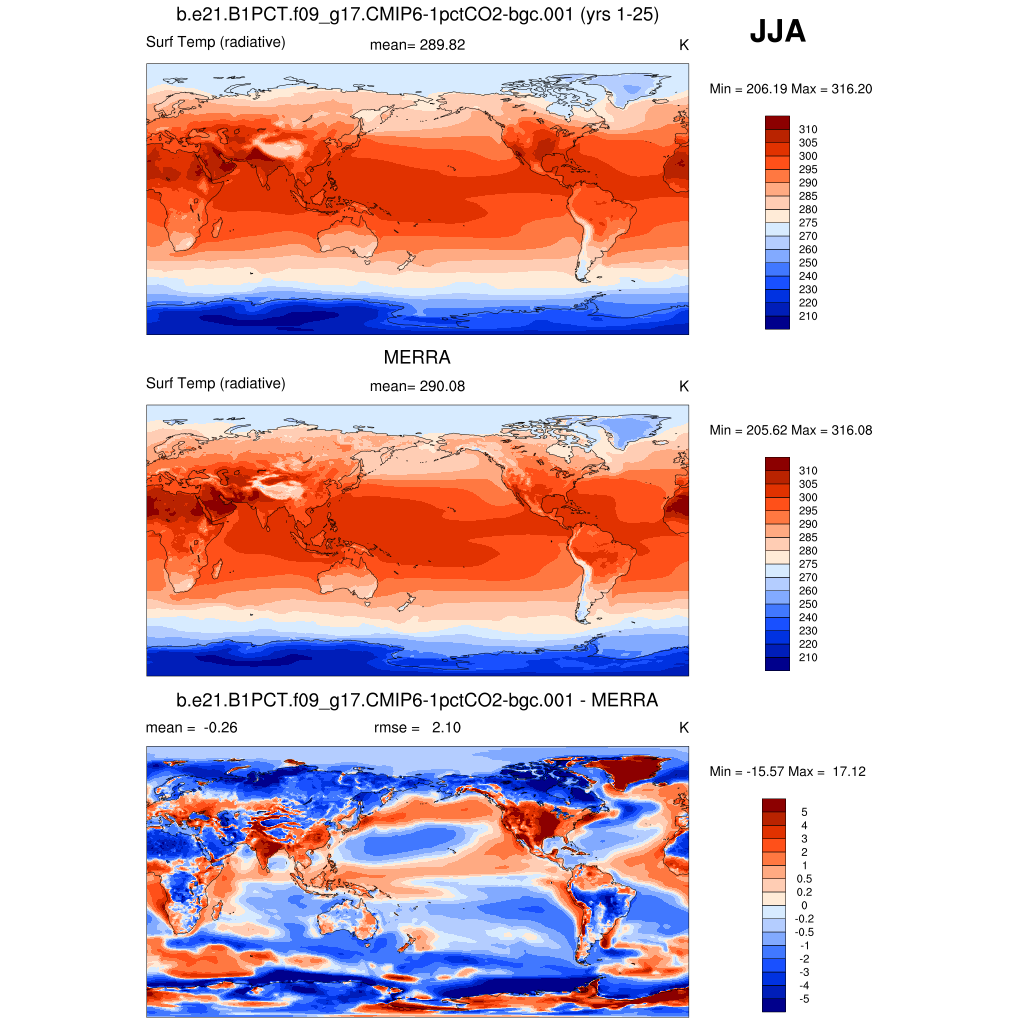
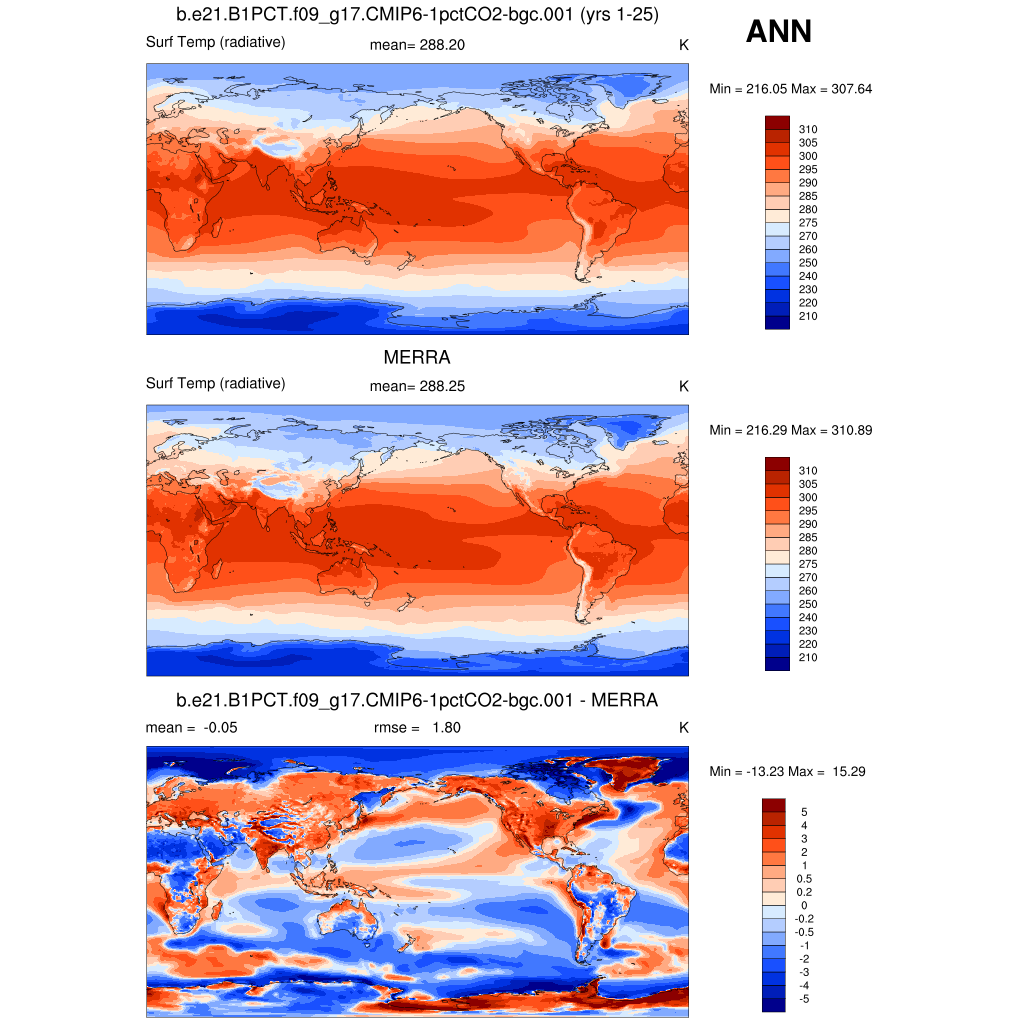
| TS * | Surface temperature | plot | plot | plot |
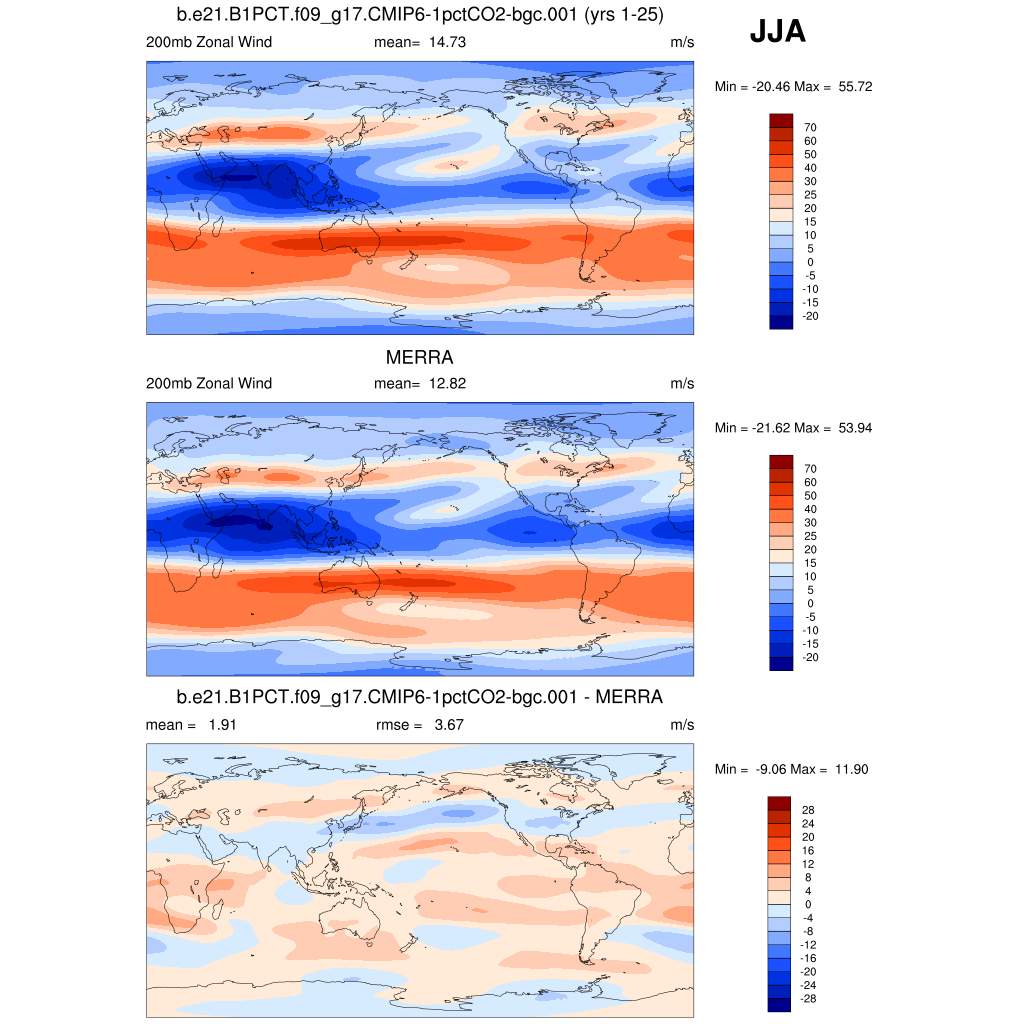
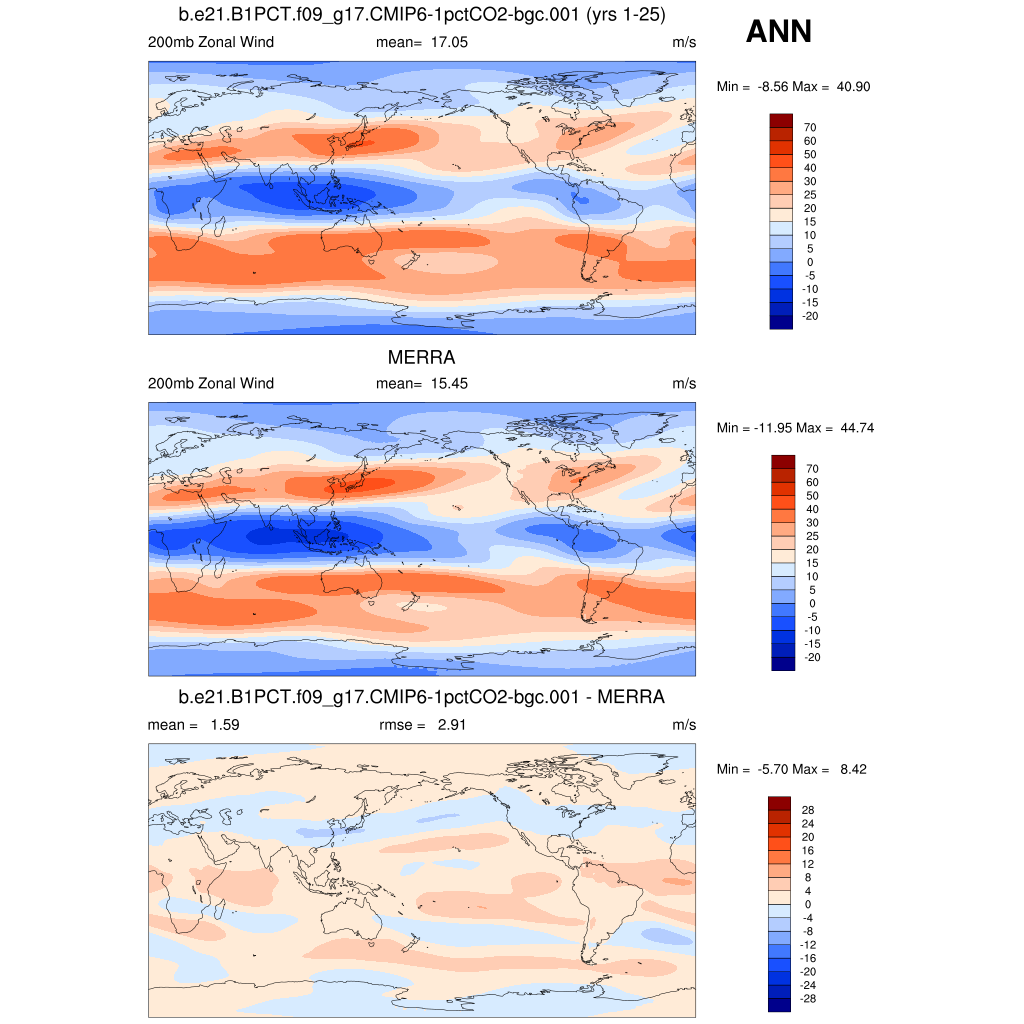
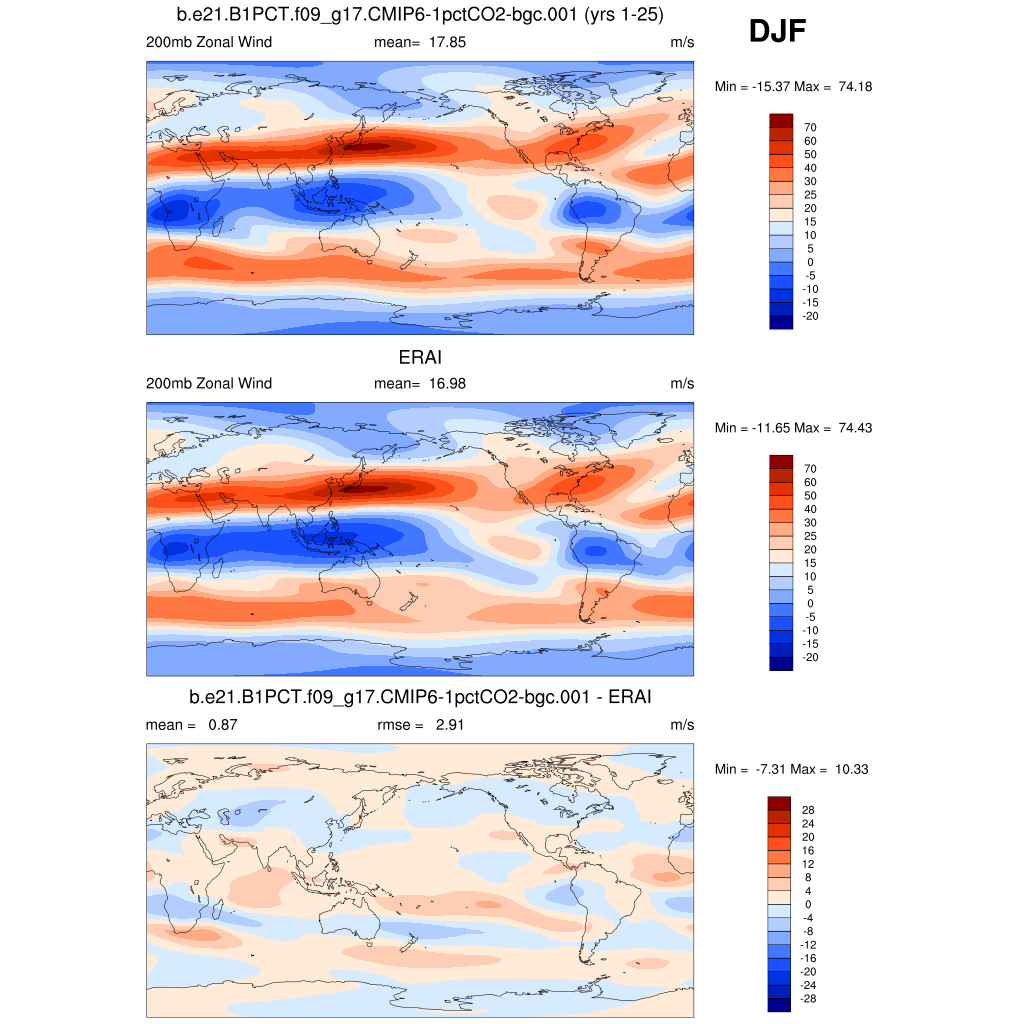
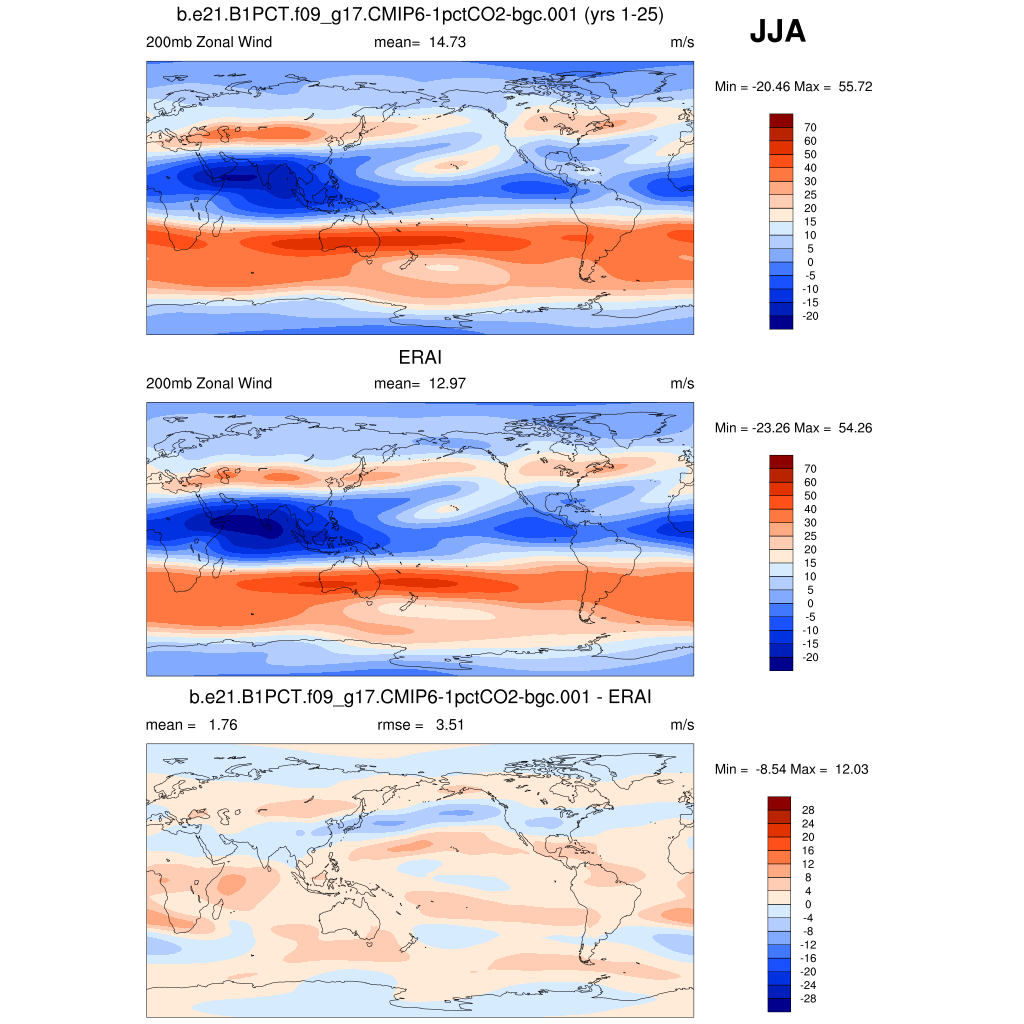
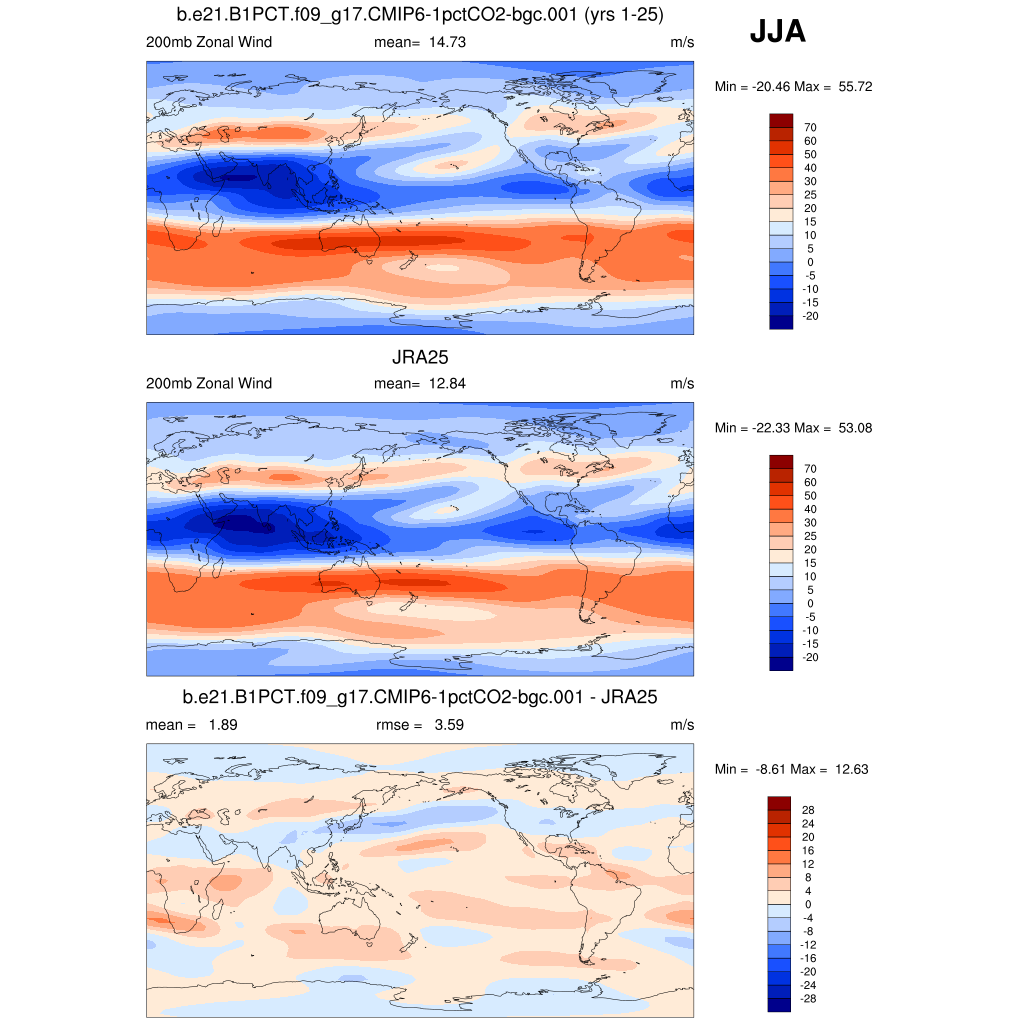
| U 200 * | 200 mb zonal wind | plot | plot | plot |
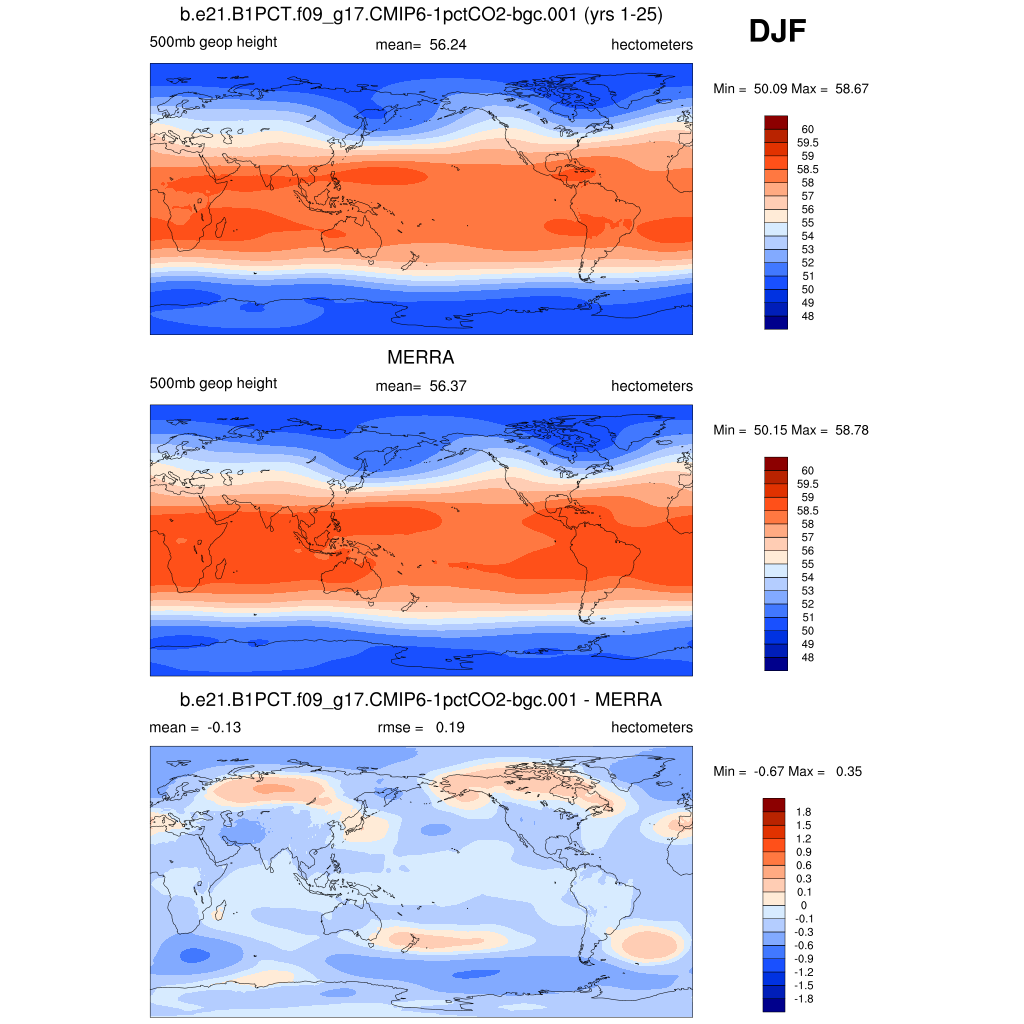
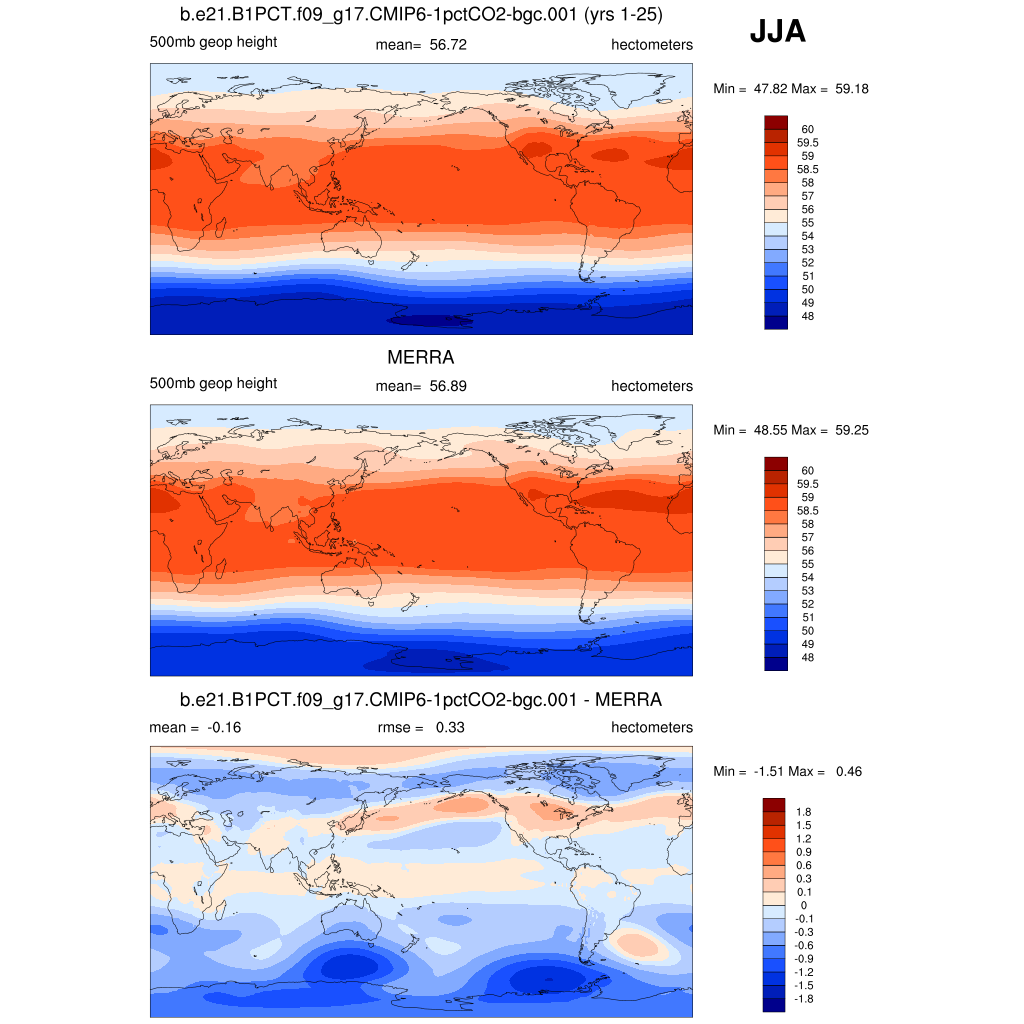
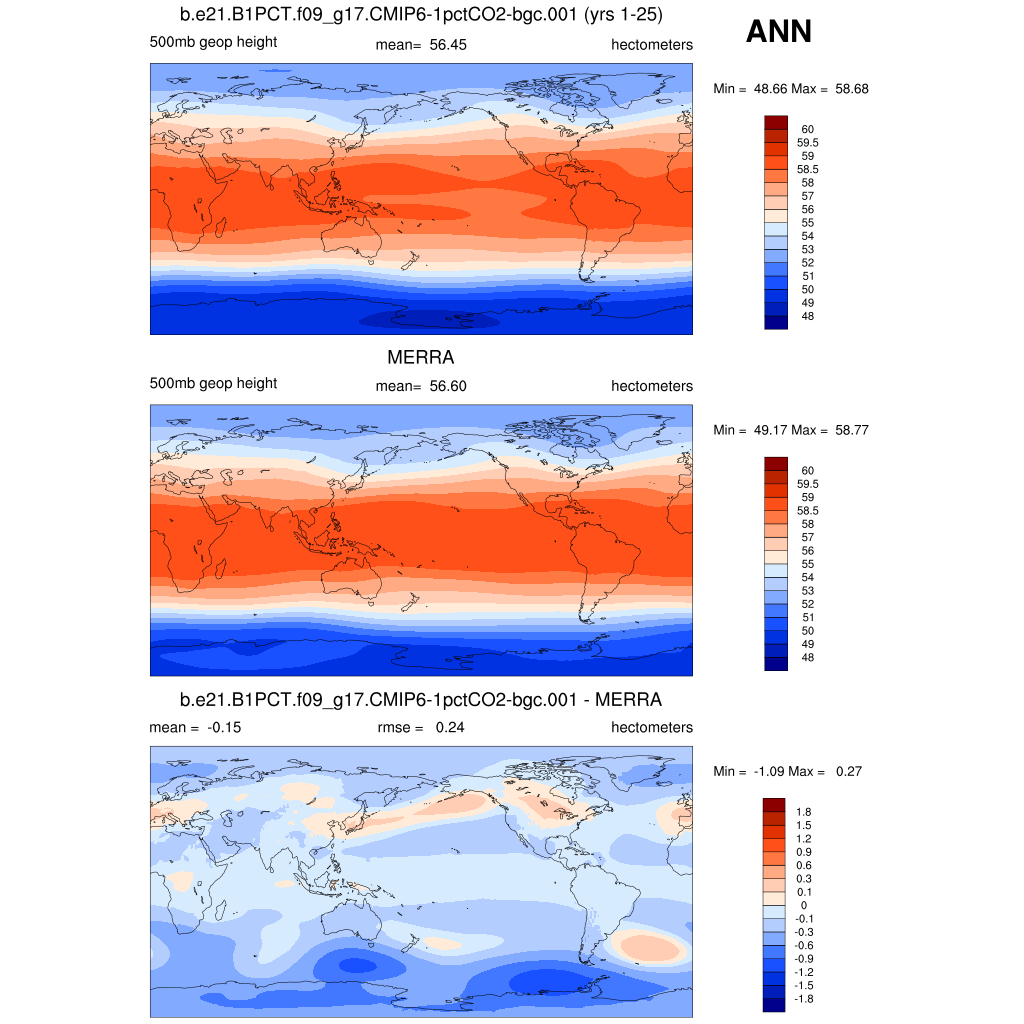
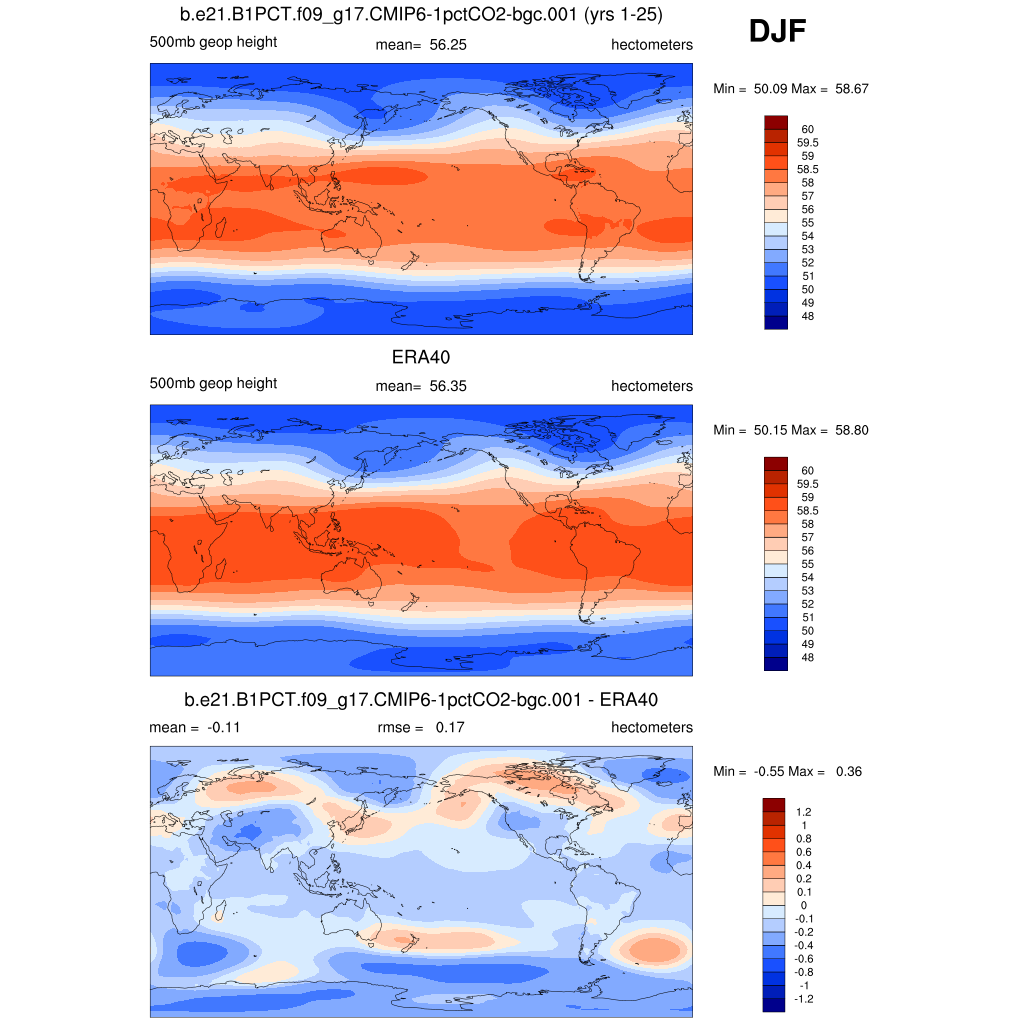
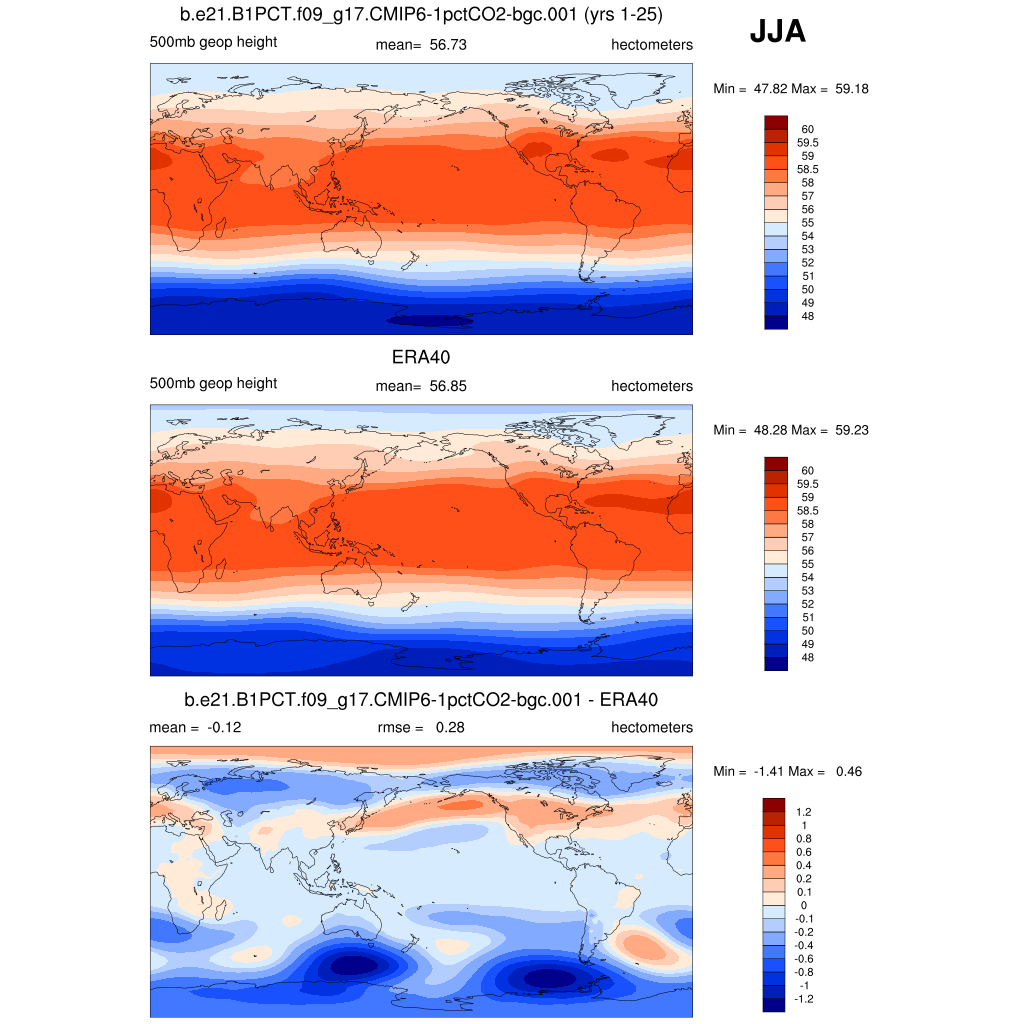
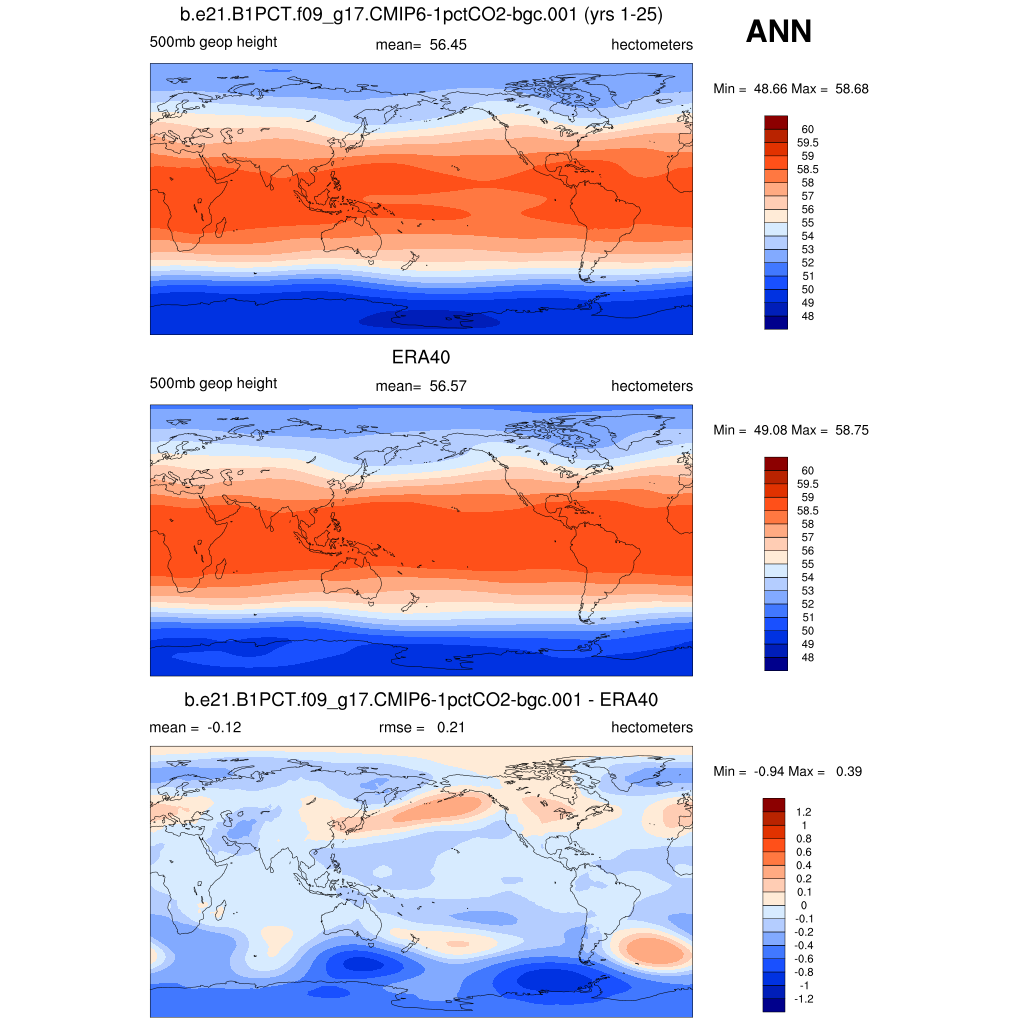
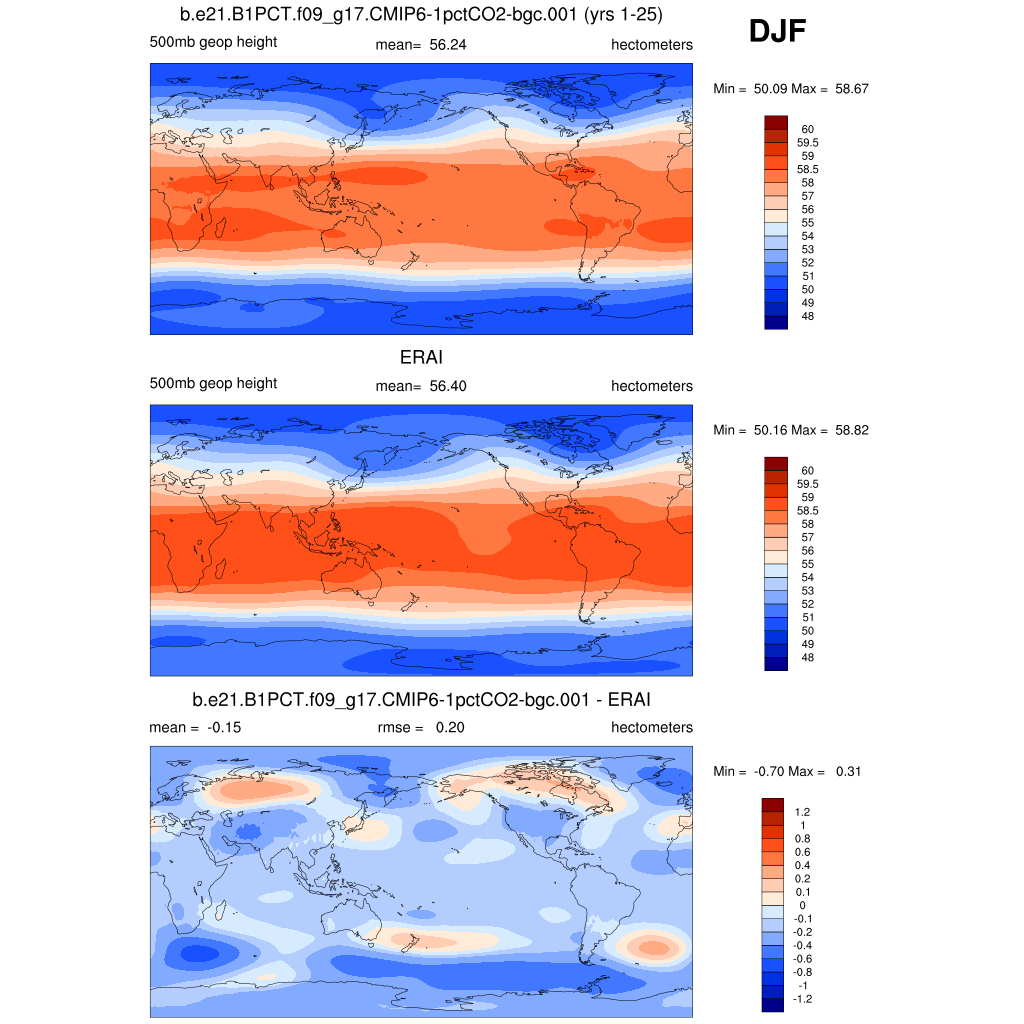
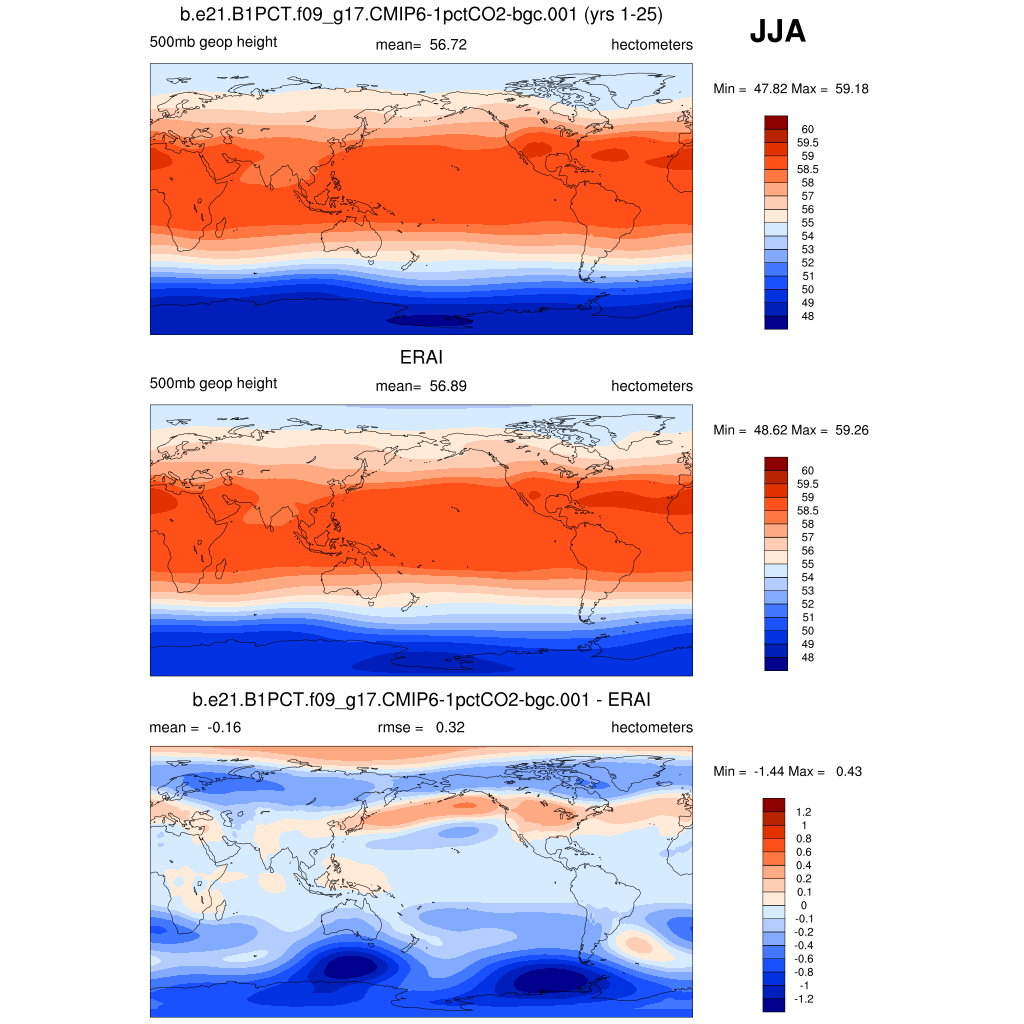
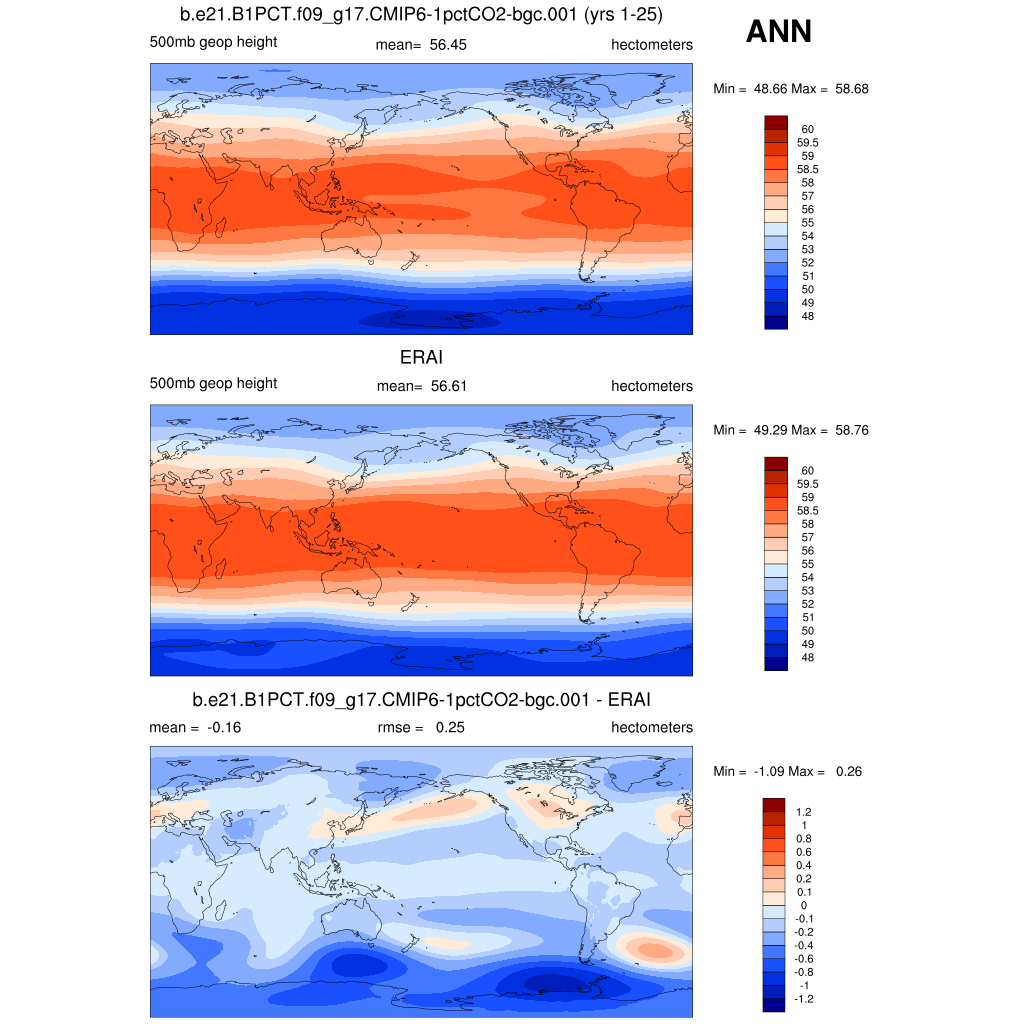
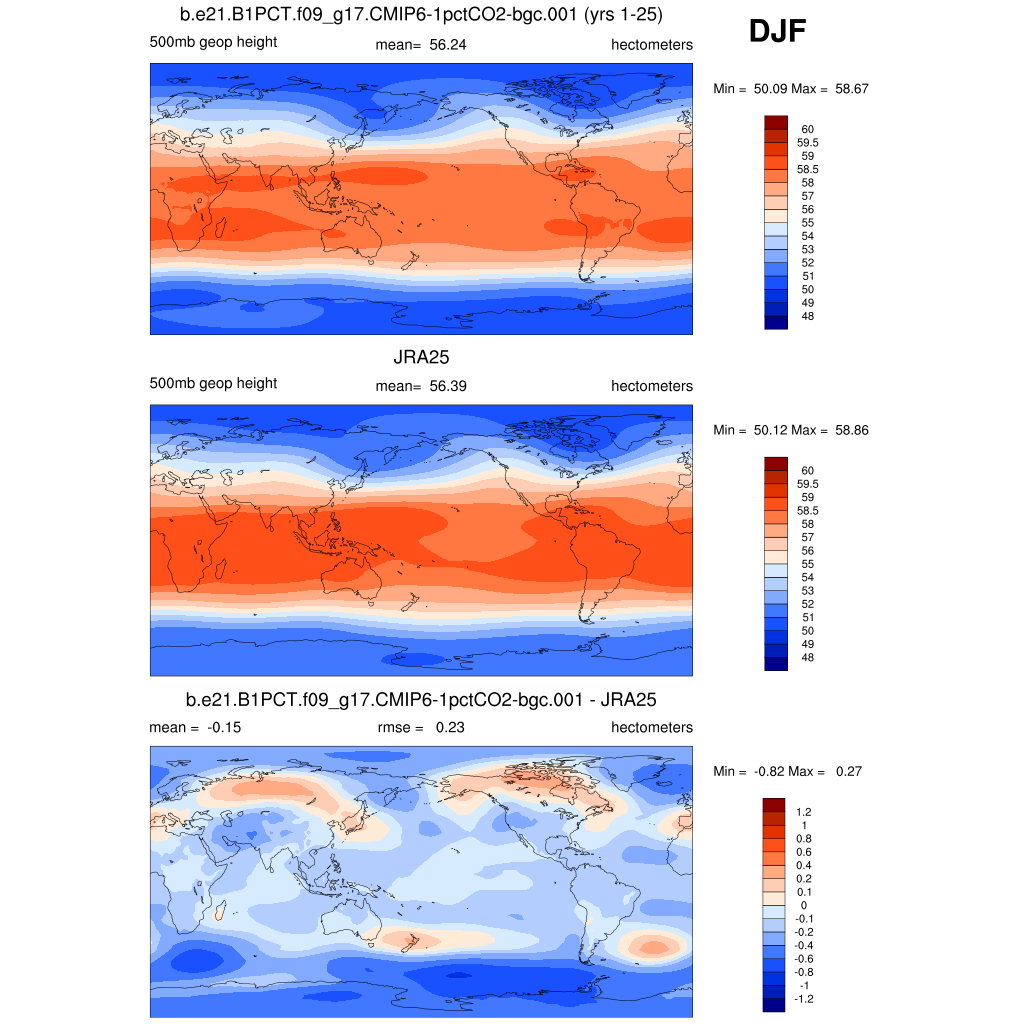
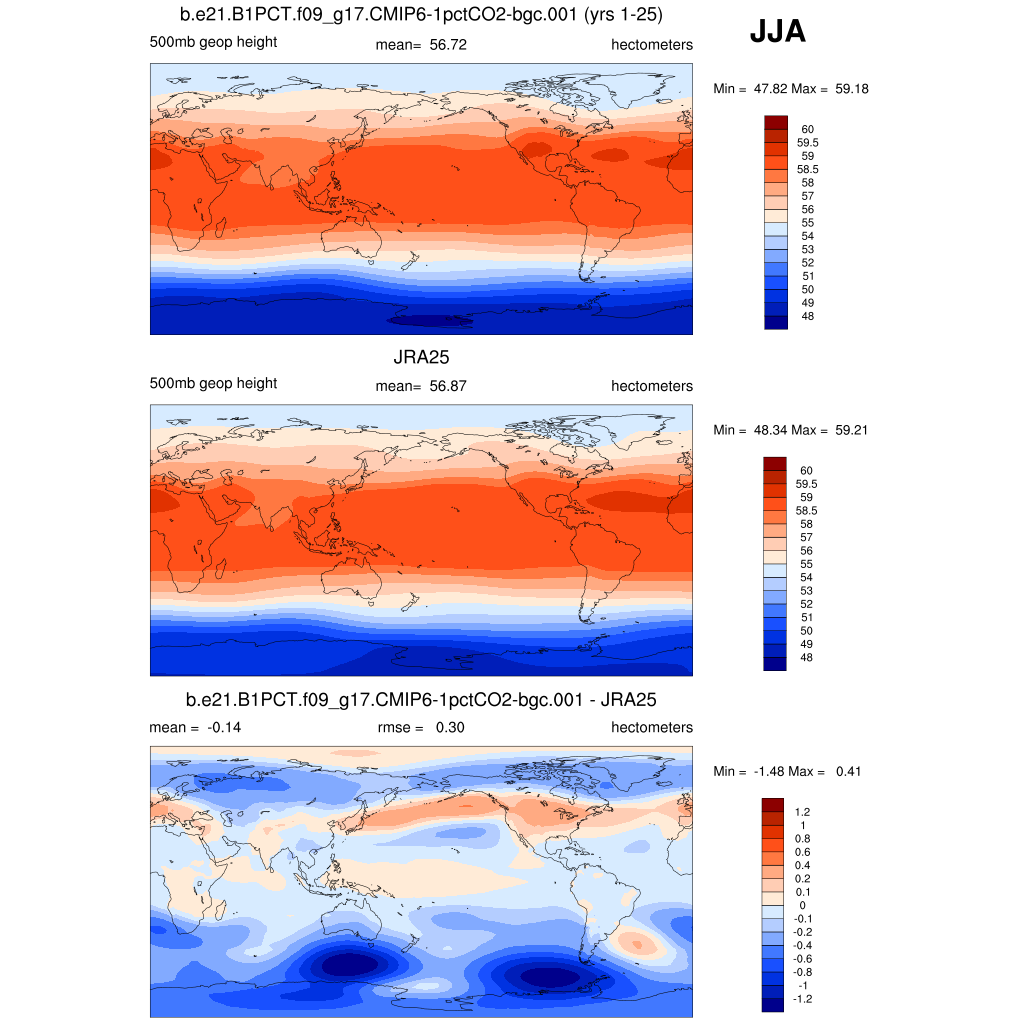
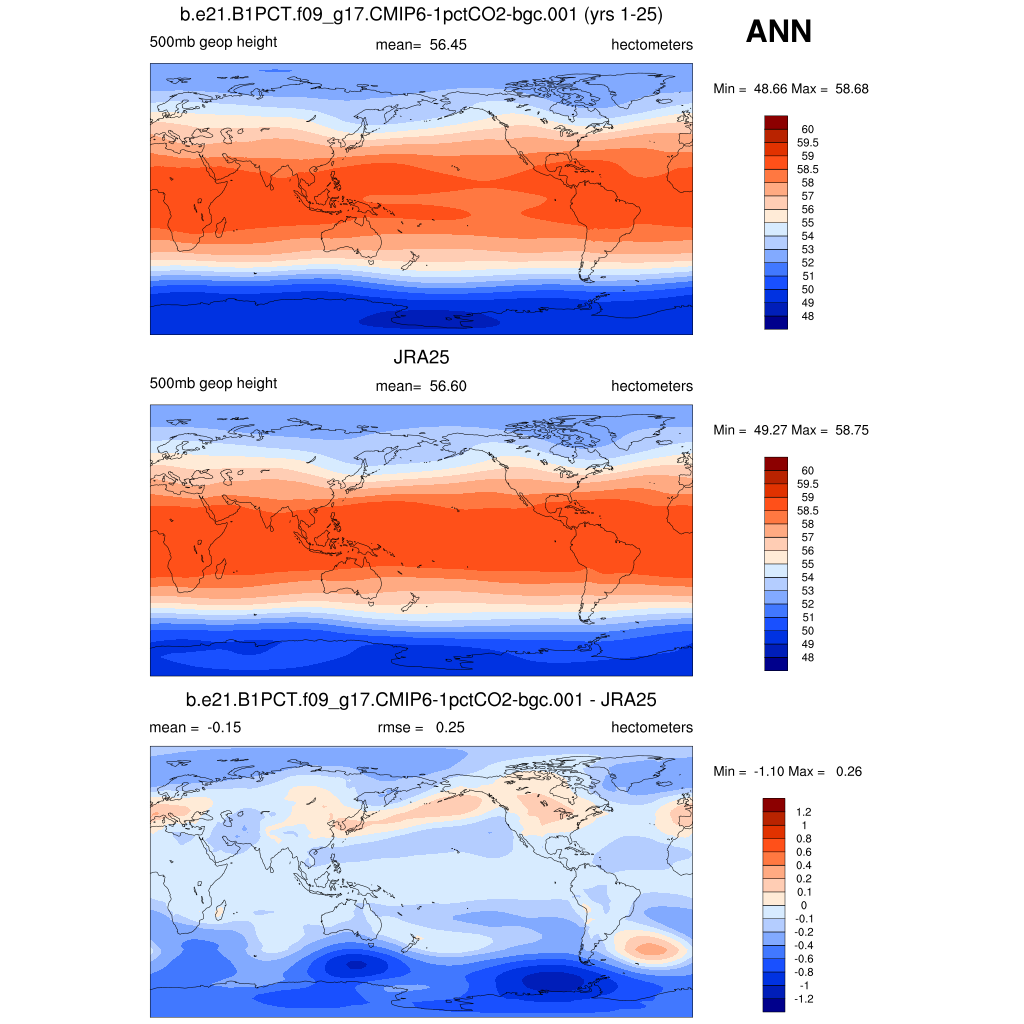
| Z 500 | 500 mb geopotential height | plot | plot | plot |
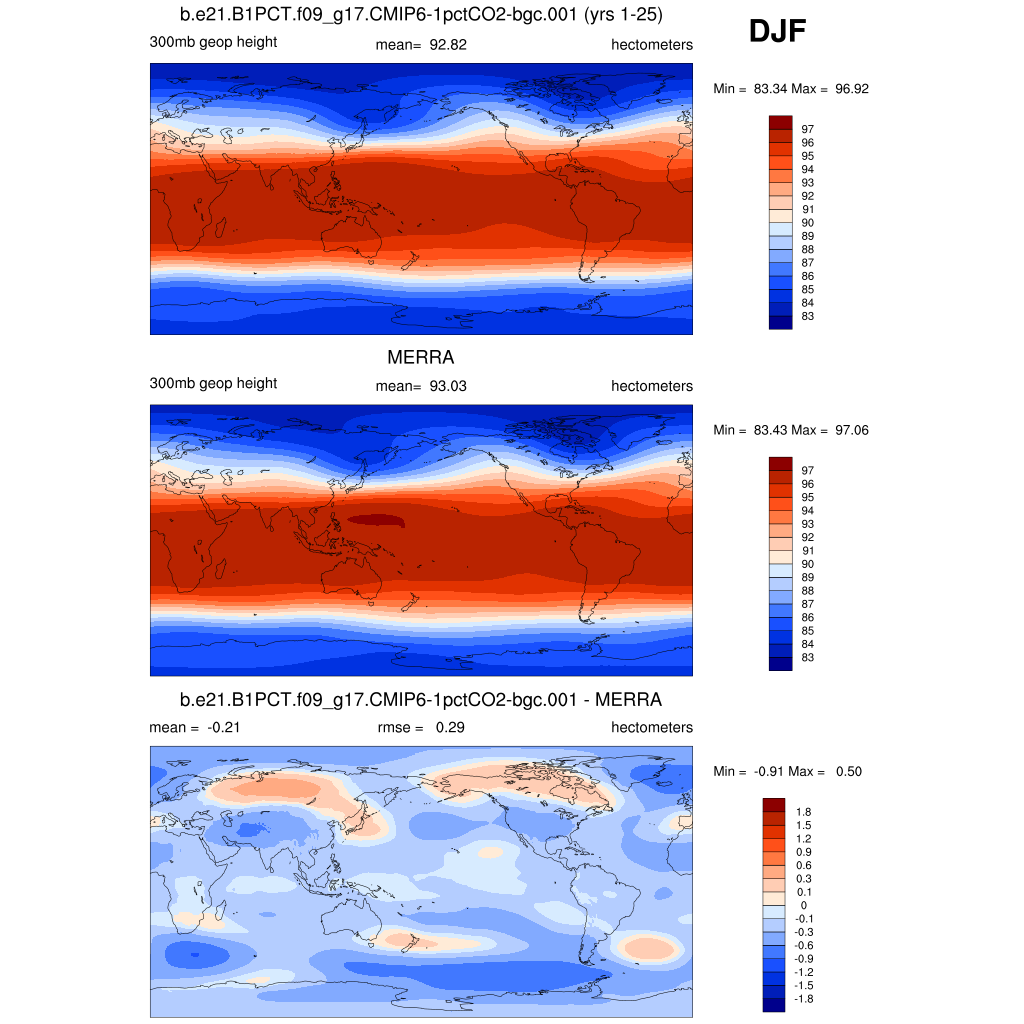
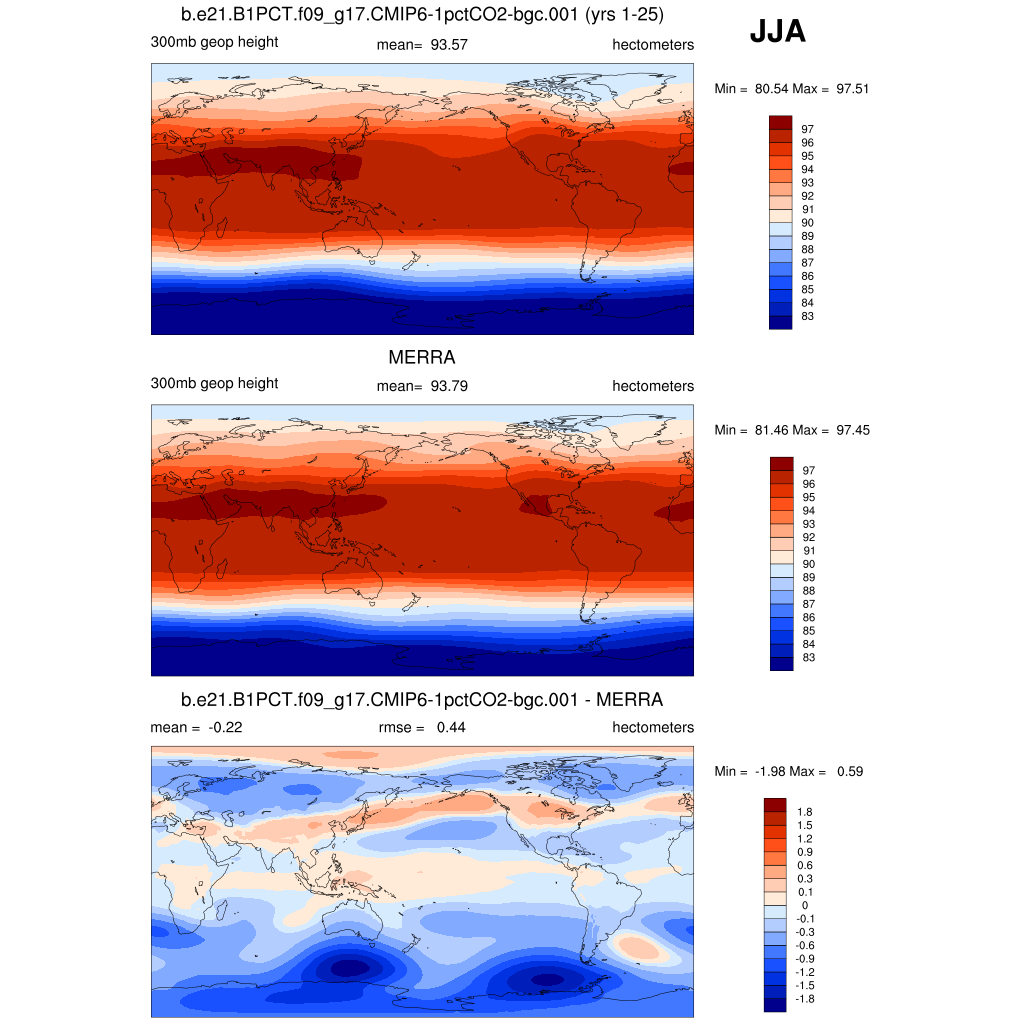
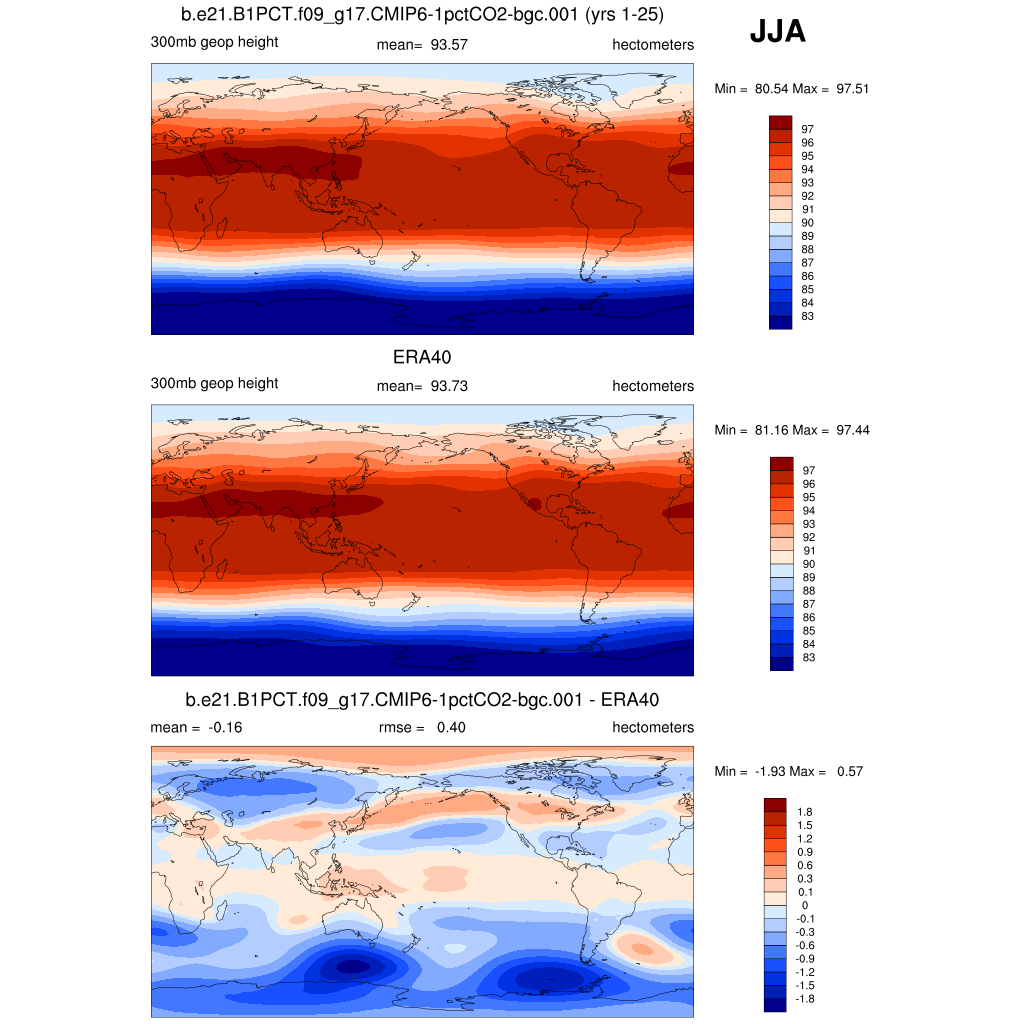
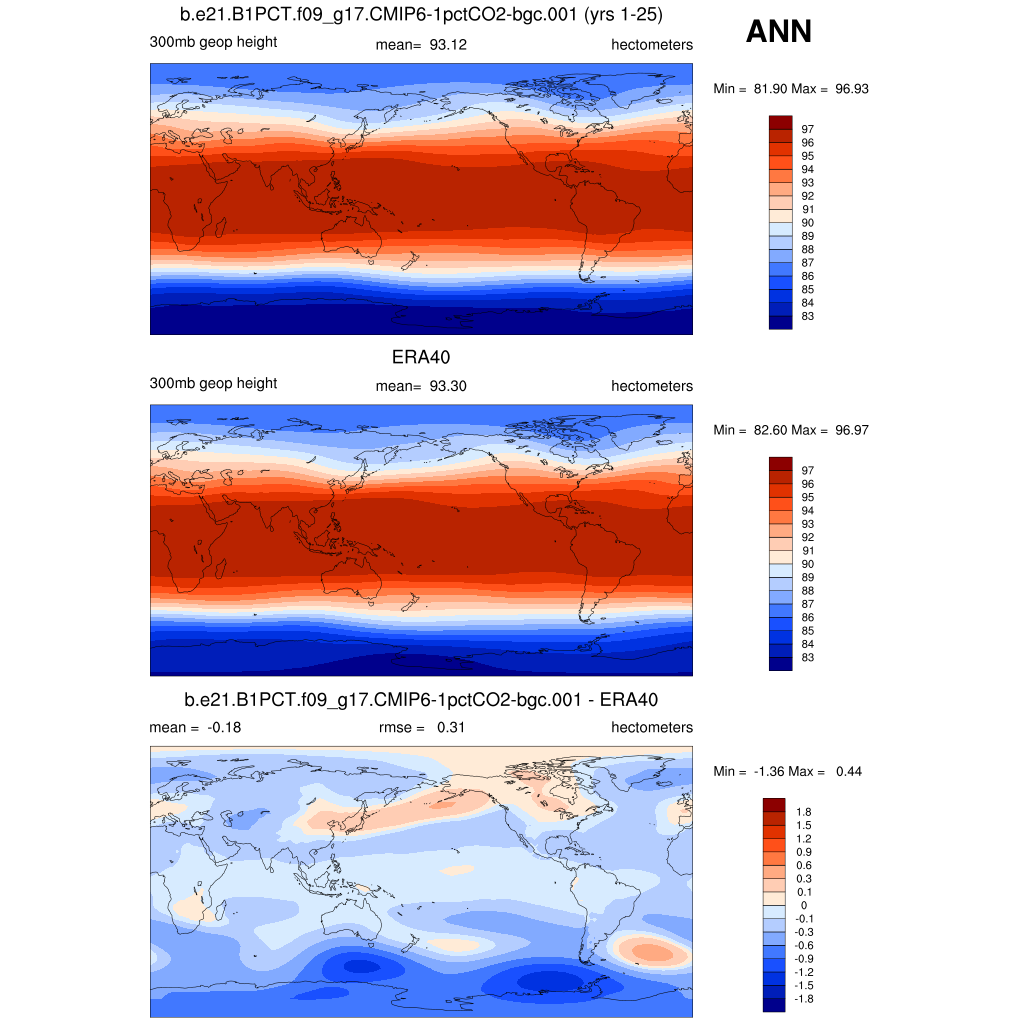
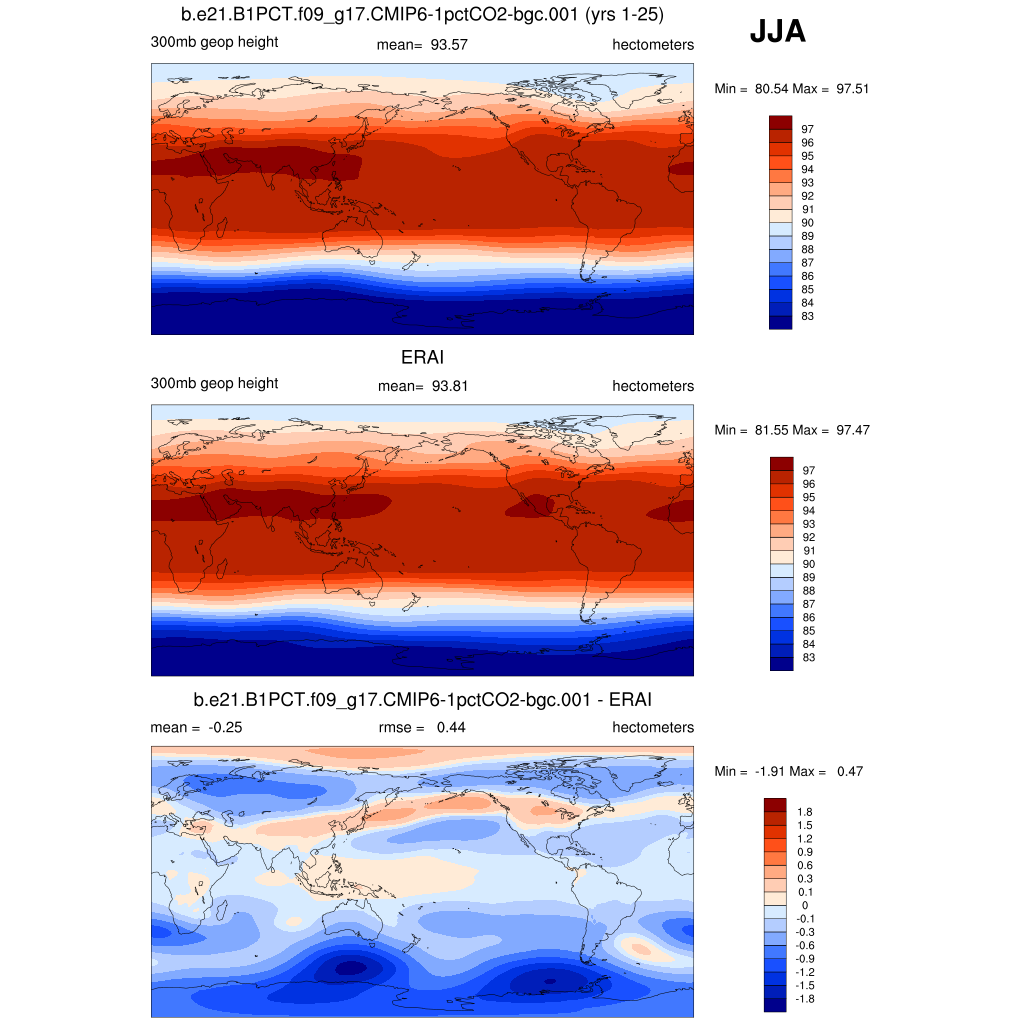
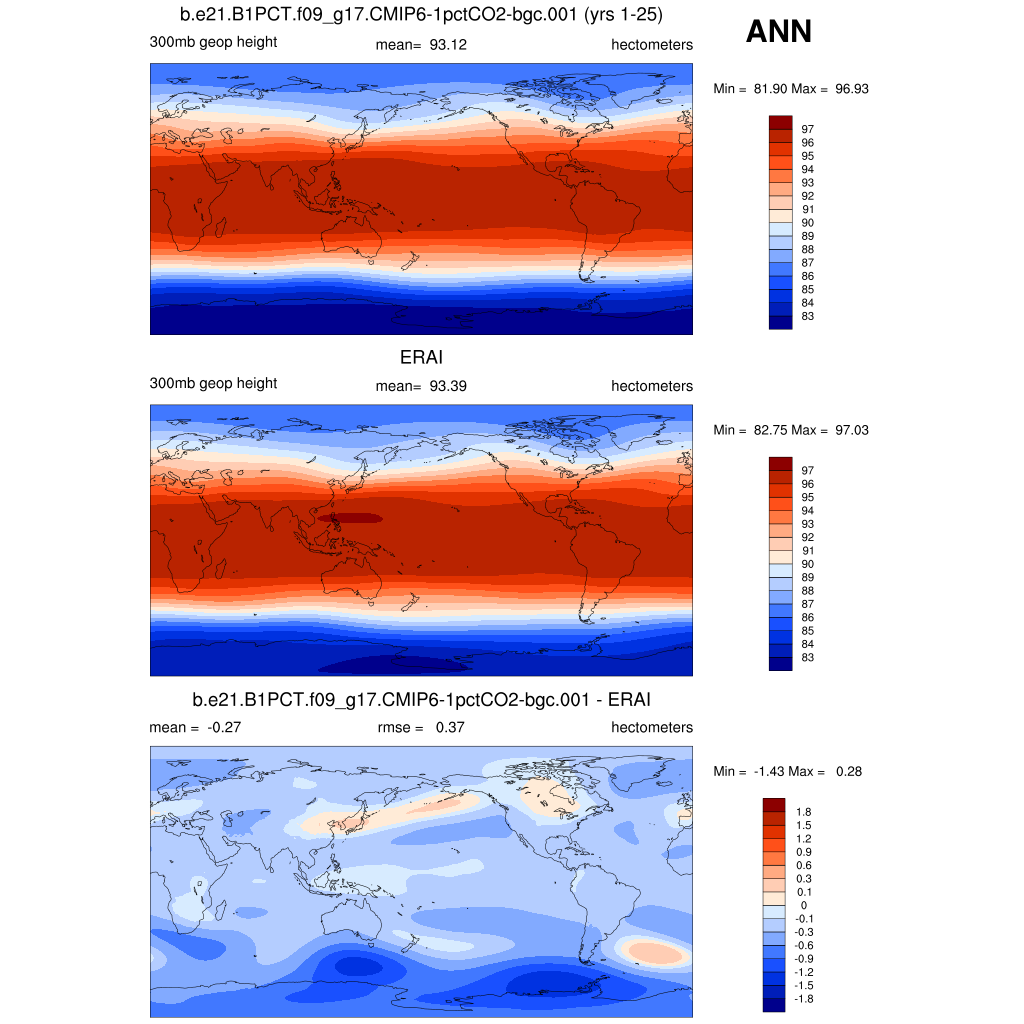
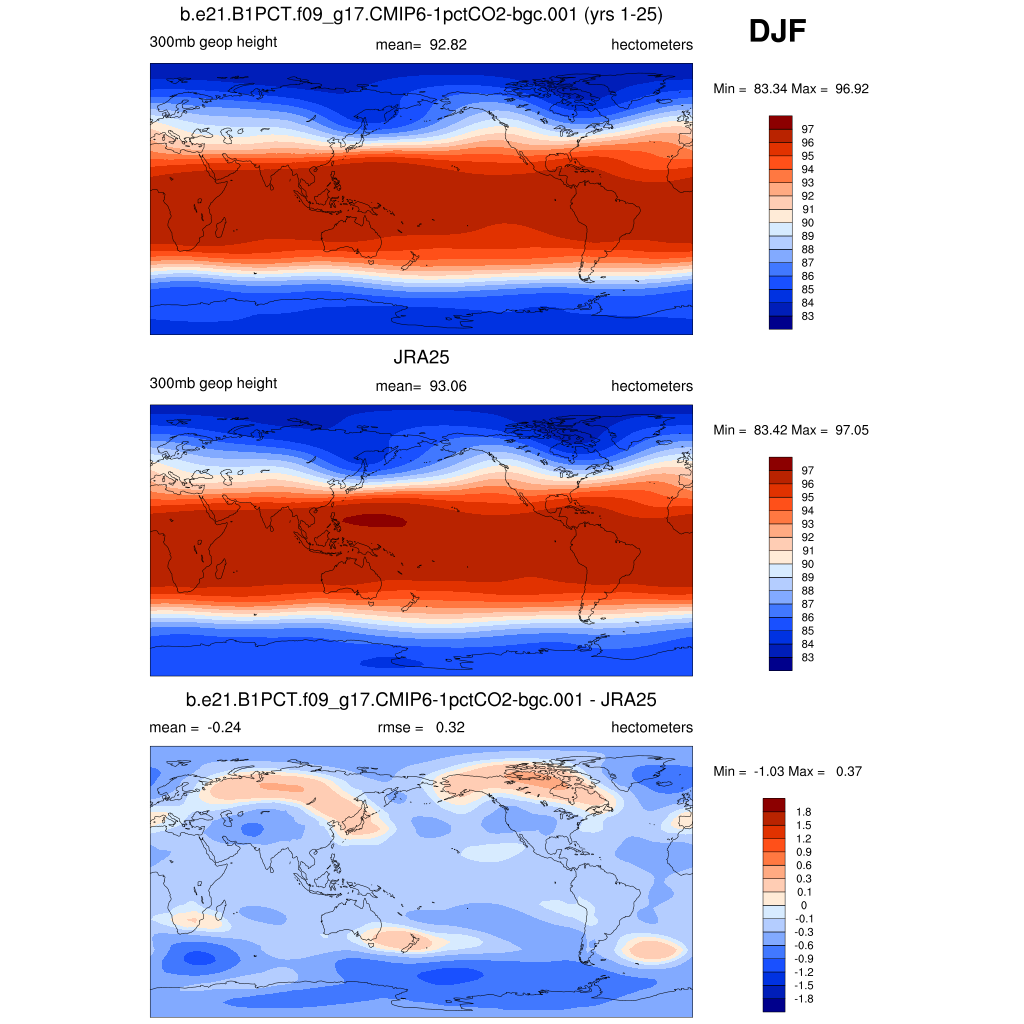
| Z 300 * | 300 mb geopotential height | plot | plot | plot |
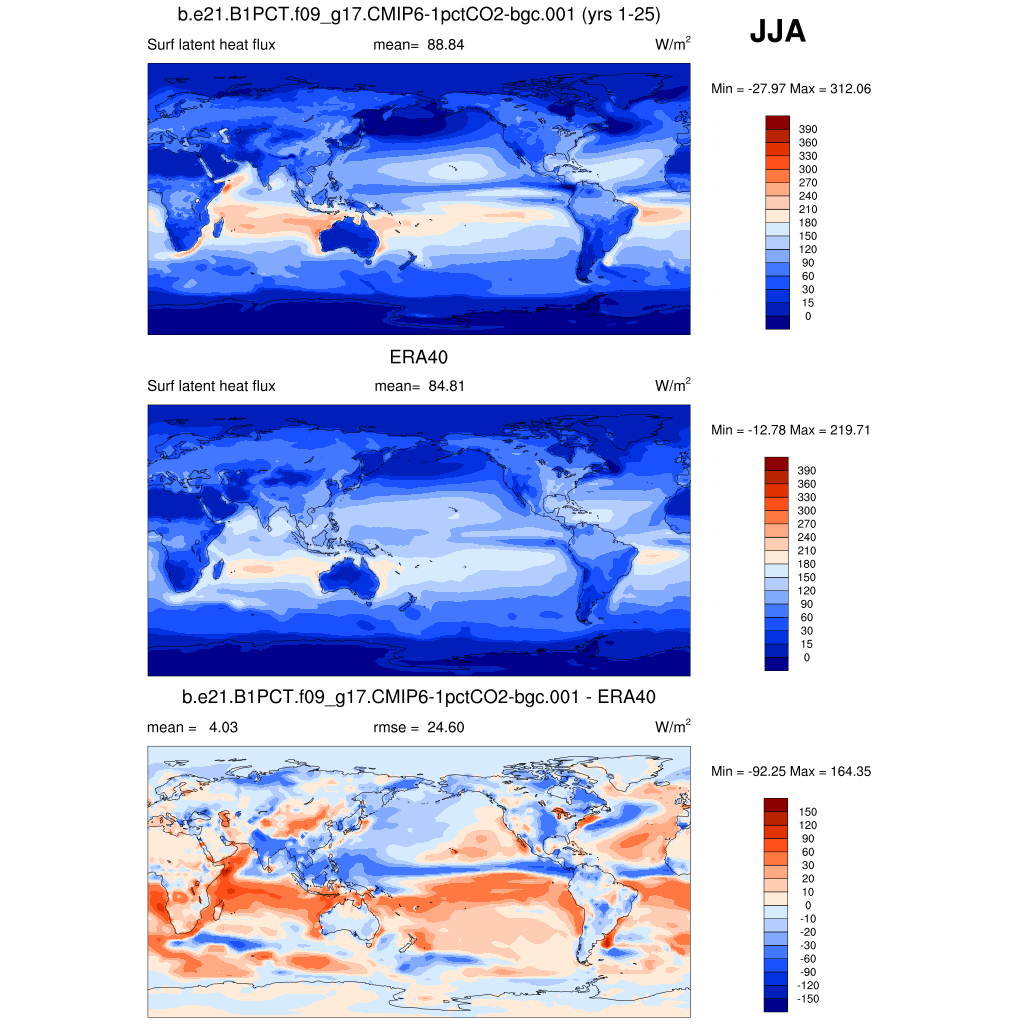
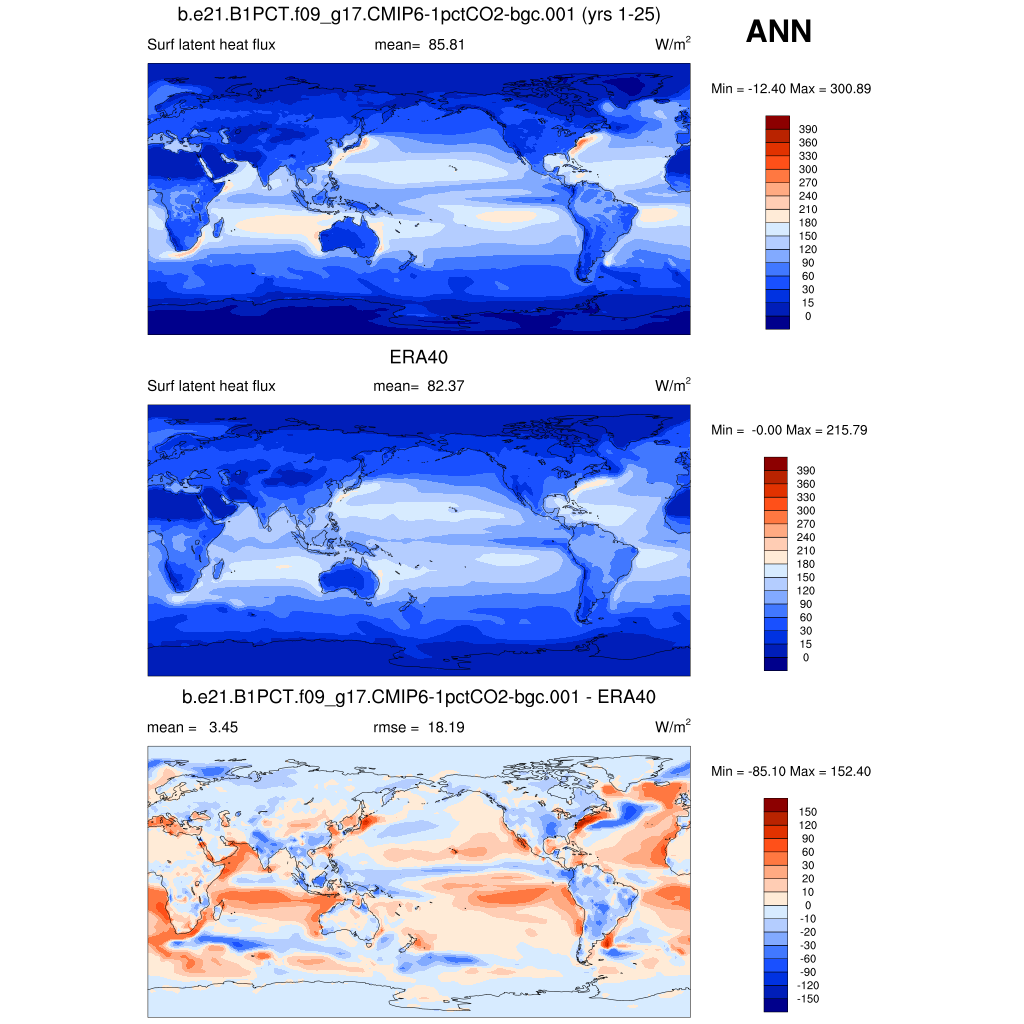
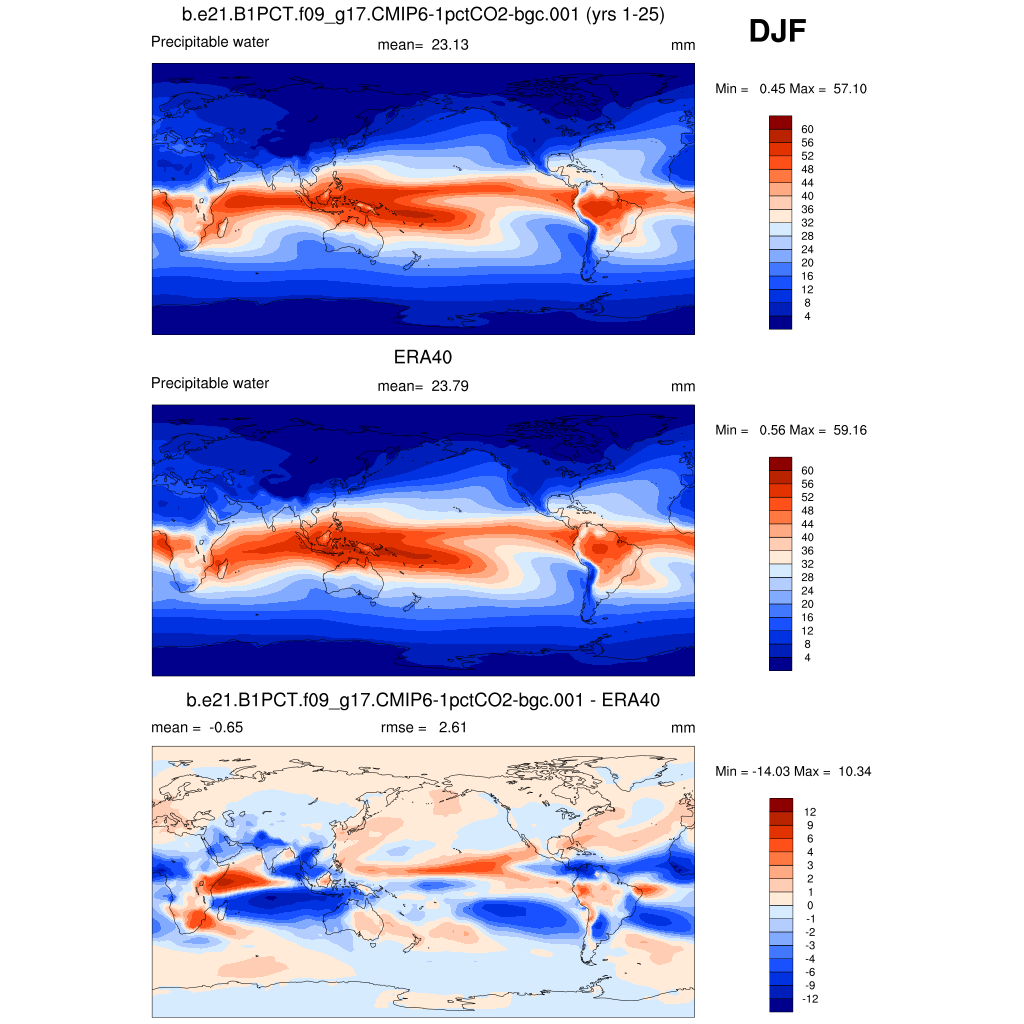
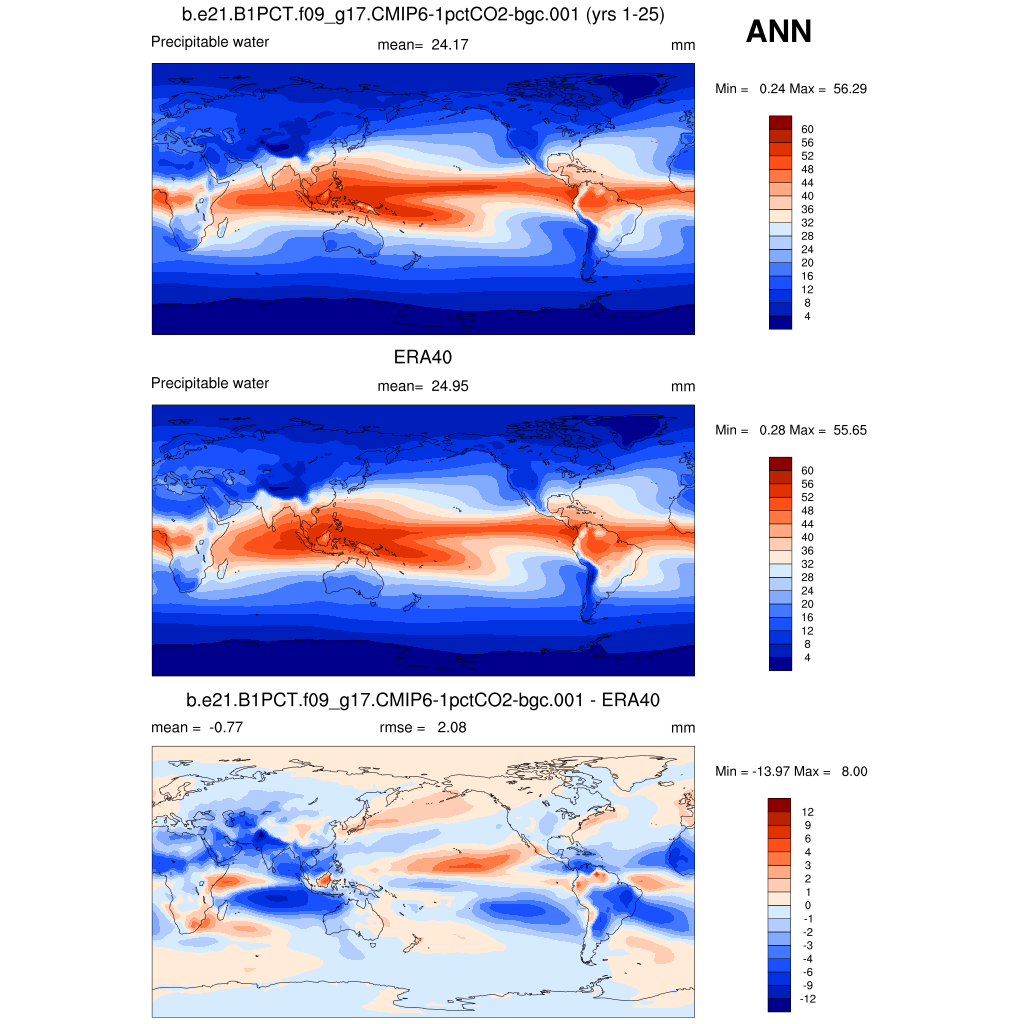
| ERA40 Reanalysis 1980-2001 | DJF | JJA | ANN | |
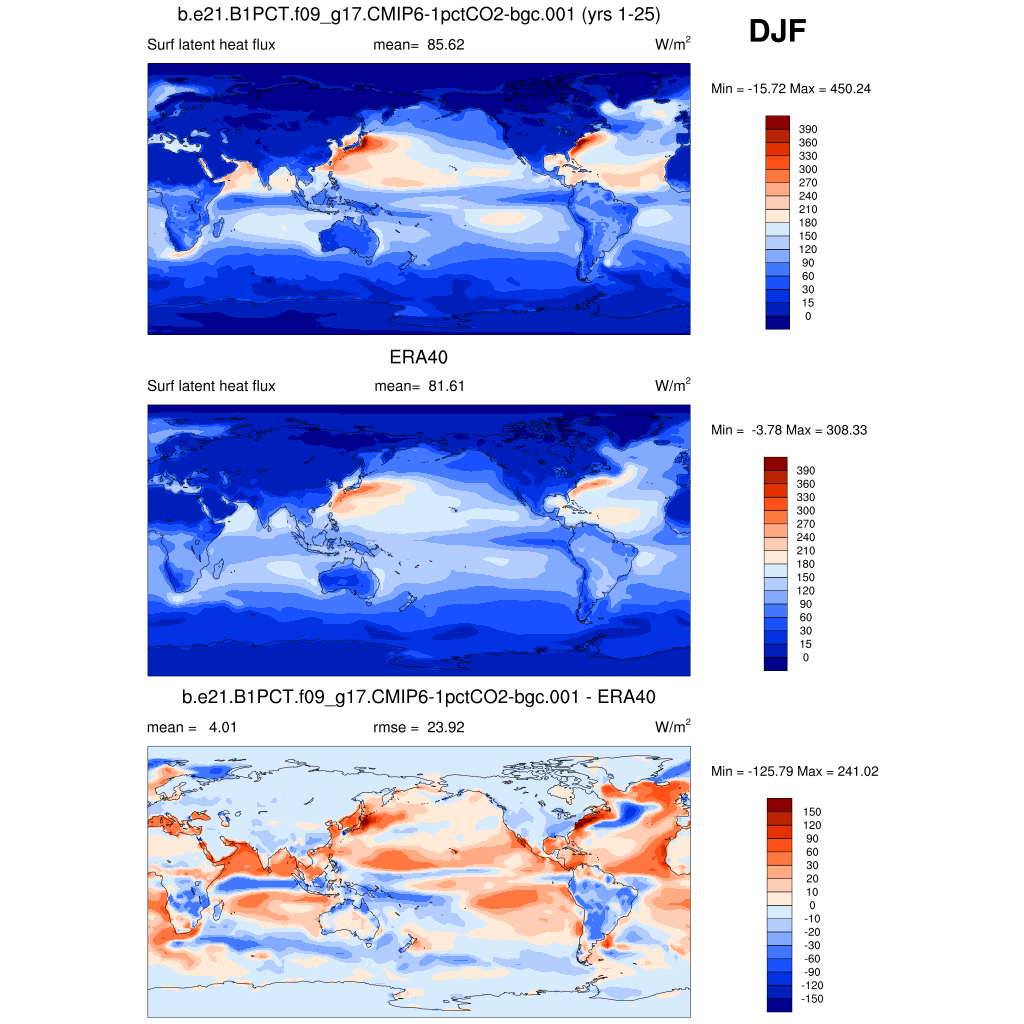
| LHFLX * | Surface latent heat flux | plot | plot | plot |
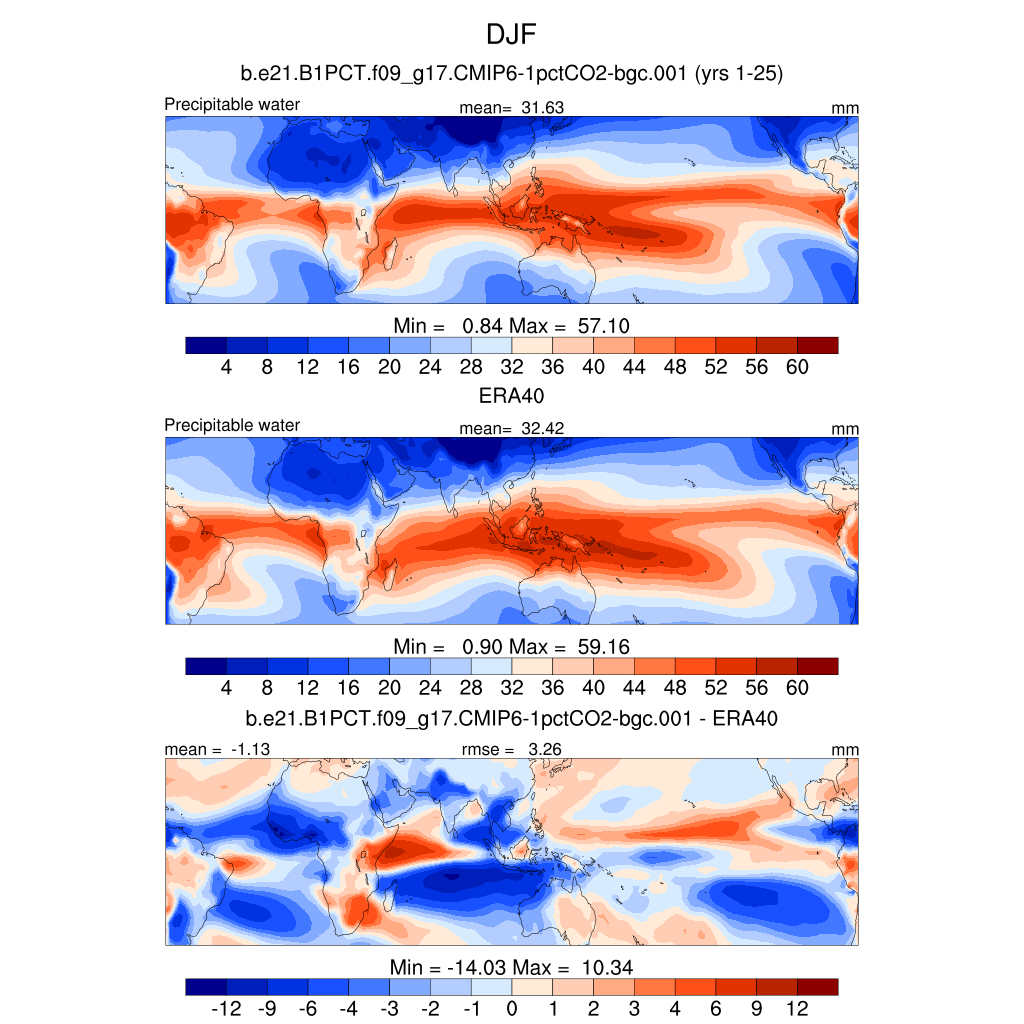
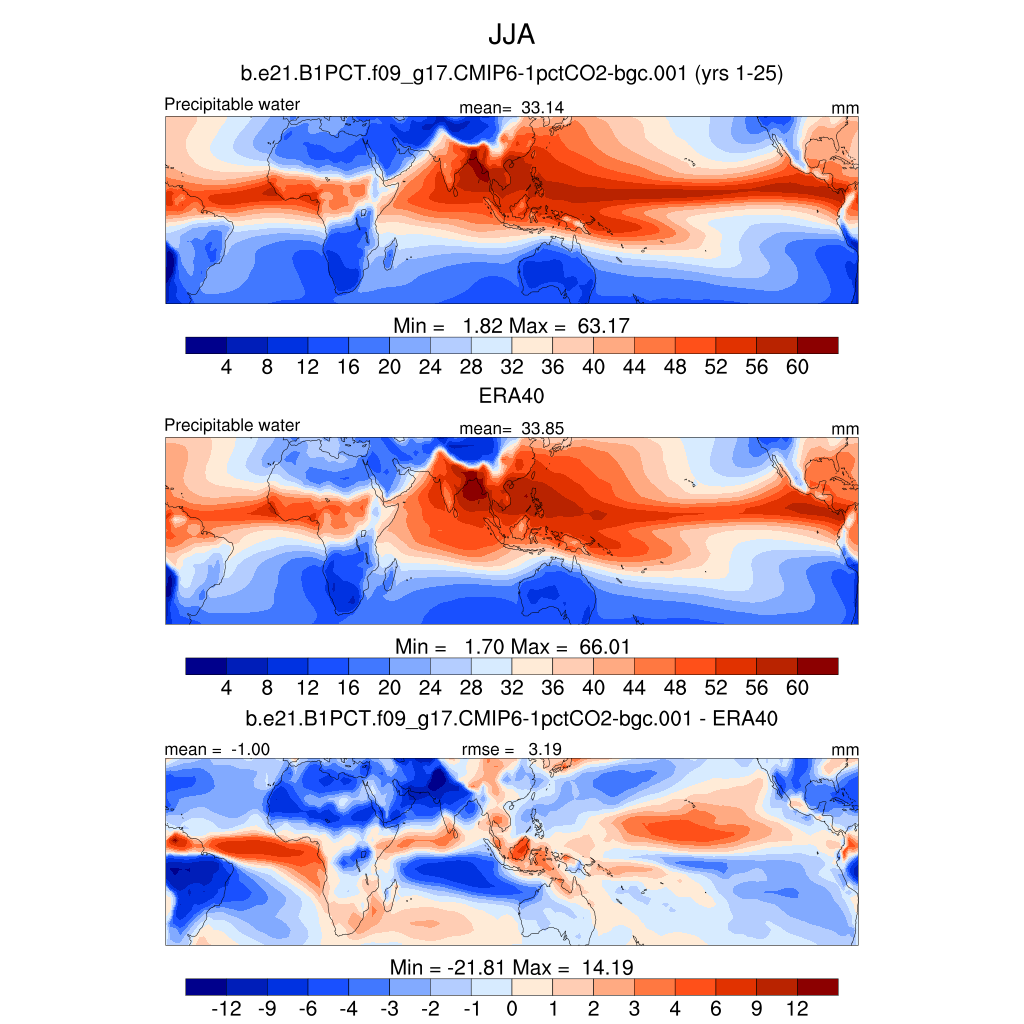
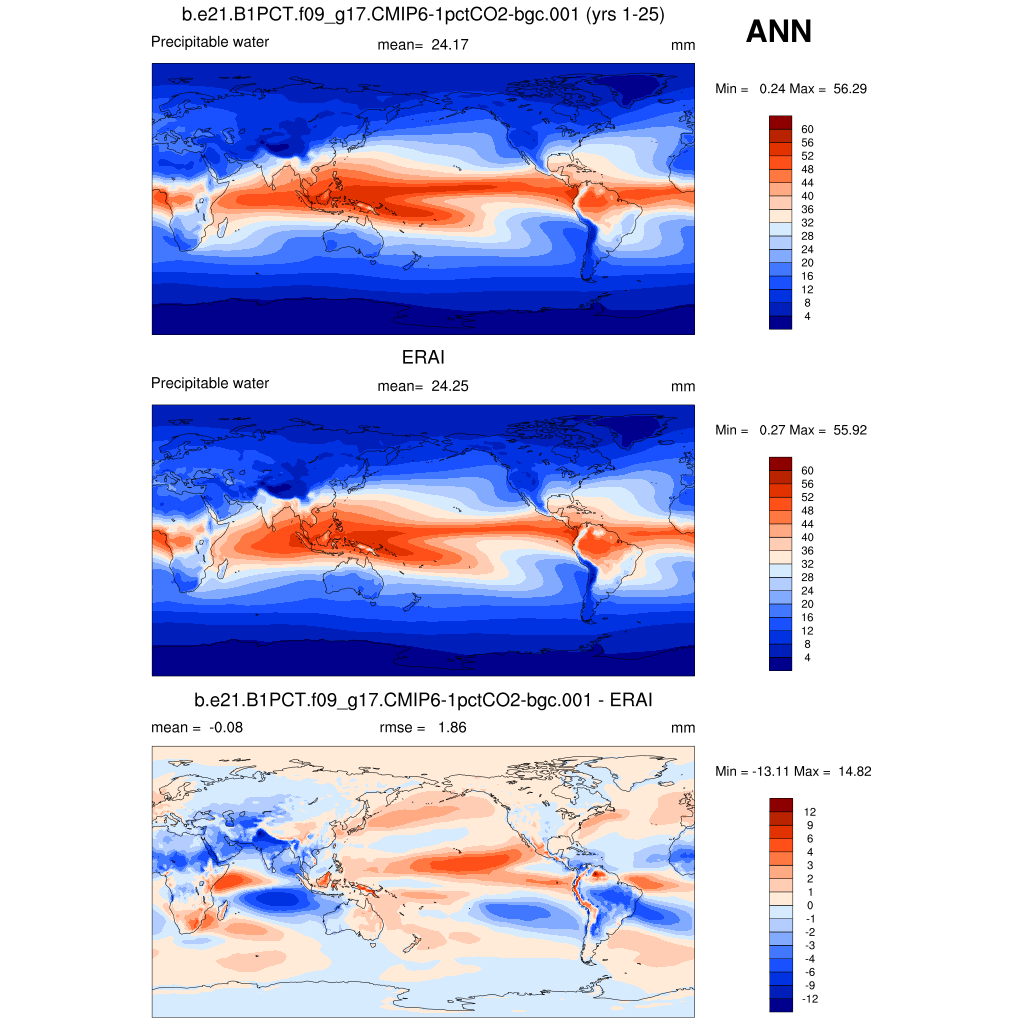
| PREH2O * | Precipitable water | plot | plot | plot |
| PREH2O TROP | Tropical precipitable water | plot | plot | plot |
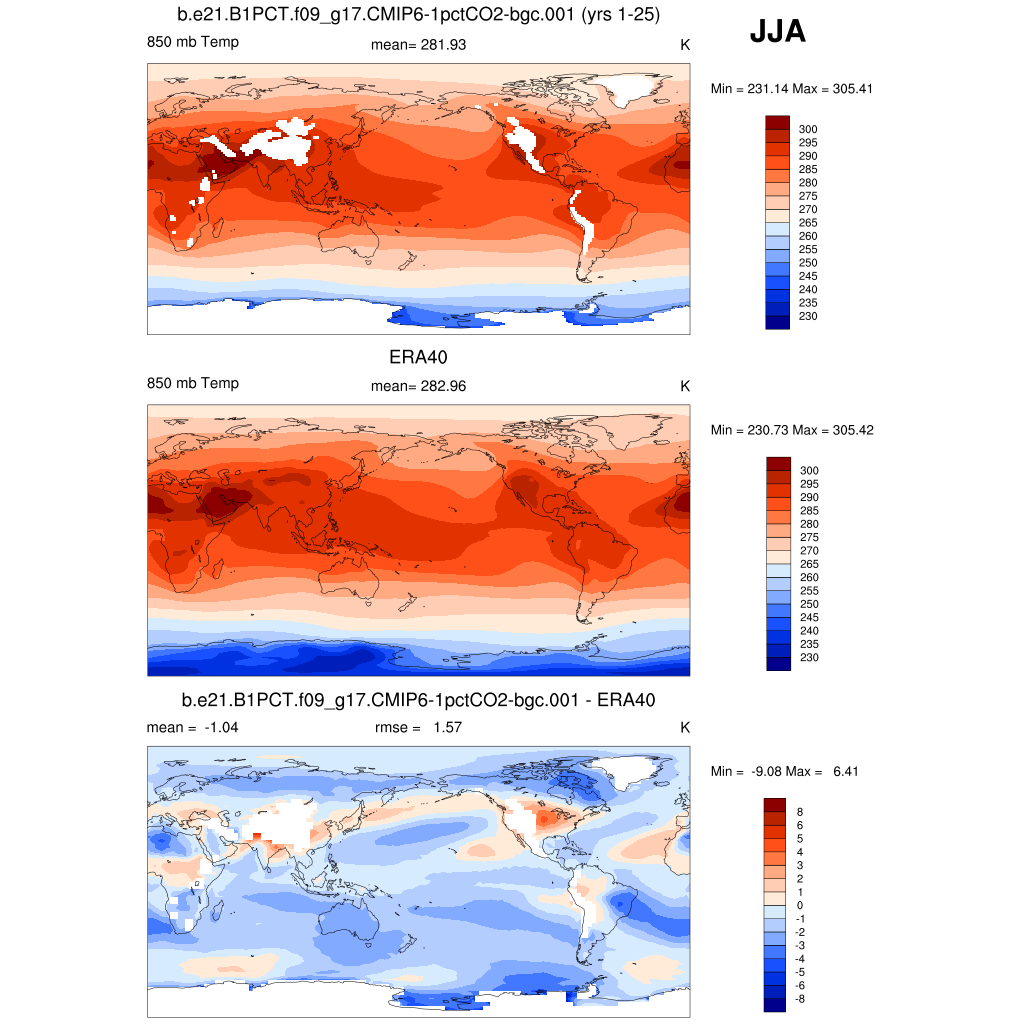
| T 850 * | 850 mb temperature | plot | plot | plot |
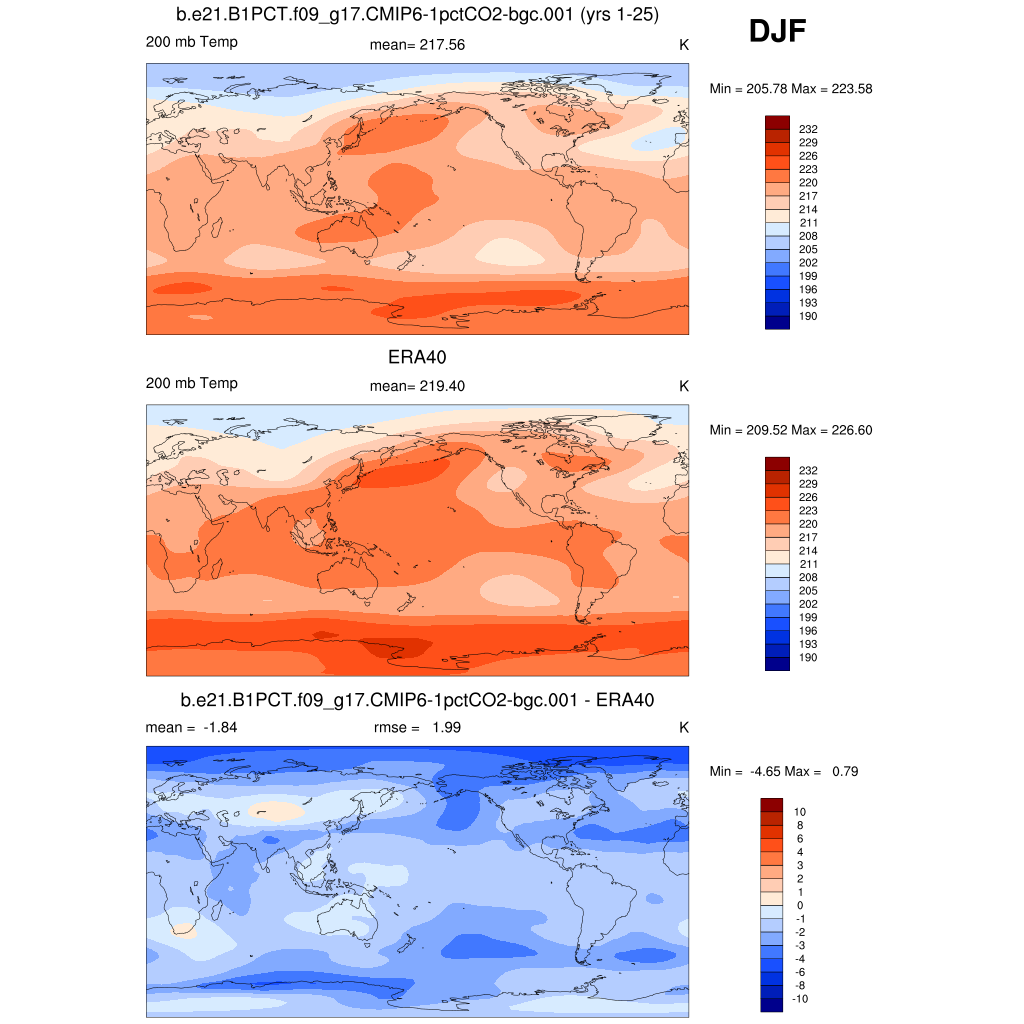
| T 200 | 200 mb temperature | plot | plot | plot |
| U 200 * | 200 mb zonal wind | plot | plot | plot |
| Z 500 | 500 mb geopotential height | plot | plot | plot |
| Z 300 * | 300 mb geopotential height | plot | plot | plot |
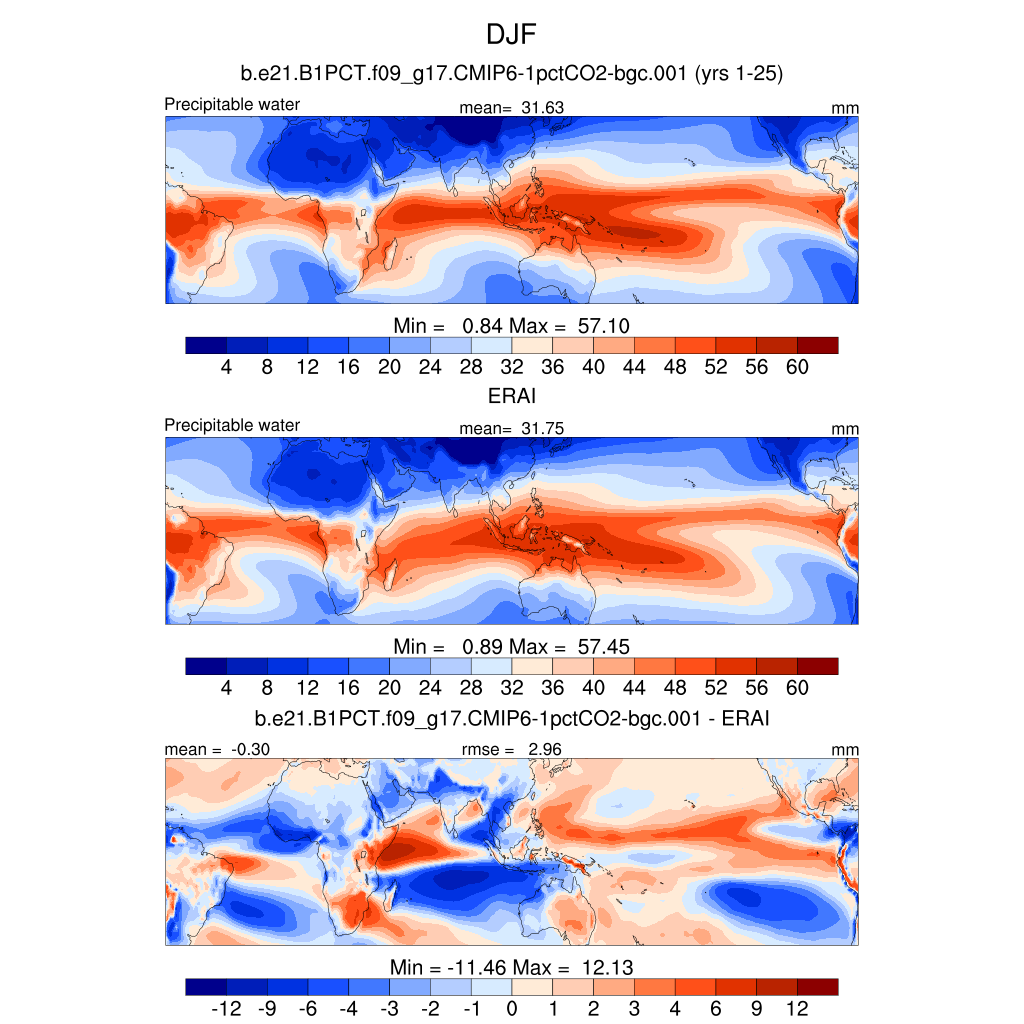
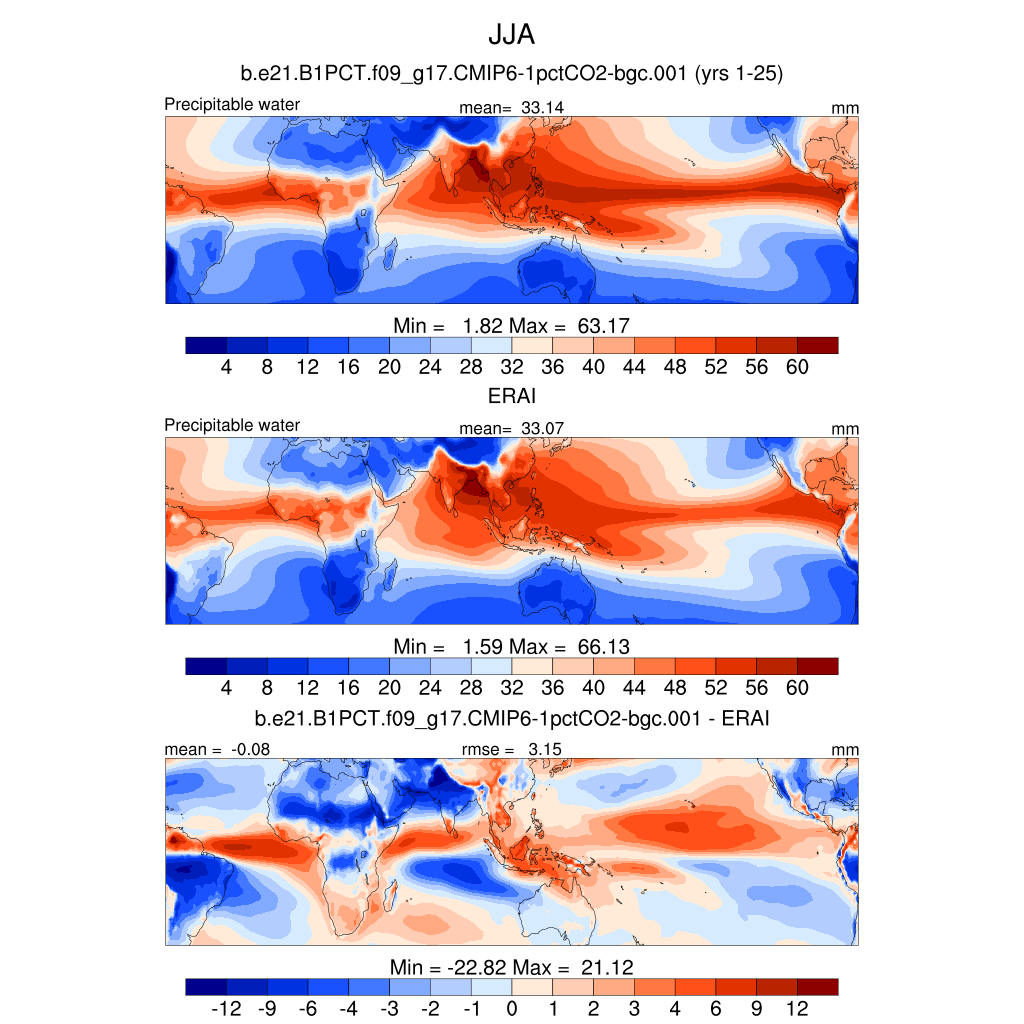
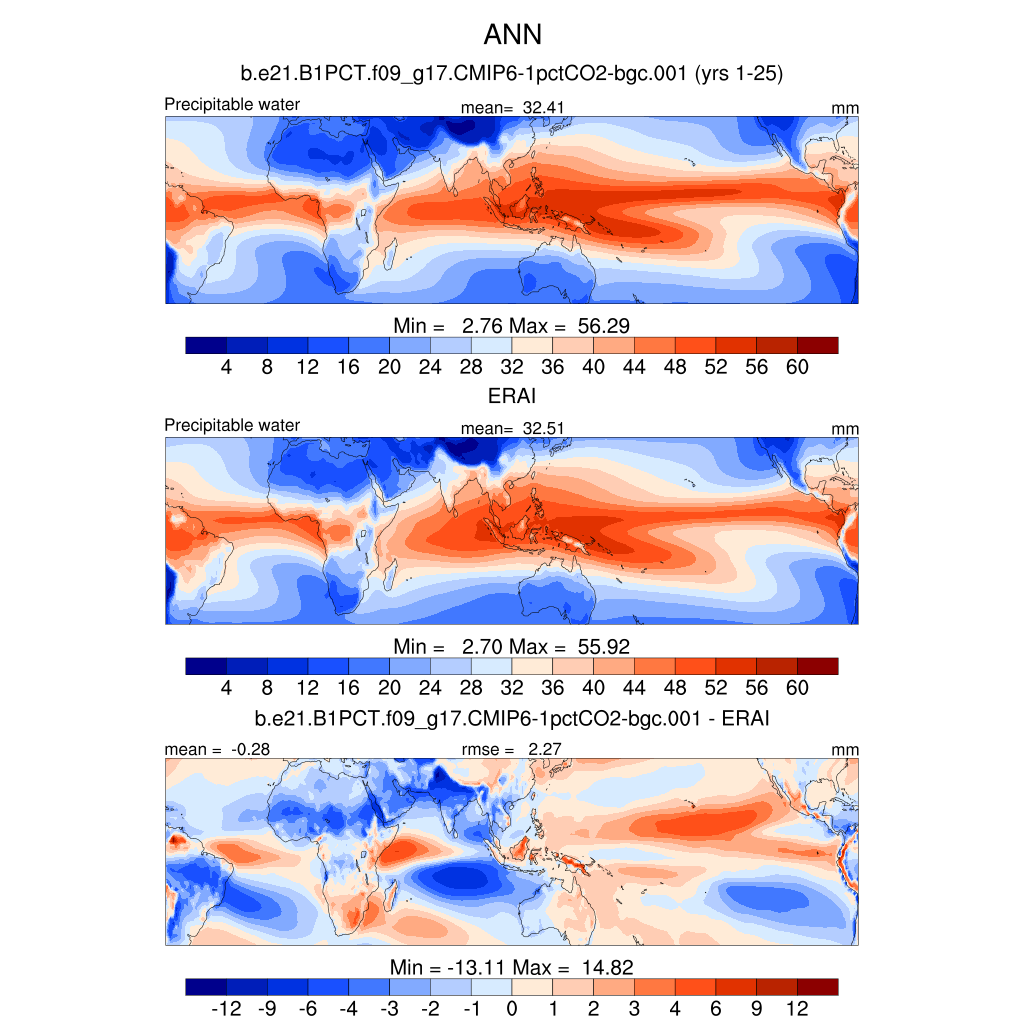
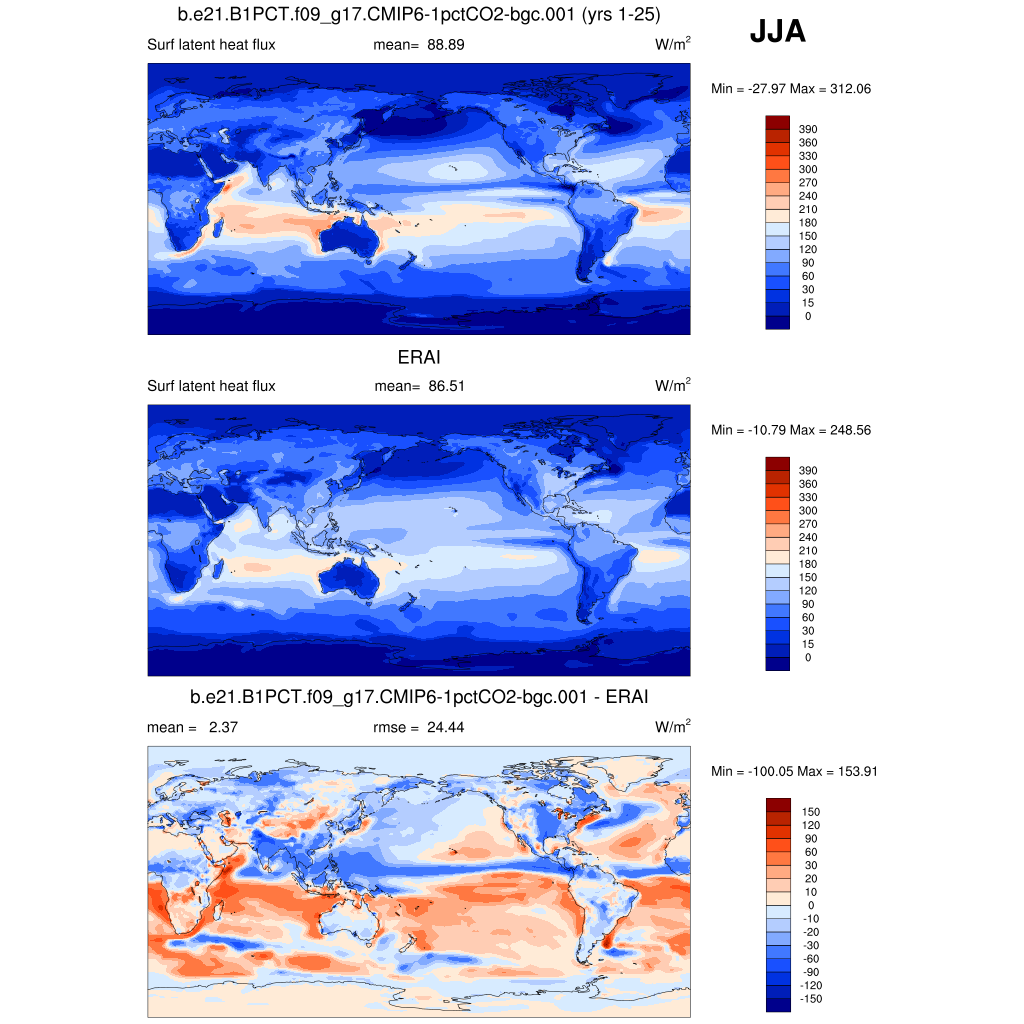
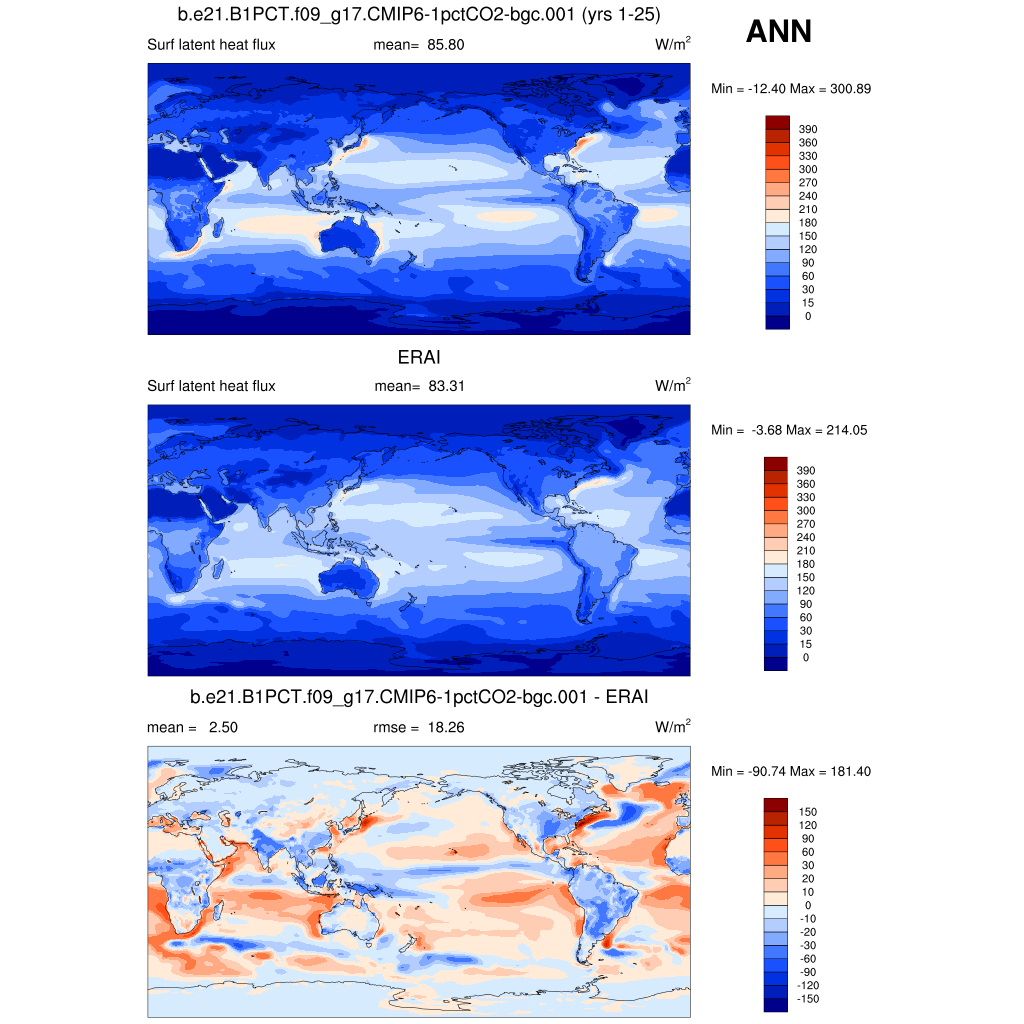
| ERA-Interim Reanalysis 1989-2005 | DJF | JJA | ANN | |
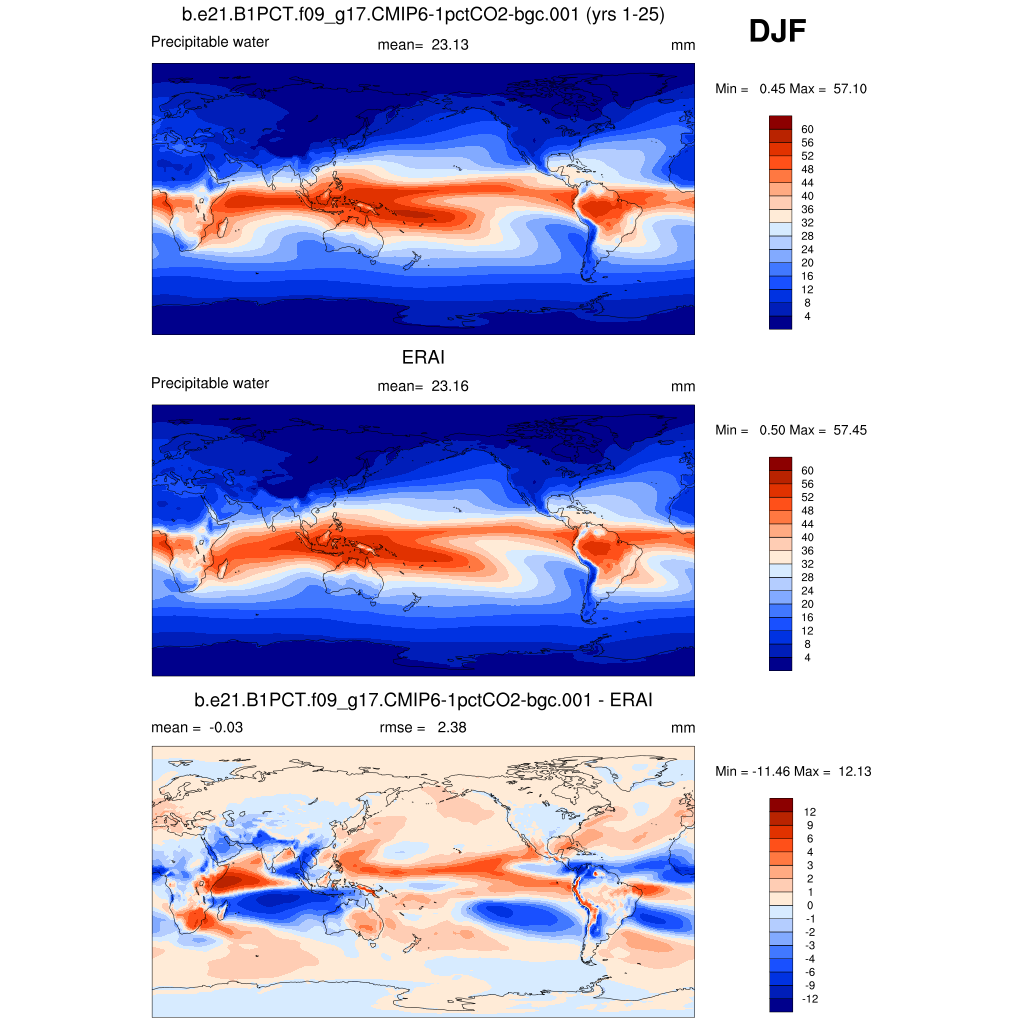
| PREH2O * | Precipitable water | plot | plot | plot |
| PREH2O TROP | Tropical precipitable water | plot | plot | plot |
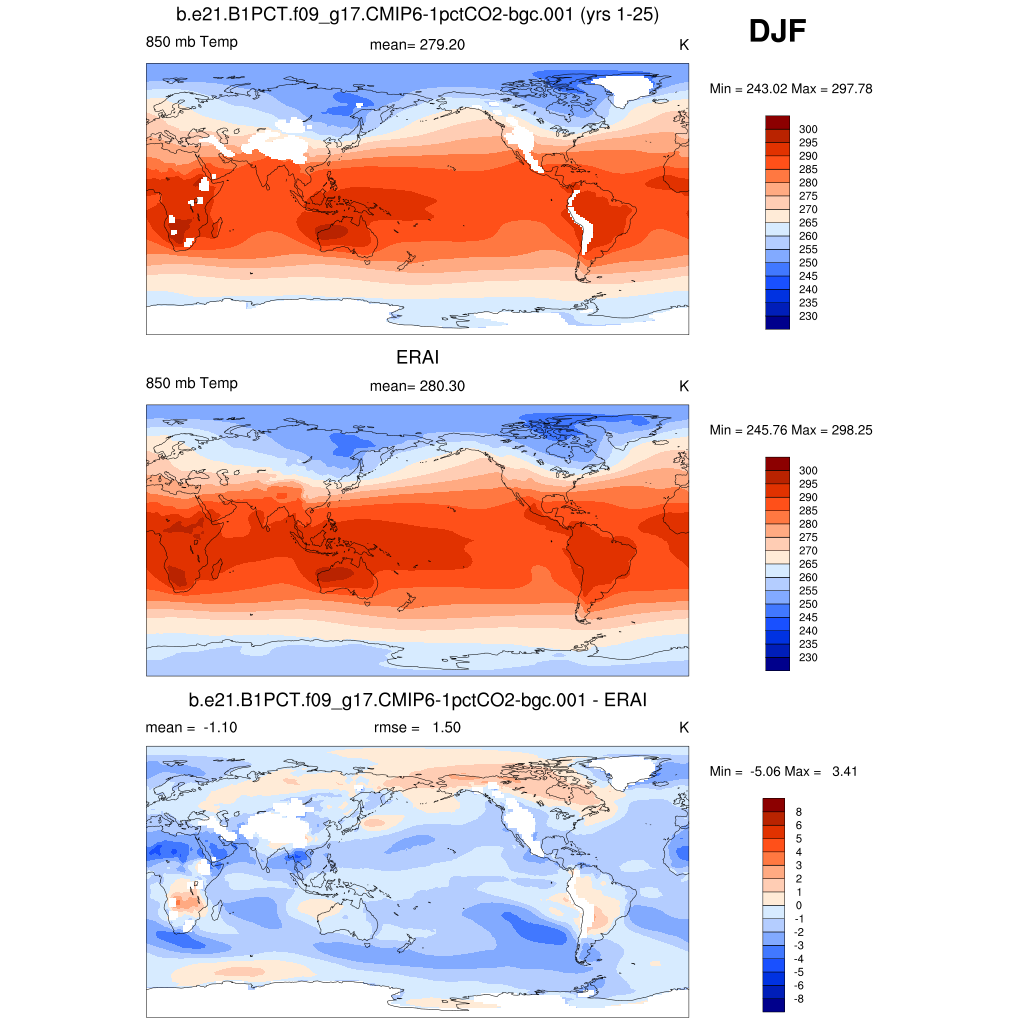
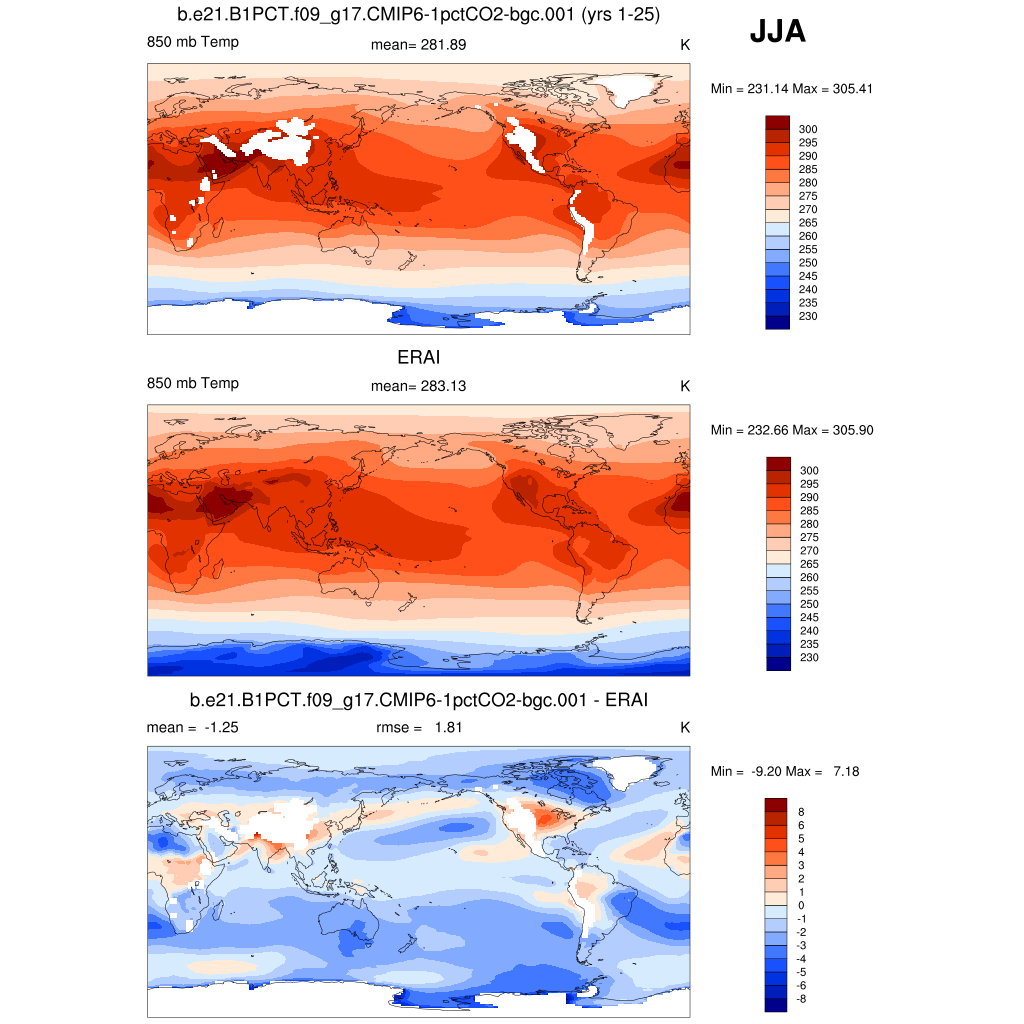
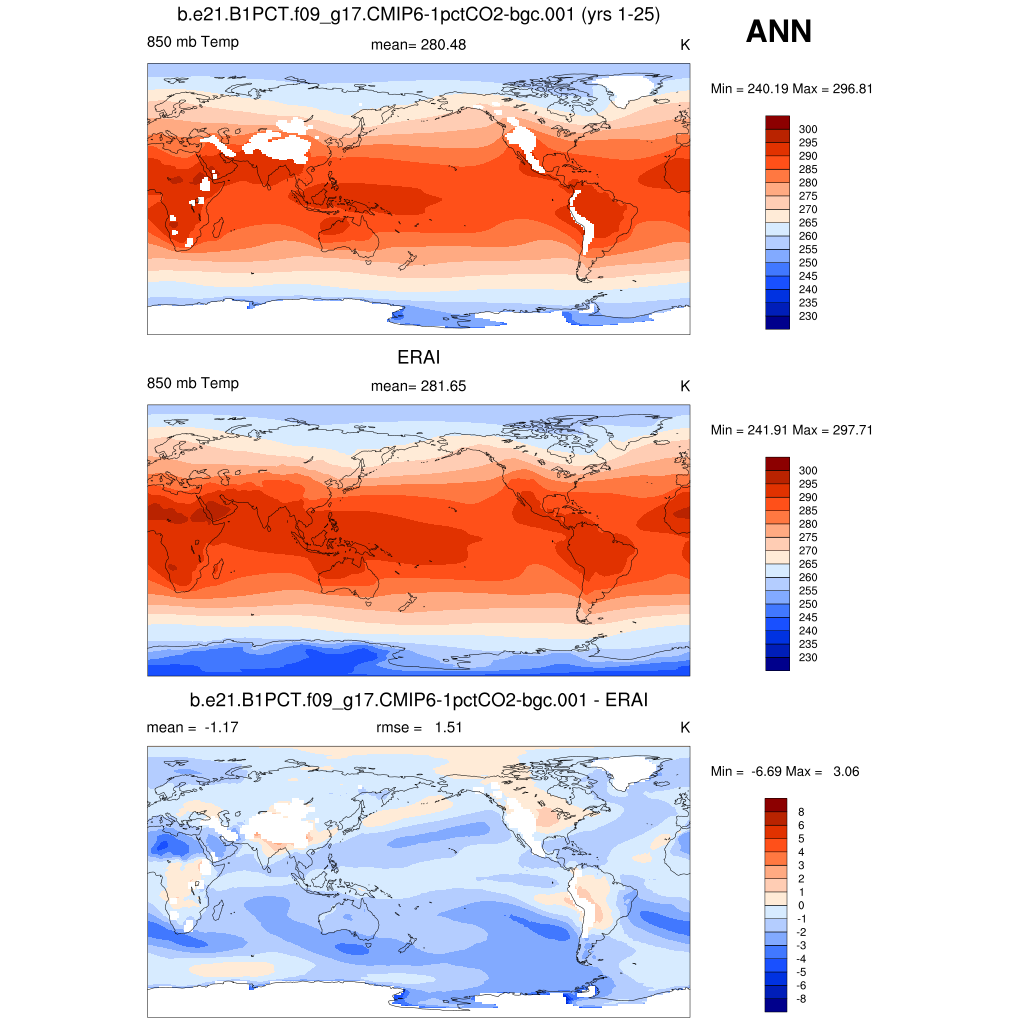
| T 850 * | 850 mb temperature | plot | plot | plot |
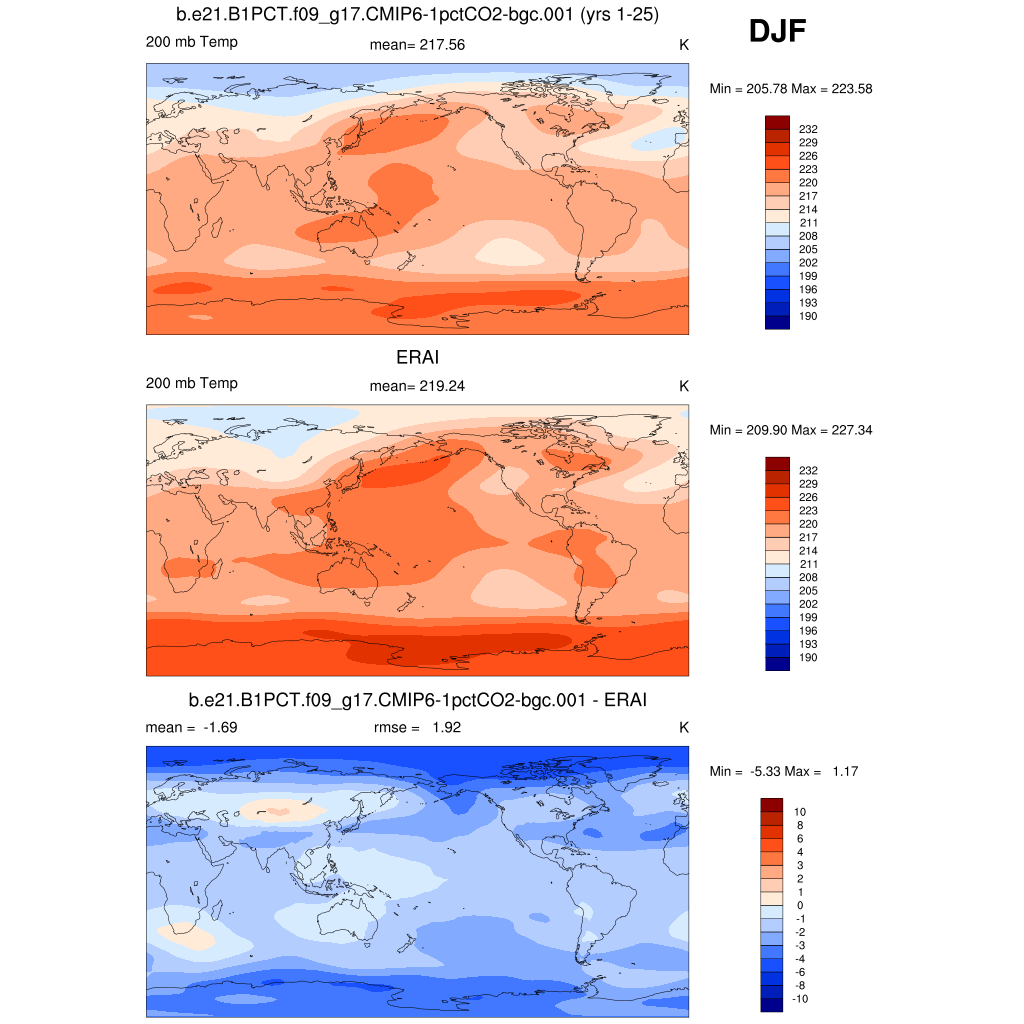
| T 200 | 200 mb temperature | plot | plot | plot |
| TTRP | Tropopause temperature | plot | plot | plot |
| U 200 * | 200 mb zonal wind | plot | plot | plot |
| Z 500 | 500 mb geopotential height | plot | plot | plot |
| Z 300 * | 300 mb geopotential height | plot | plot | plot |
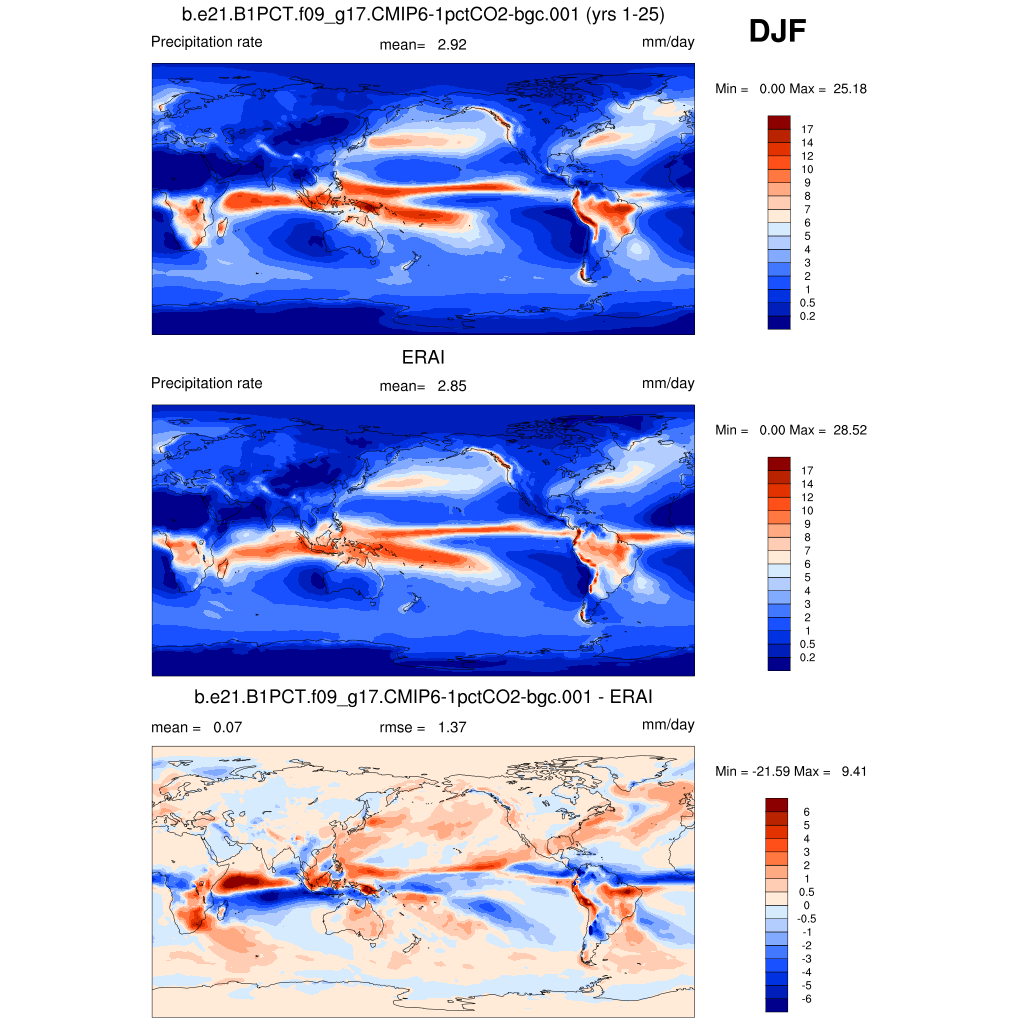
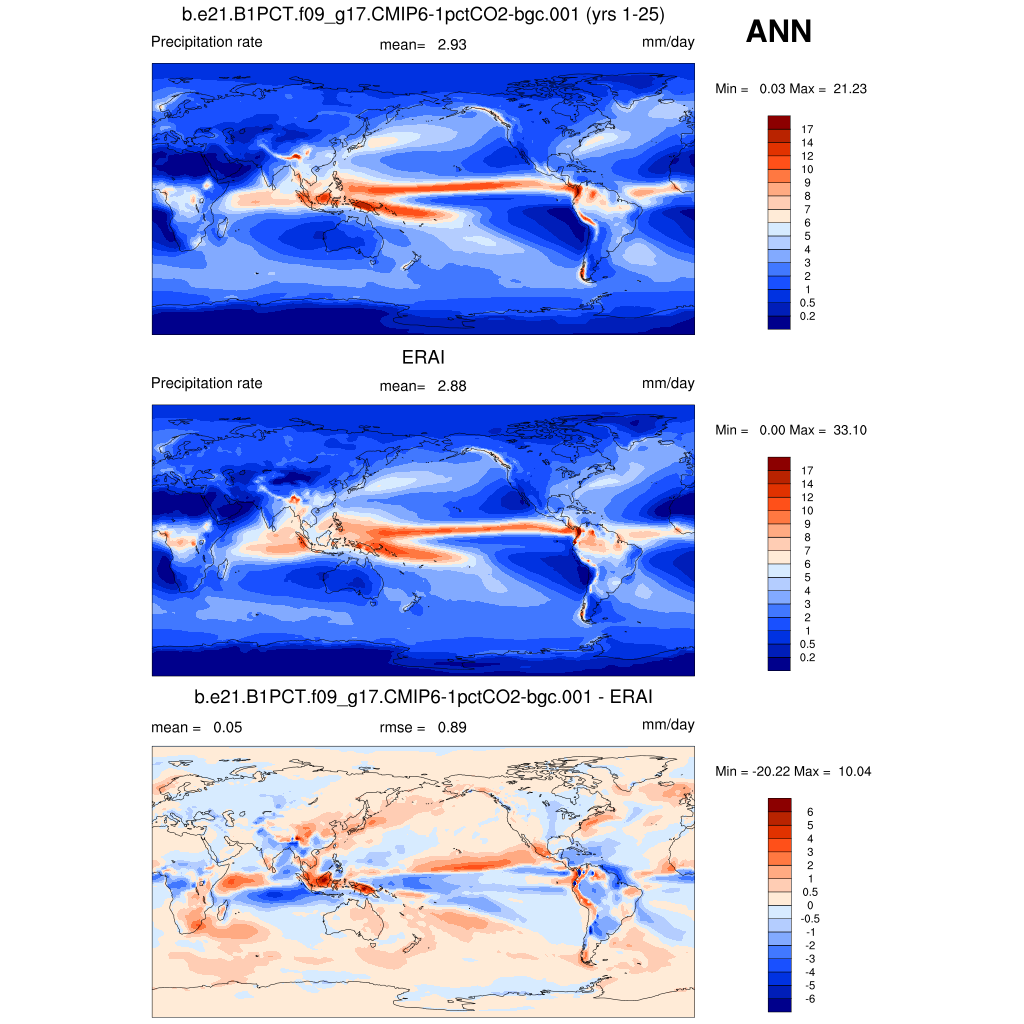
| PRECT | Precipitation | plot | plot | plot |
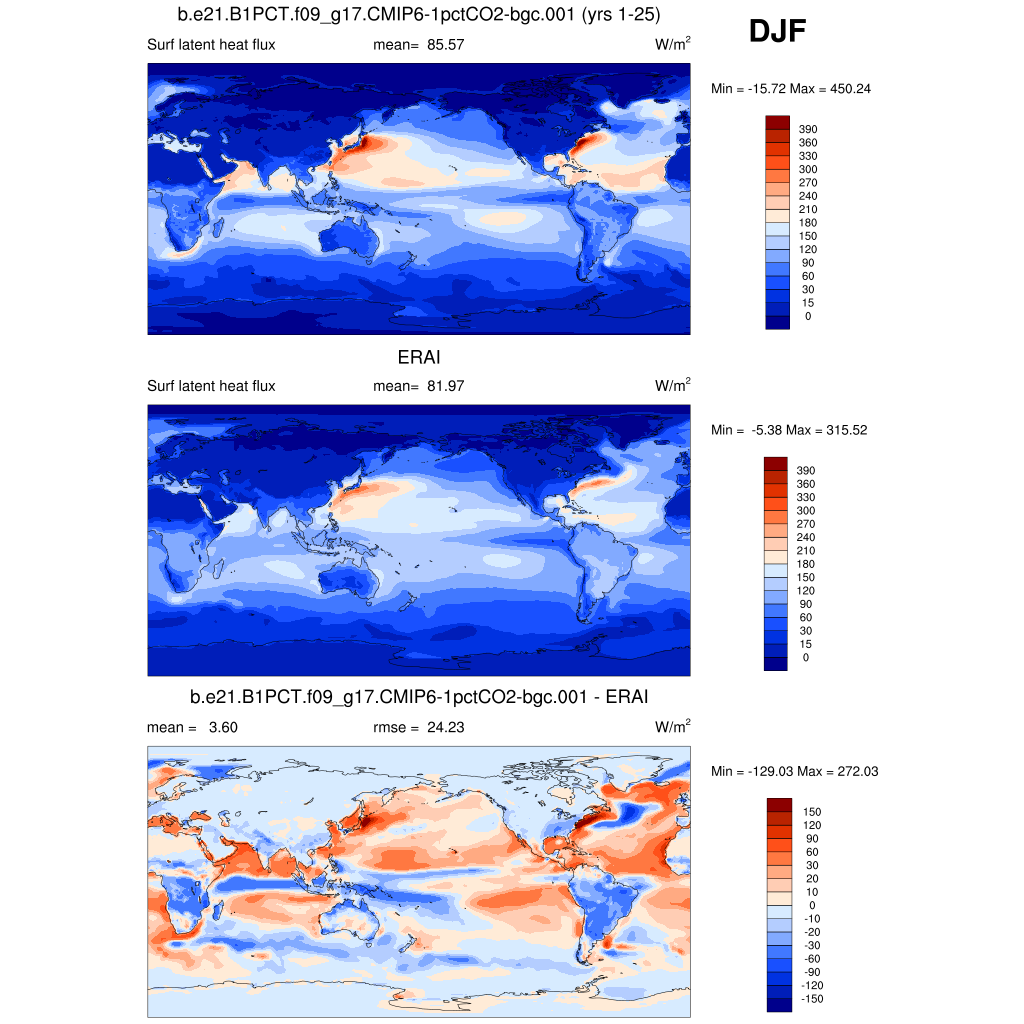
| LHFLX | Latent heat flux | plot | plot | plot |
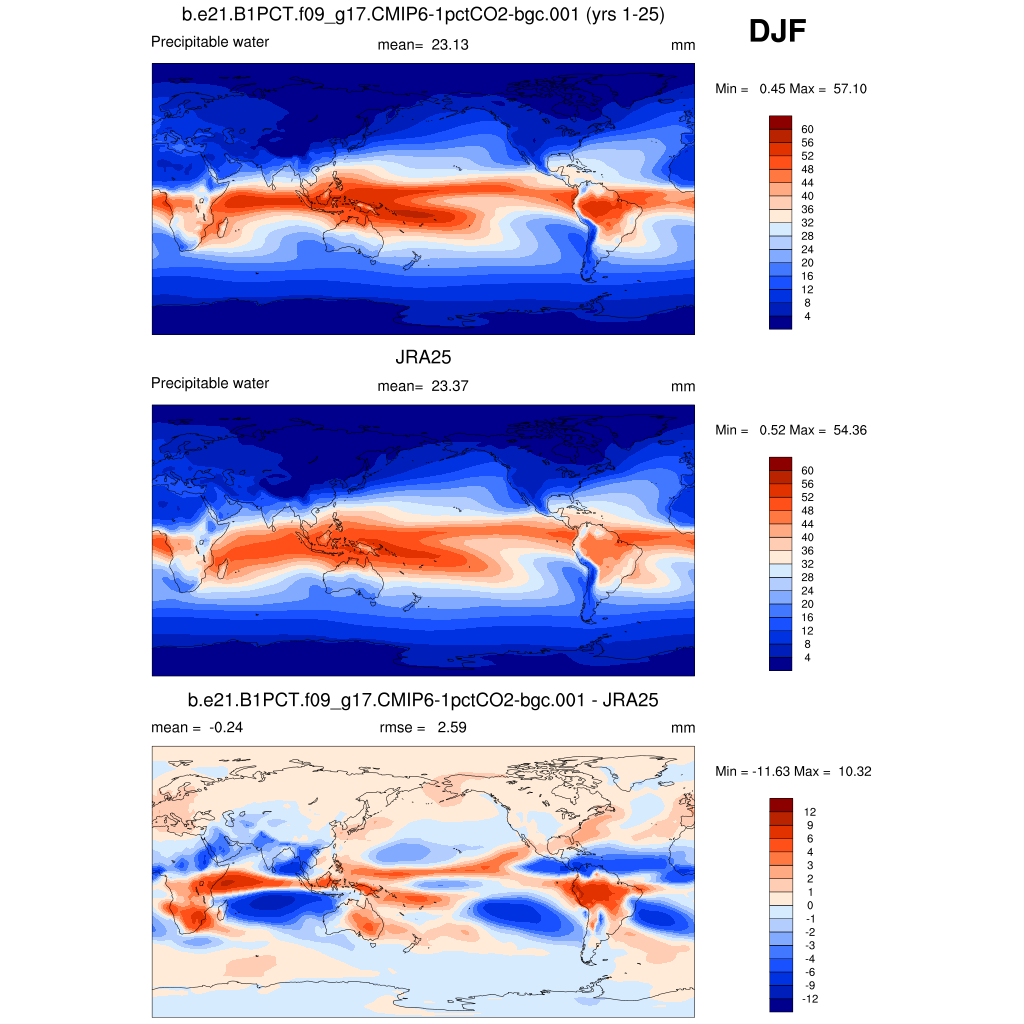
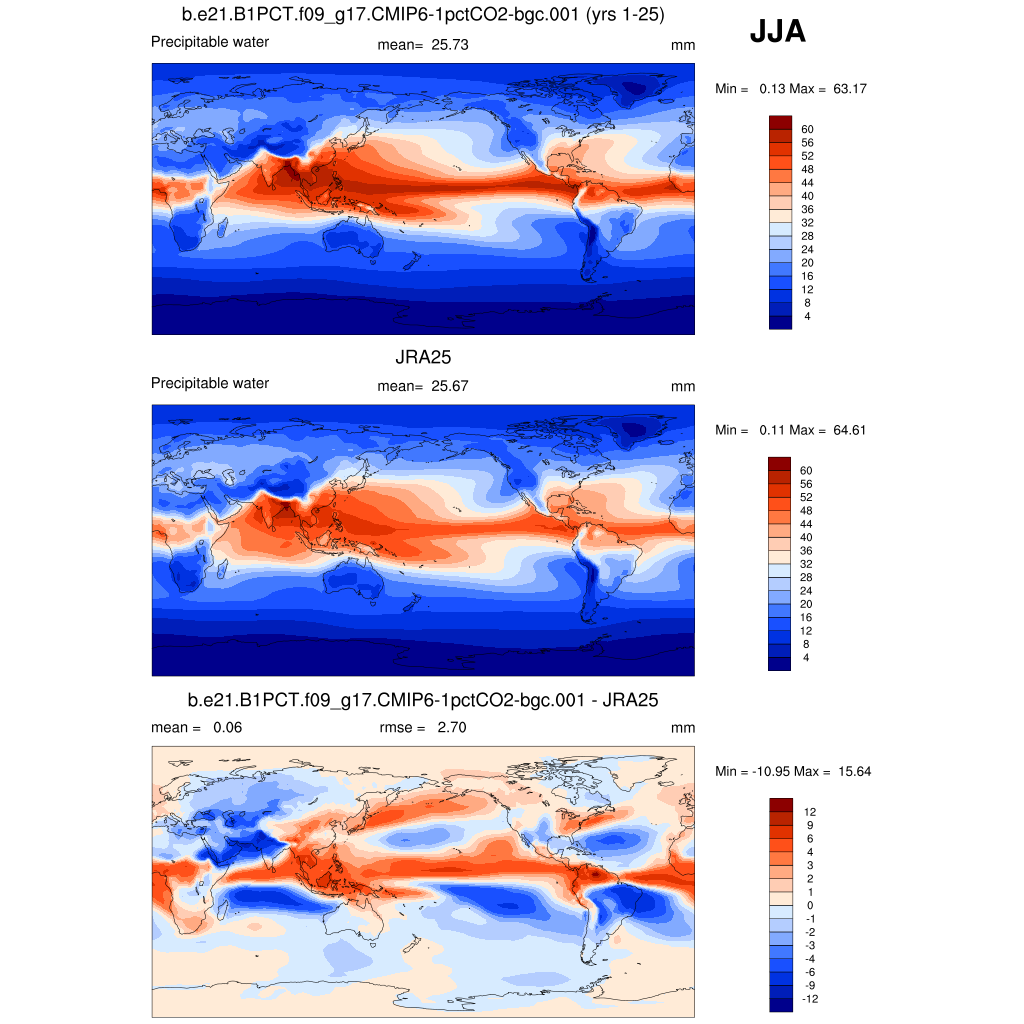
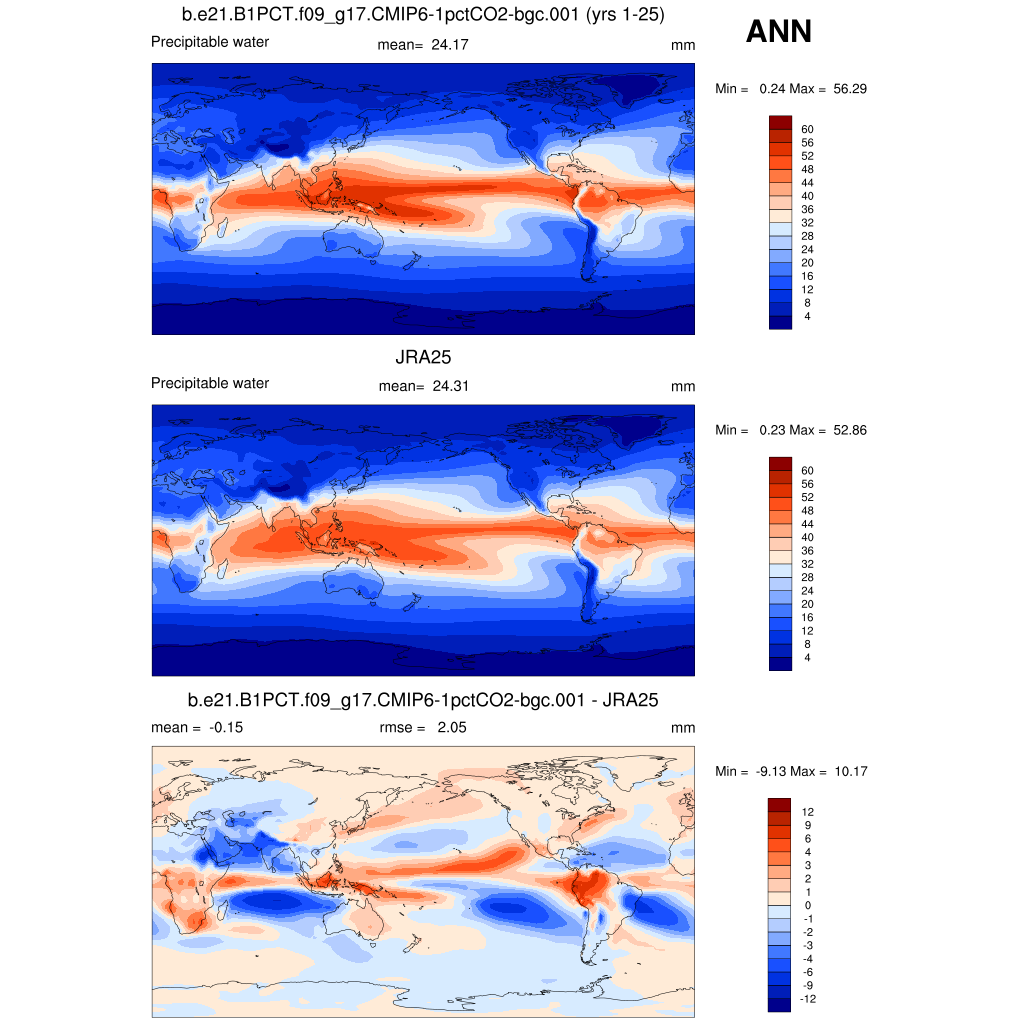
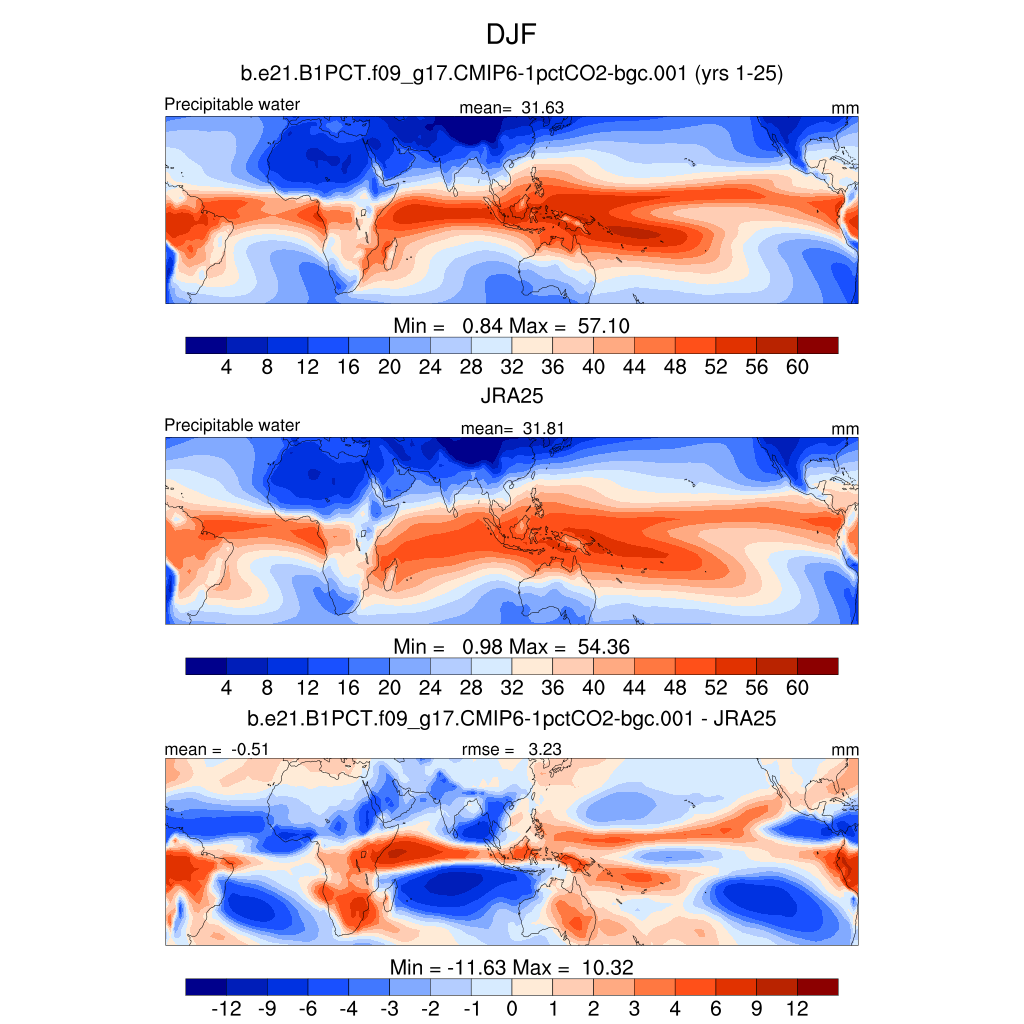
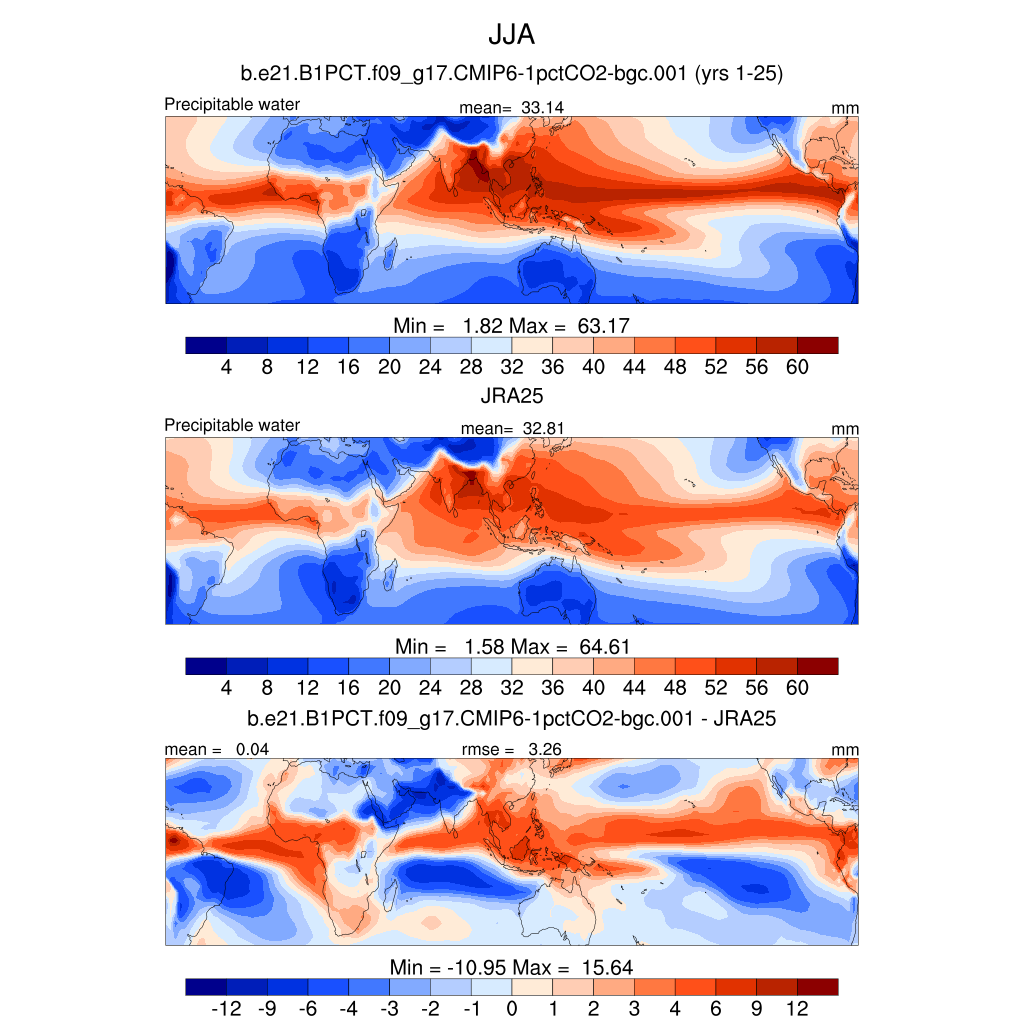
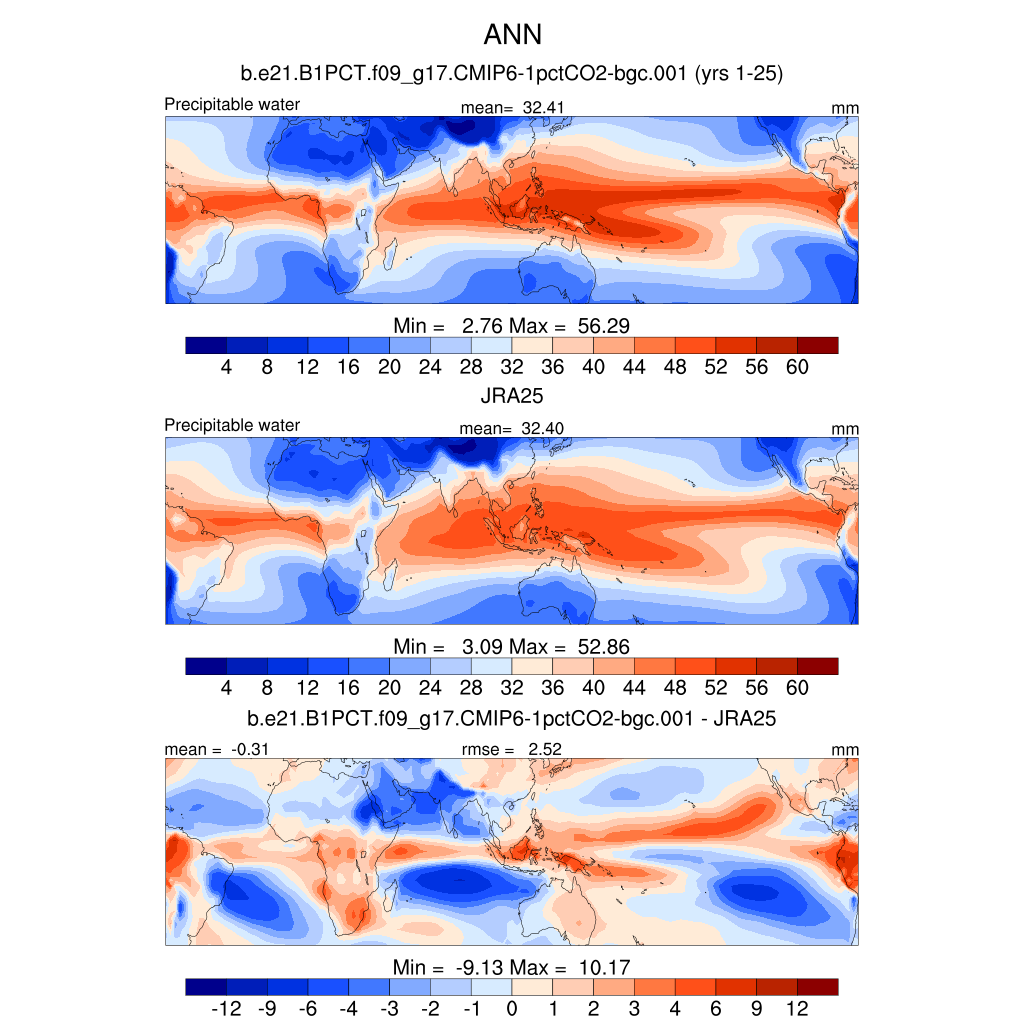
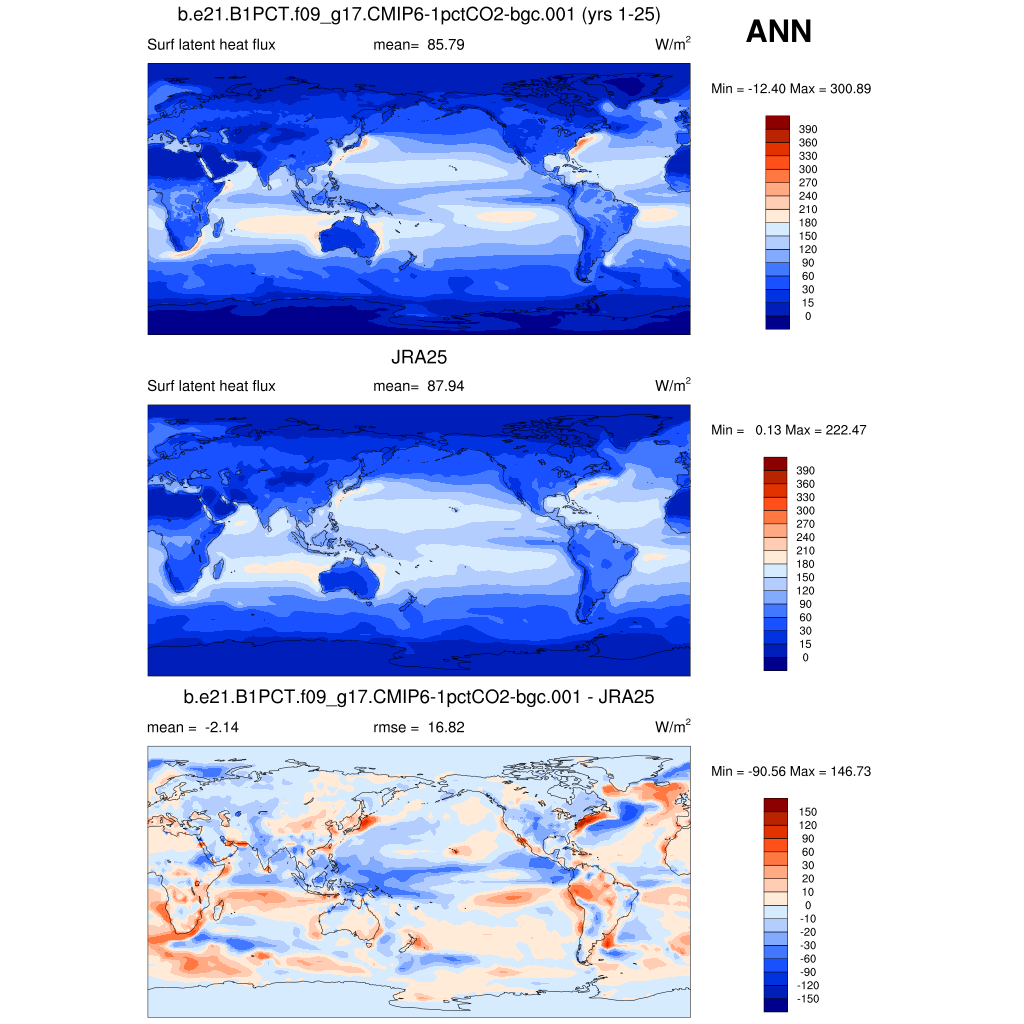
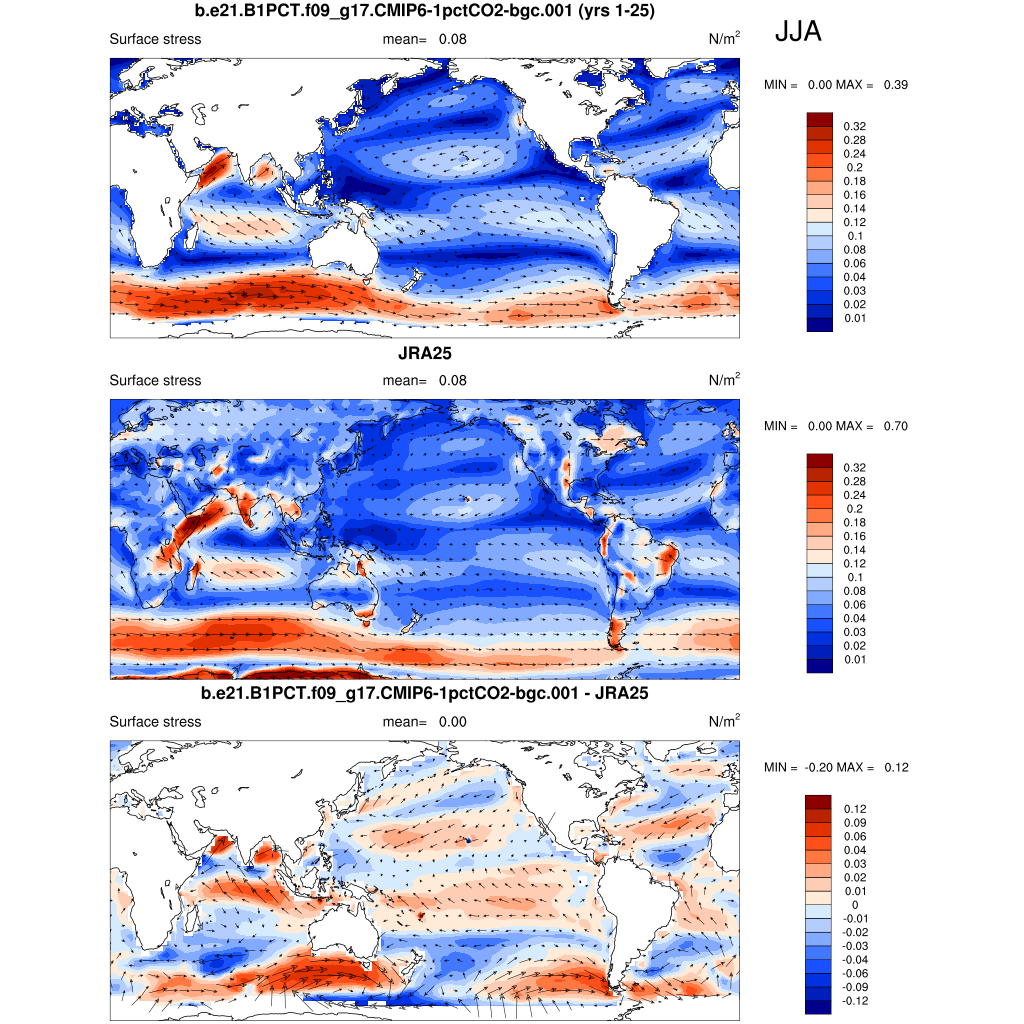
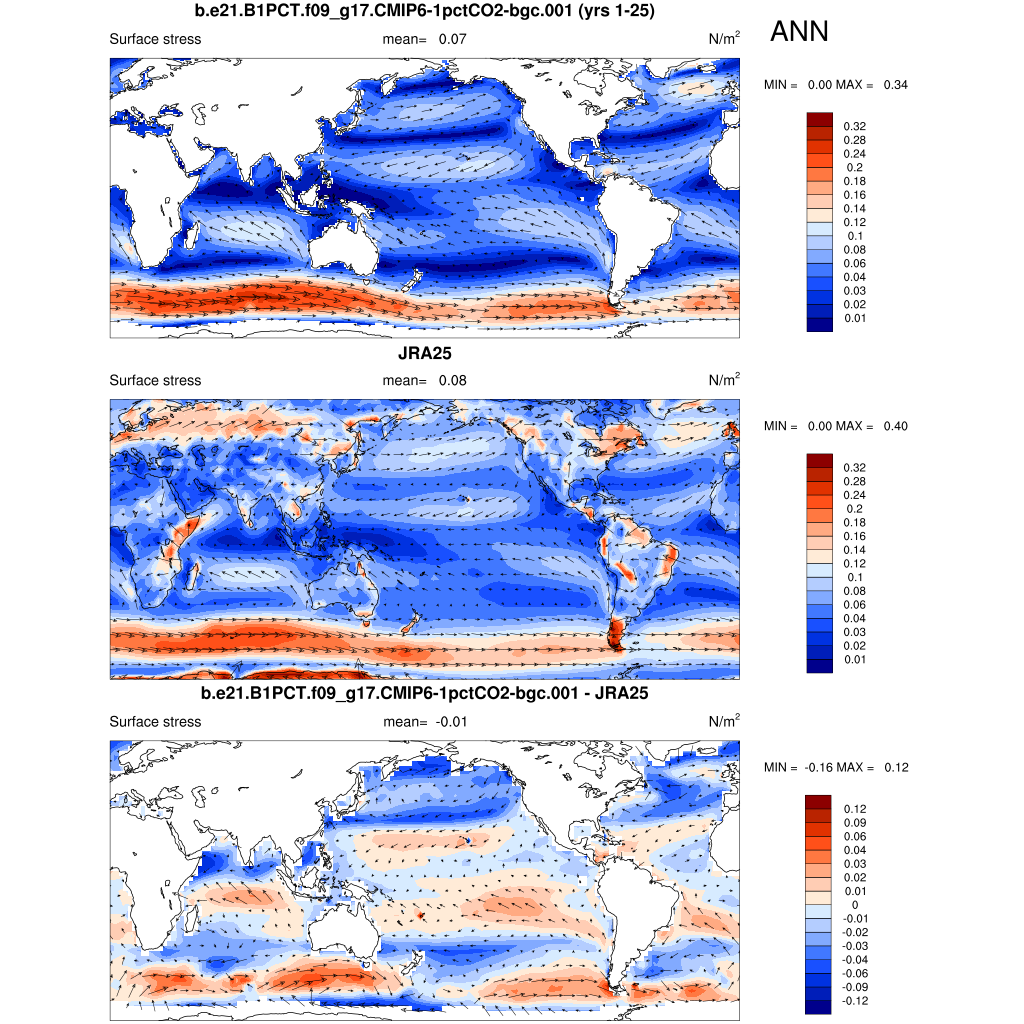
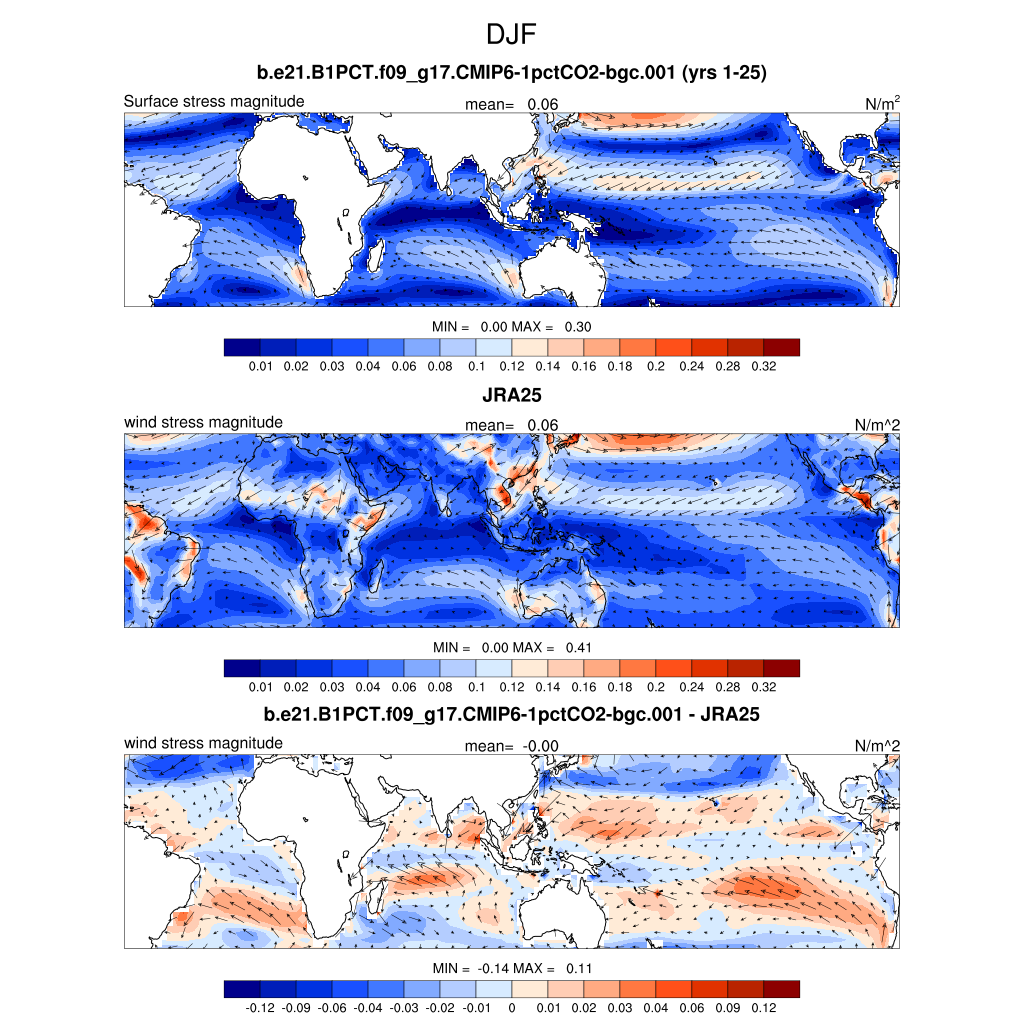
| JRA25 Reanalysis 1979-04 | DJF | JJA | ANN | |
| PREH2O * | Total precipitable water | plot | plot | plot |
| PREH2O TROP | Tropical precipitable water | plot | plot | plot |
| PSL * | Sea-level pressure | plot | plot | plot |
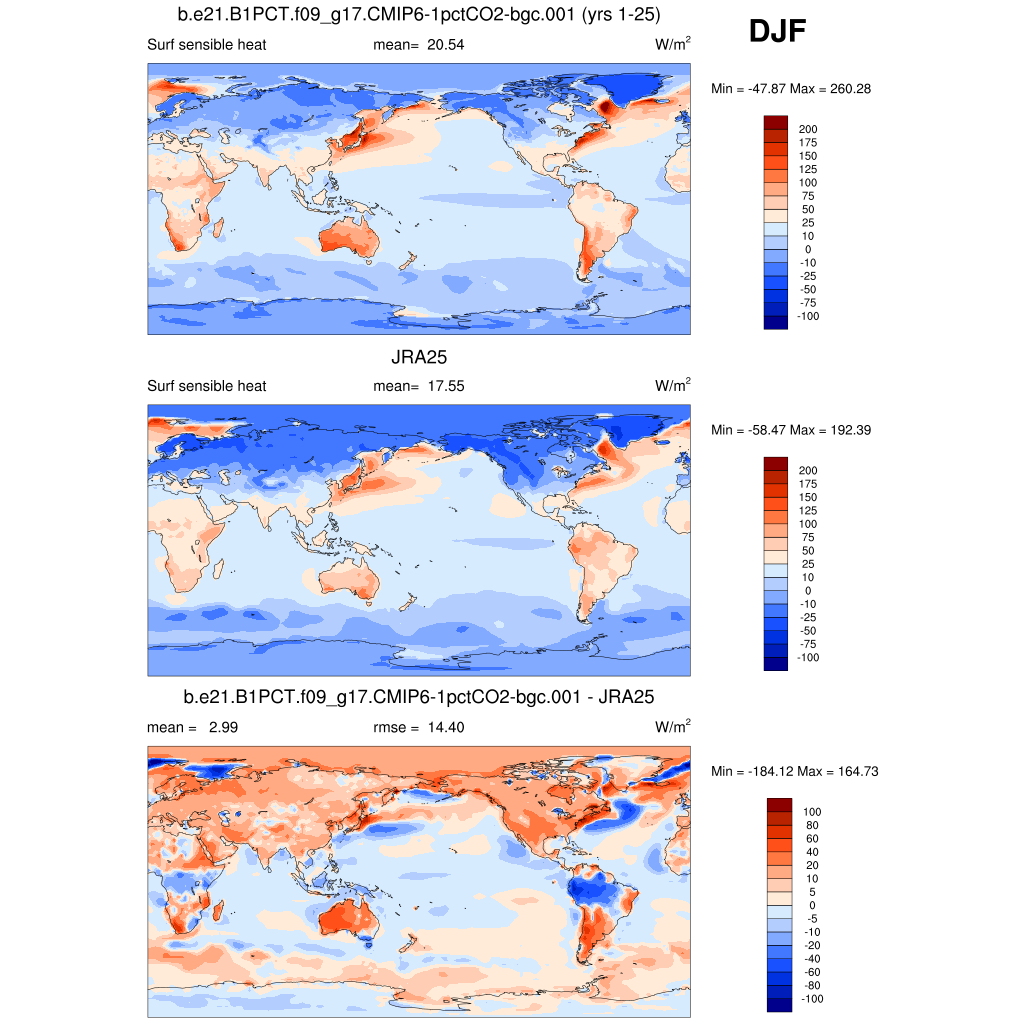
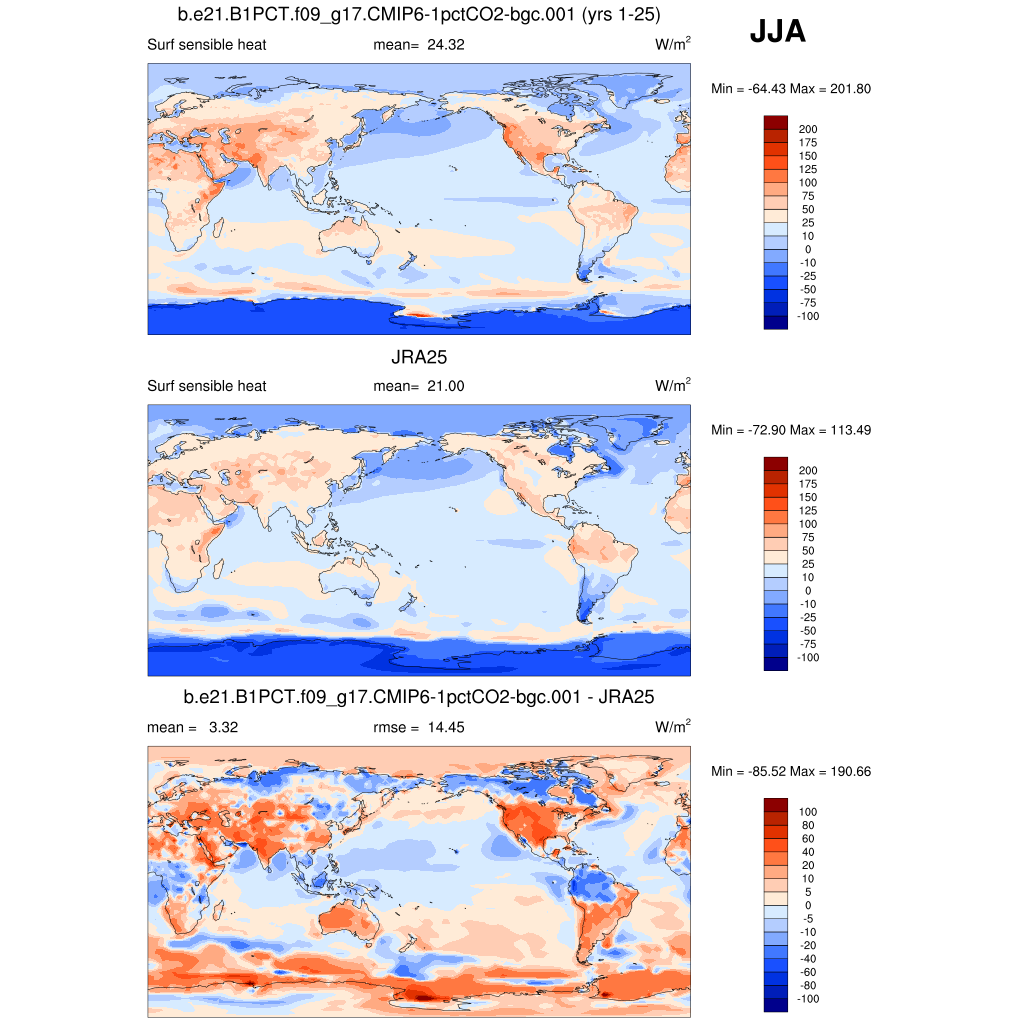
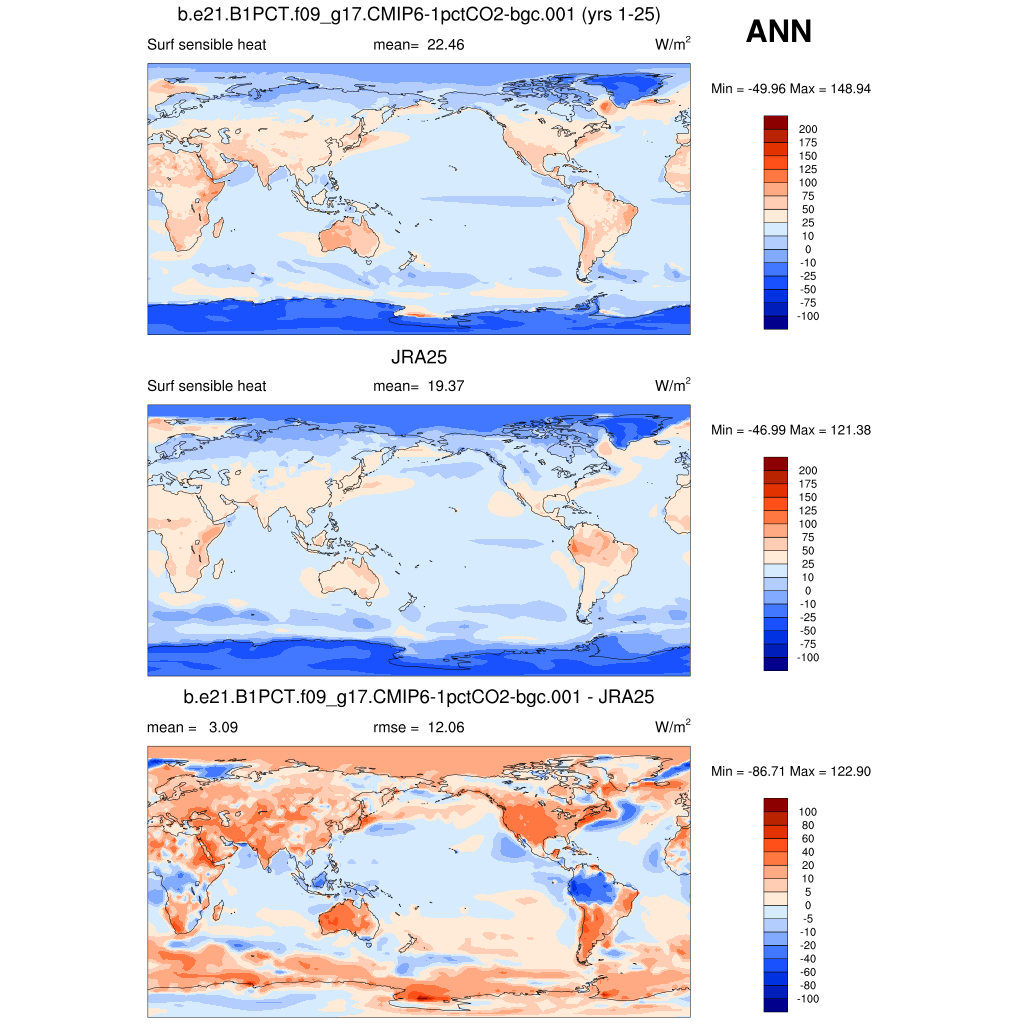
| SHFLX * | Surface sensible heat flux | plot | plot | plot |
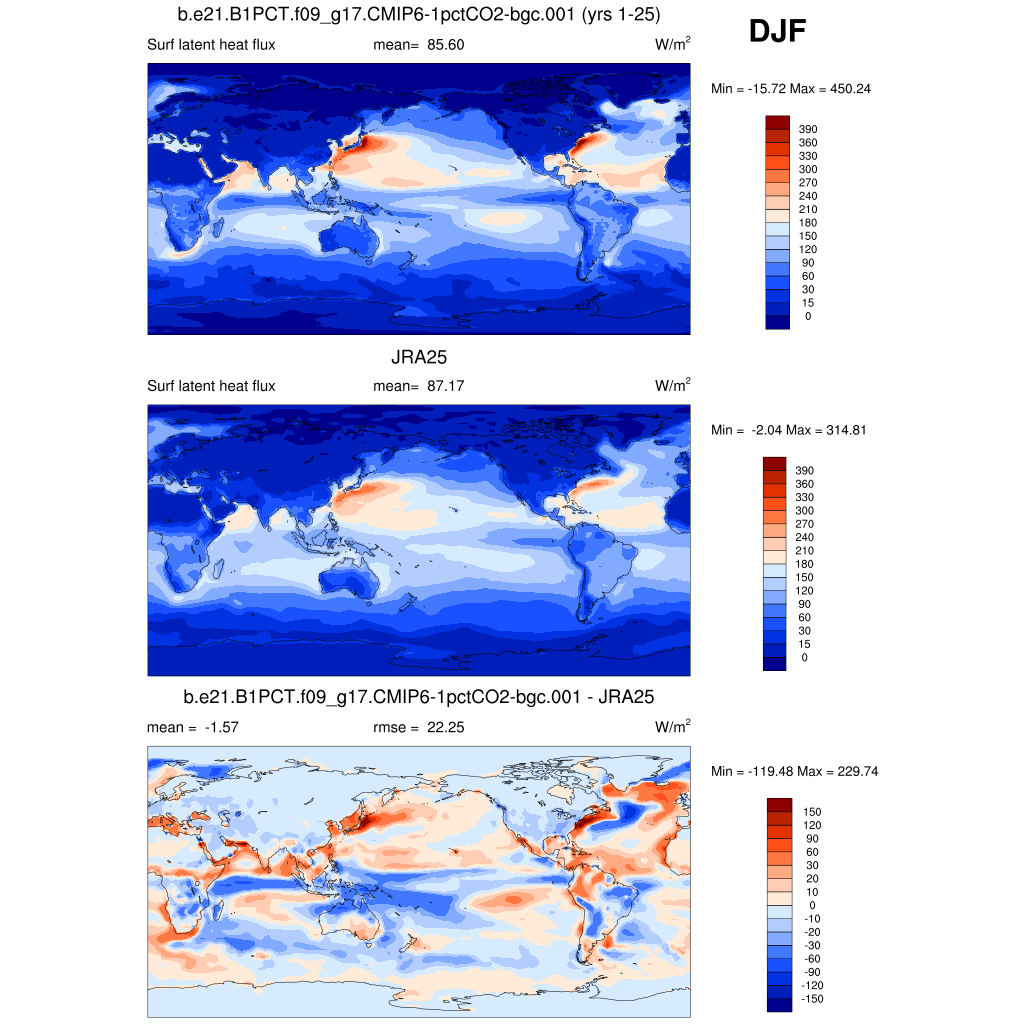
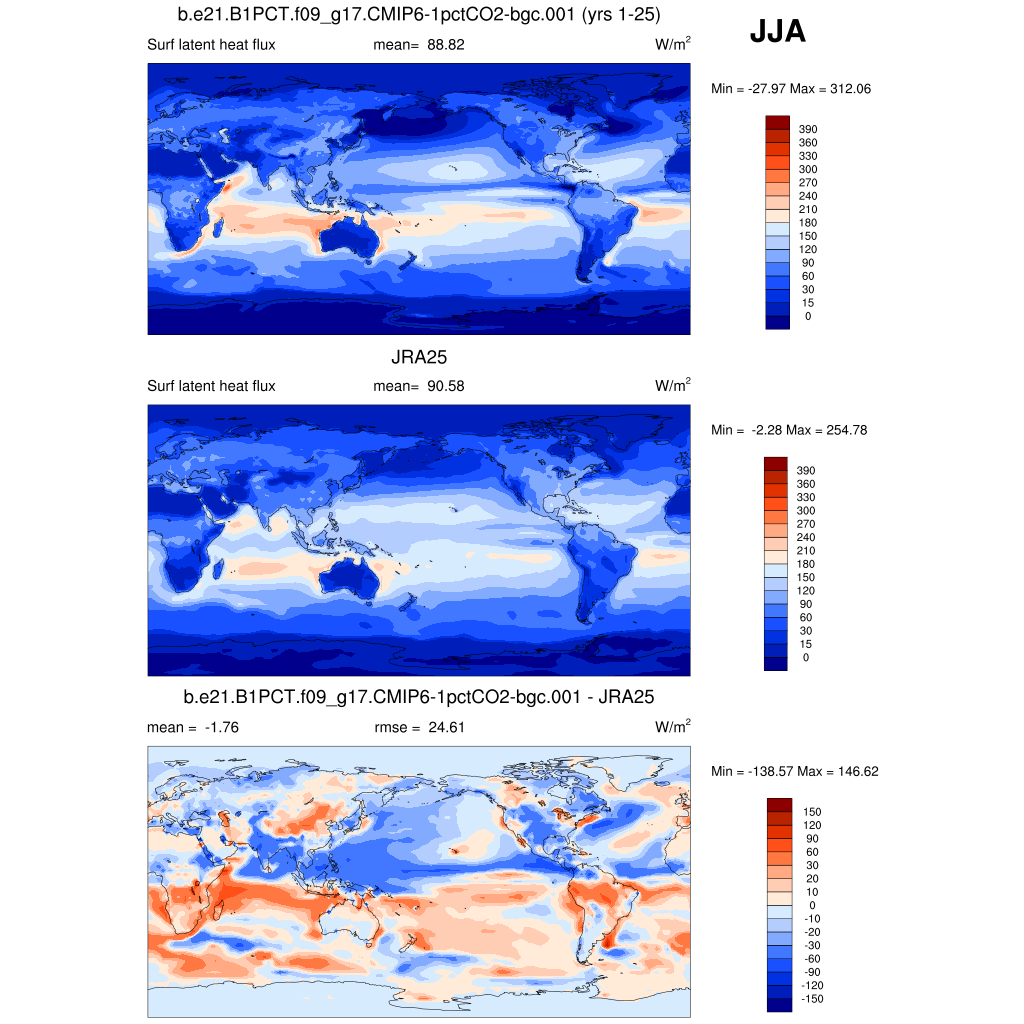
| LHFLX * | Surface latent heat flux | plot | plot | plot |
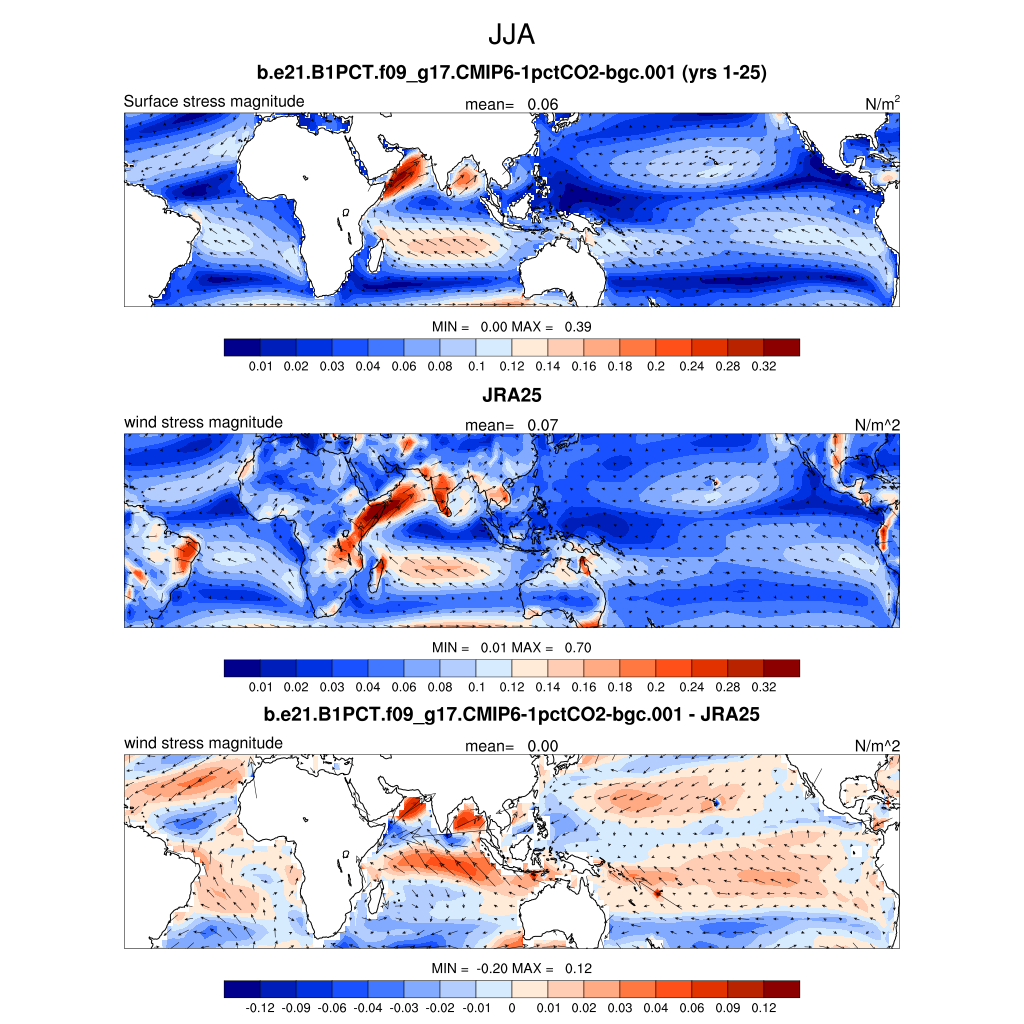
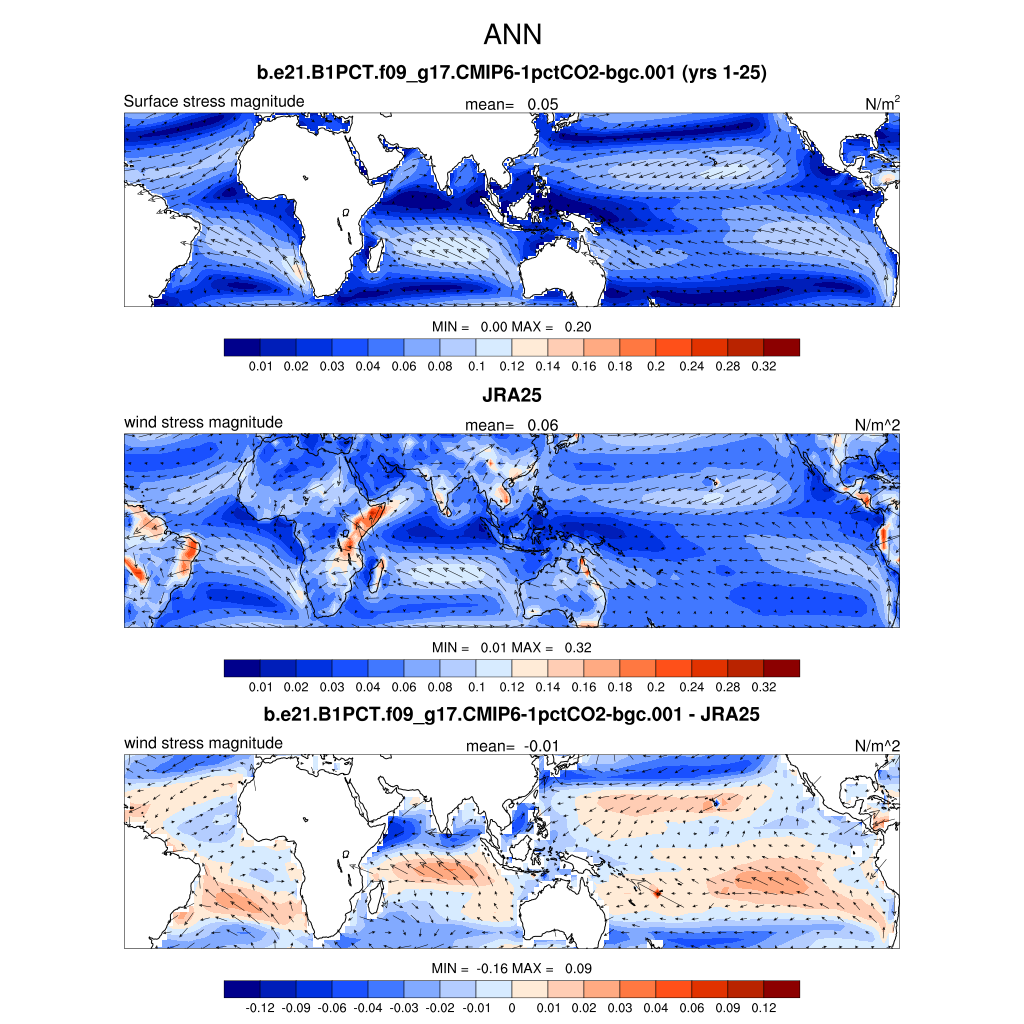
| SURF STRESS * | Surface wind stress (ocean) | plot | plot | plot |
| SURF STRESS TROP * | Tropical surface wind stress (ocean) | plot | plot | plot |
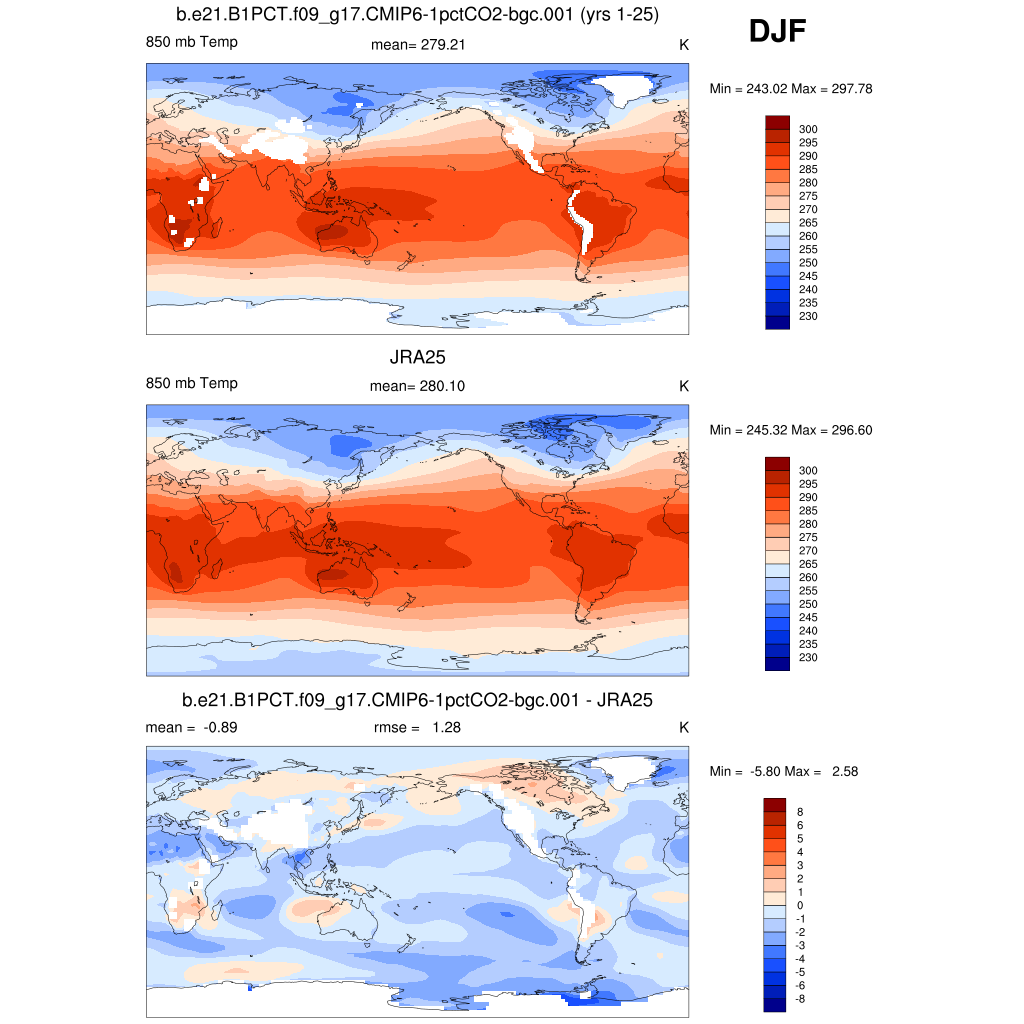
| T 850 * | 850 mb temperature | plot | plot | plot |
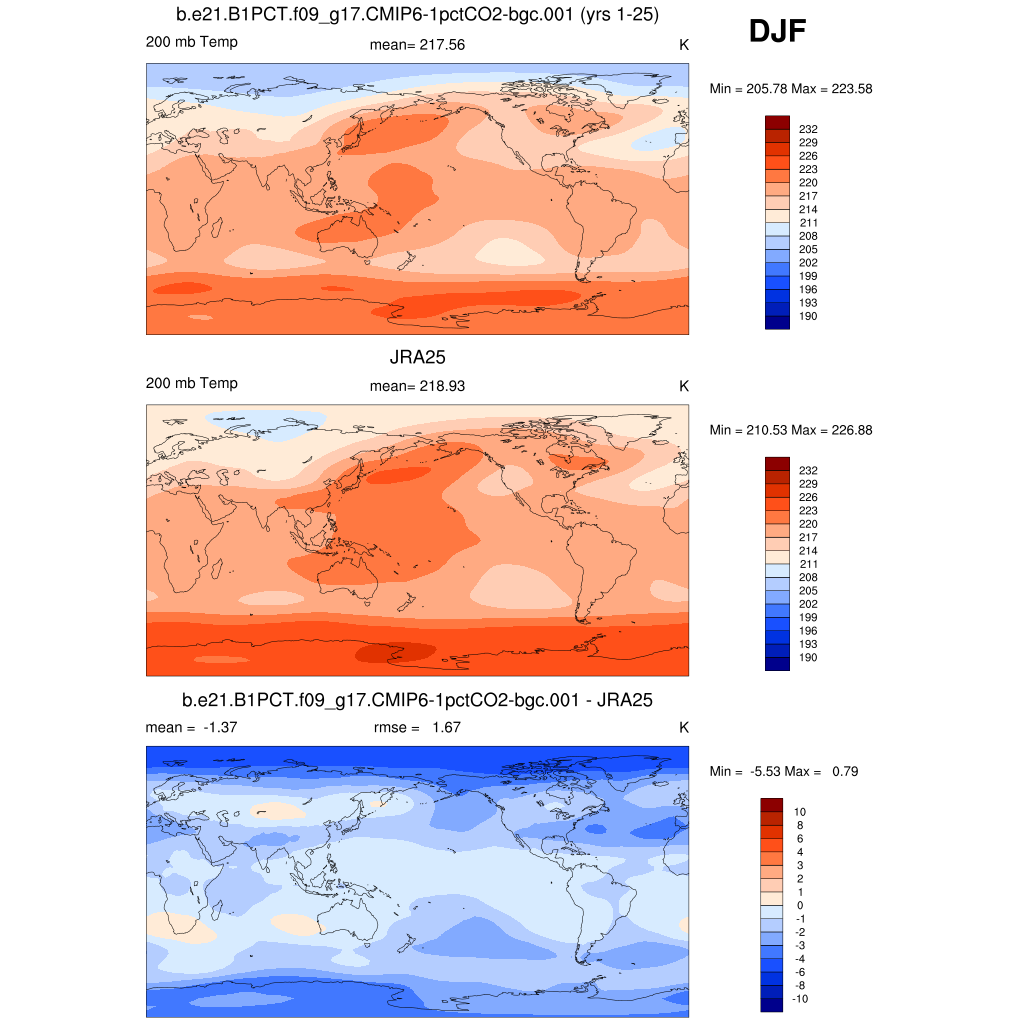
| T 200 | 200 mb temperature | plot | plot | plot |
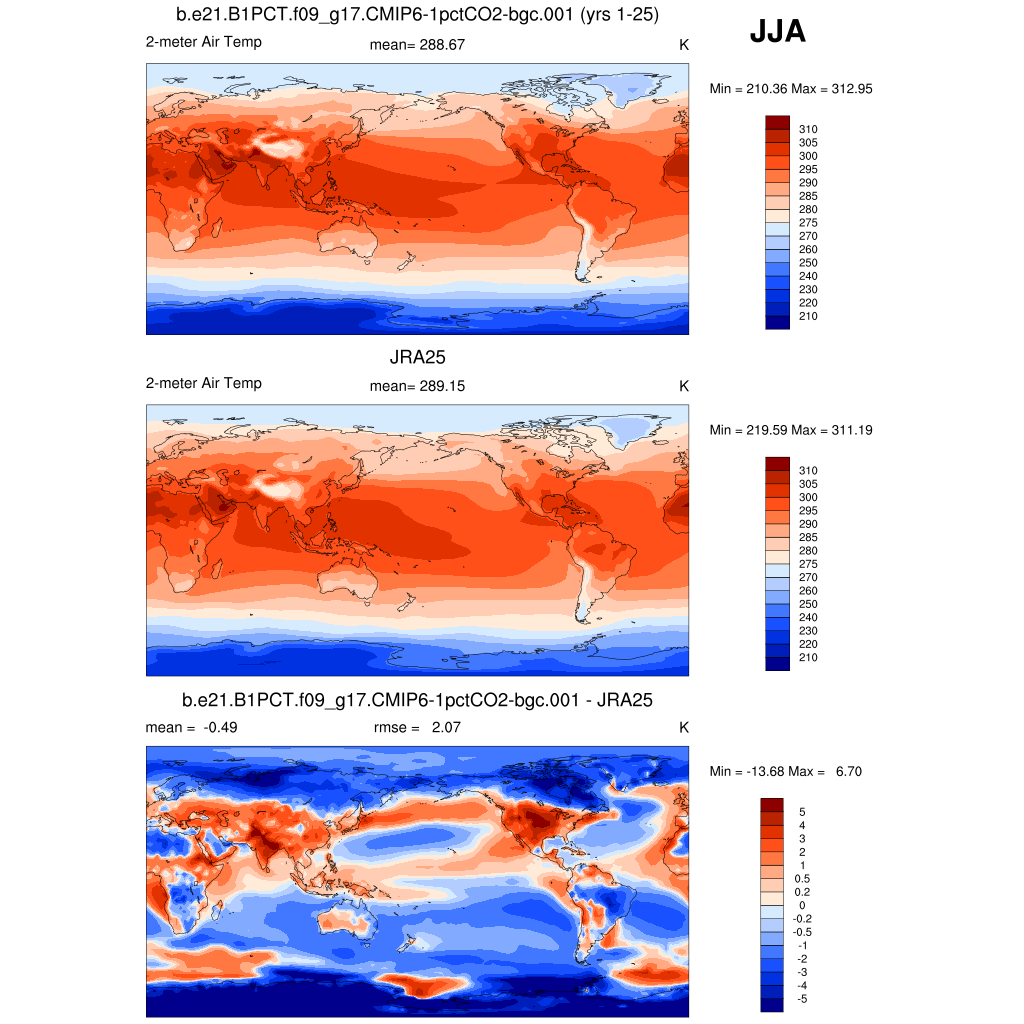
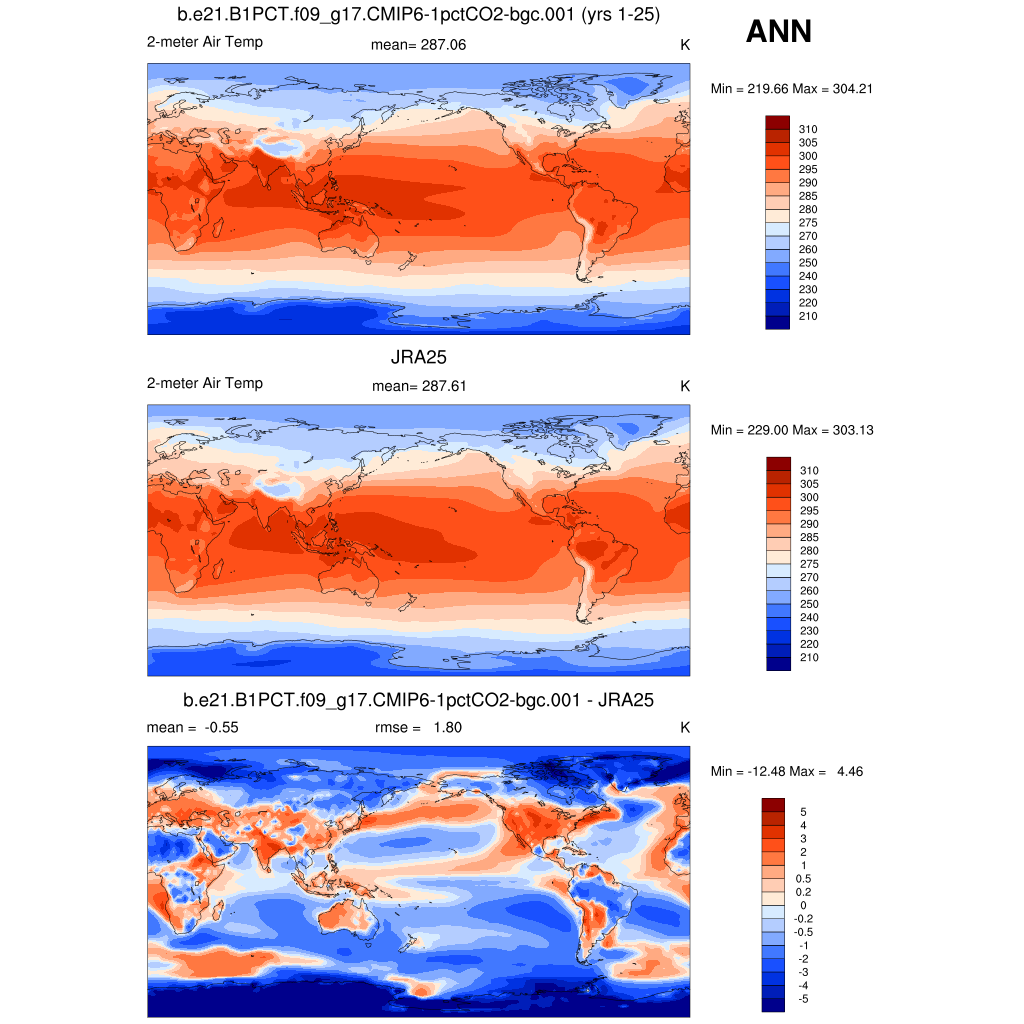
| TREFHT | 2-meter surface air temperature | plot | plot | plot |
| U 200 * | 200 mb zonal wind | plot | plot | plot |
| Z 500 | 500 mb geopotential height | plot | plot | plot |
| Z 300 * | 300 mb geopotential height | plot | plot | plot |
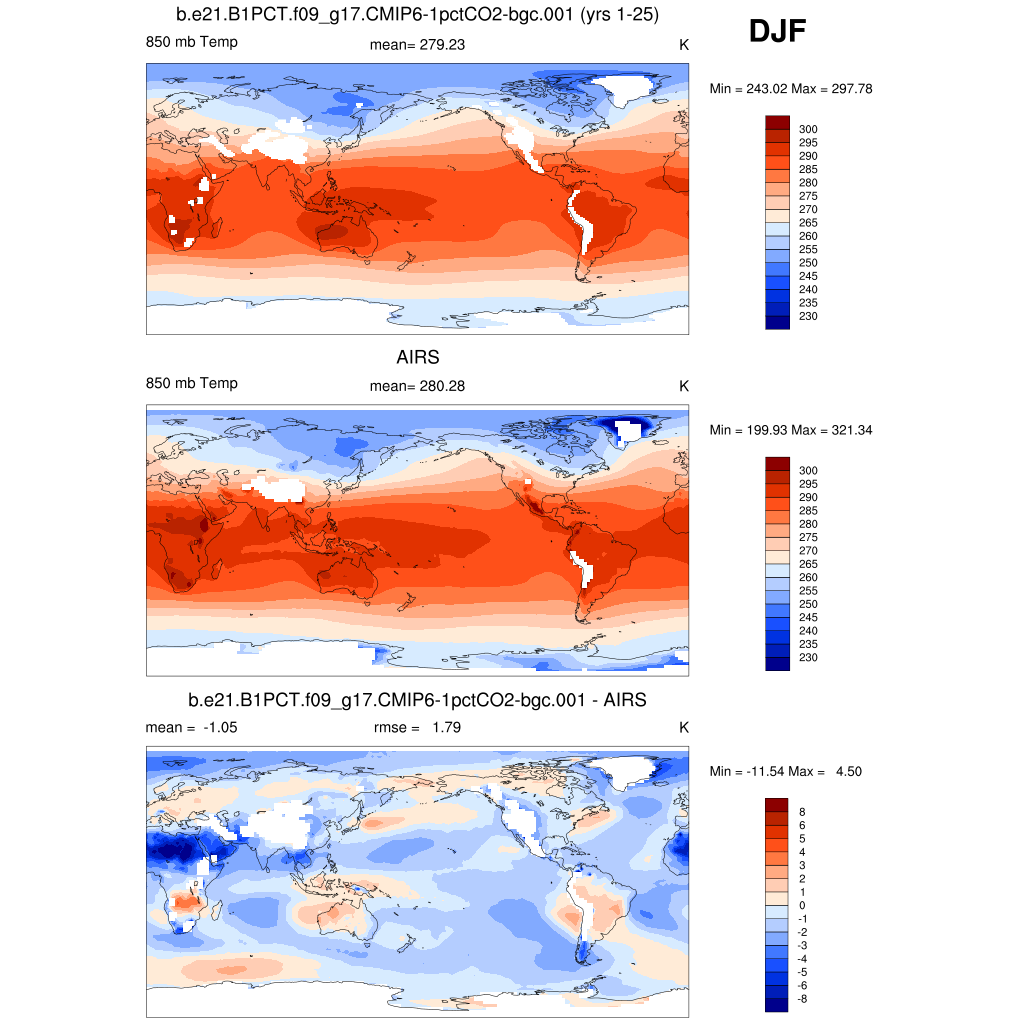
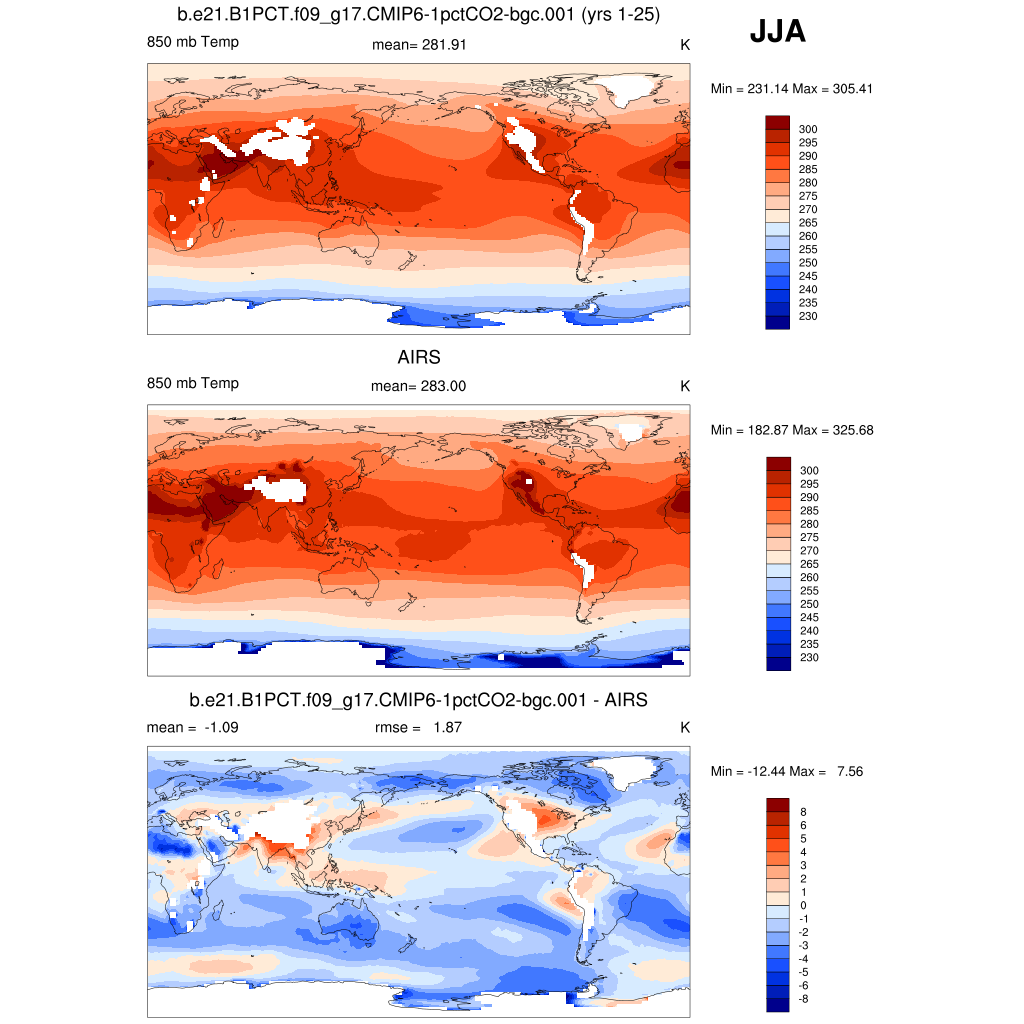
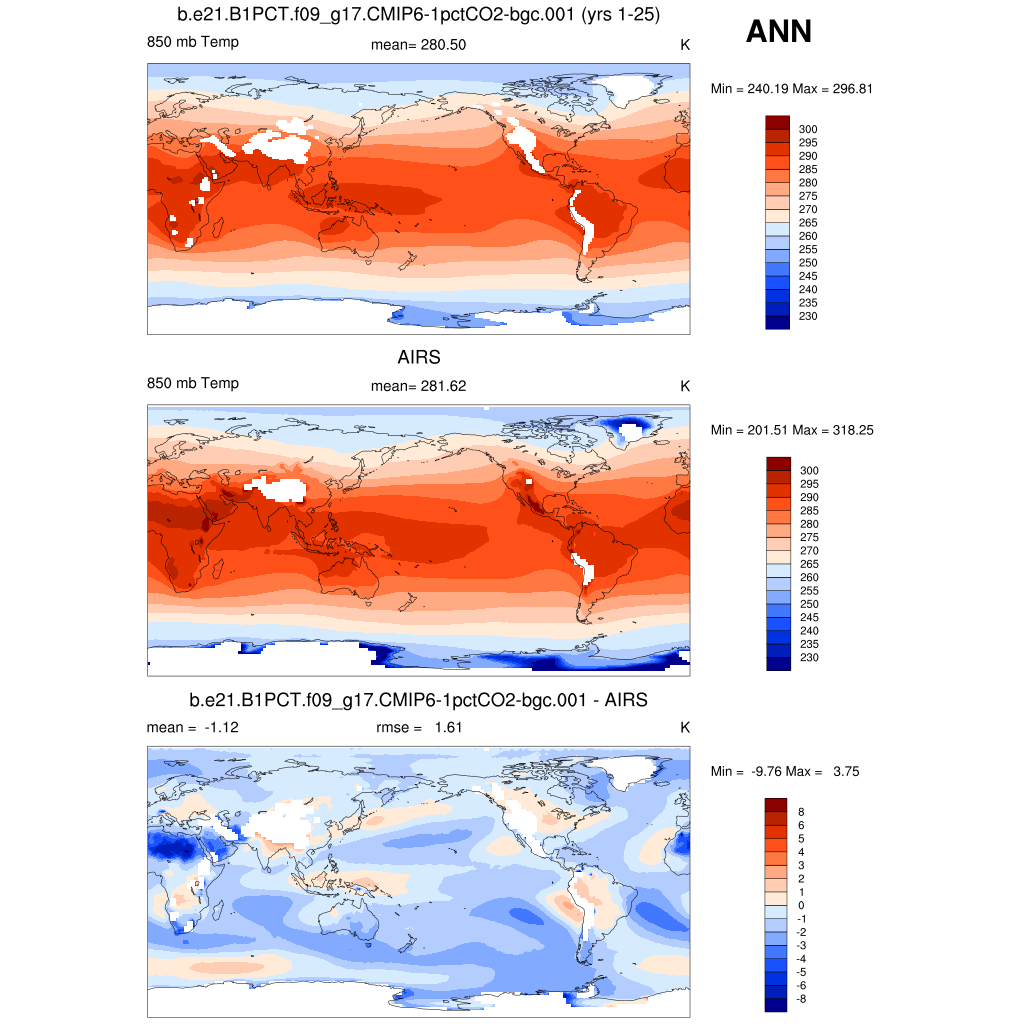
| AIRS IR Sounder 2002-06 | DJF | JJA | ANN | |
| T 850 * | 850 mb temperature | plot | plot | plot |
| T 200 | 200 mb temperature | plot | plot | plot |
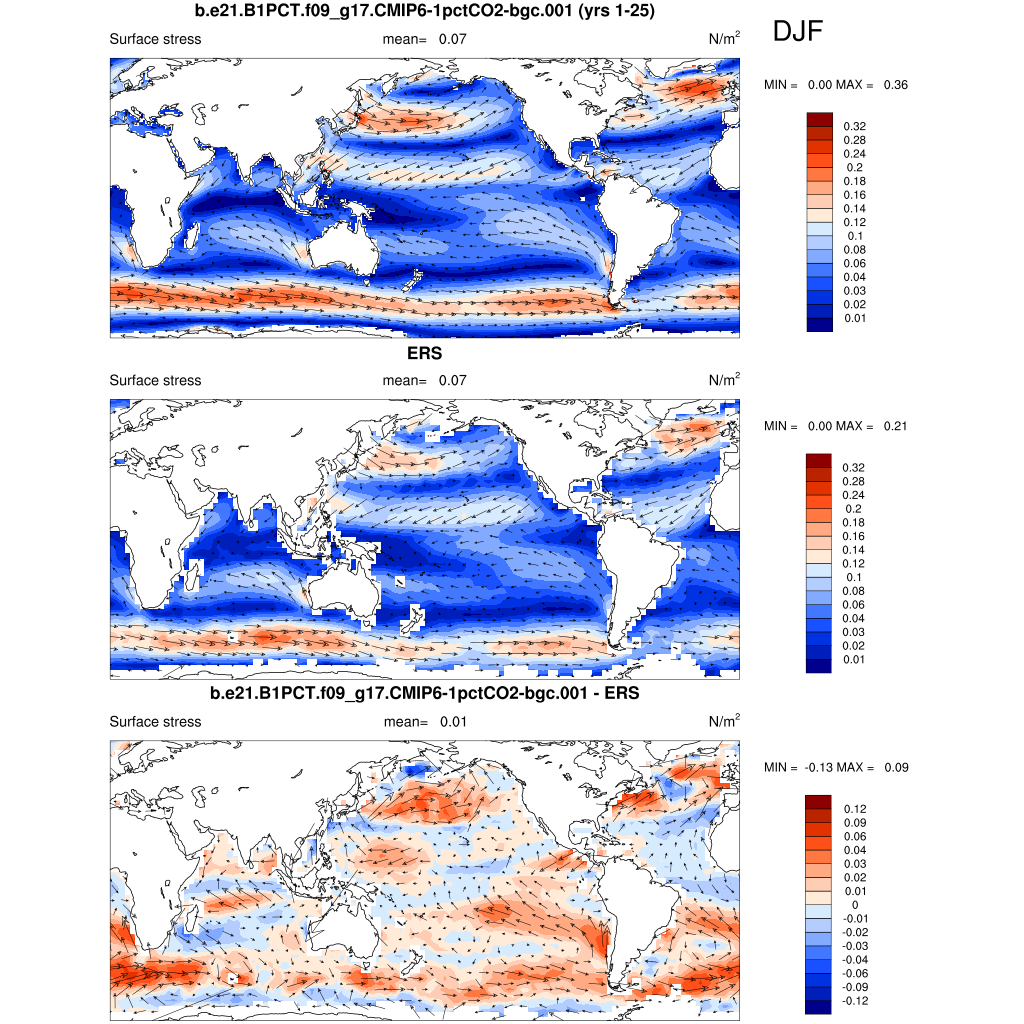
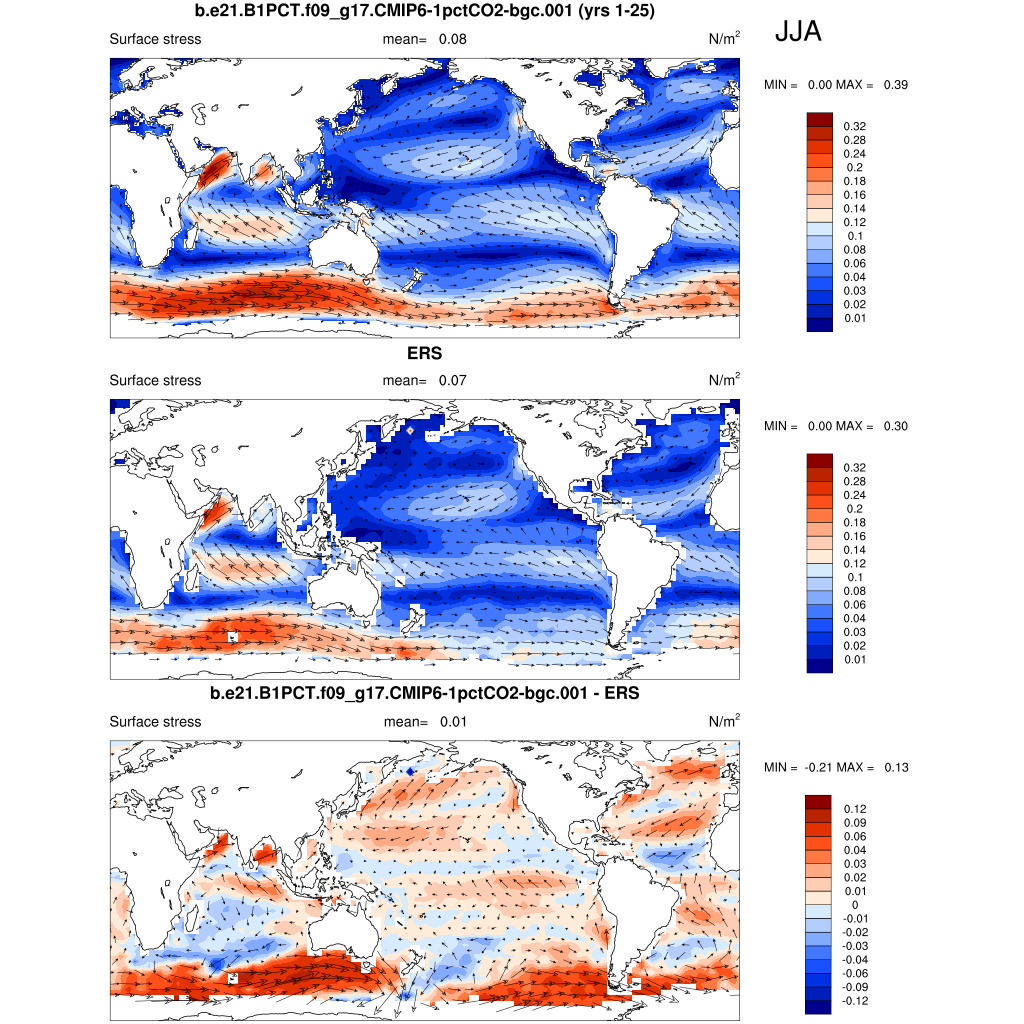
| ERS Scatterometer 1992-2000 | DJF | JJA | ANN | |
| SURF STRESS * | Surface wind stress (ocean) | plot | plot | plot |
| SURF STRESS TROP | Tropical surface wind stress (ocean) | plot | plot | plot |
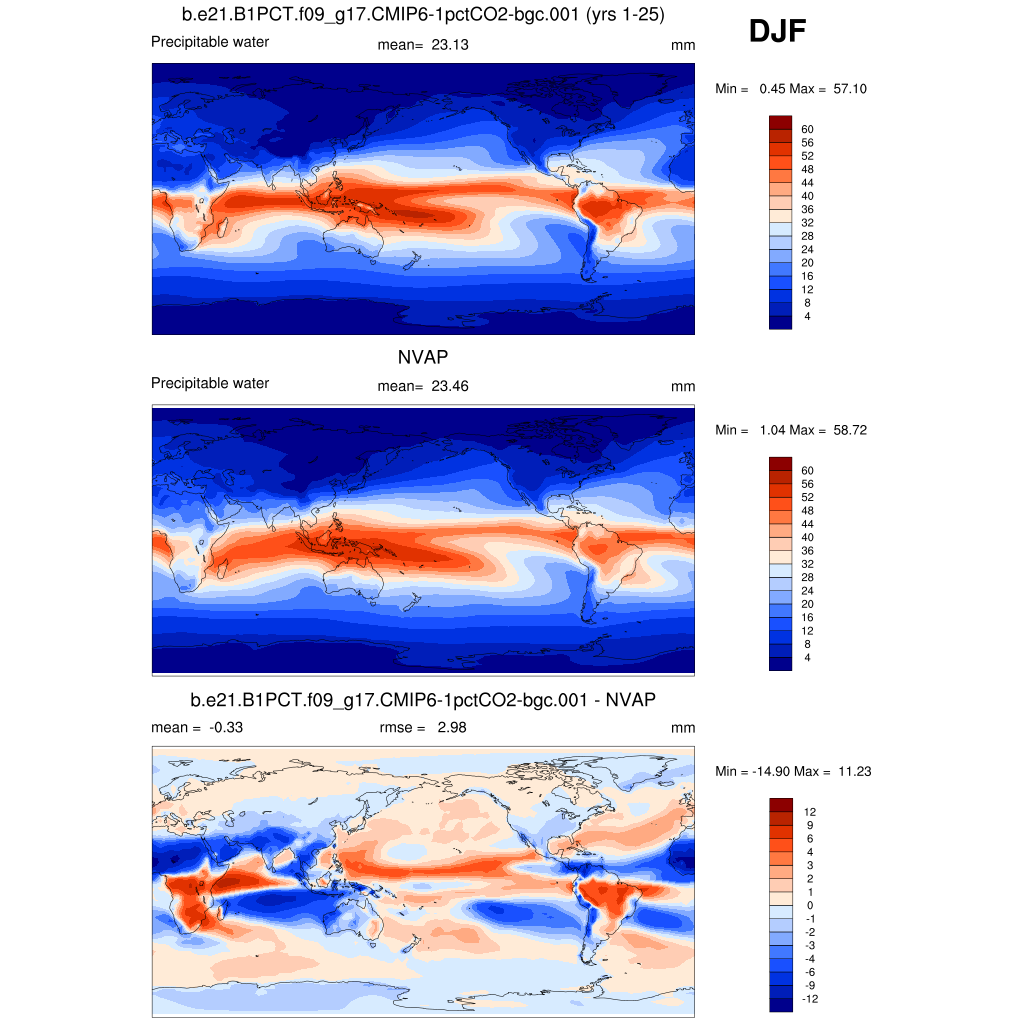
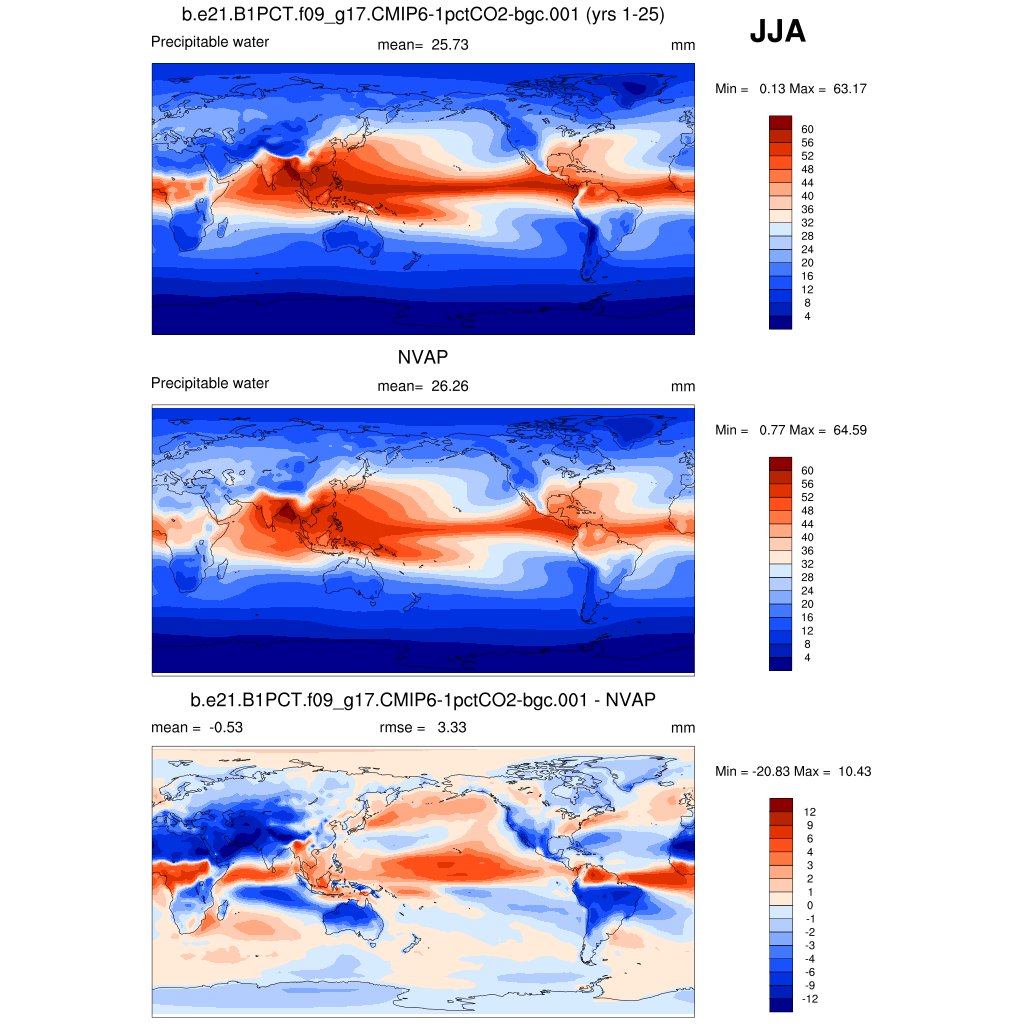
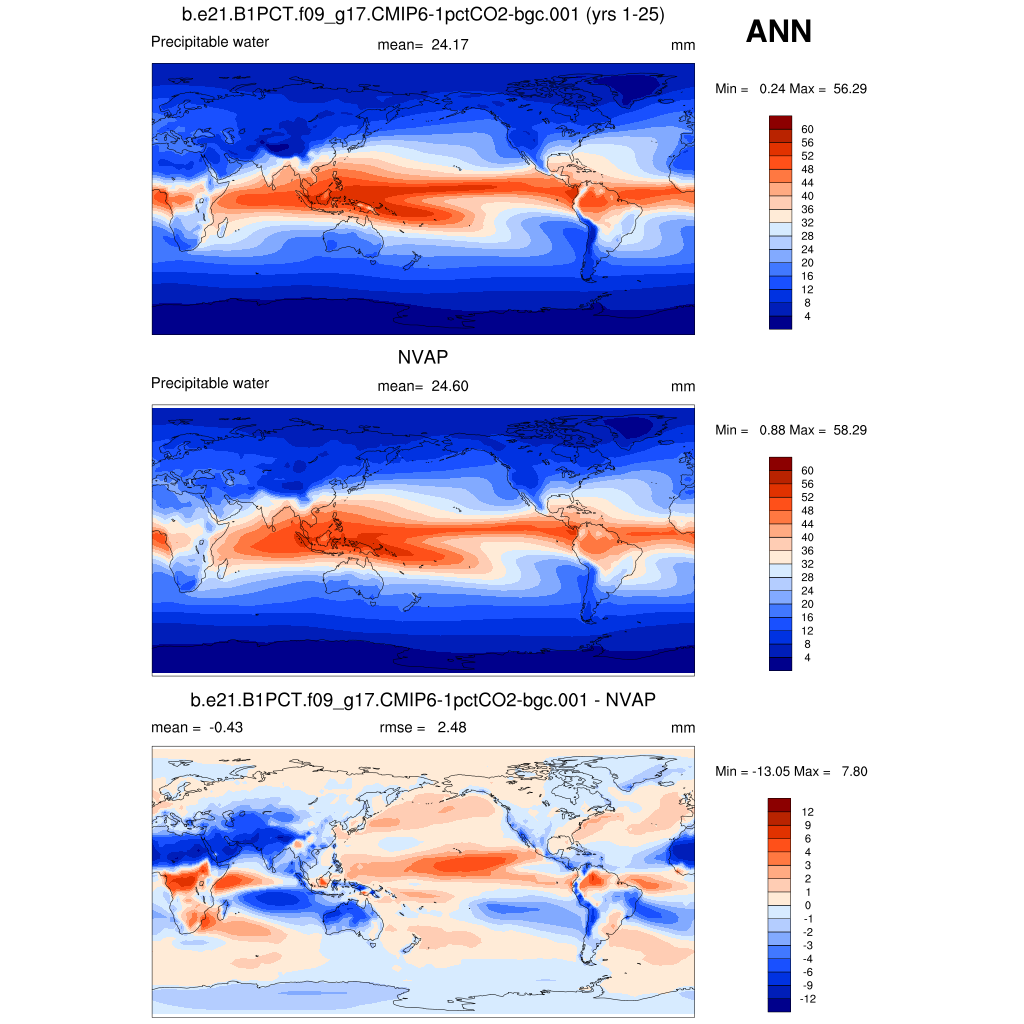
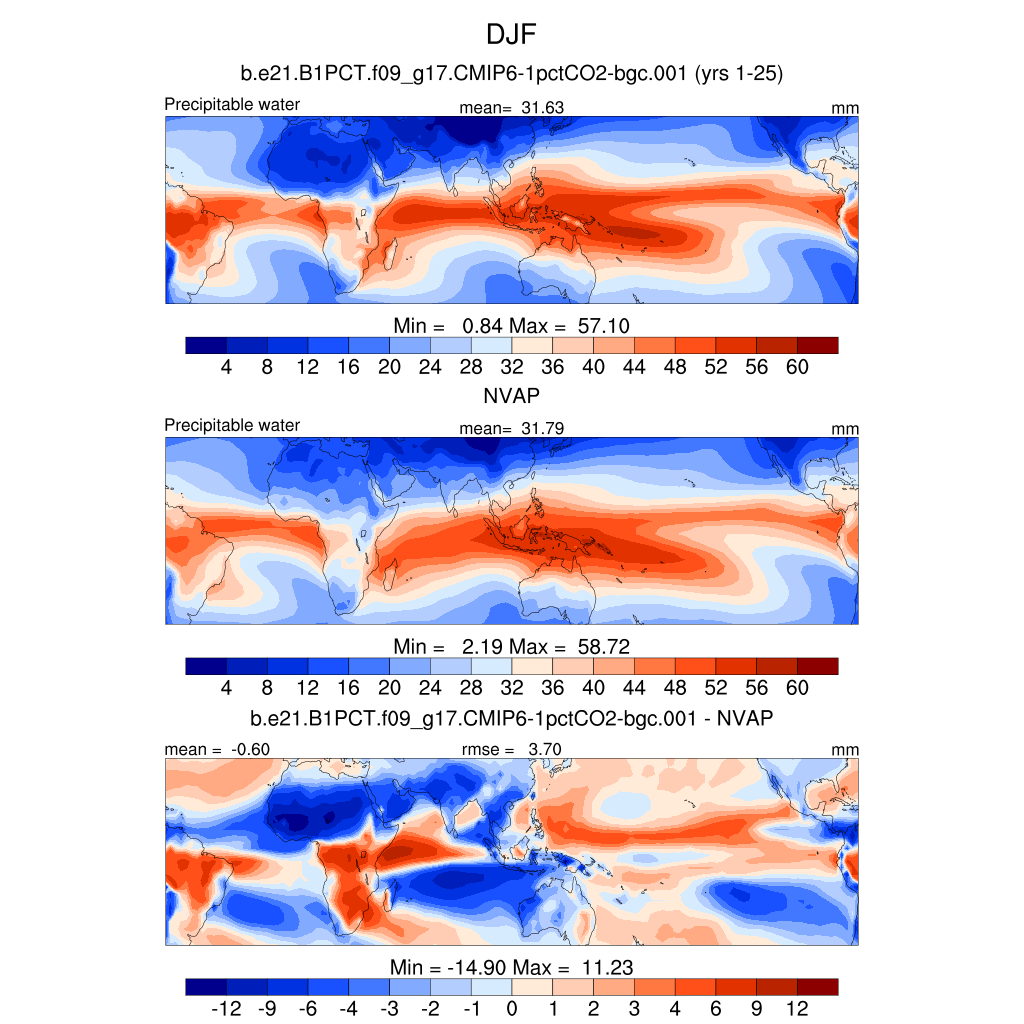
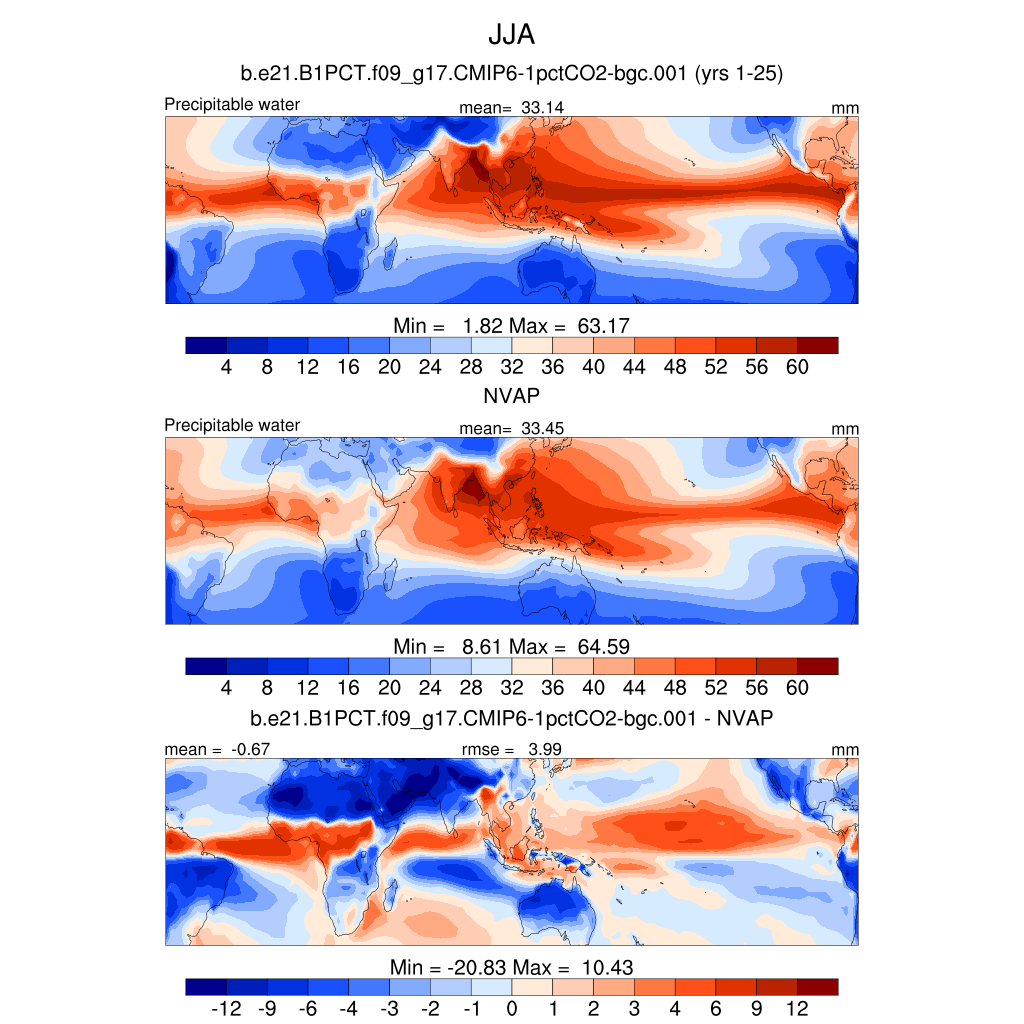
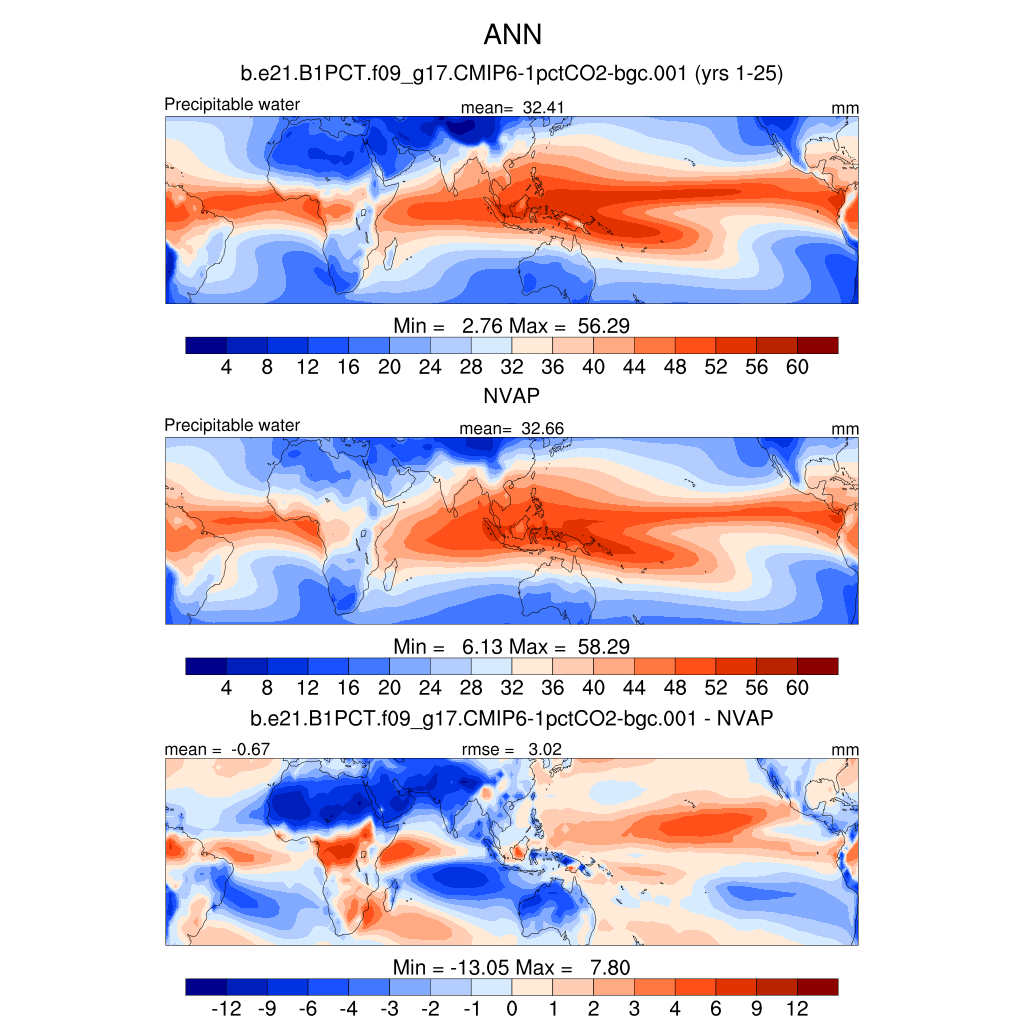
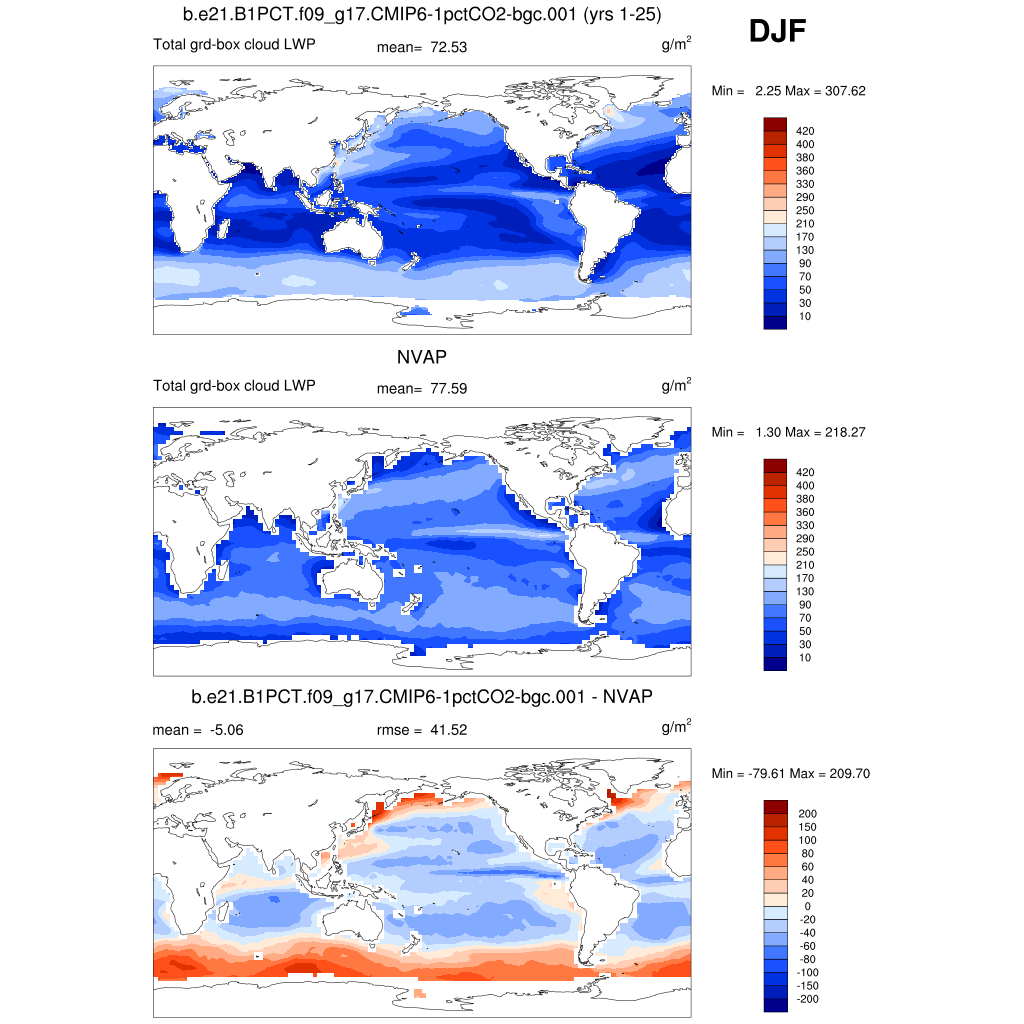
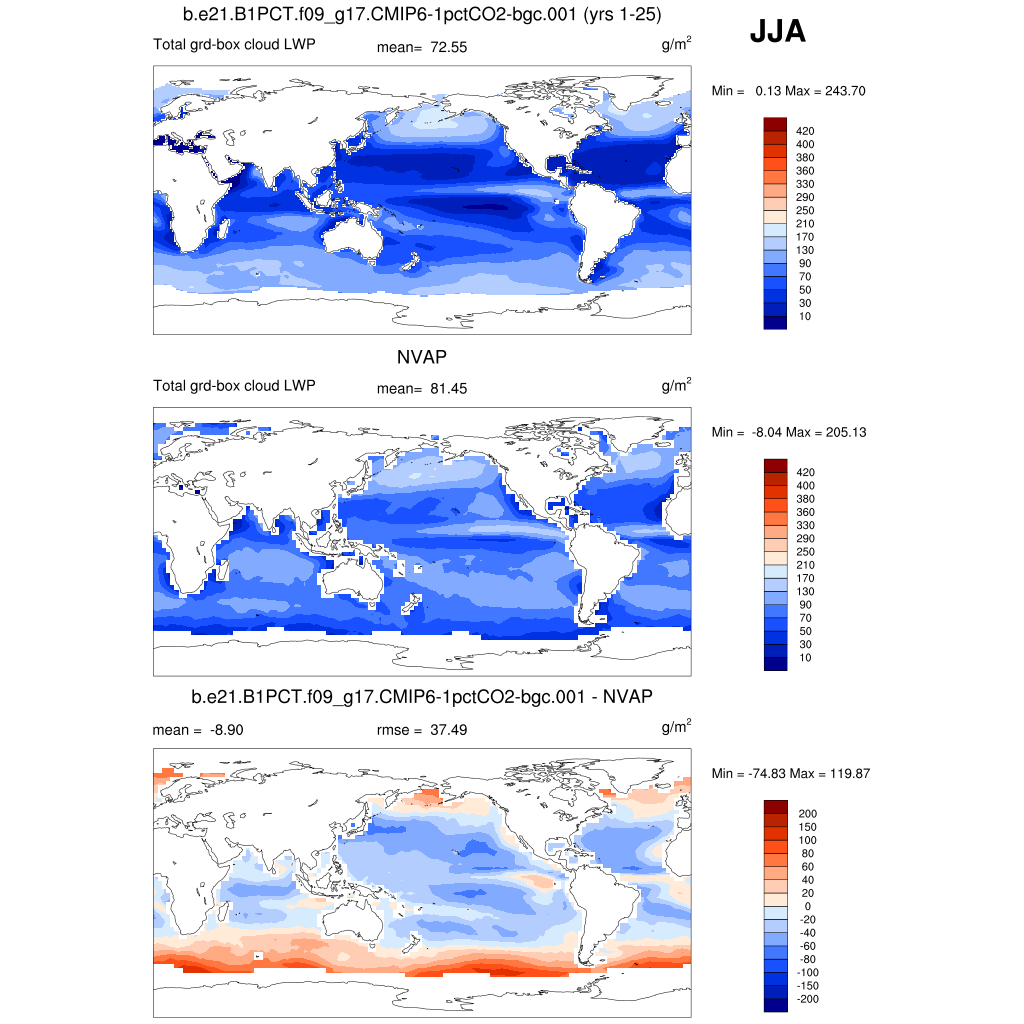
| NVAP 1988-1999 | DJF | JJA | ANN | |
| PREH2O * | Total precipitable water | plot | plot | plot |
| PREH2O TROP | Tropical precipitable water | plot | plot | plot |
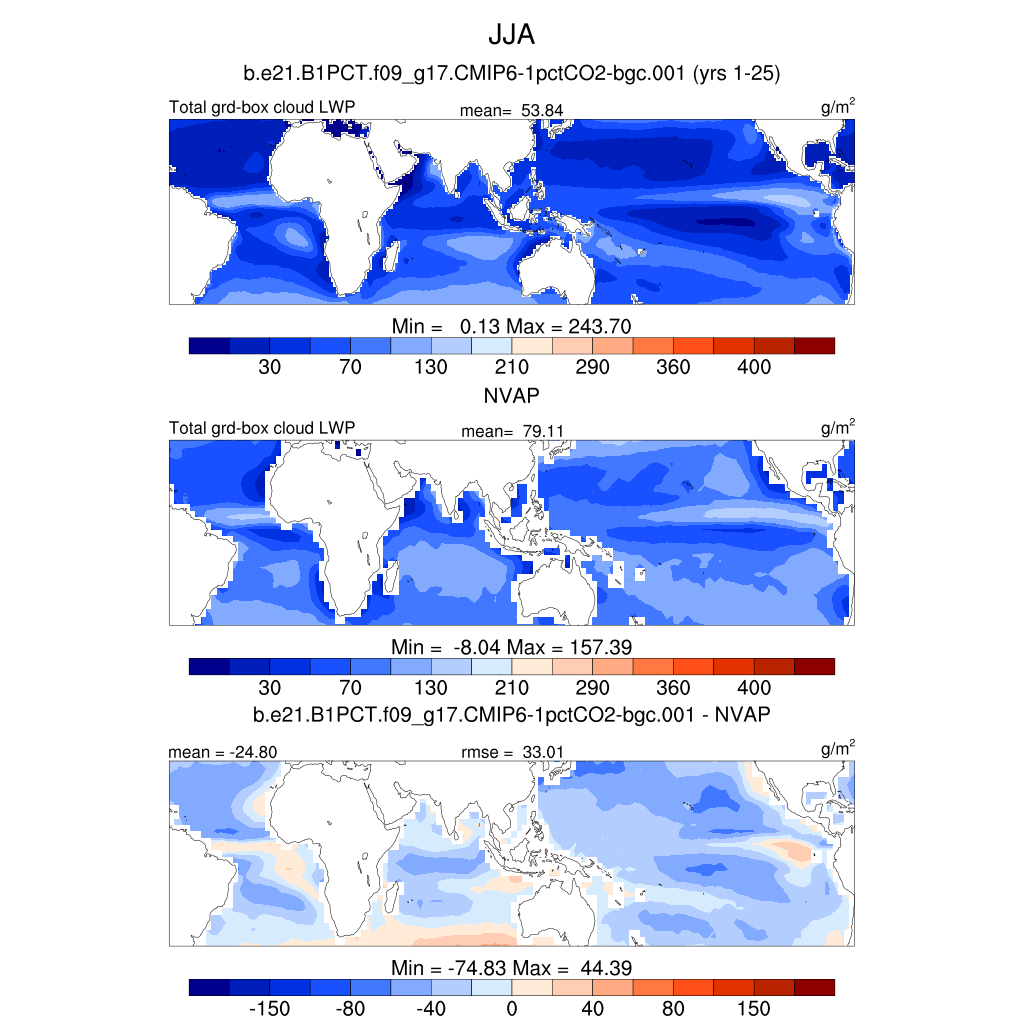
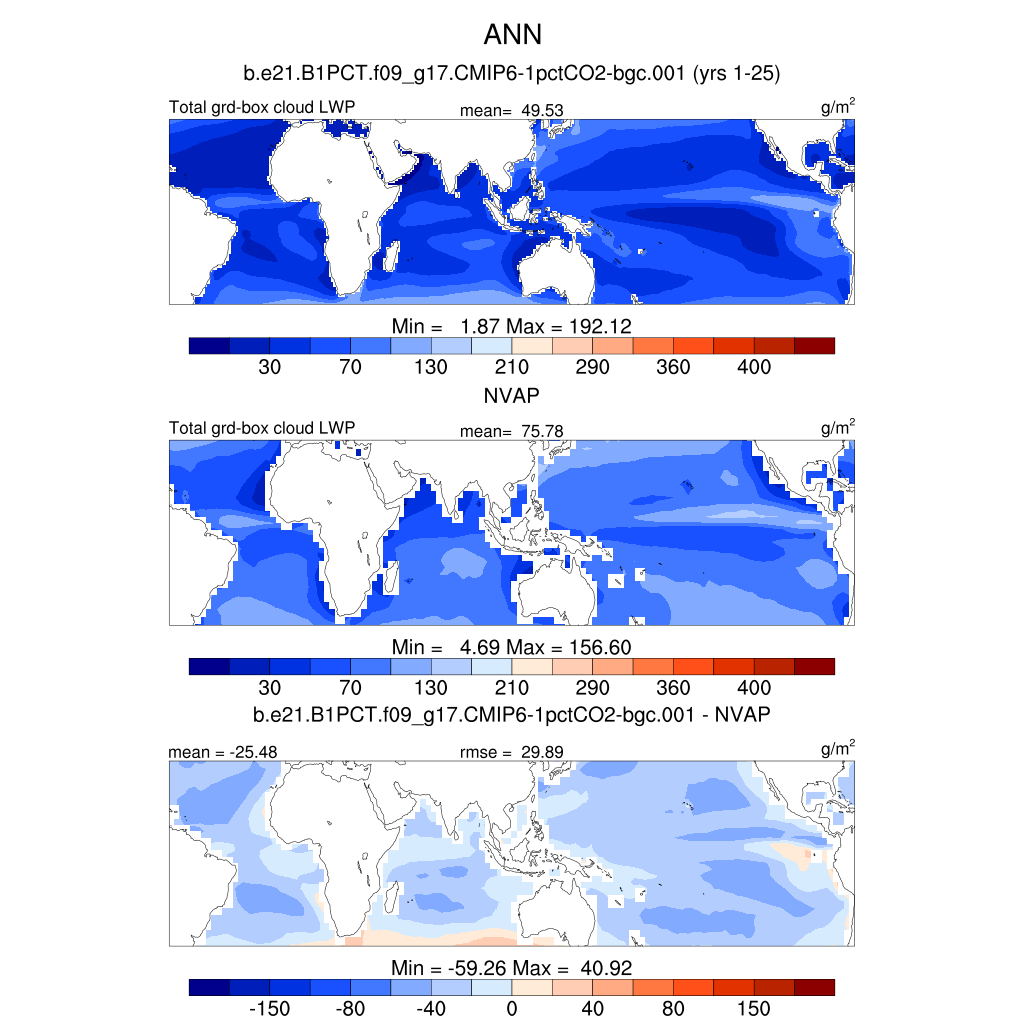
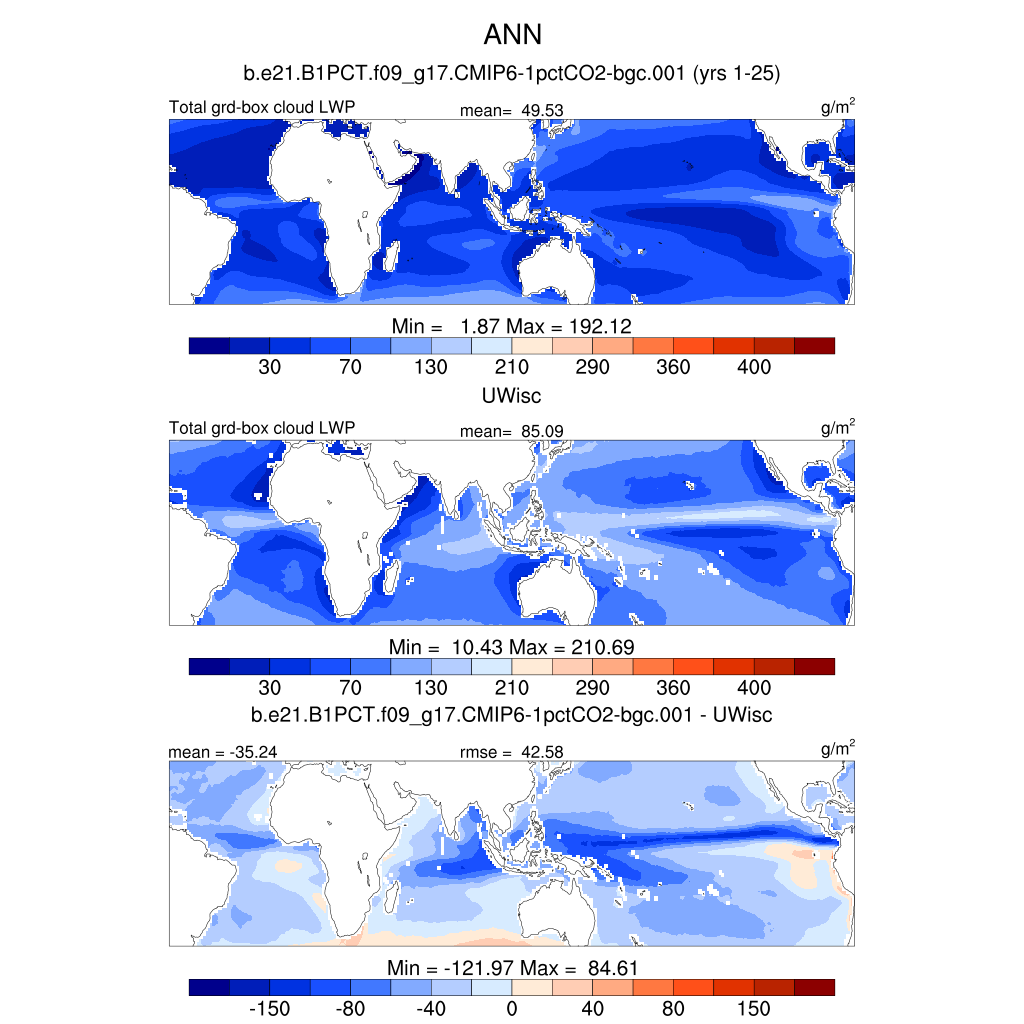
| TGCLDLWP | Cloud liquid water (ocean) | plot | plot | plot |
| TGCLDLWP TROP | Tropical cloud liquid water (ocean) | plot | plot | plot |
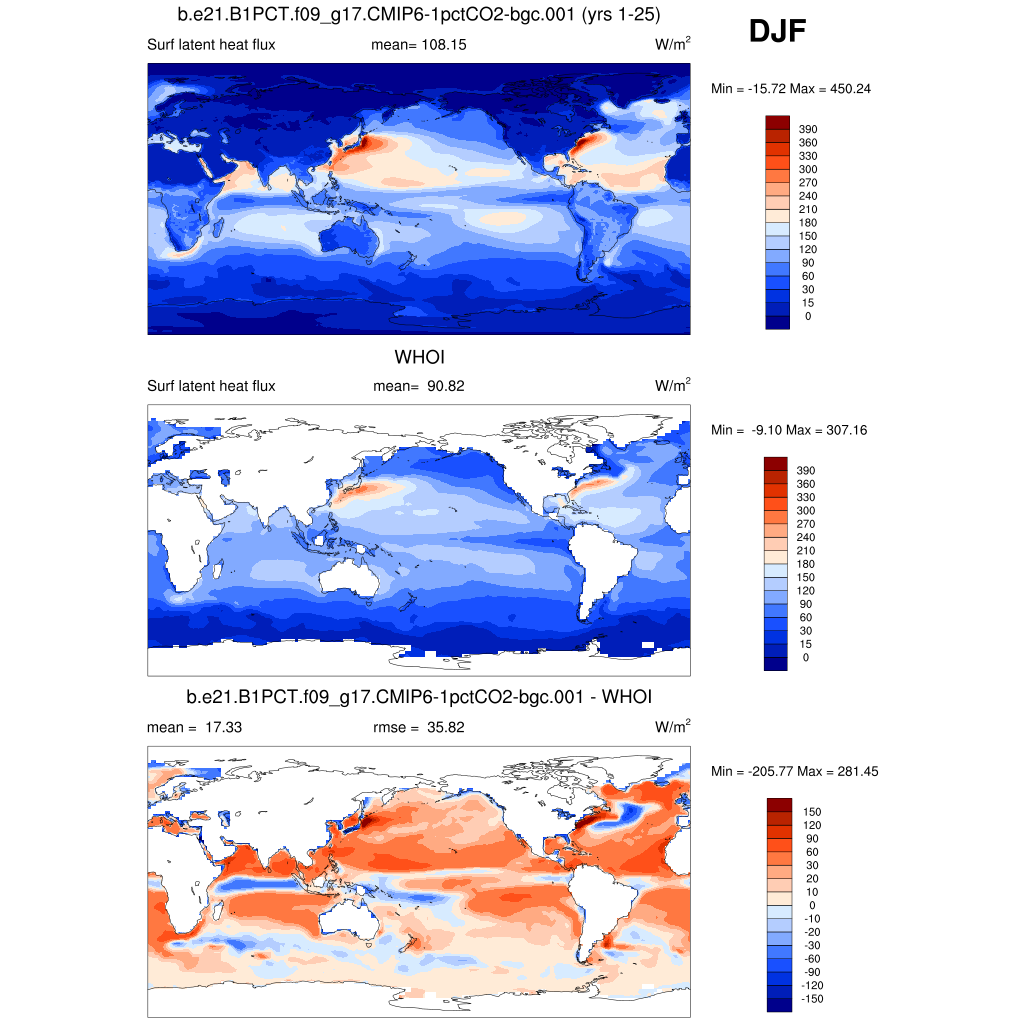
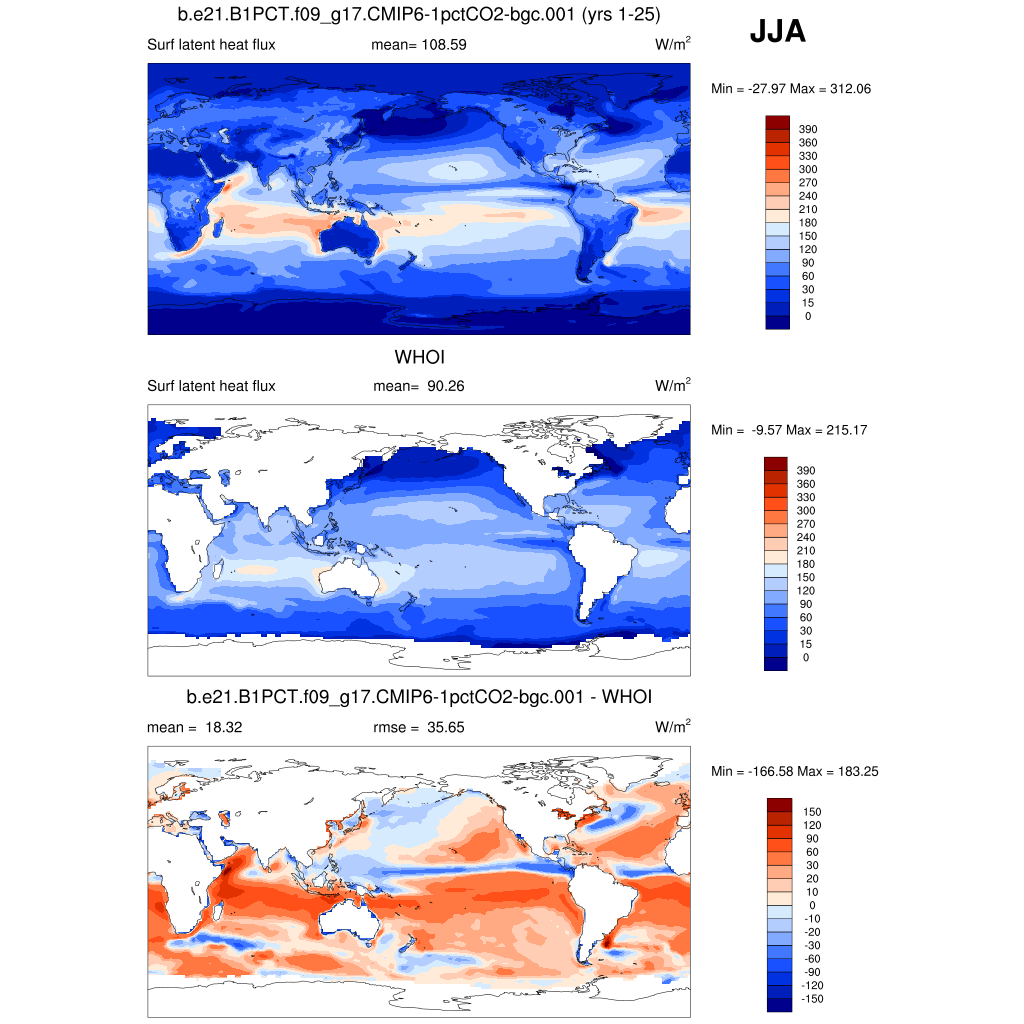
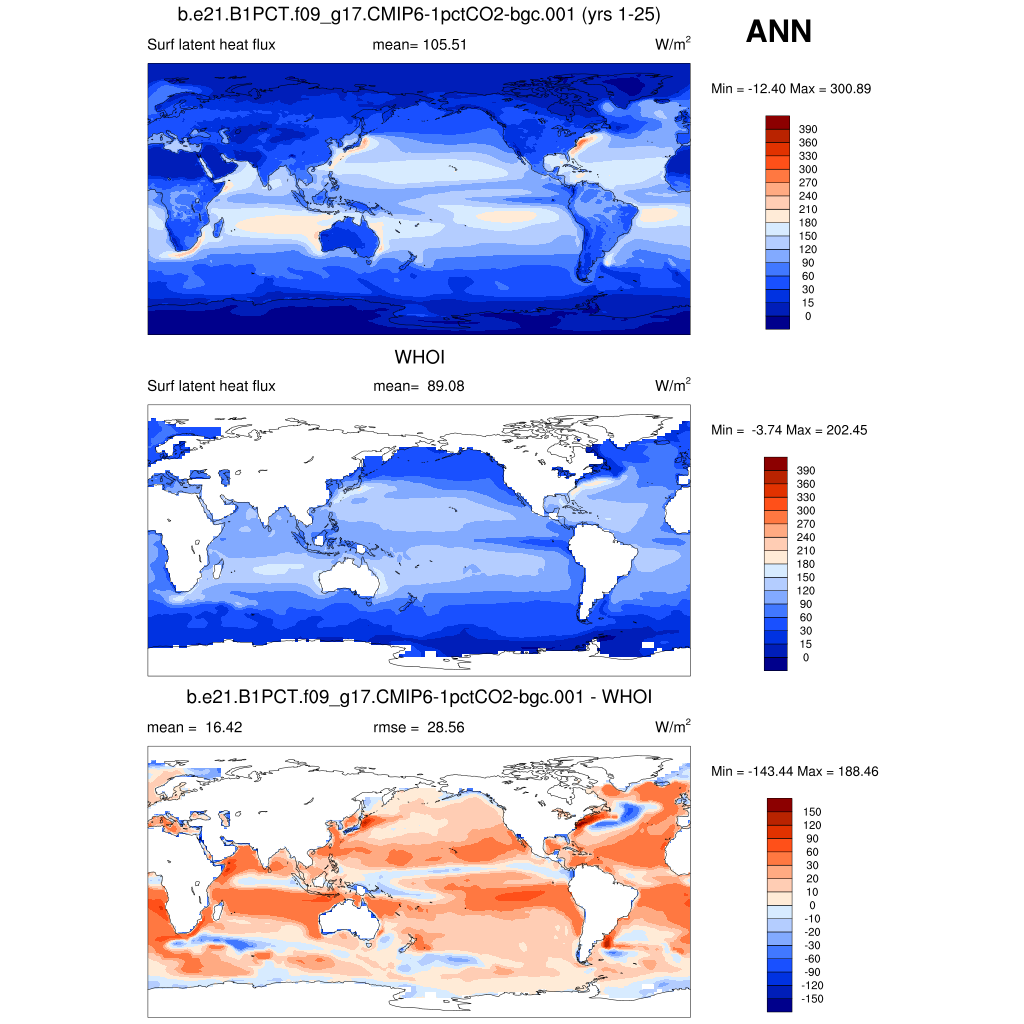
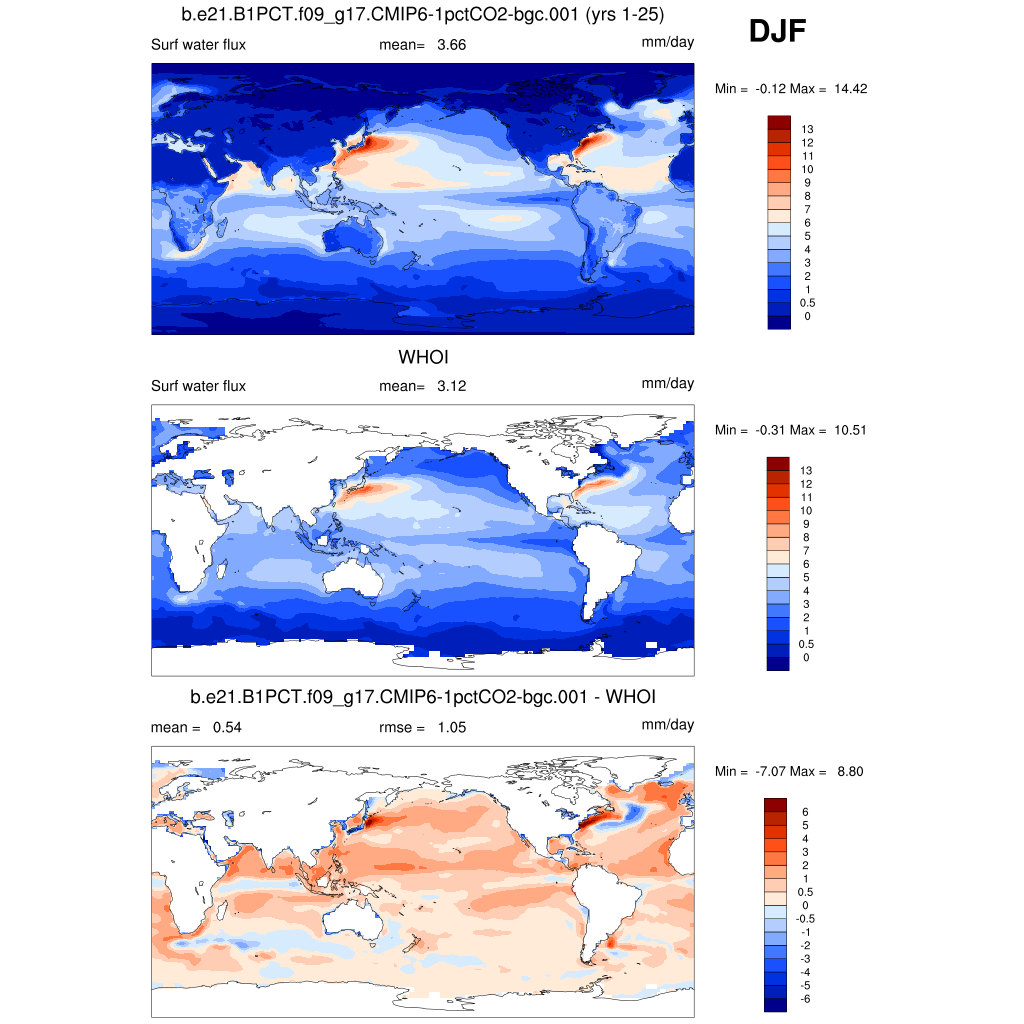
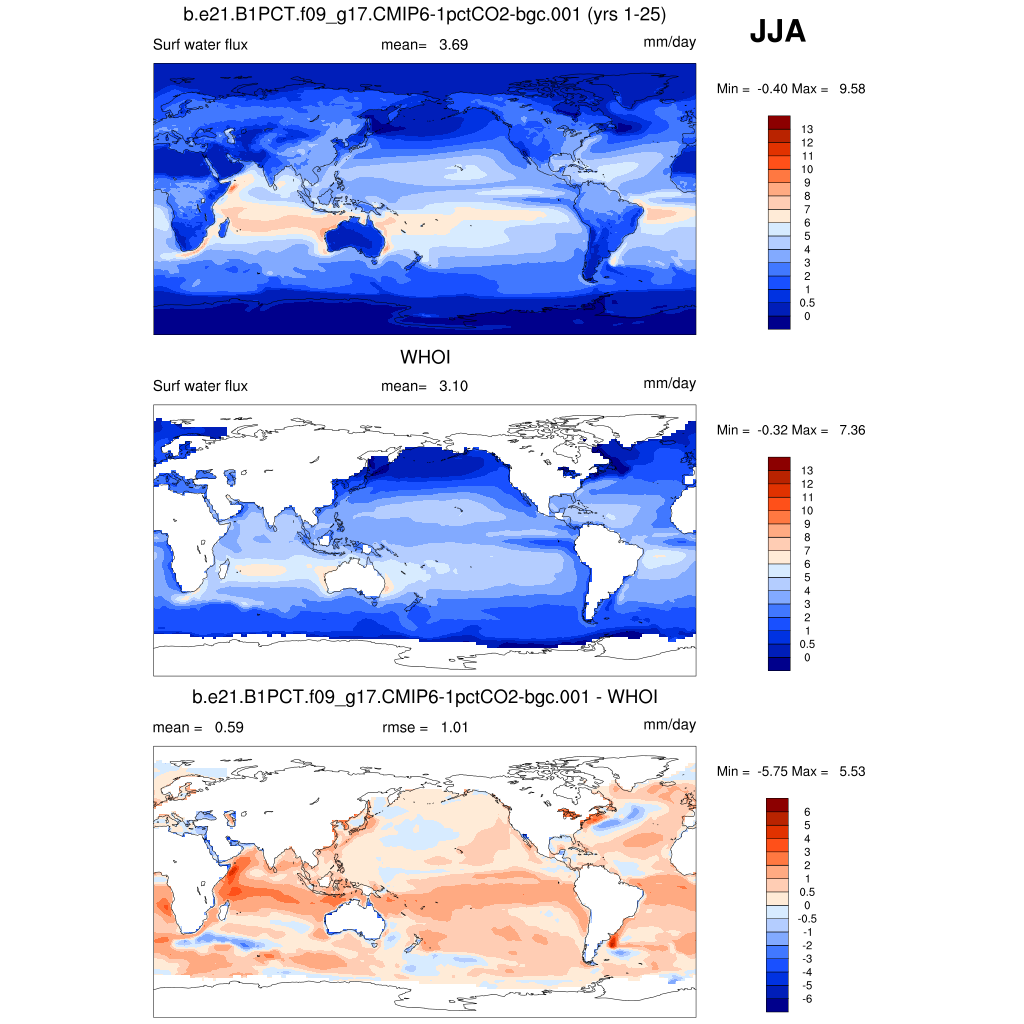
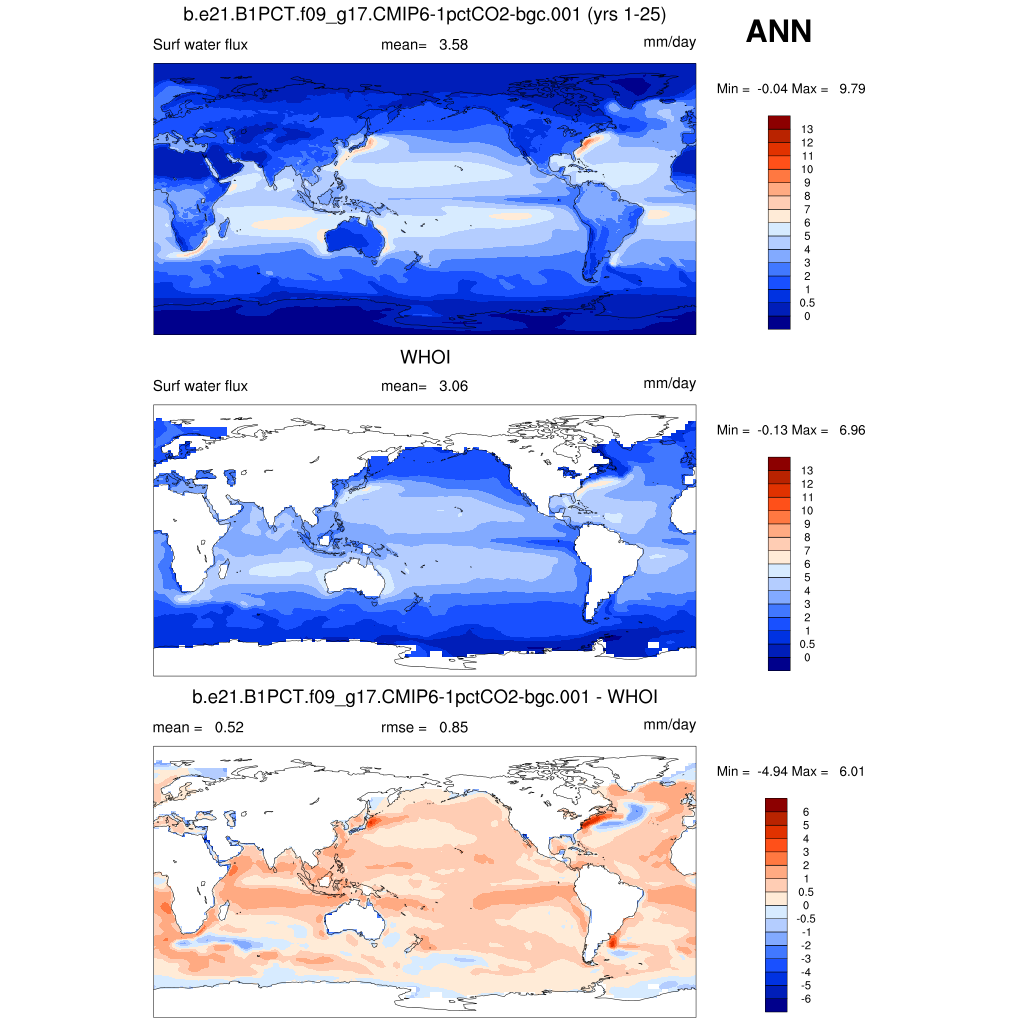
| Woods Hole OAFLUX 1958-2006 | DJF | JJA | ANN | |
| LHFLX | Latent Heat Flux | plot | plot | plot |
| QFLX | Surface Water Flux | plot | plot | plot |
| GPCP 1979-2009 | DJF | JJA | ANN | |
| PRECT * | Precipitation rate | plot | plot | plot |
| PRECT TROP | Tropical precipitation rate | plot | plot | plot |
| CMAP 1979-1998 | DJF | JJA | ANN | |
| PRECT * | Precipitation rate | plot | plot | plot |
| PRECT TROP | Tropical precipitation rate | plot | plot | plot |
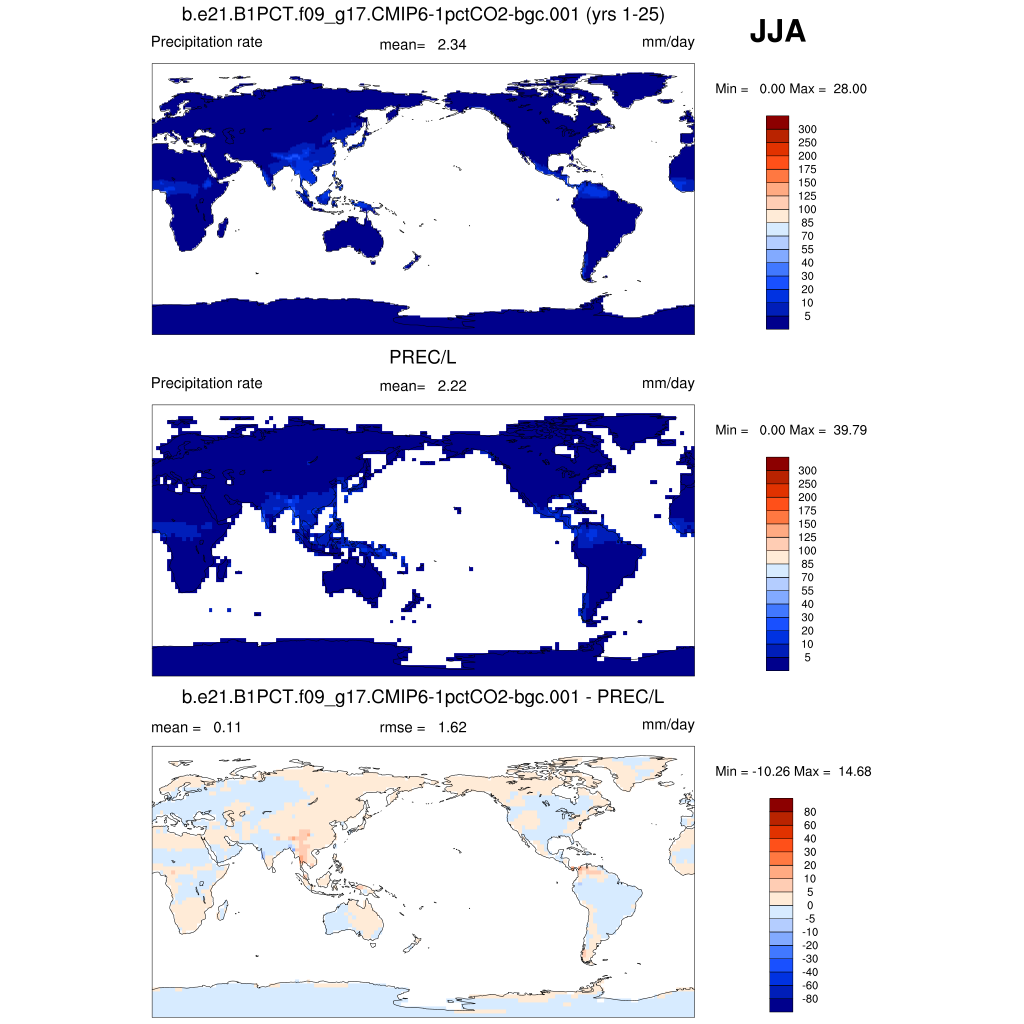
| PREC/L (CMAP) 1948-2001 | DJF | JJA | ANN | |
| PRECT_LAND | Precipitation rate (land) | plot | plot | plot |
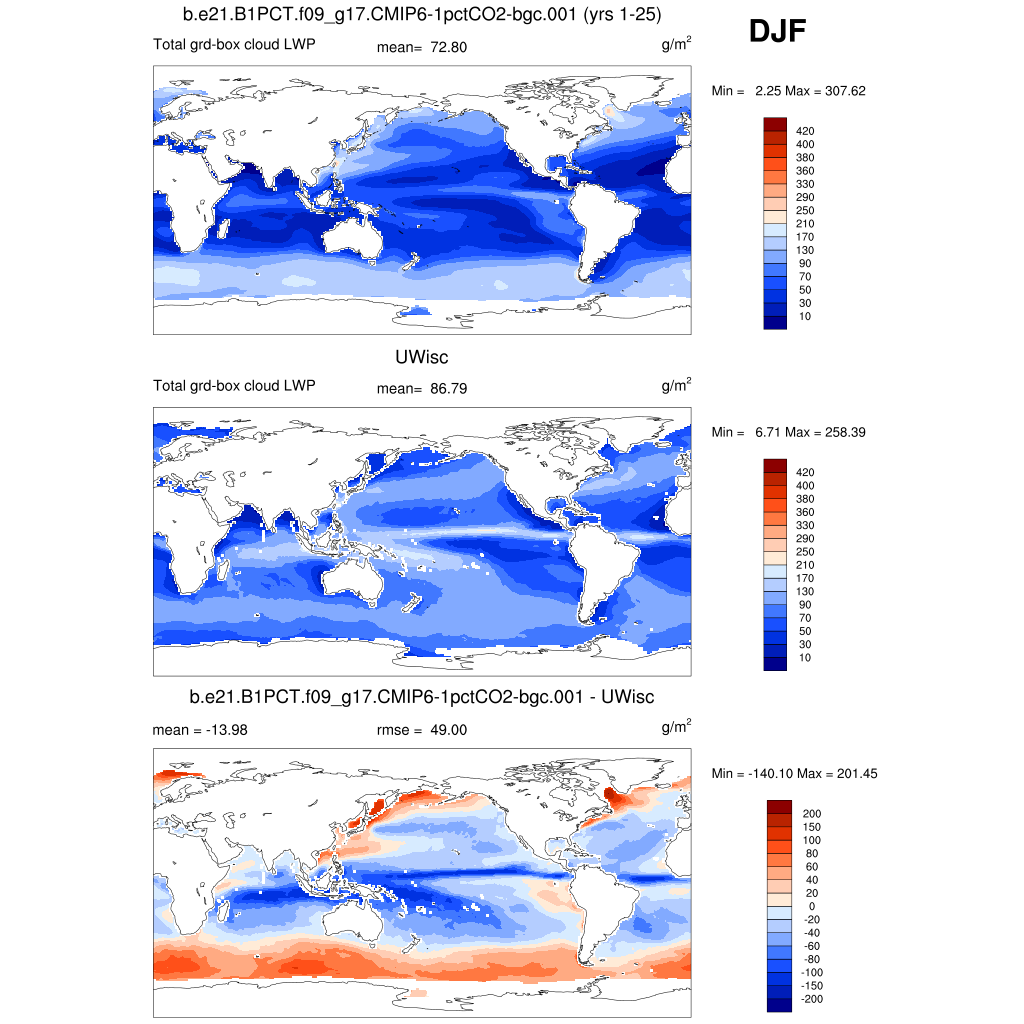
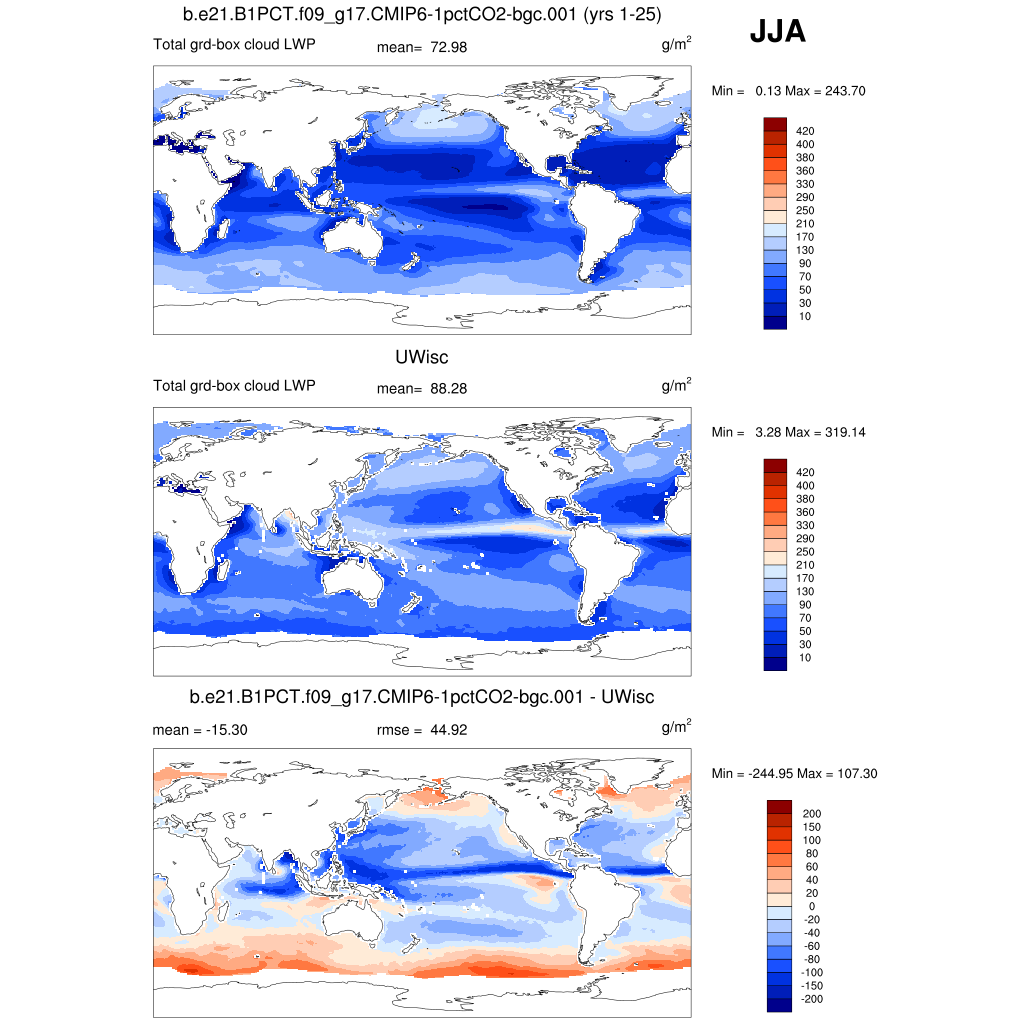
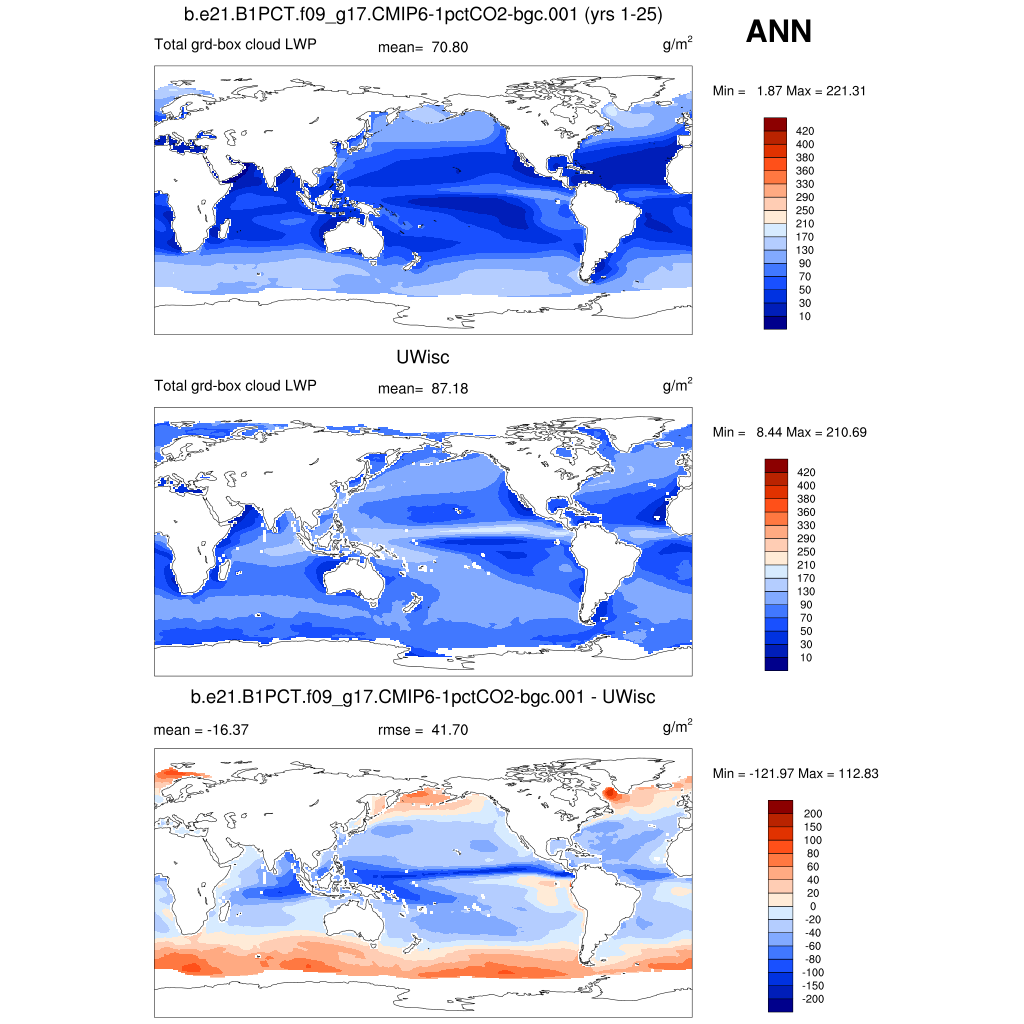
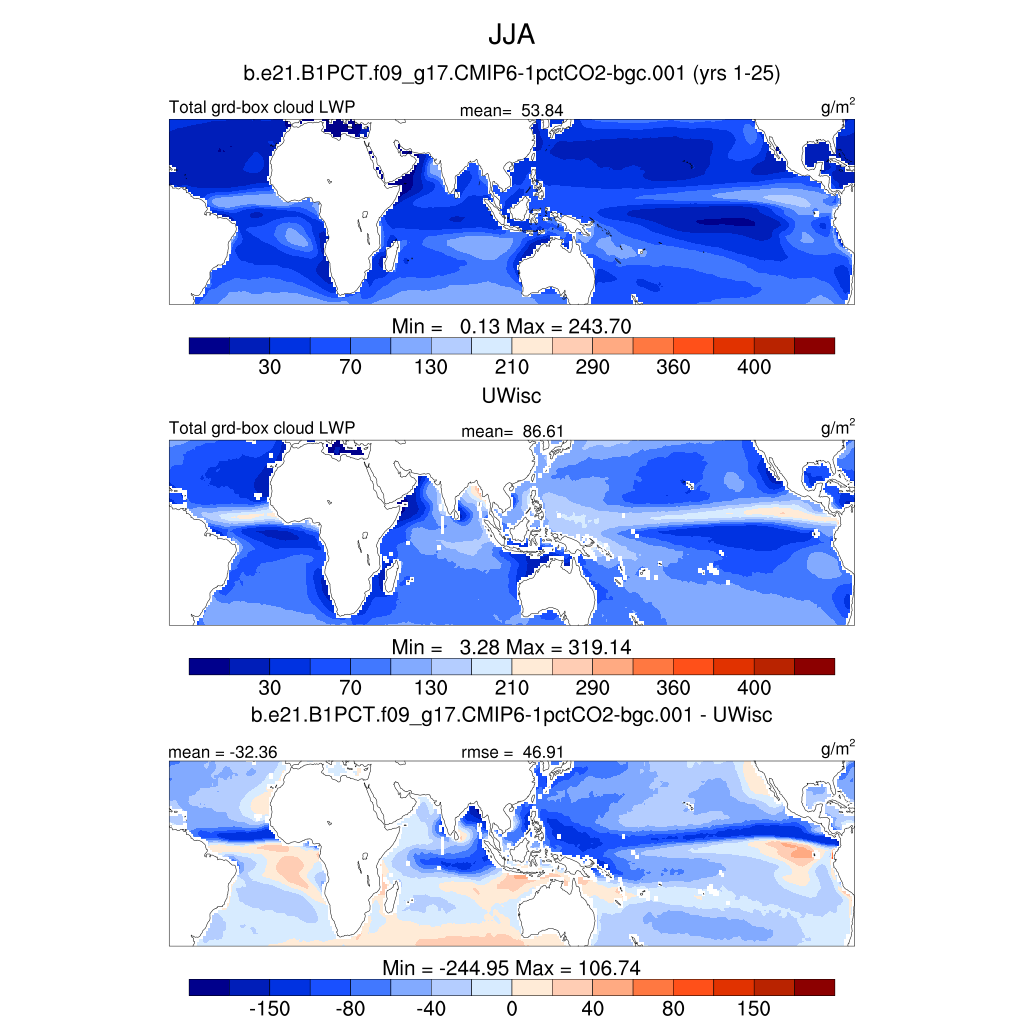
| UWisc 1988-2008 | DJF | JJA | ANN | |
| TGCLDLWP | Cloud liquid water (ocean) | plot | plot | plot |
| TGCLDLWP TROP | Tropical cloud liquid water (ocean) | plot | plot | plot |
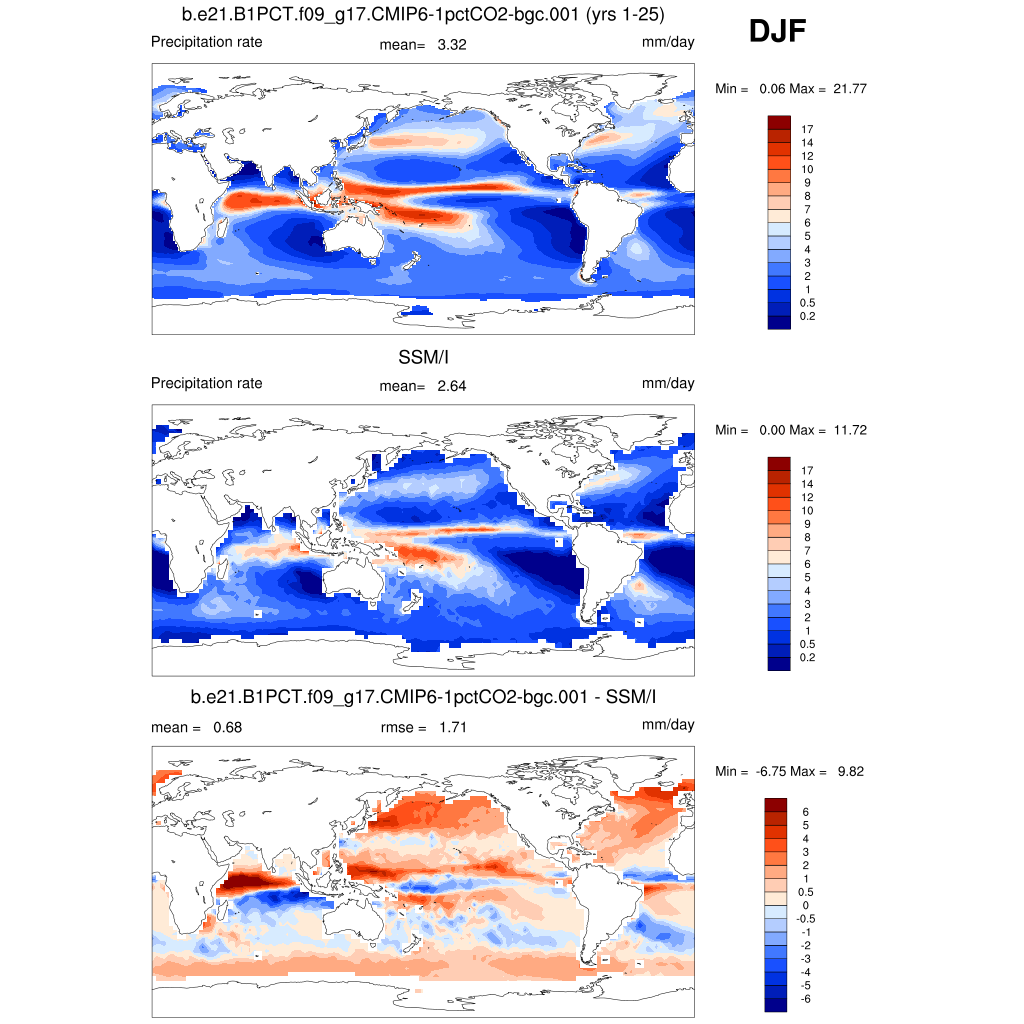
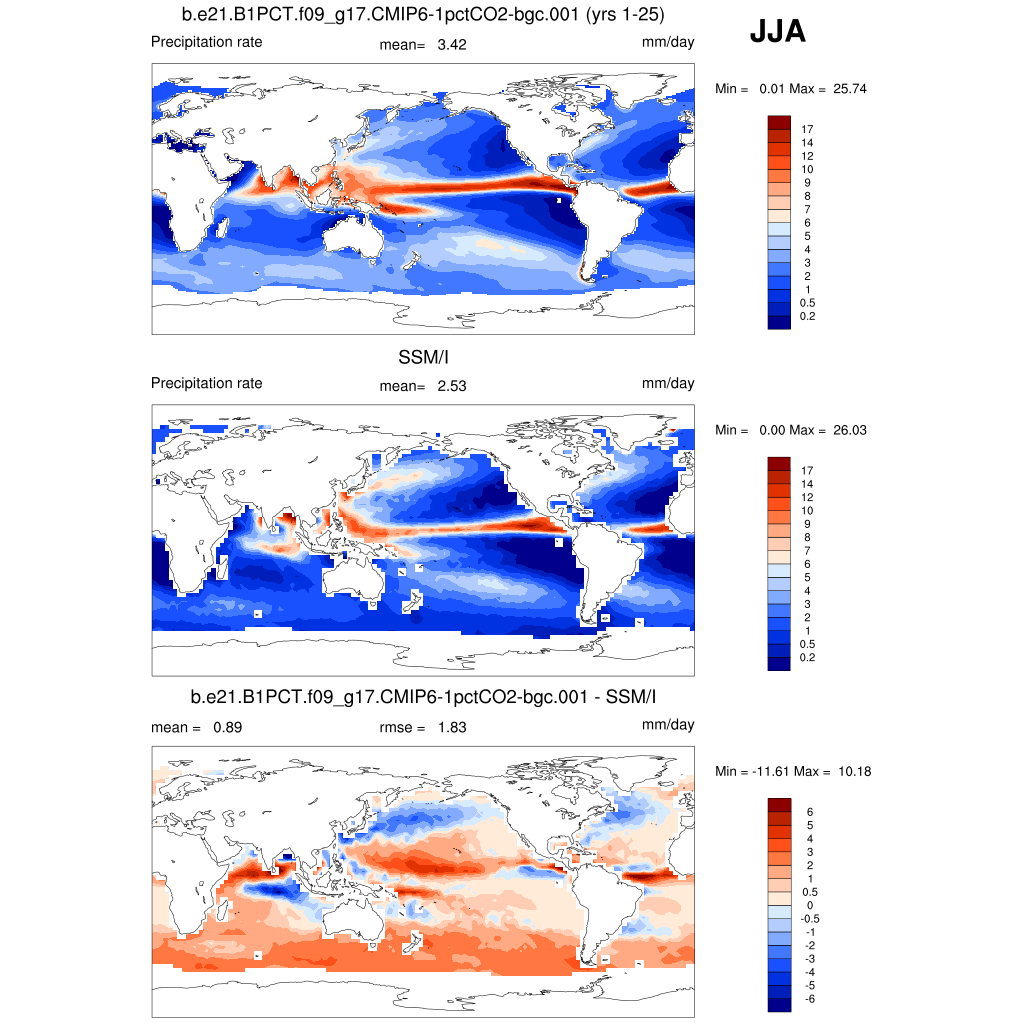
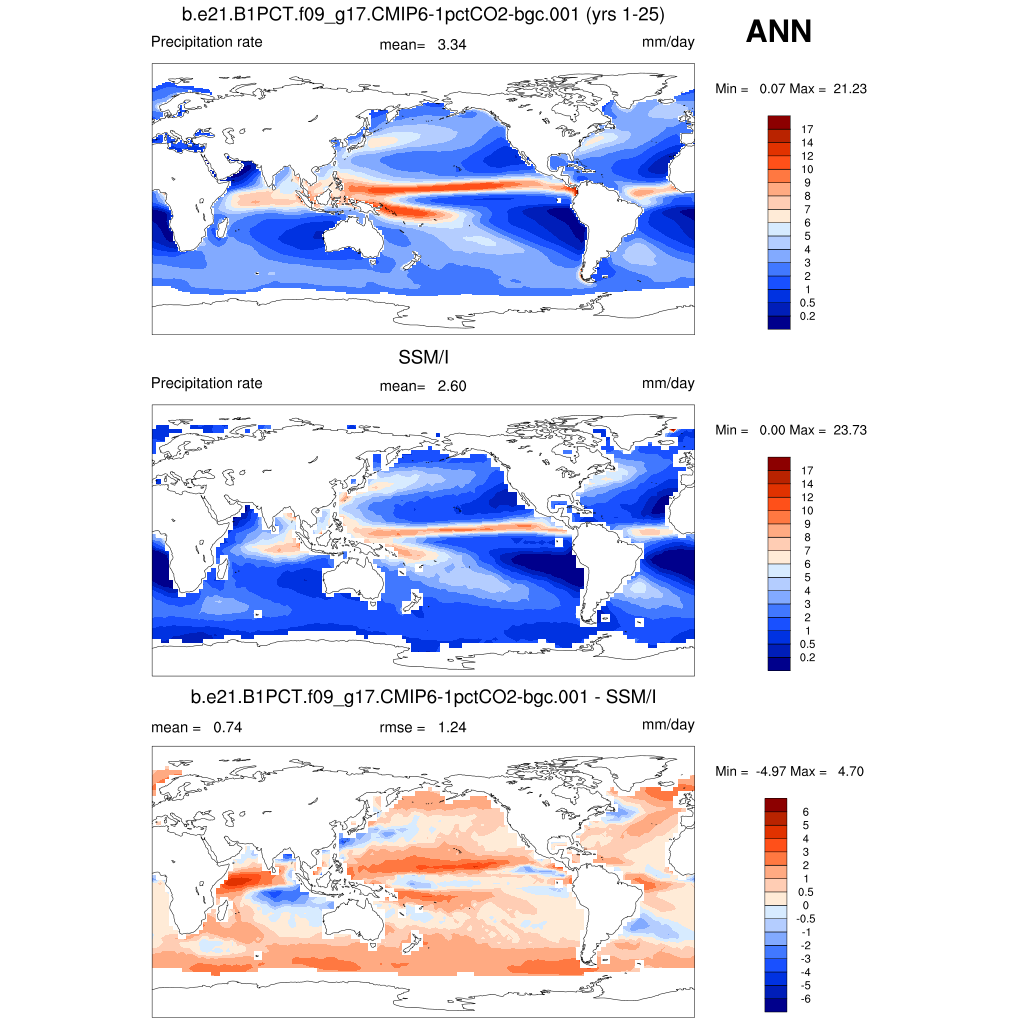
| SSM/I (Wentz) 1987-2000 | DJF | JJA | ANN | |
| PRECT * | Precipitation rate (ocean) | plot | plot | plot |
| PRECT TROP | Tropical precipitation rate (ocean) | plot | plot | plot |
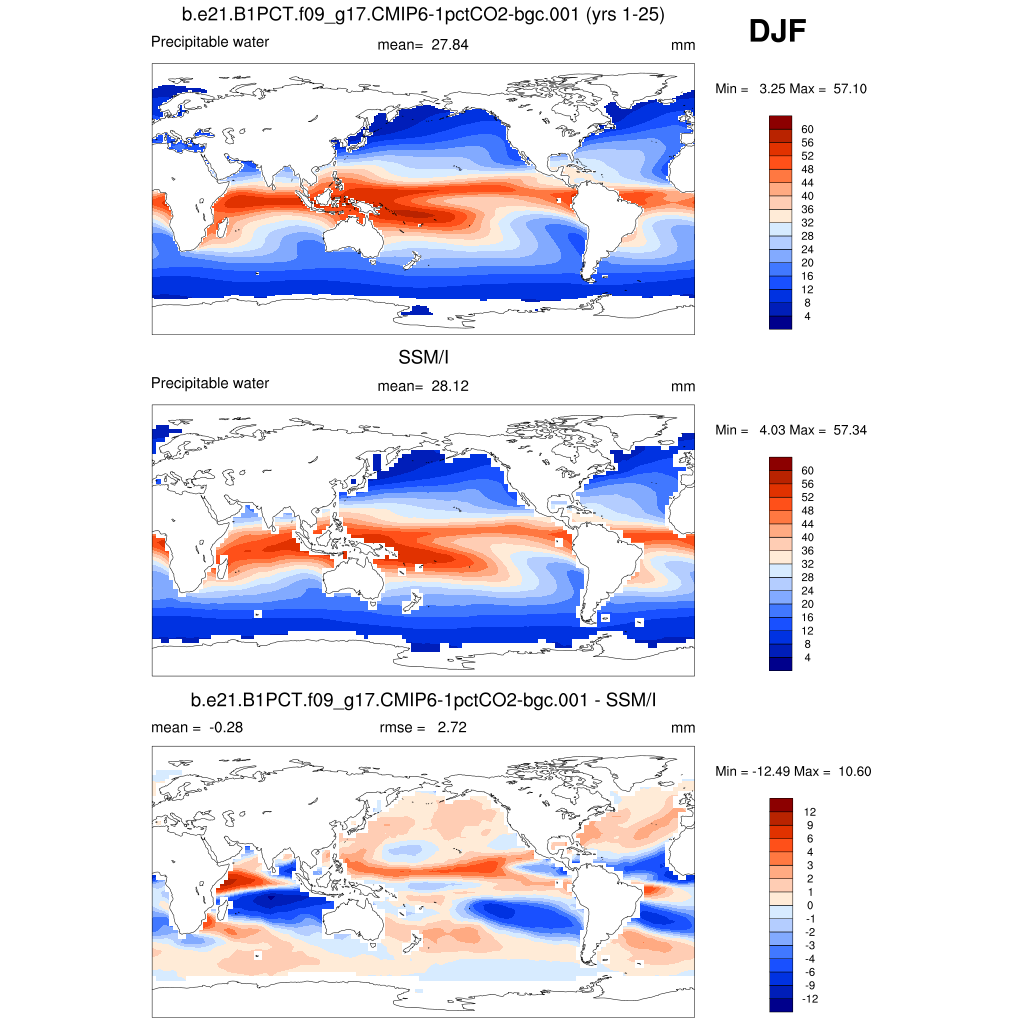
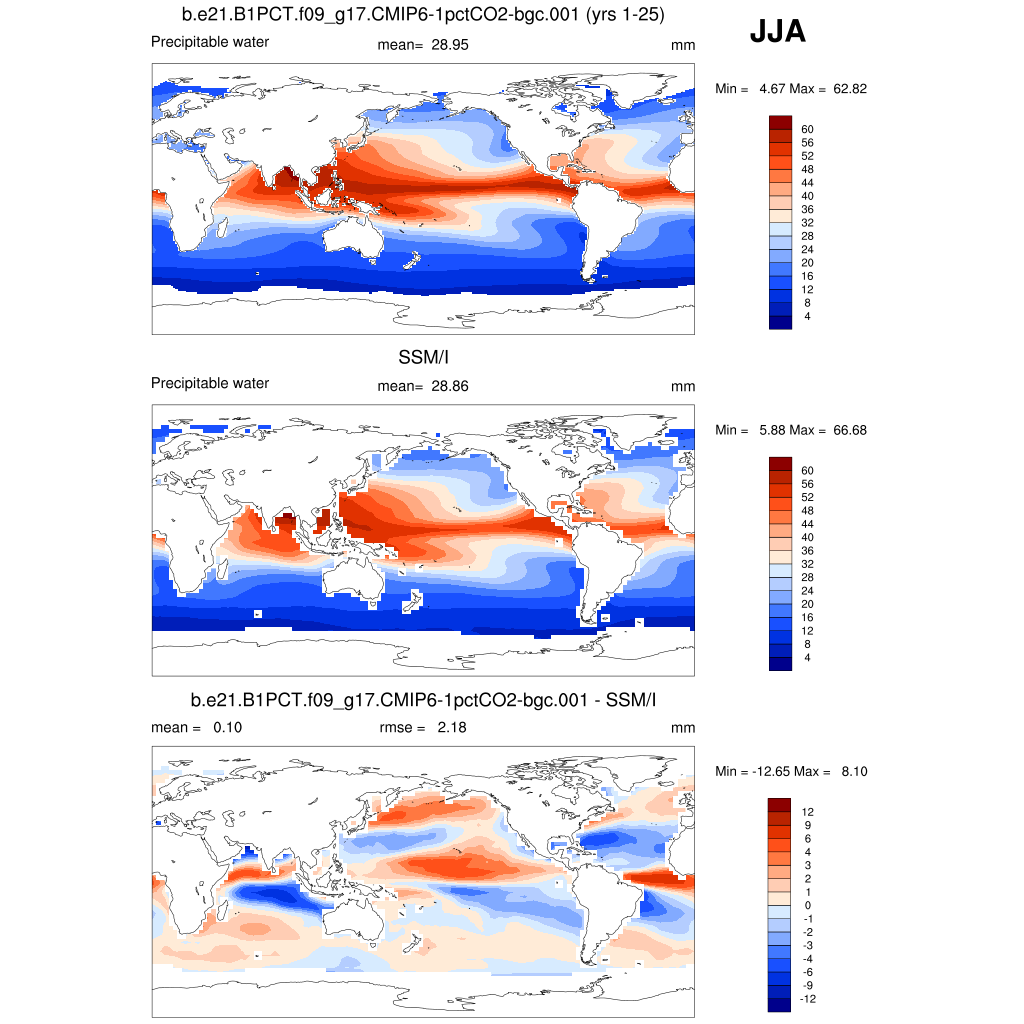
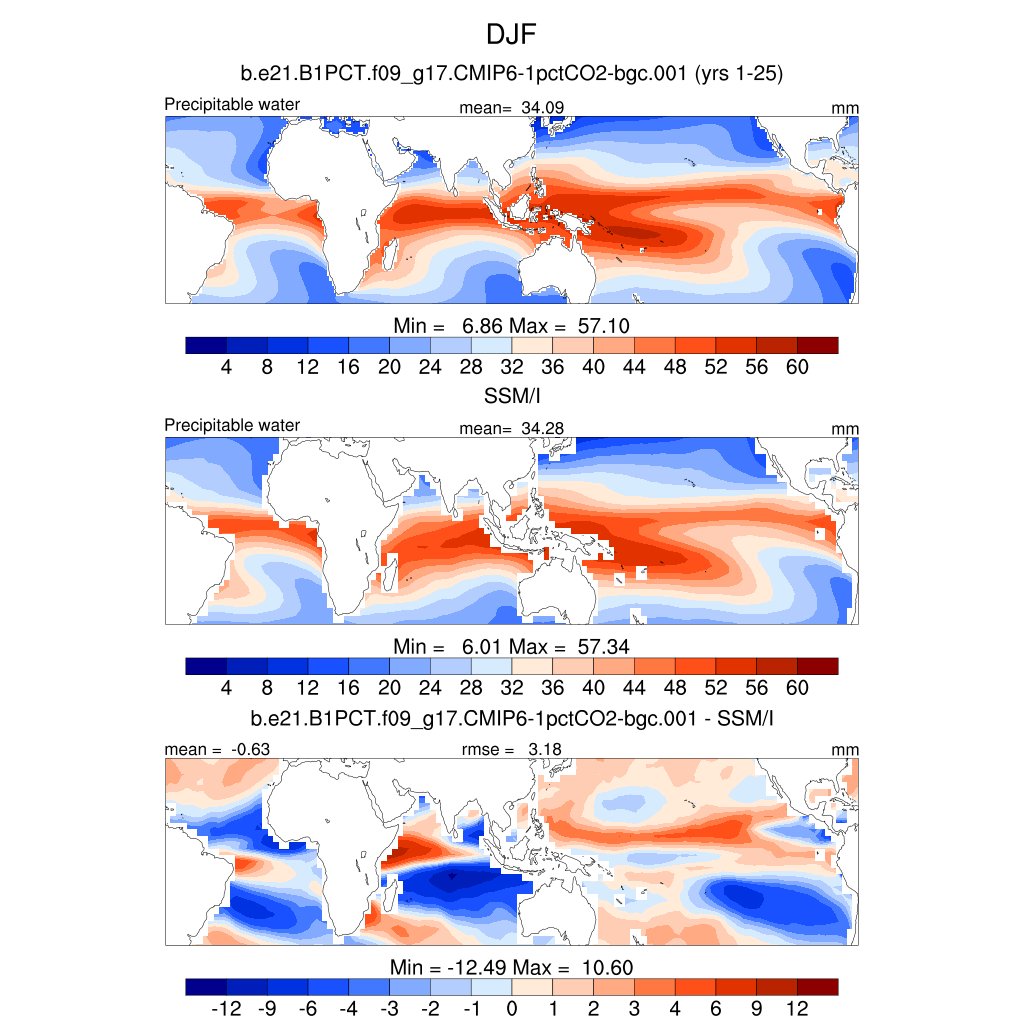
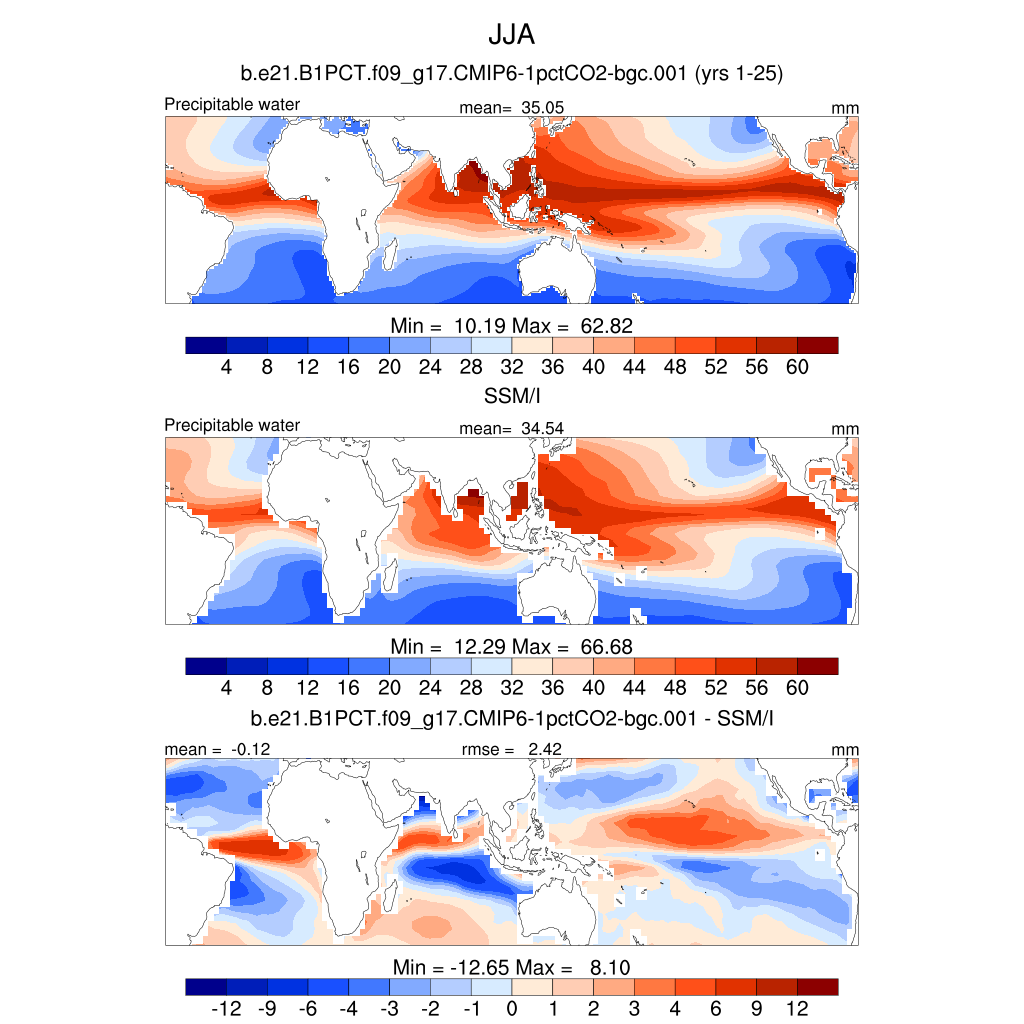
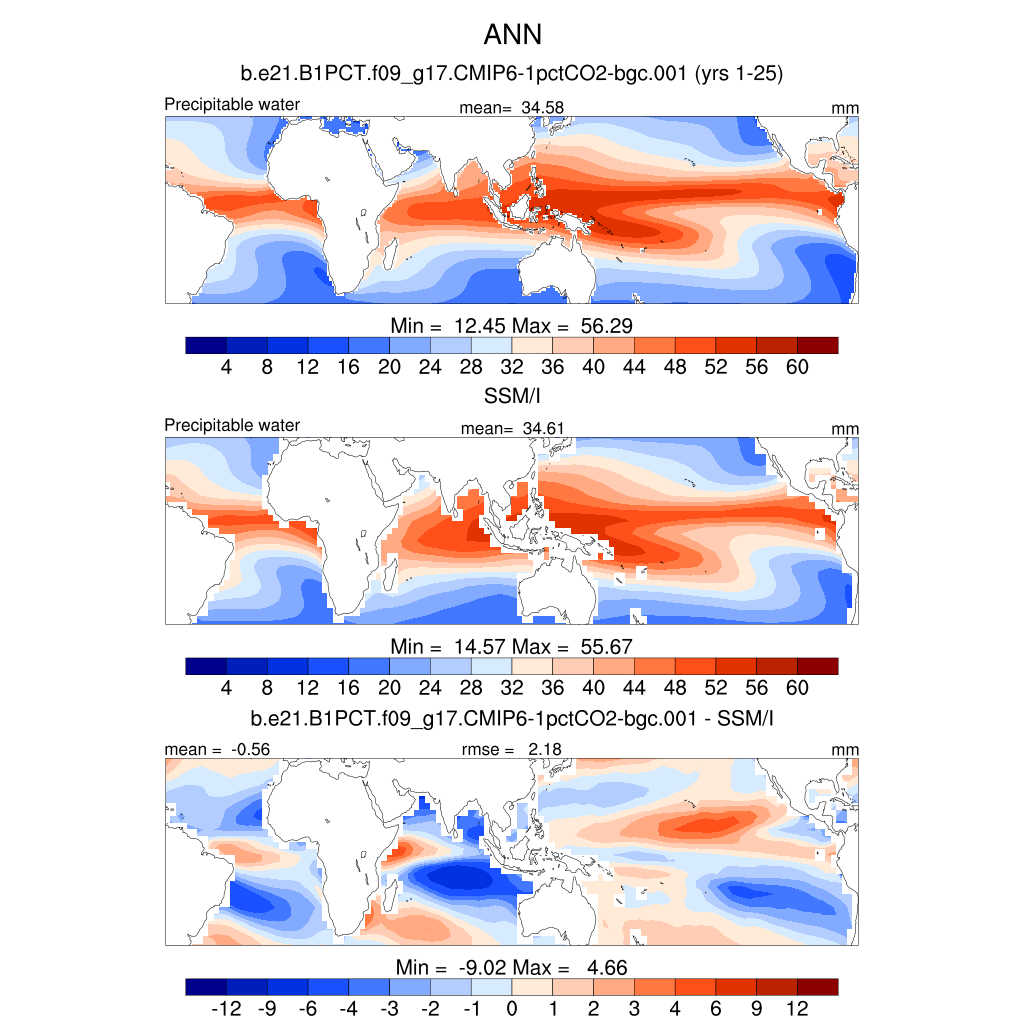
| PREH2O * | Precipitable water (ocean) | plot | plot | plot |
| PREH2O TROP | Tropical precipitable water (ocean) | plot | plot | plot |
| TRMM (3B43) 1998-2009 | DJF | JJA | ANN | |
| PRECT TROP | Tropical precipitation rate | plot | plot | plot |
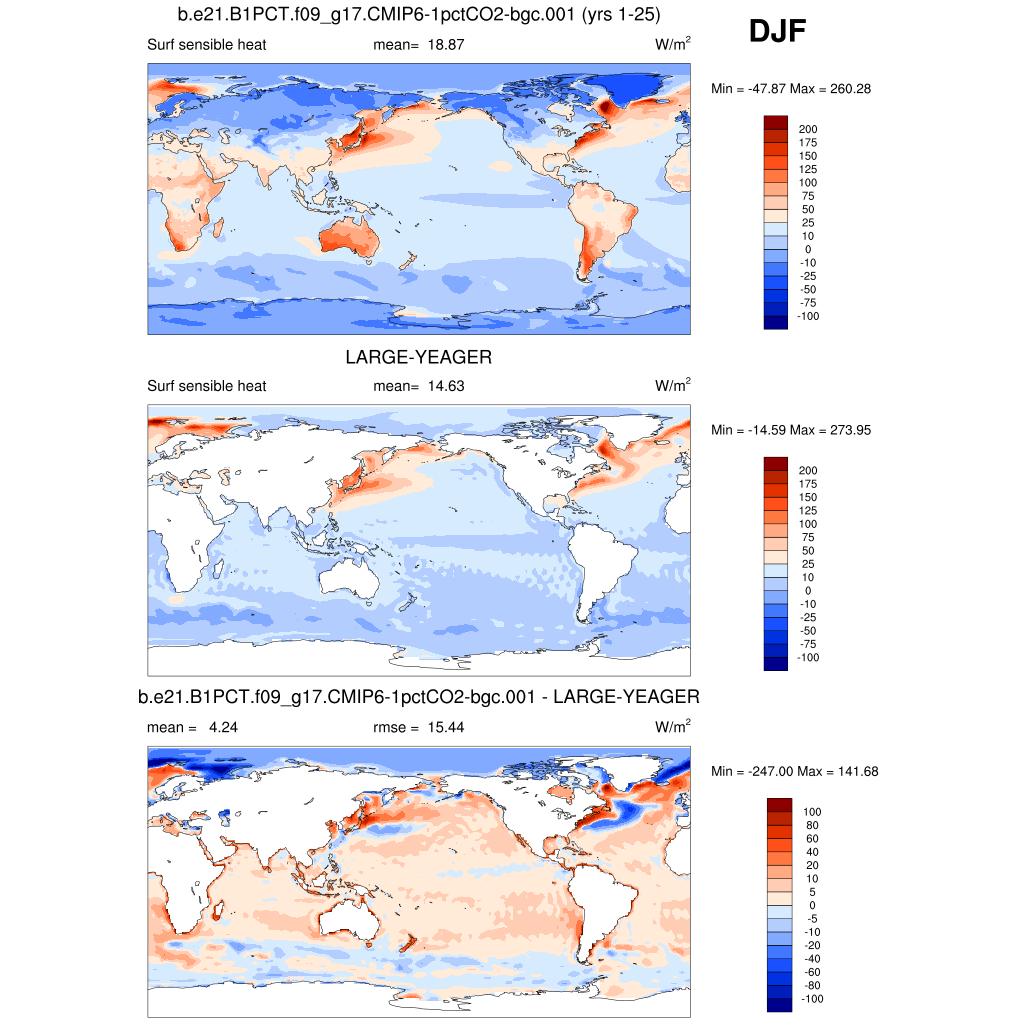
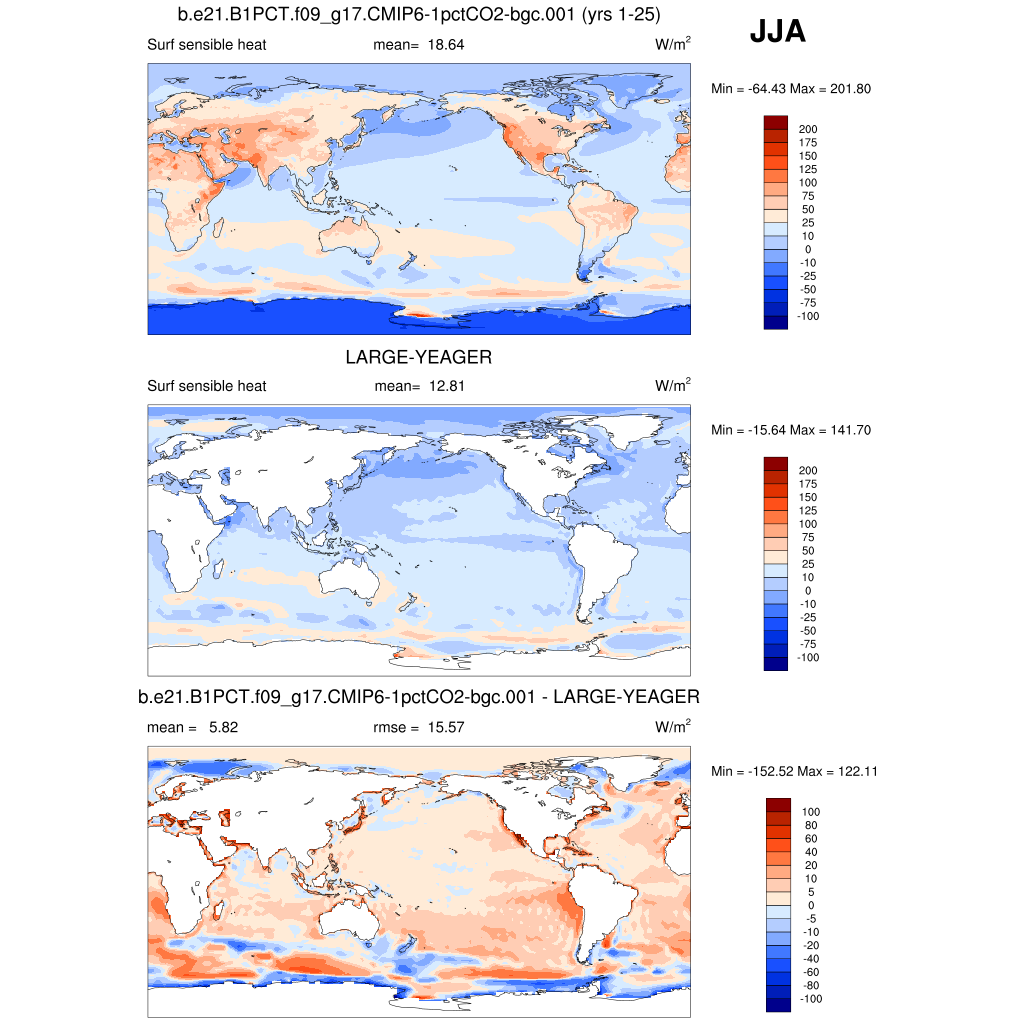
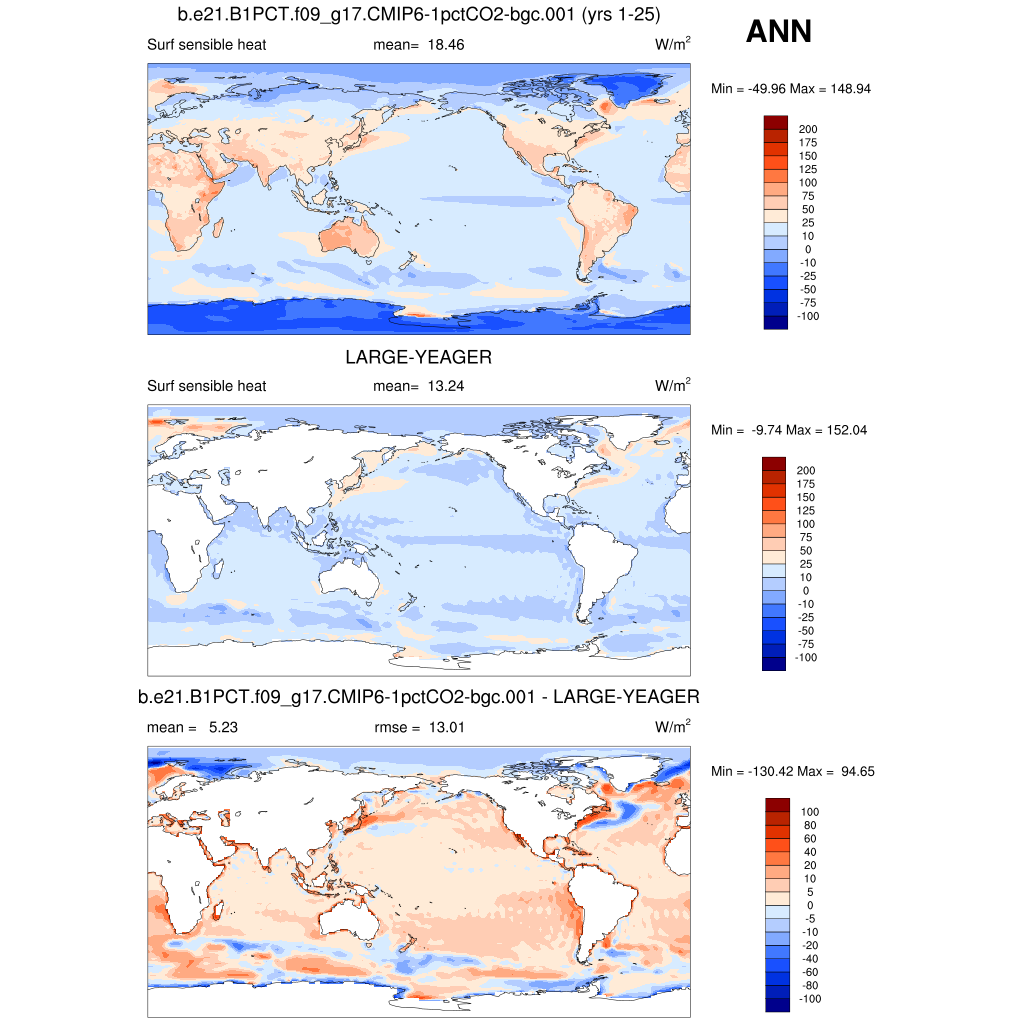
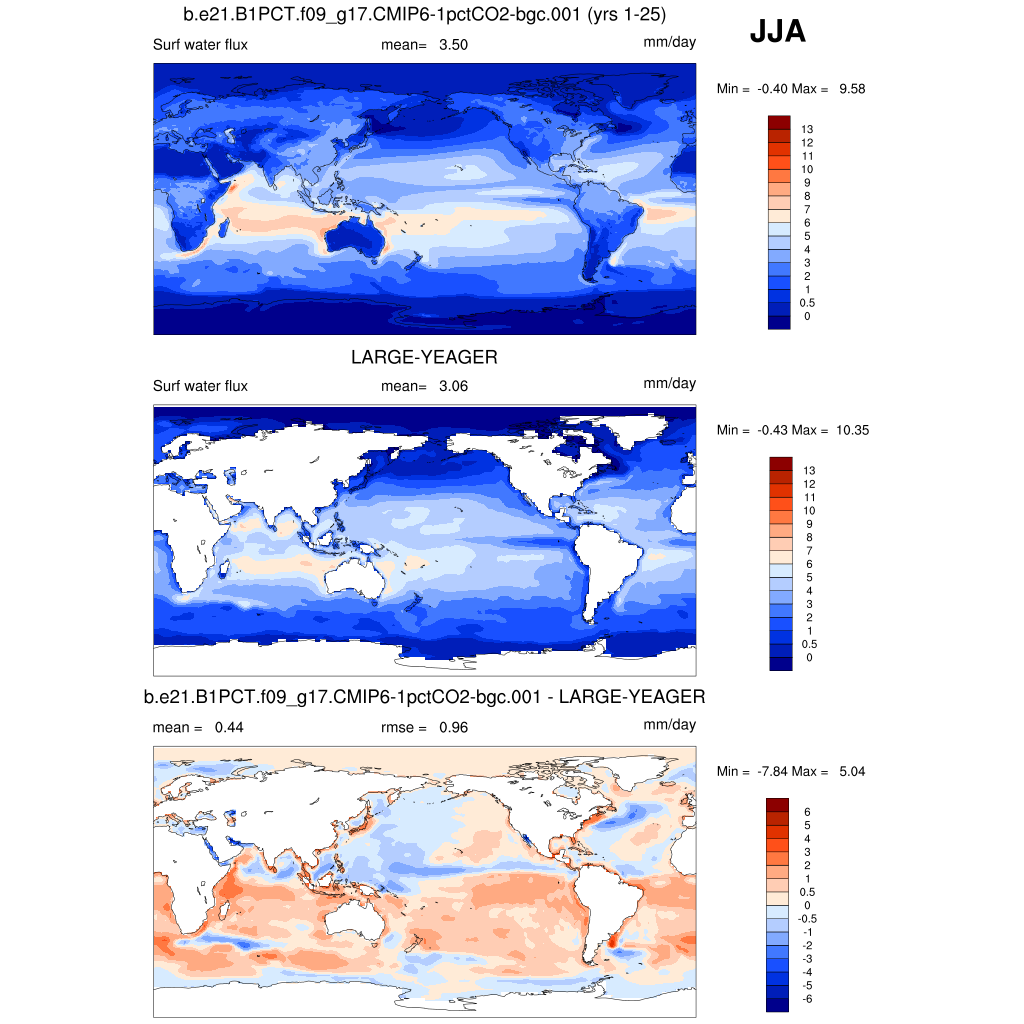
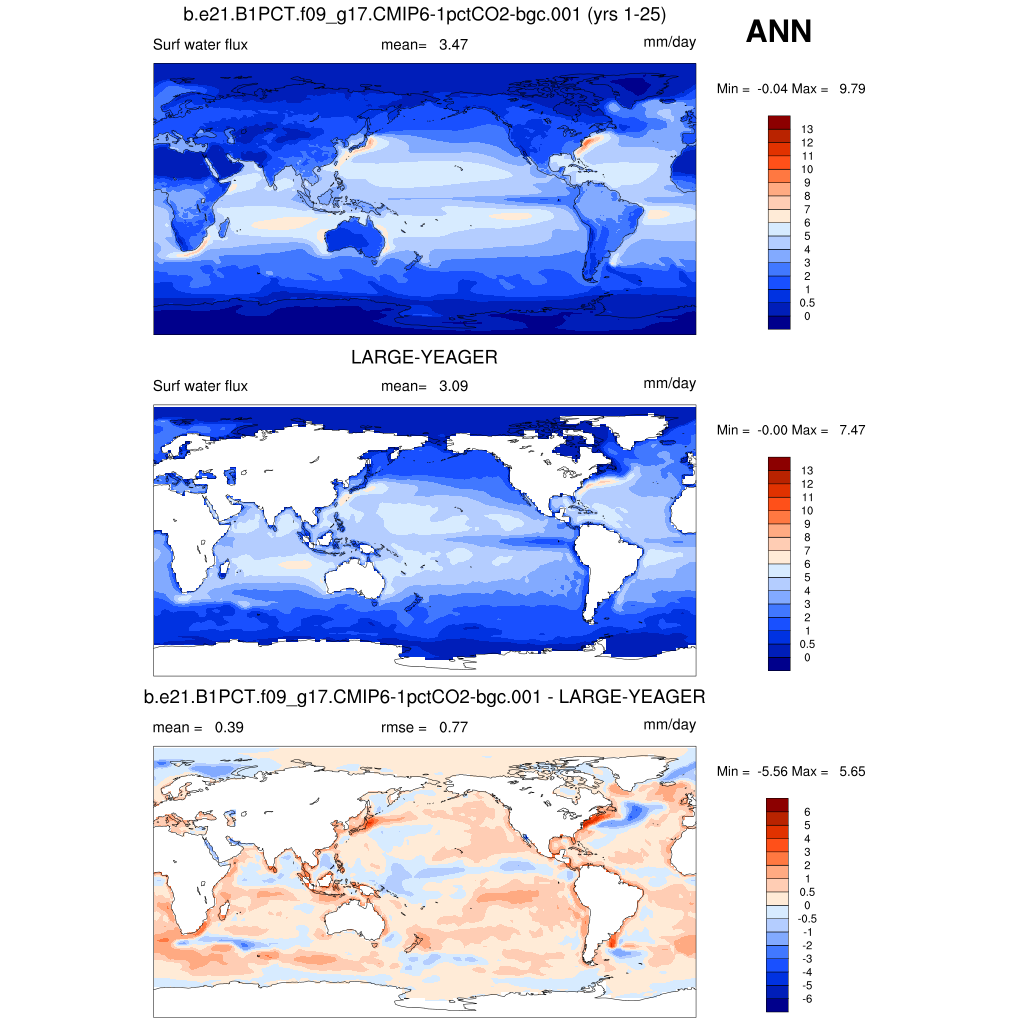
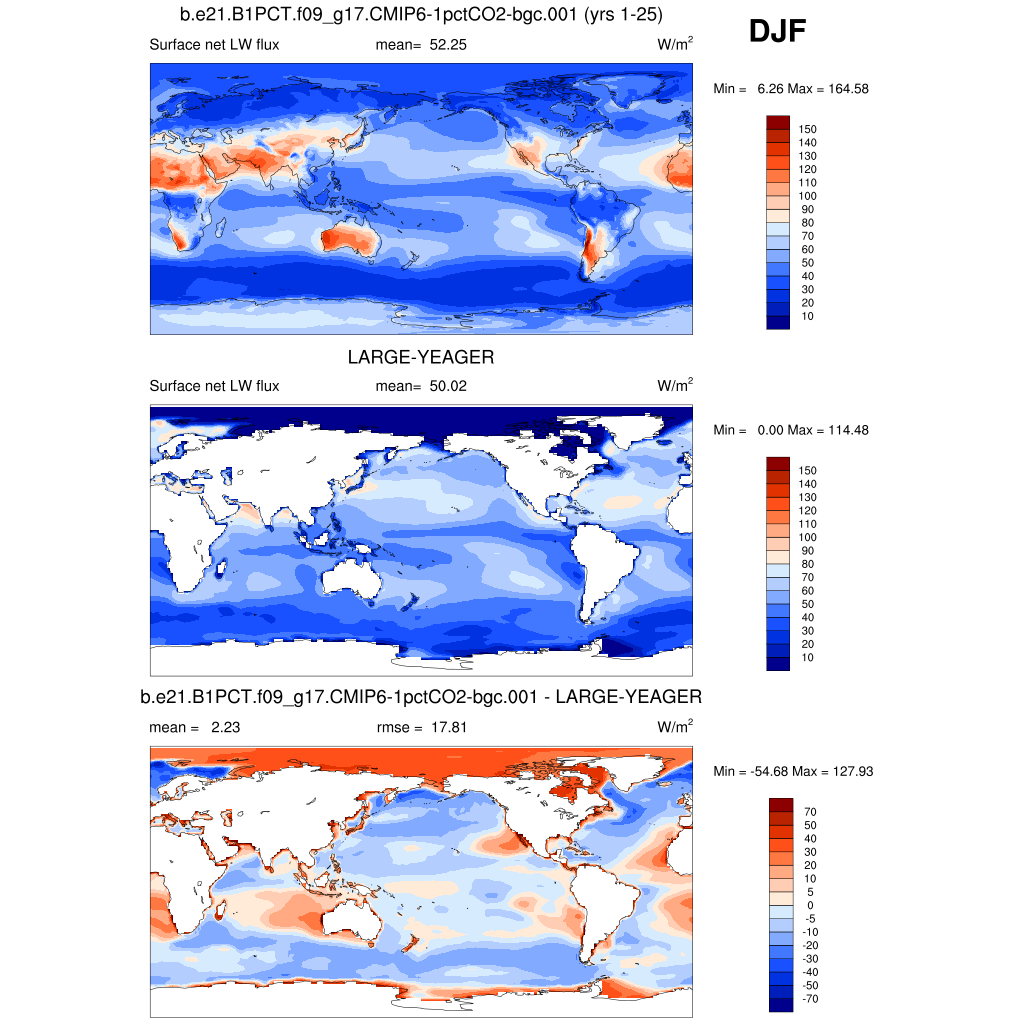
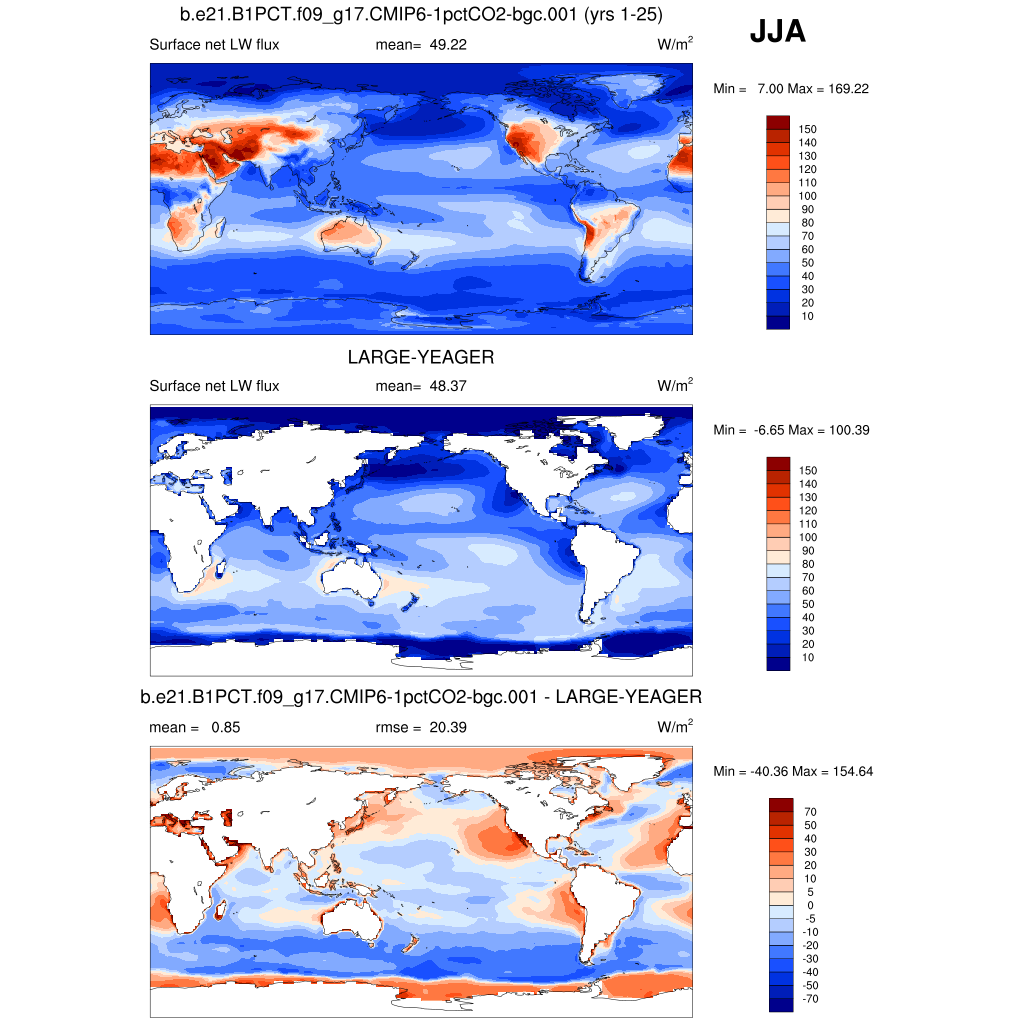
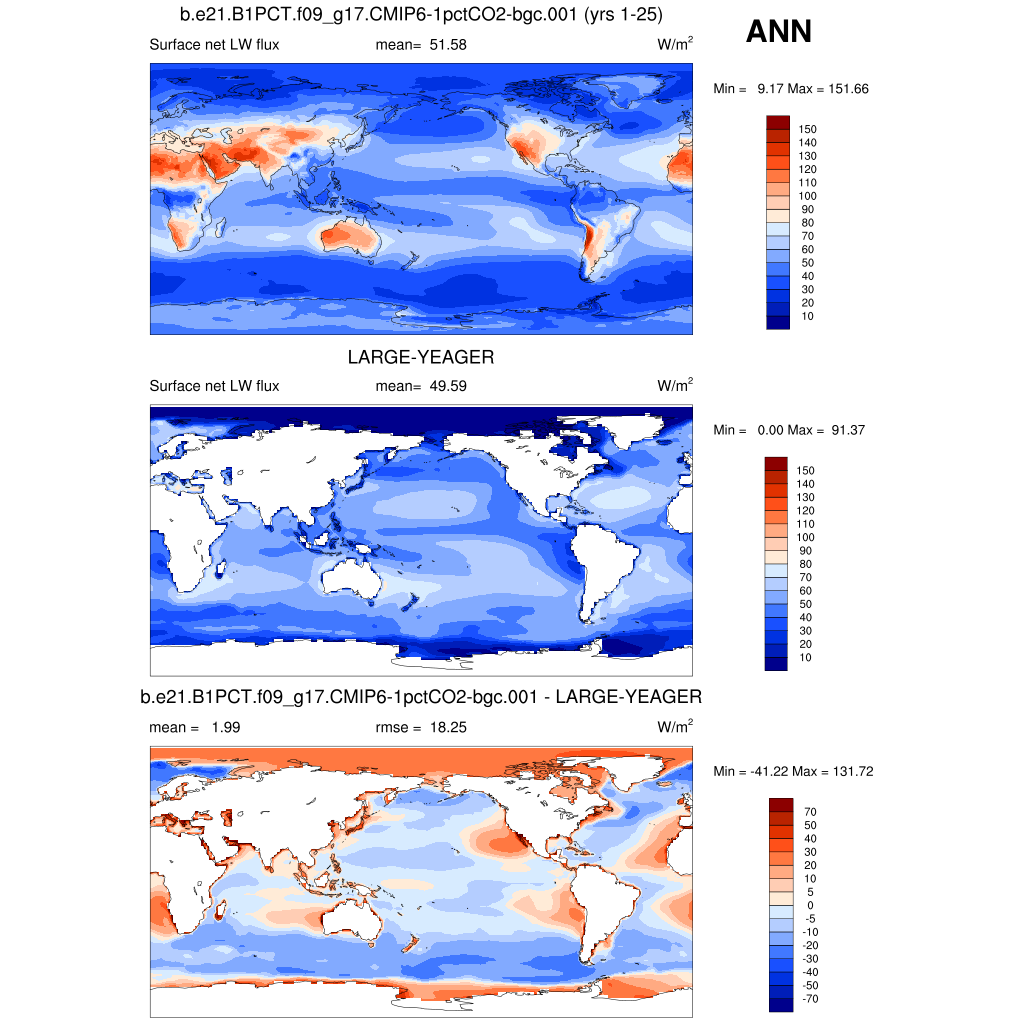
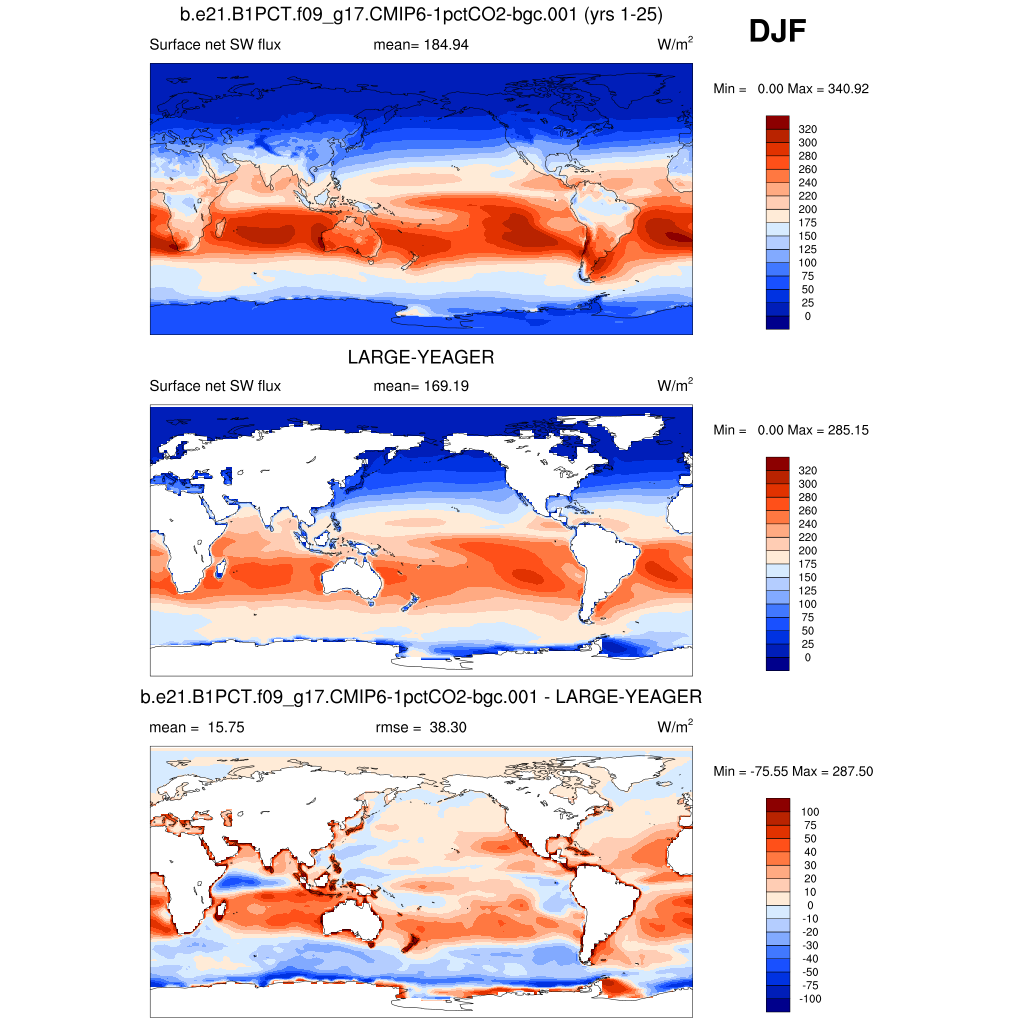
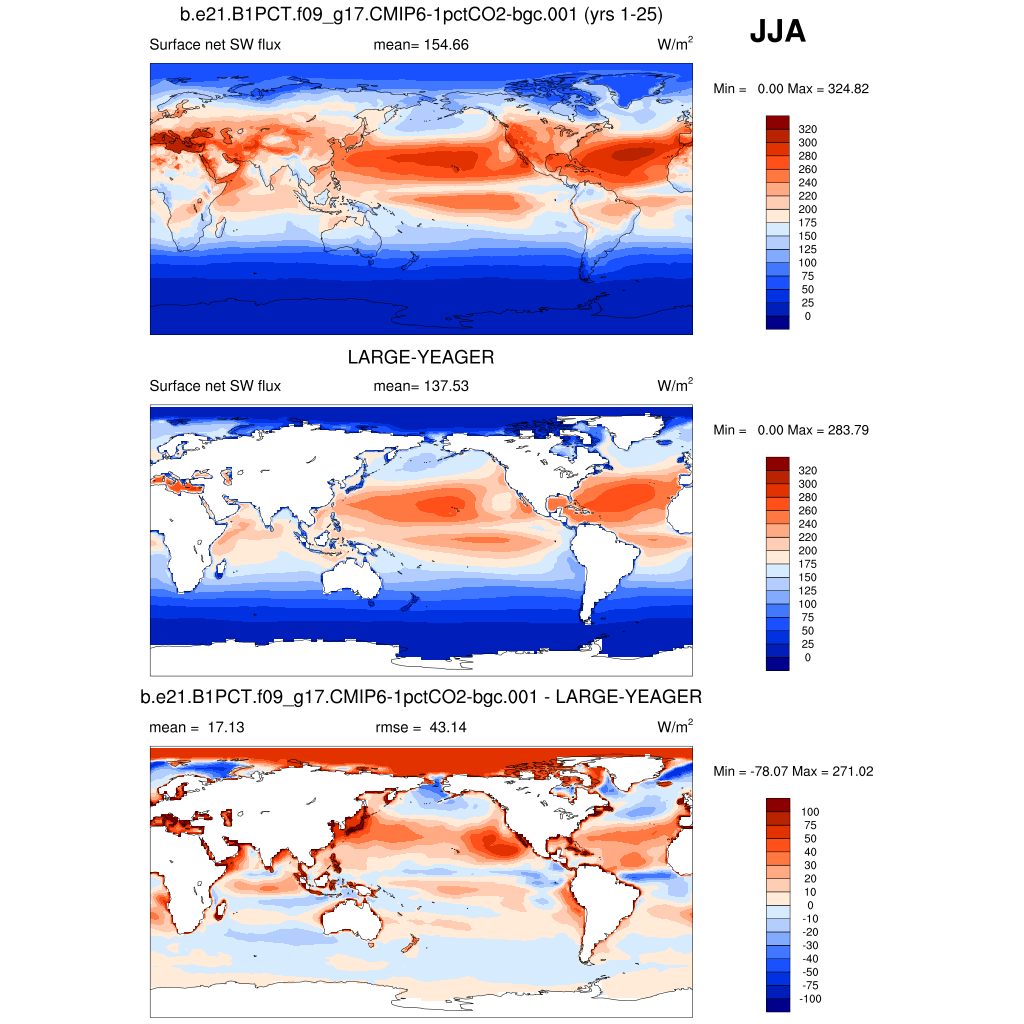
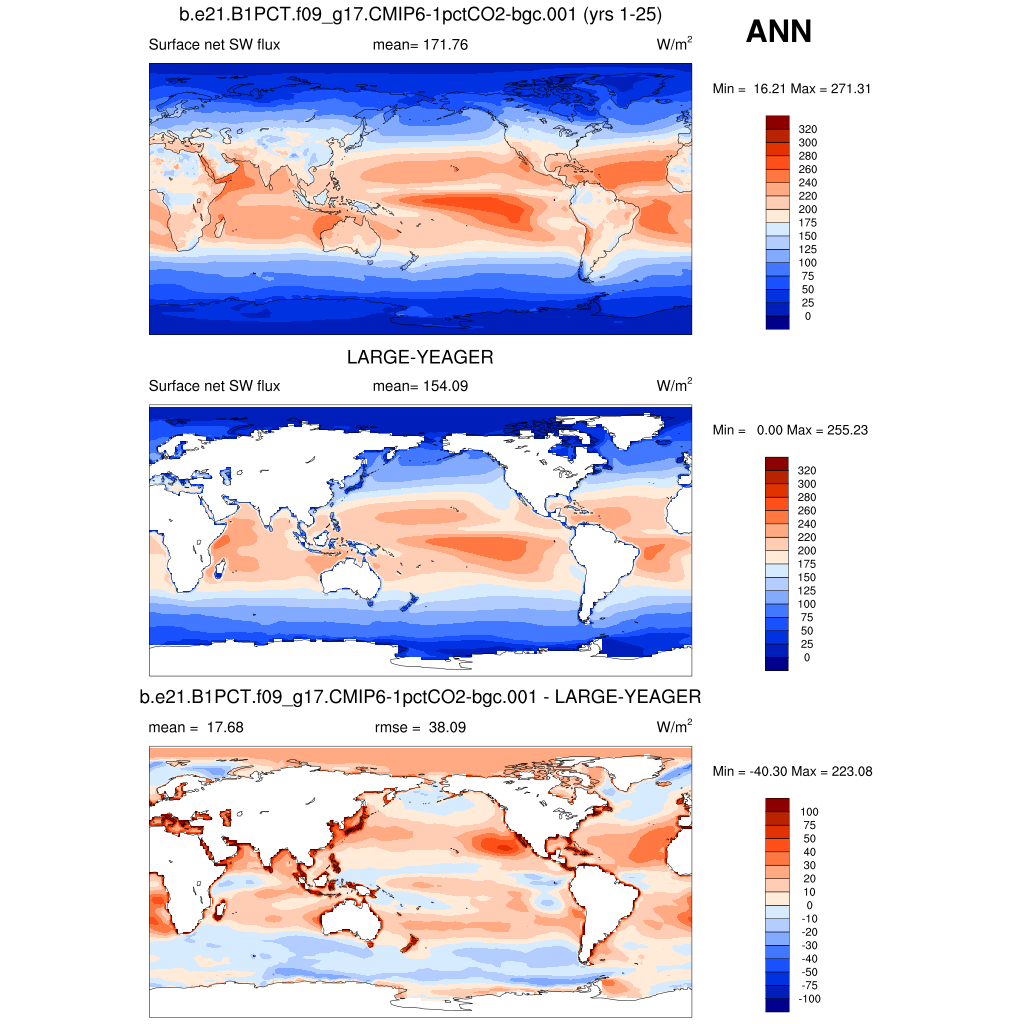
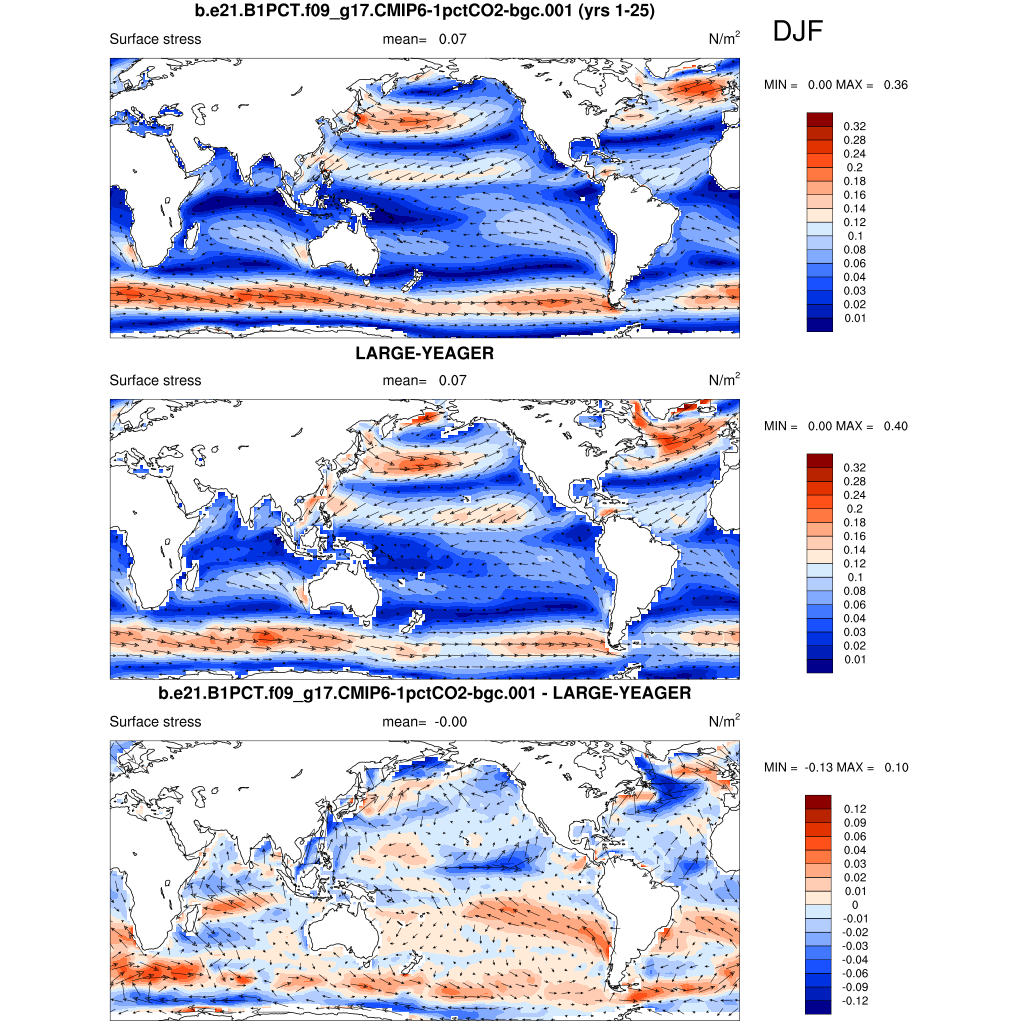
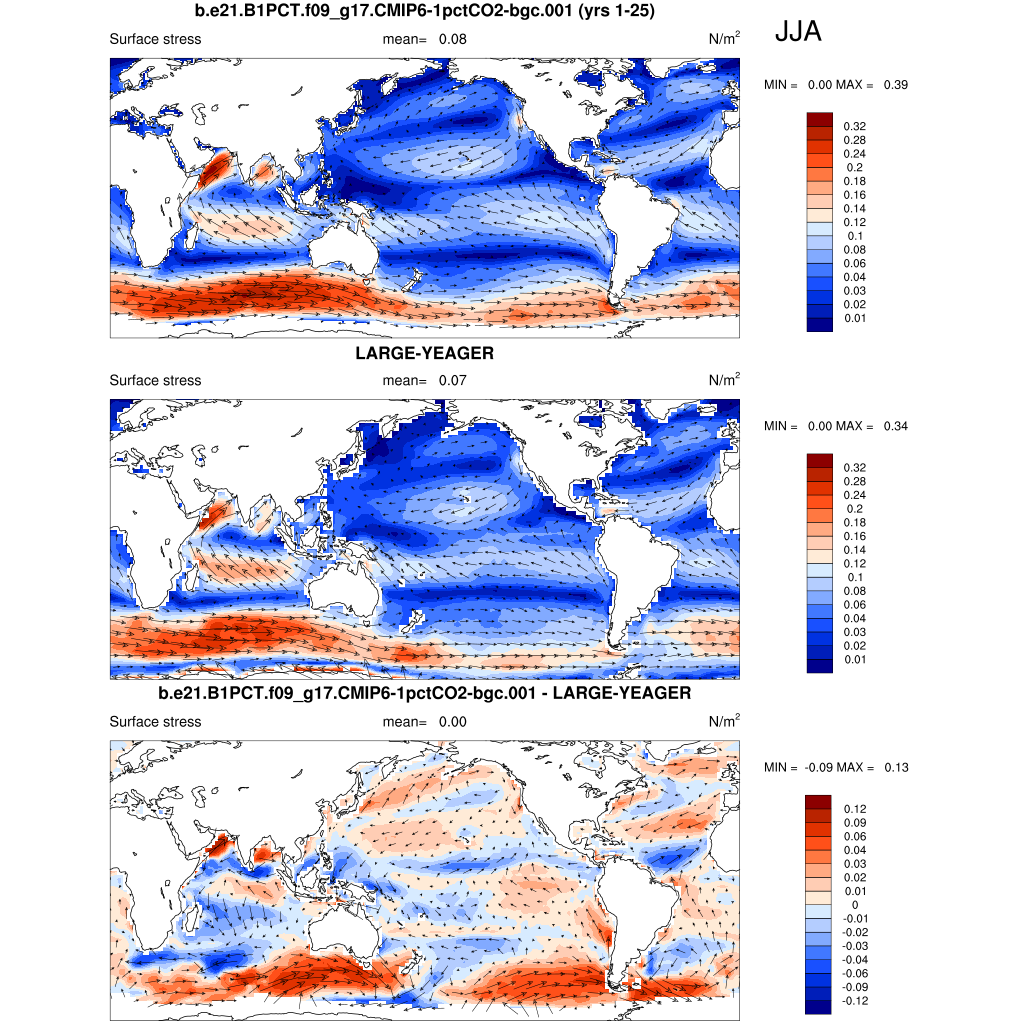
| Large-Yeager 1984-2004 | DJF | JJA | ANN | |
| SHFLX | Surface sensible heat flux | plot | plot | plot |
| QFLX | Surface water flux | plot | plot | plot |
| FLNS | Surf Net LW flux | plot | plot | plot |
| FSNS | Surf Net SW flux | plot | plot | plot |
| SURF STRESS * | Surface wind stress (ocean) | plot | plot | plot |
| SURF STRESS TROP | Tropical surface wind stress (ocean) | plot | plot | plot |
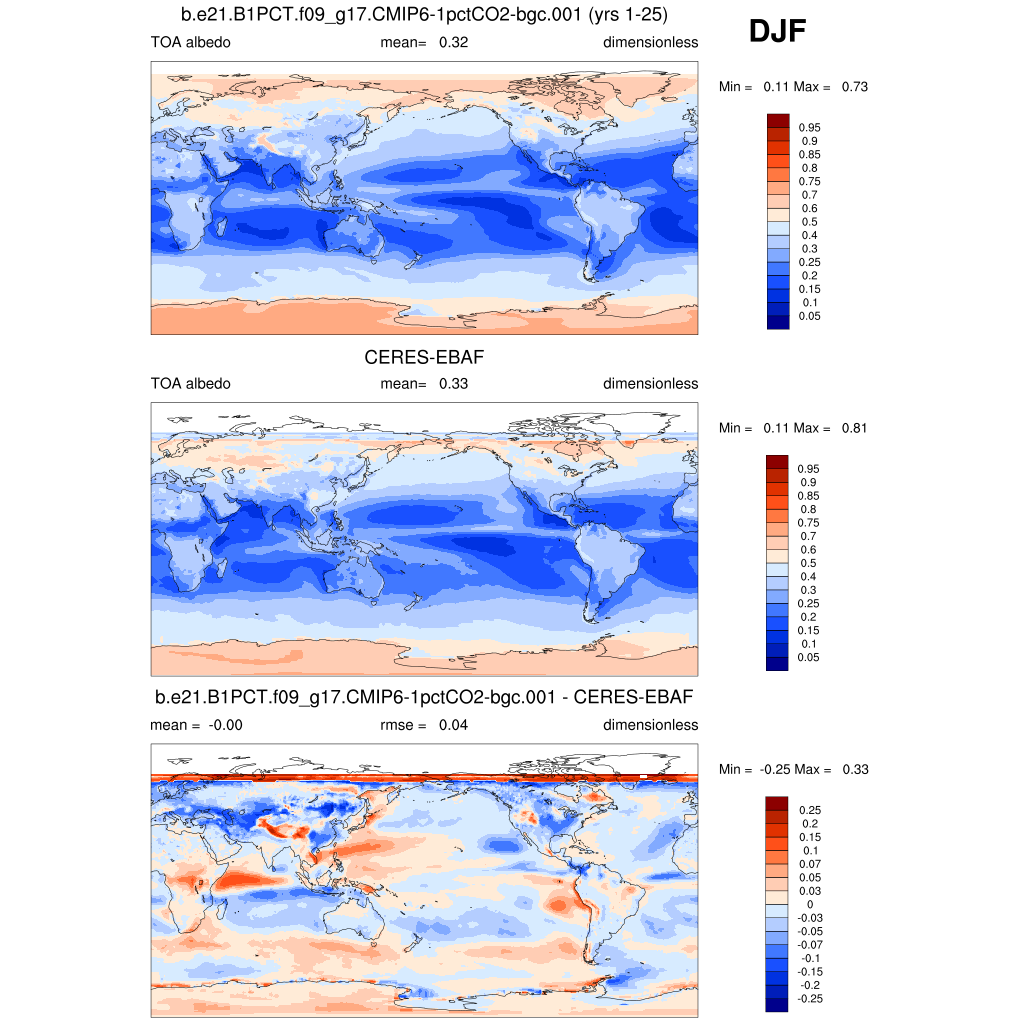
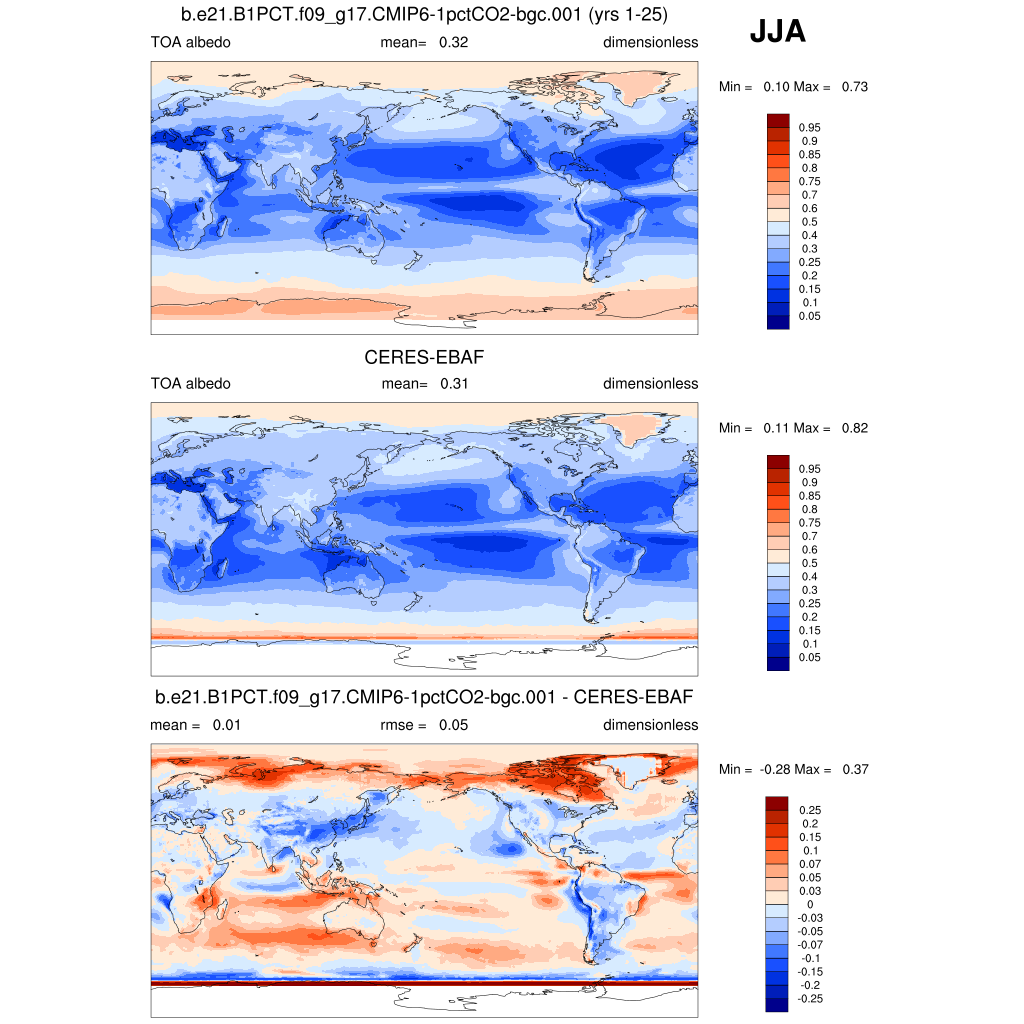
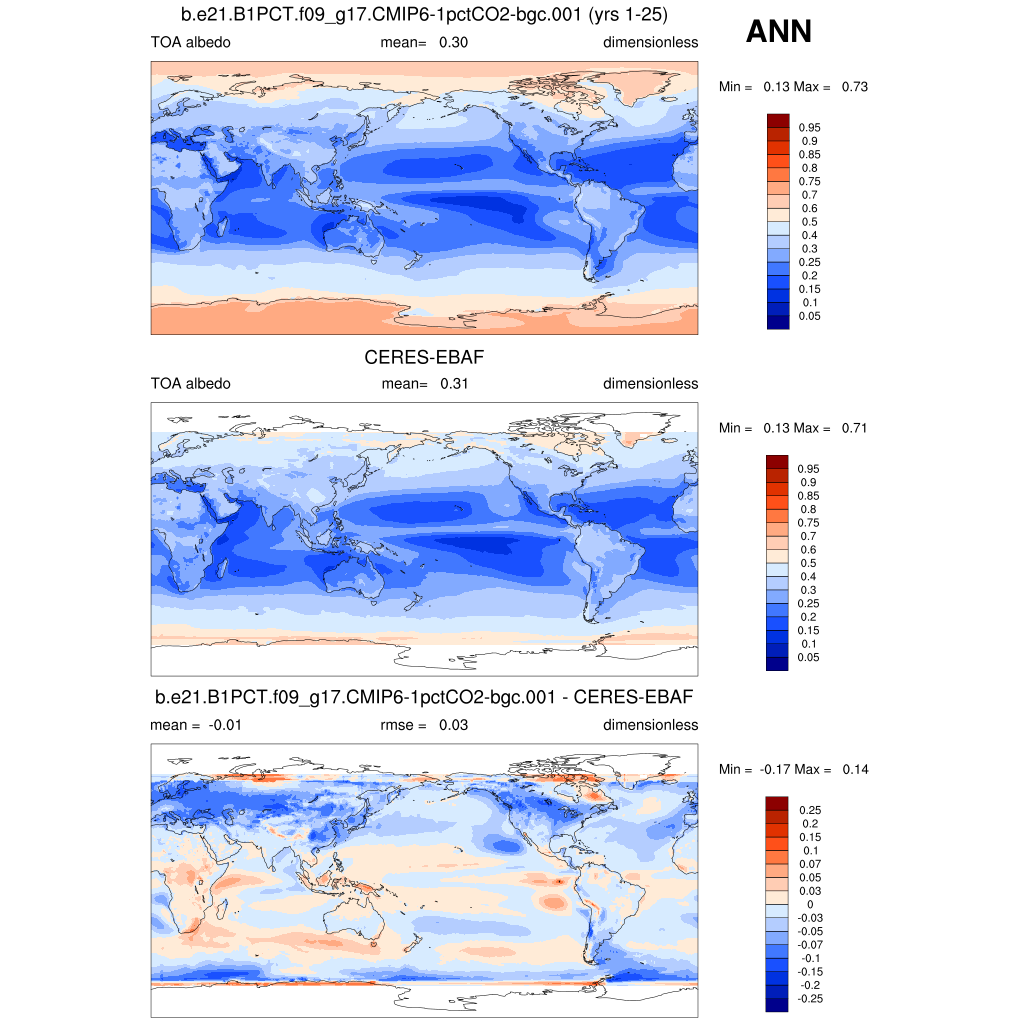
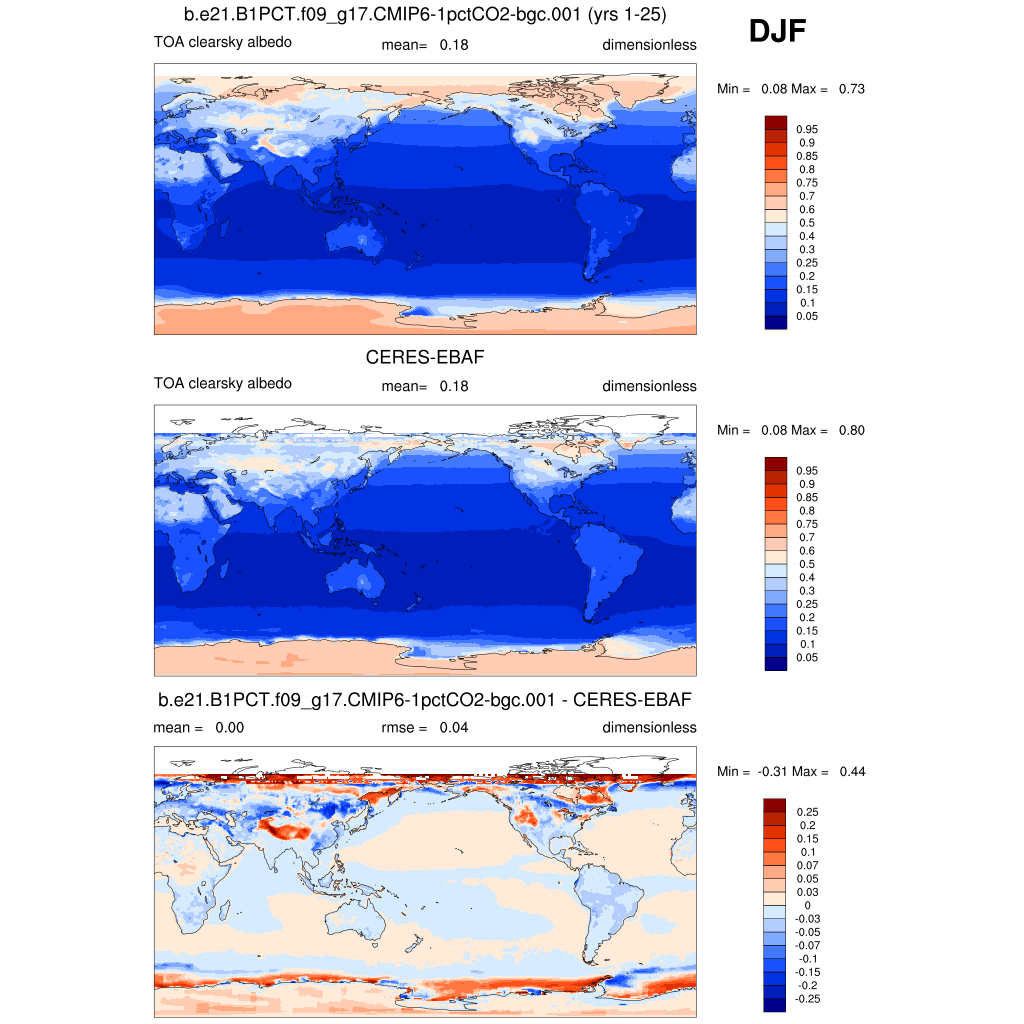
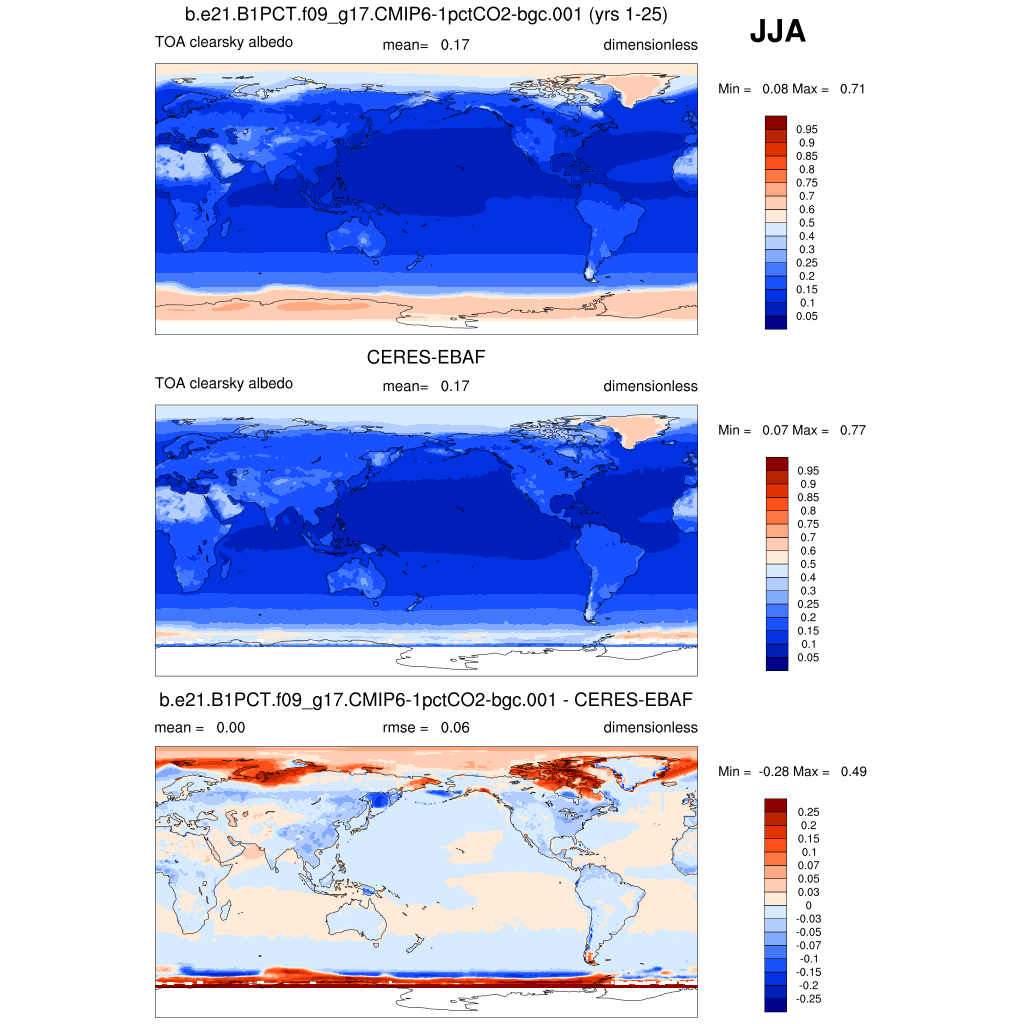
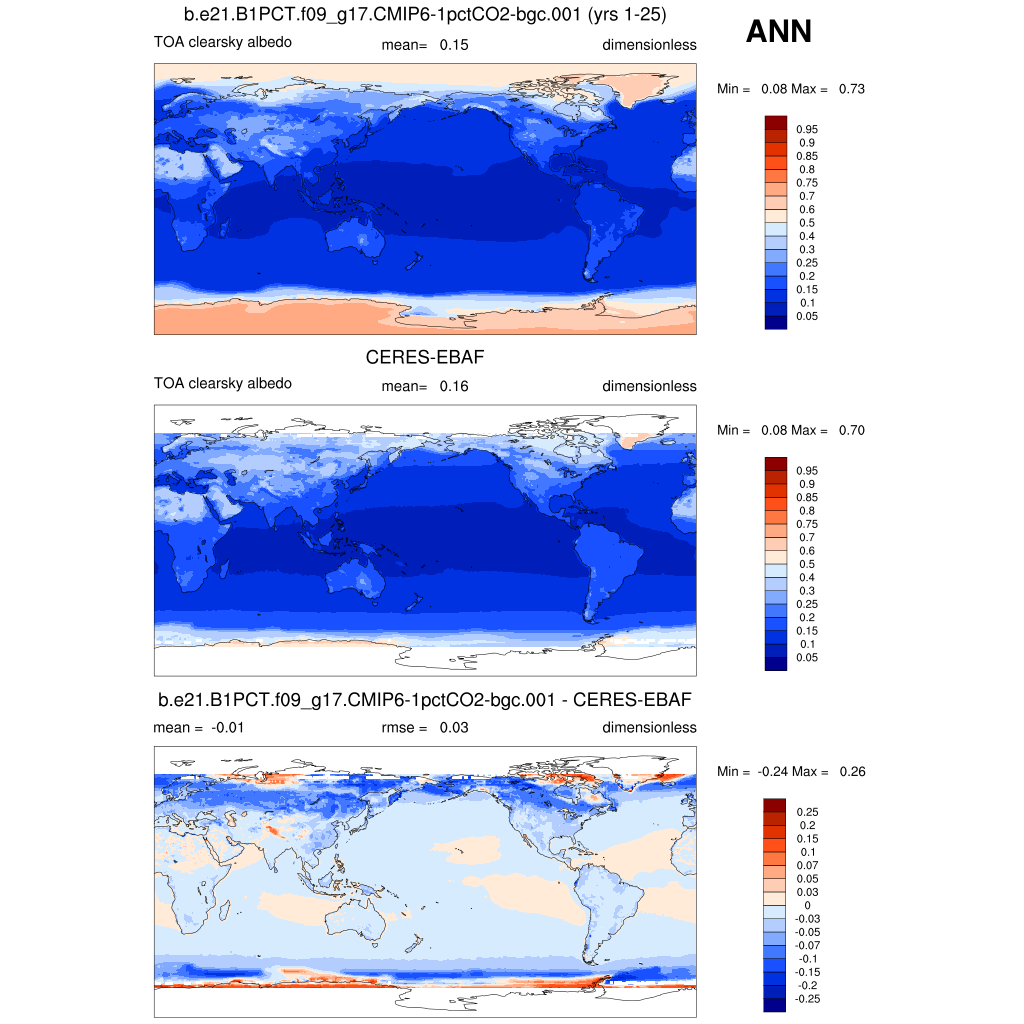
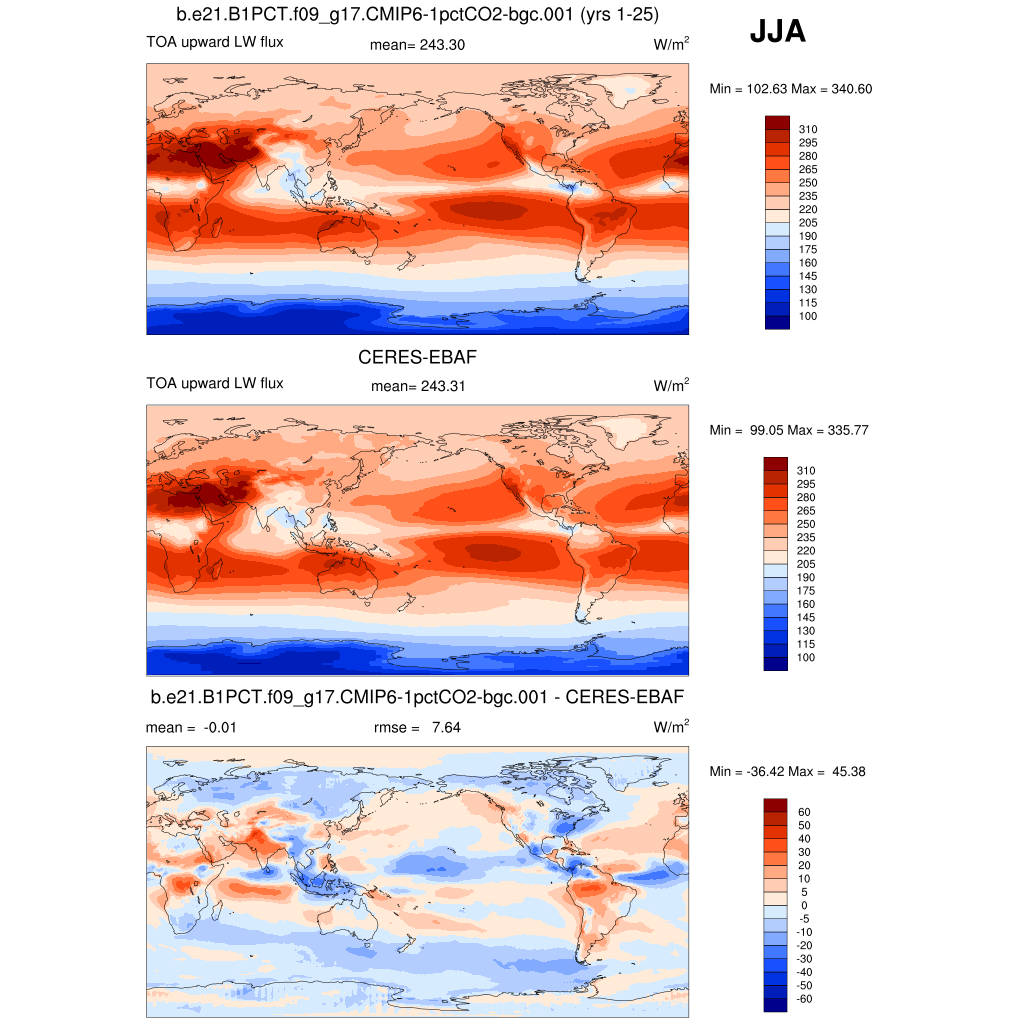
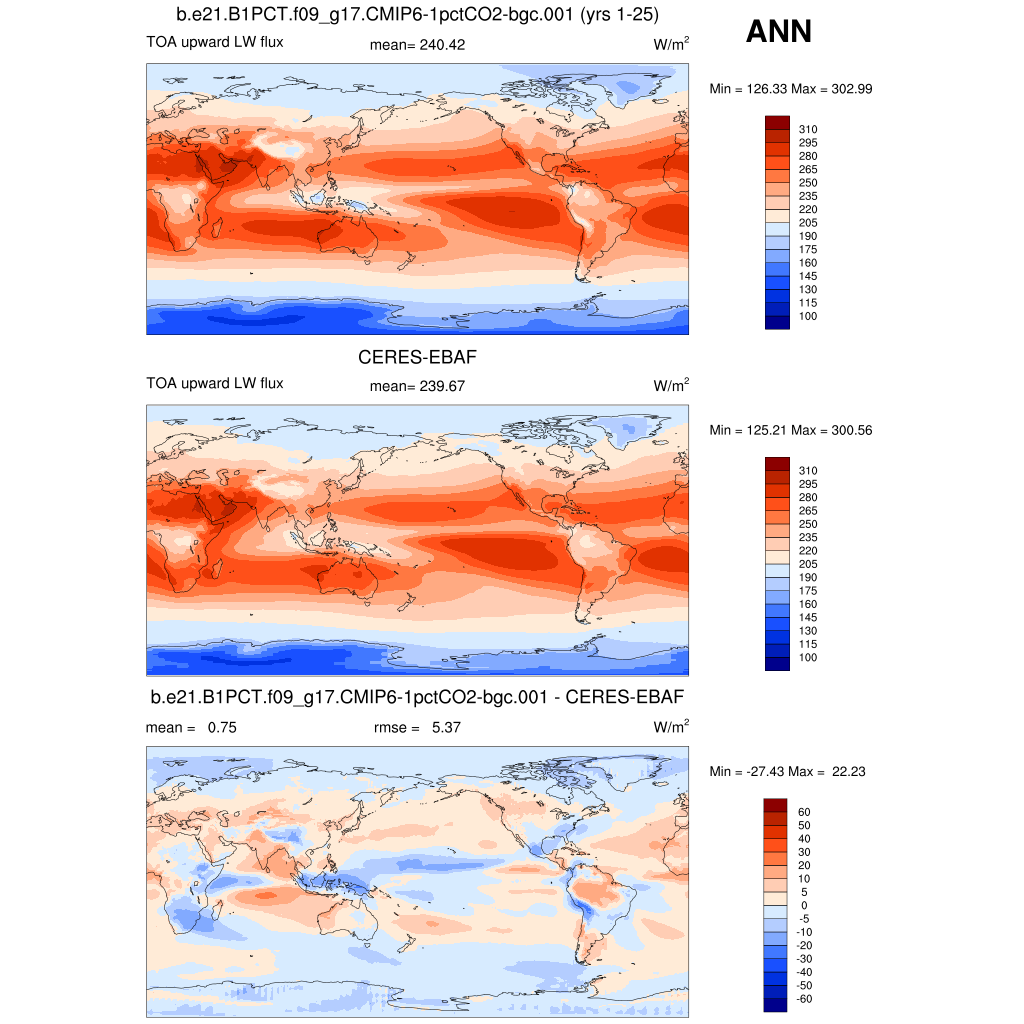
| CERES-EBAF March 2000-Feb 2013 | DJF | JJA | ANN | |
| ALBEDO | TOA albedo | plot | plot | plot |
| ALBEDOC | TOA clearsky albedo | plot | plot | plot |
| FLUT * | TOA upward LW flux | plot | plot | plot |
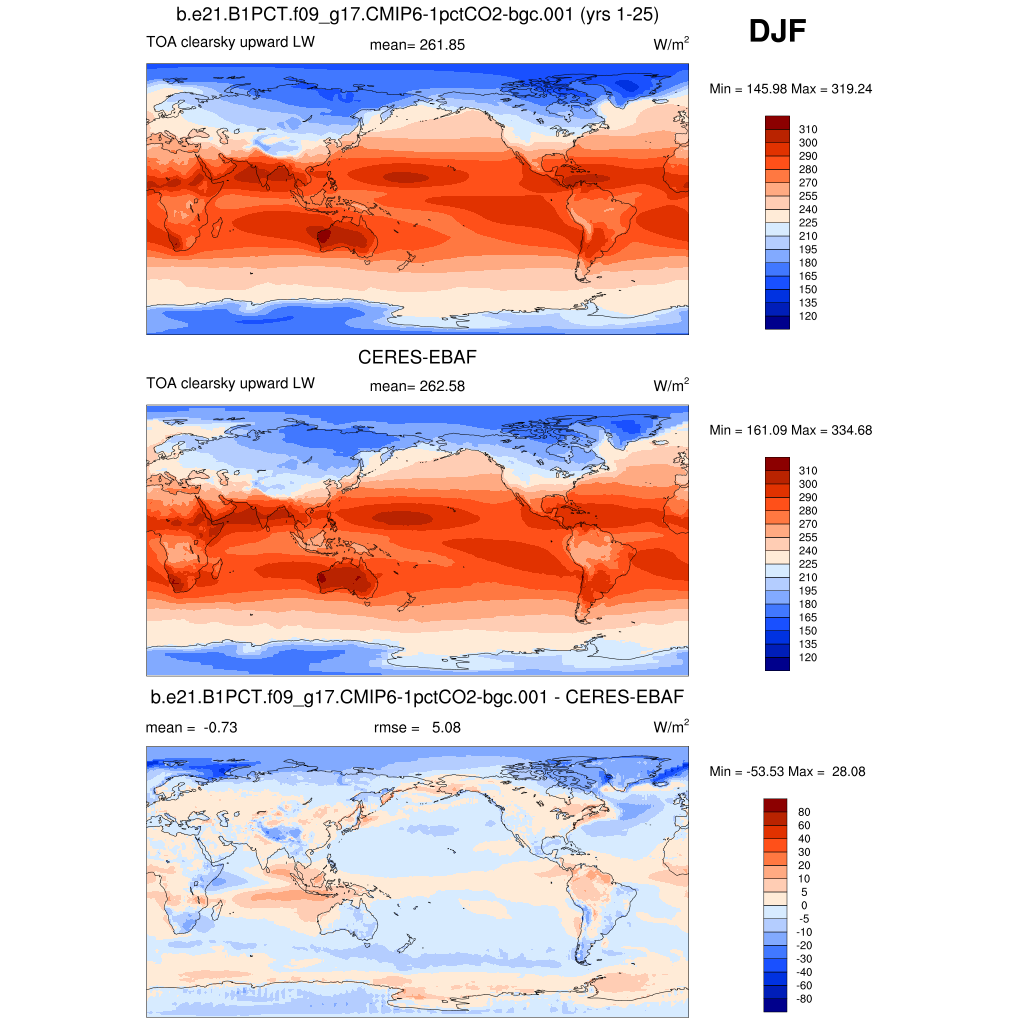
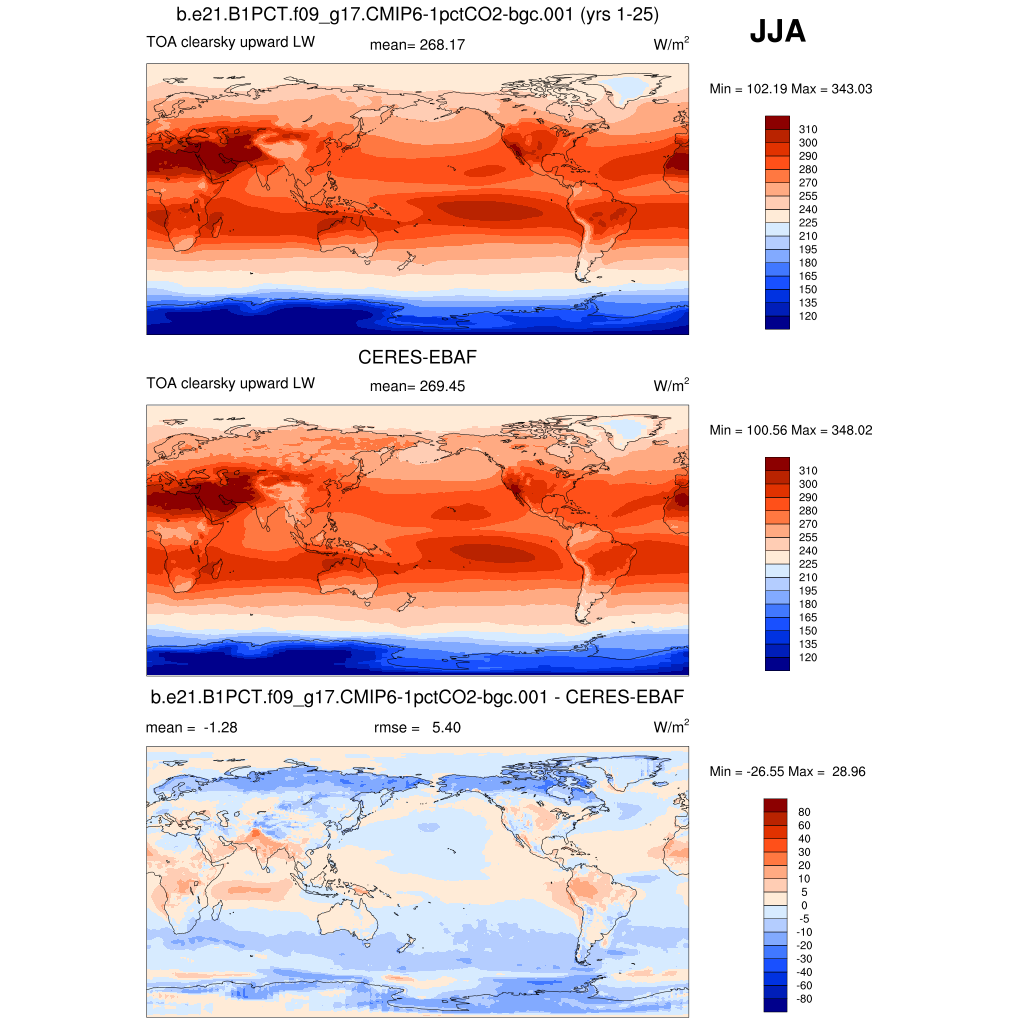
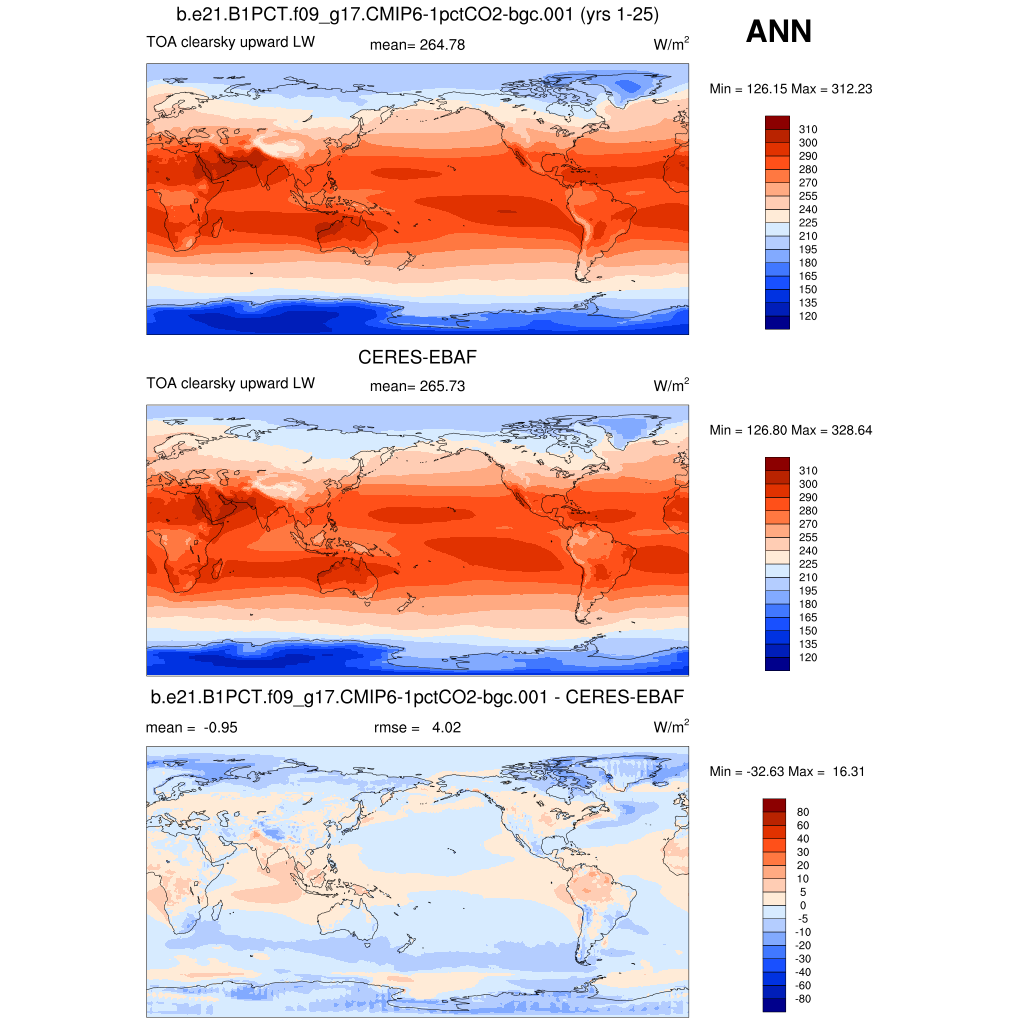
| FLUTC | TOA clearsky upward LW flux | plot | plot | plot |
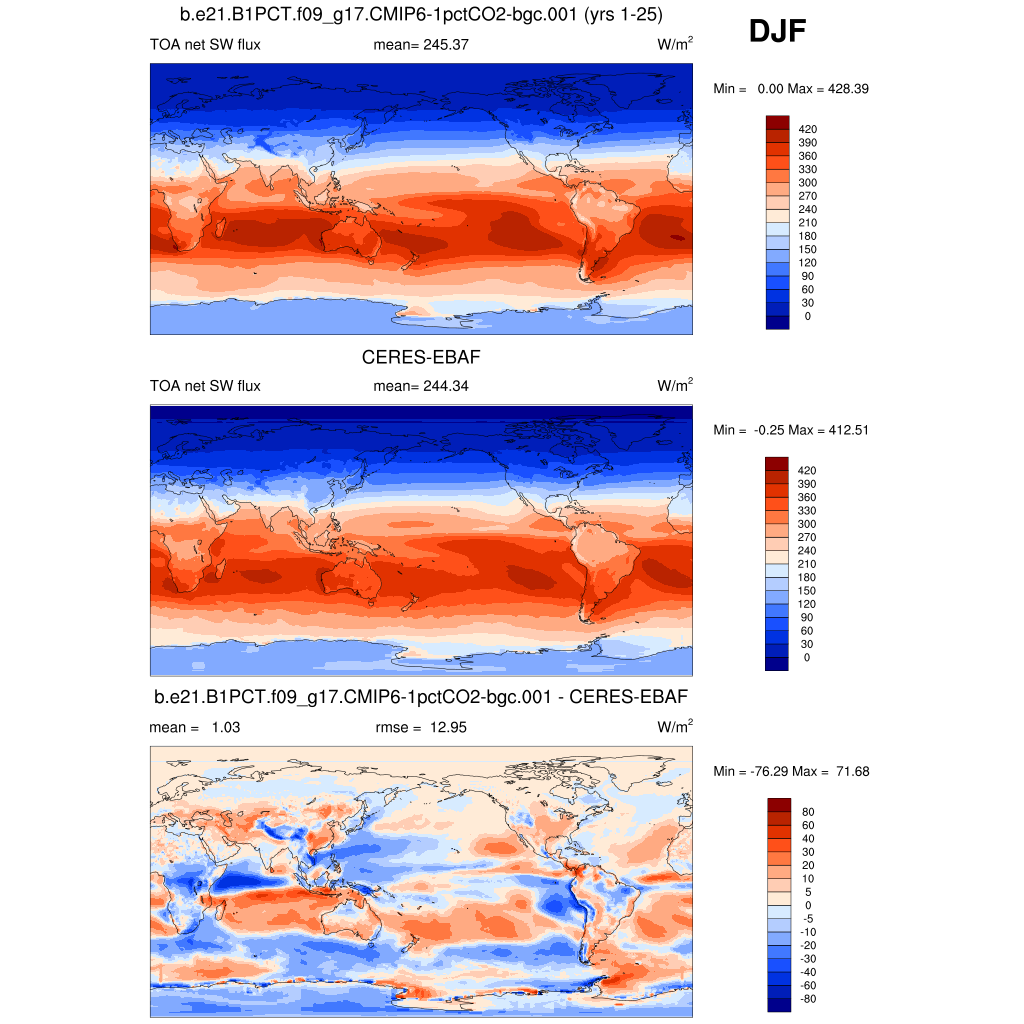
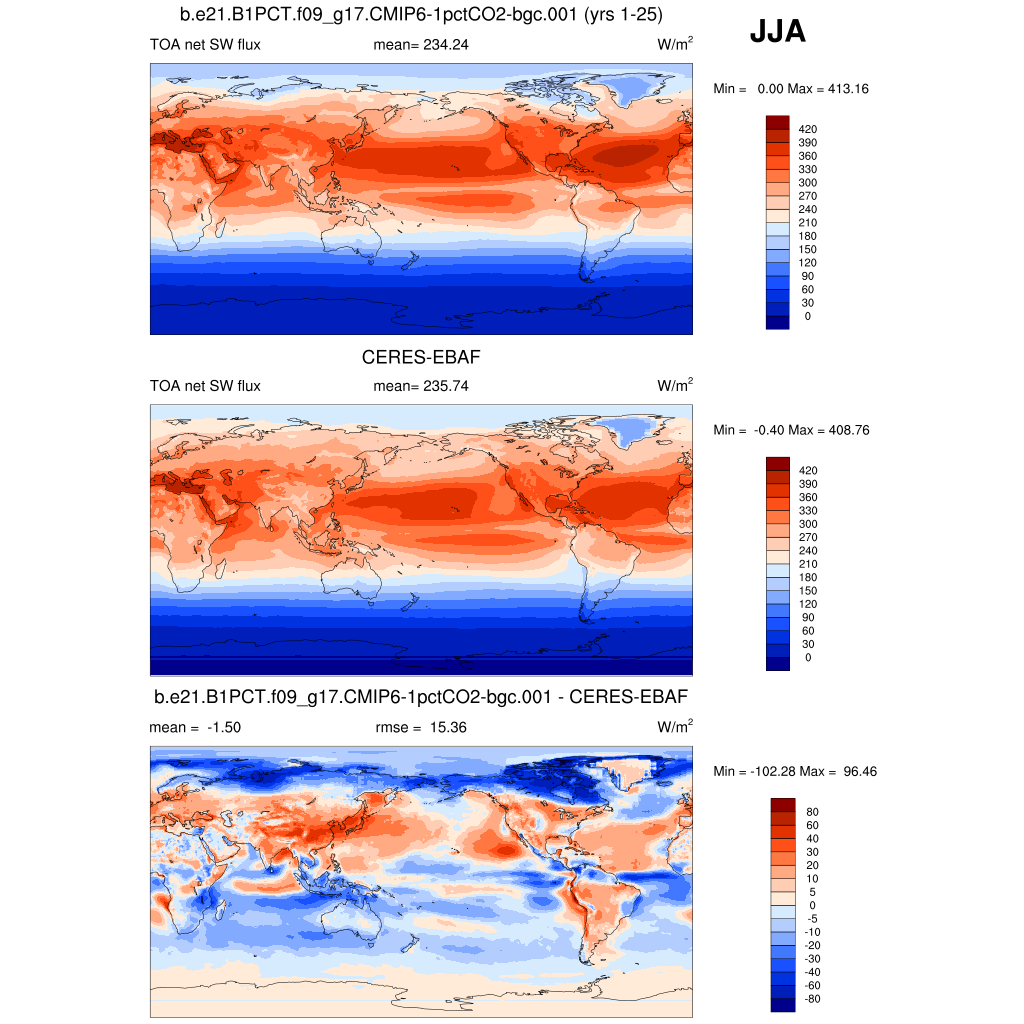
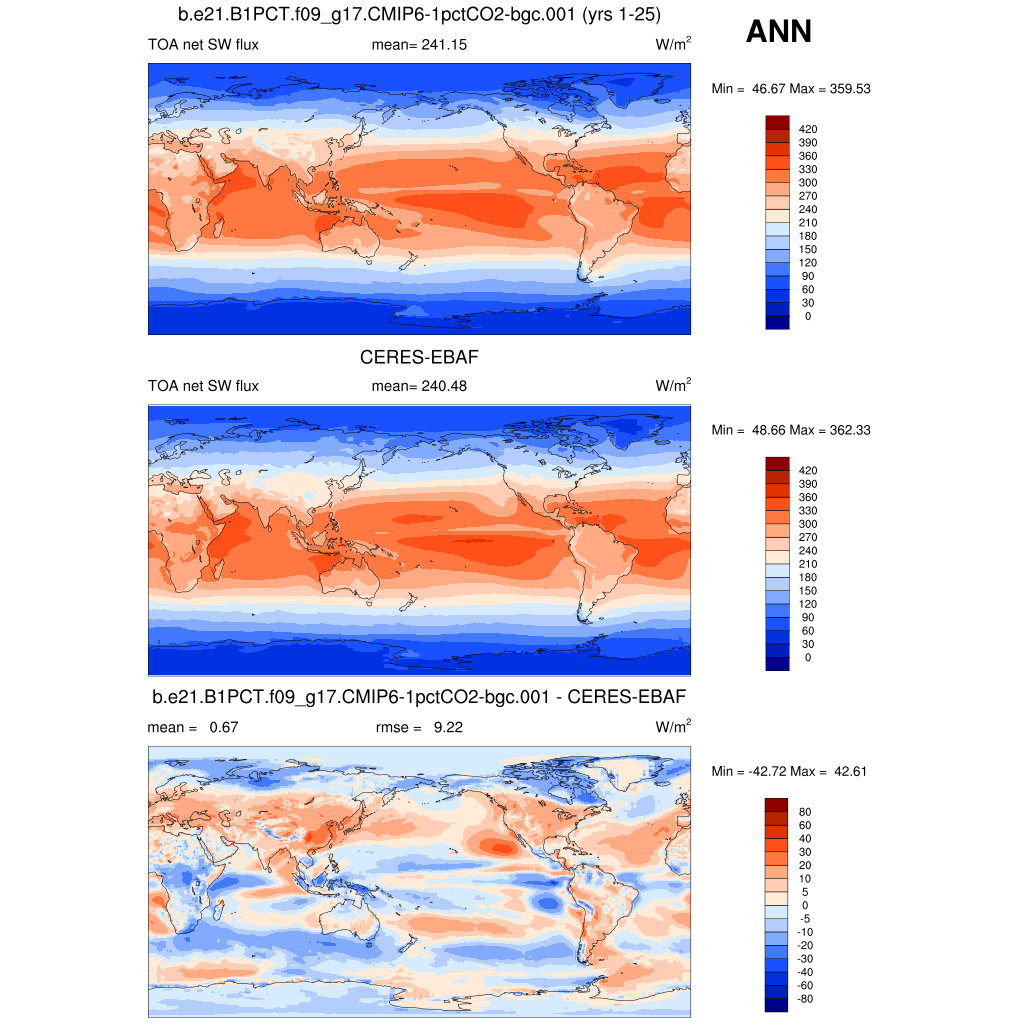
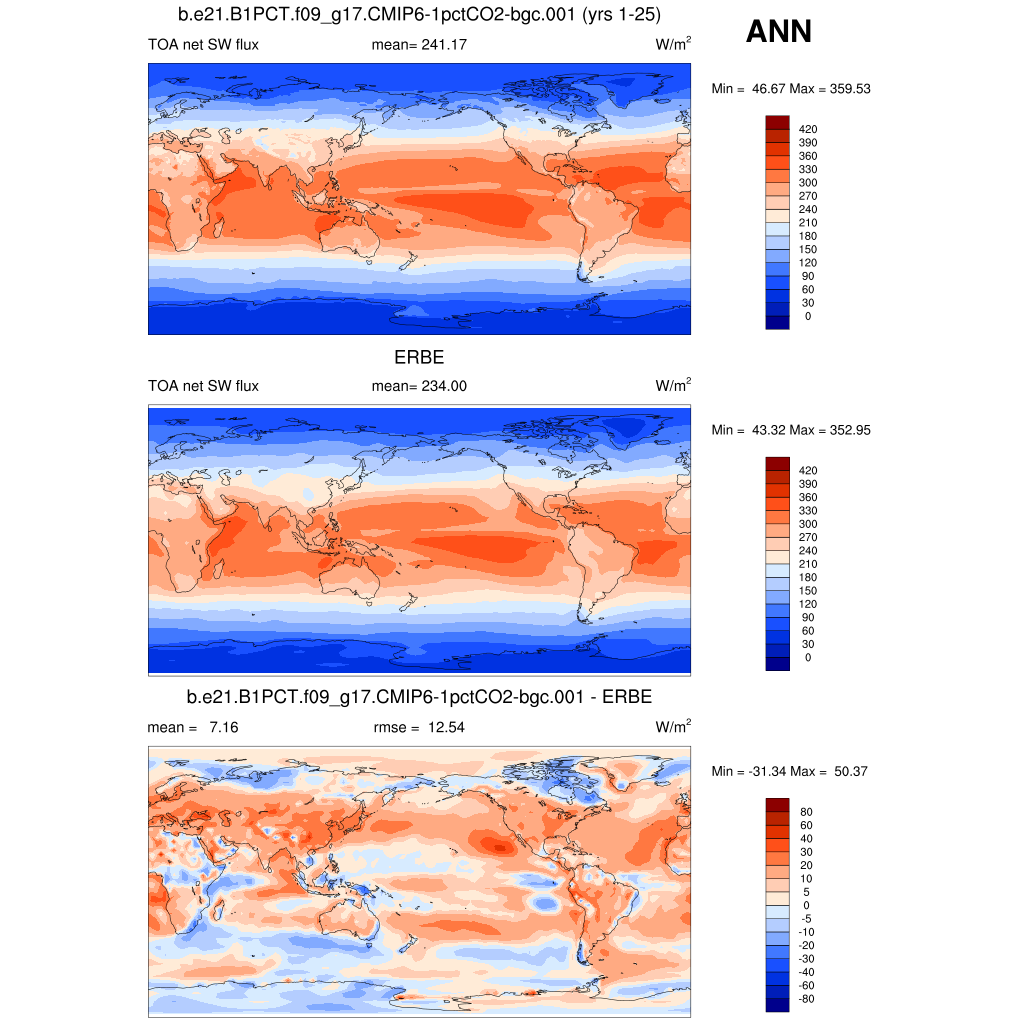
| FSNTOA * | TOA net SW flux | plot | plot | plot |
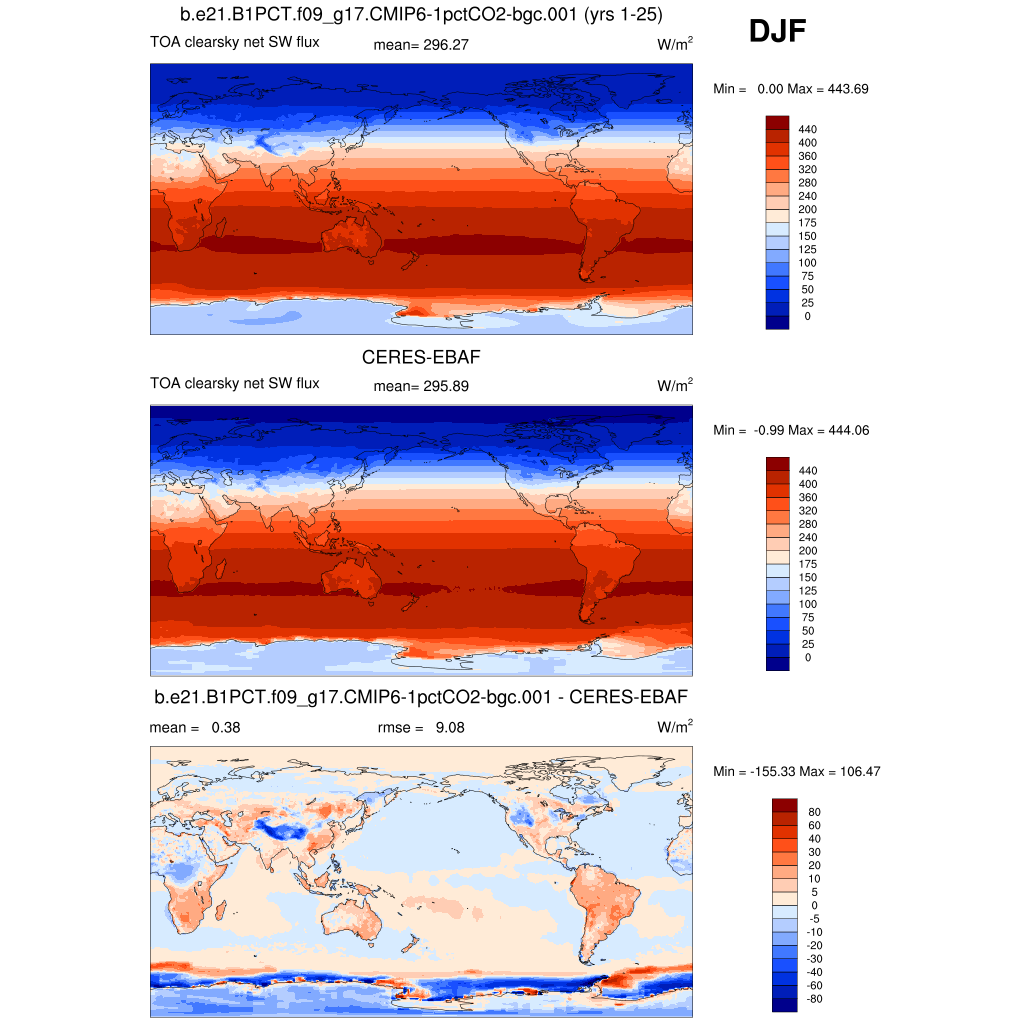
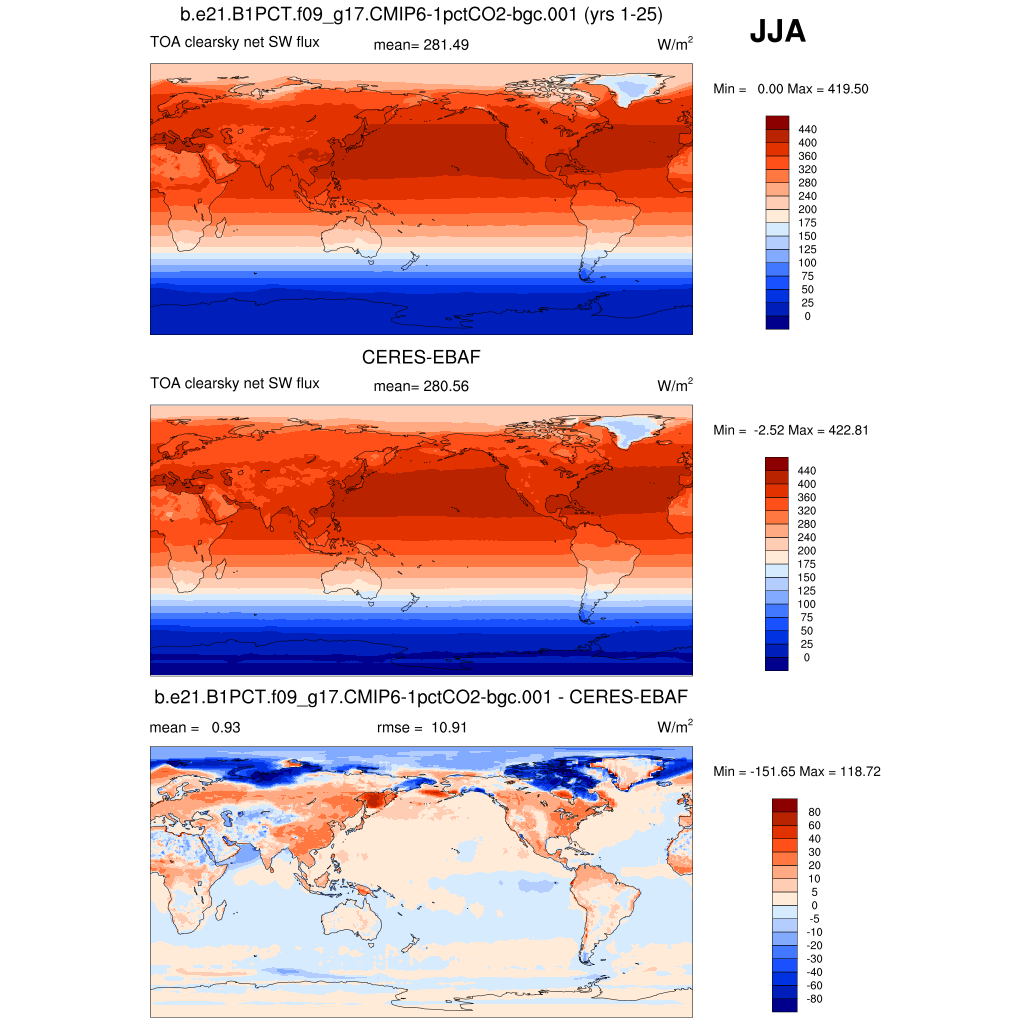
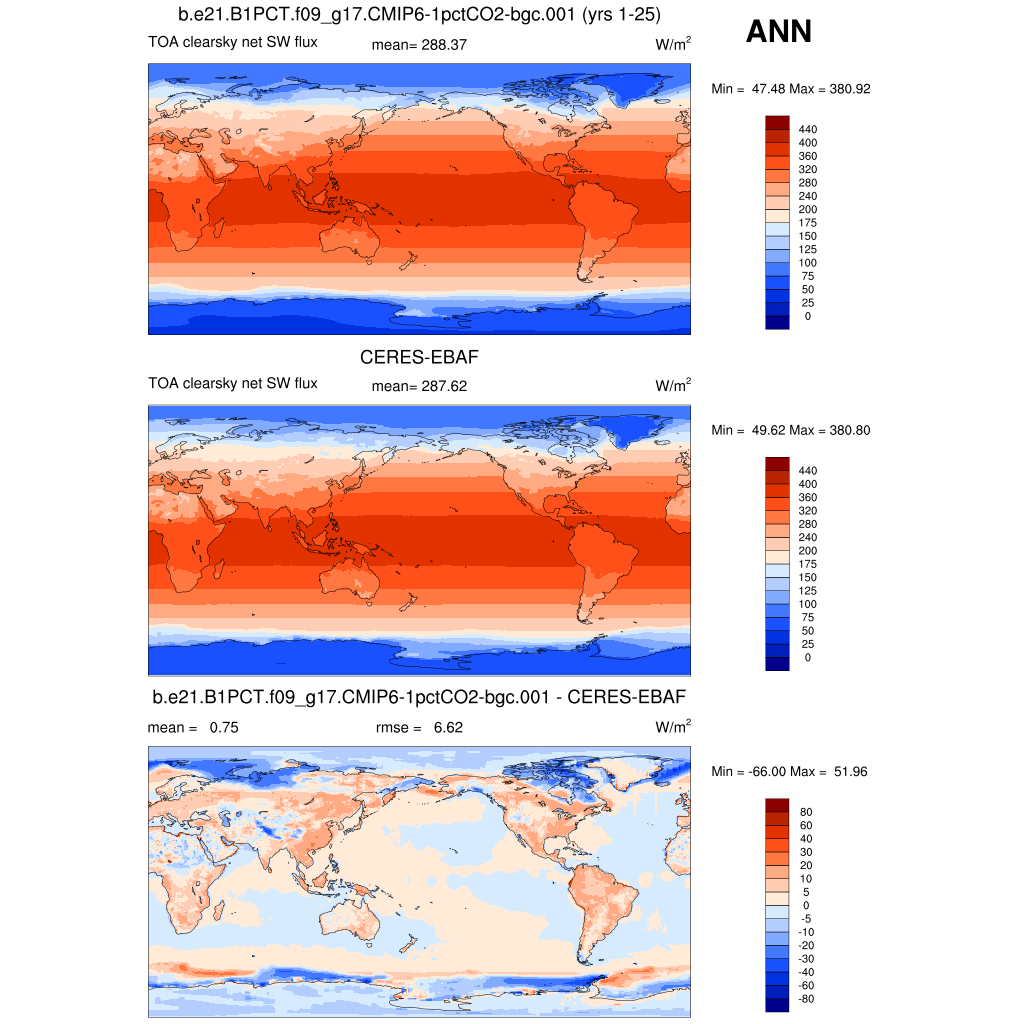
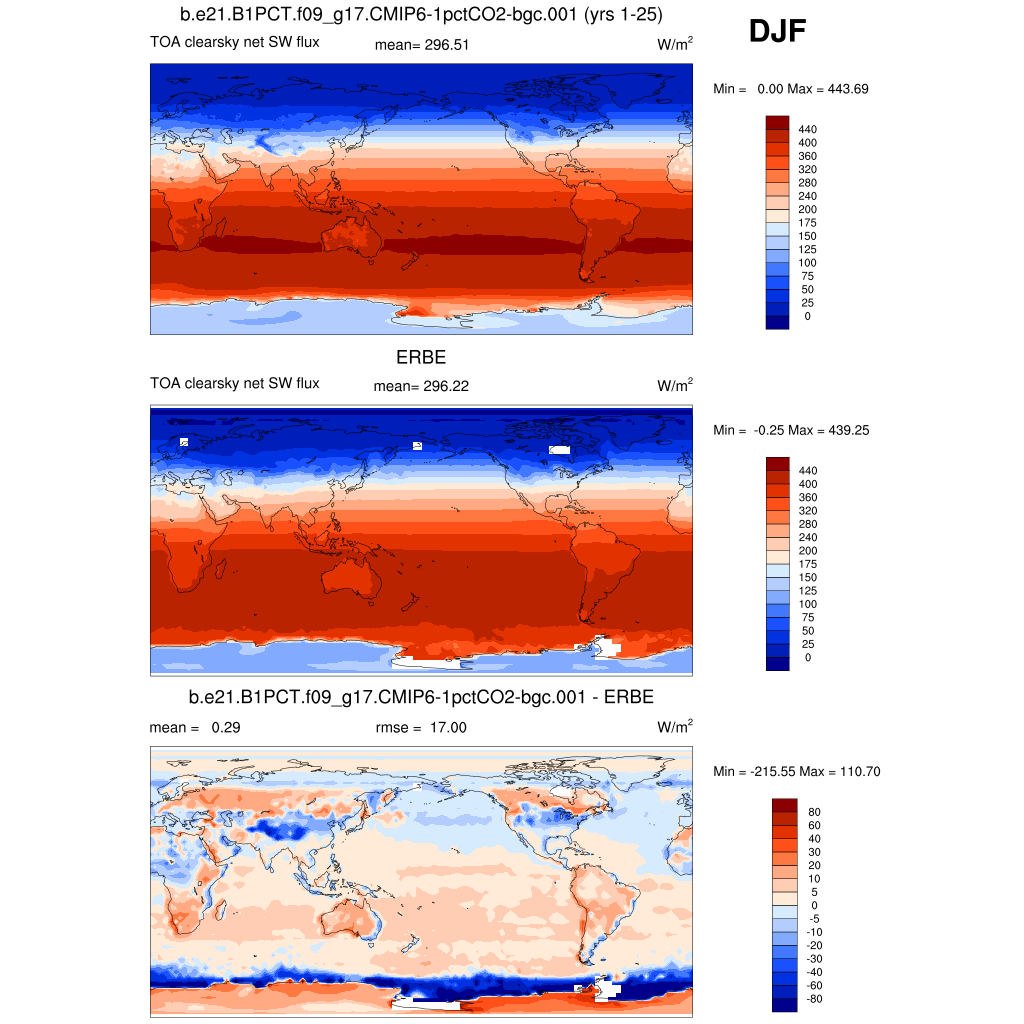
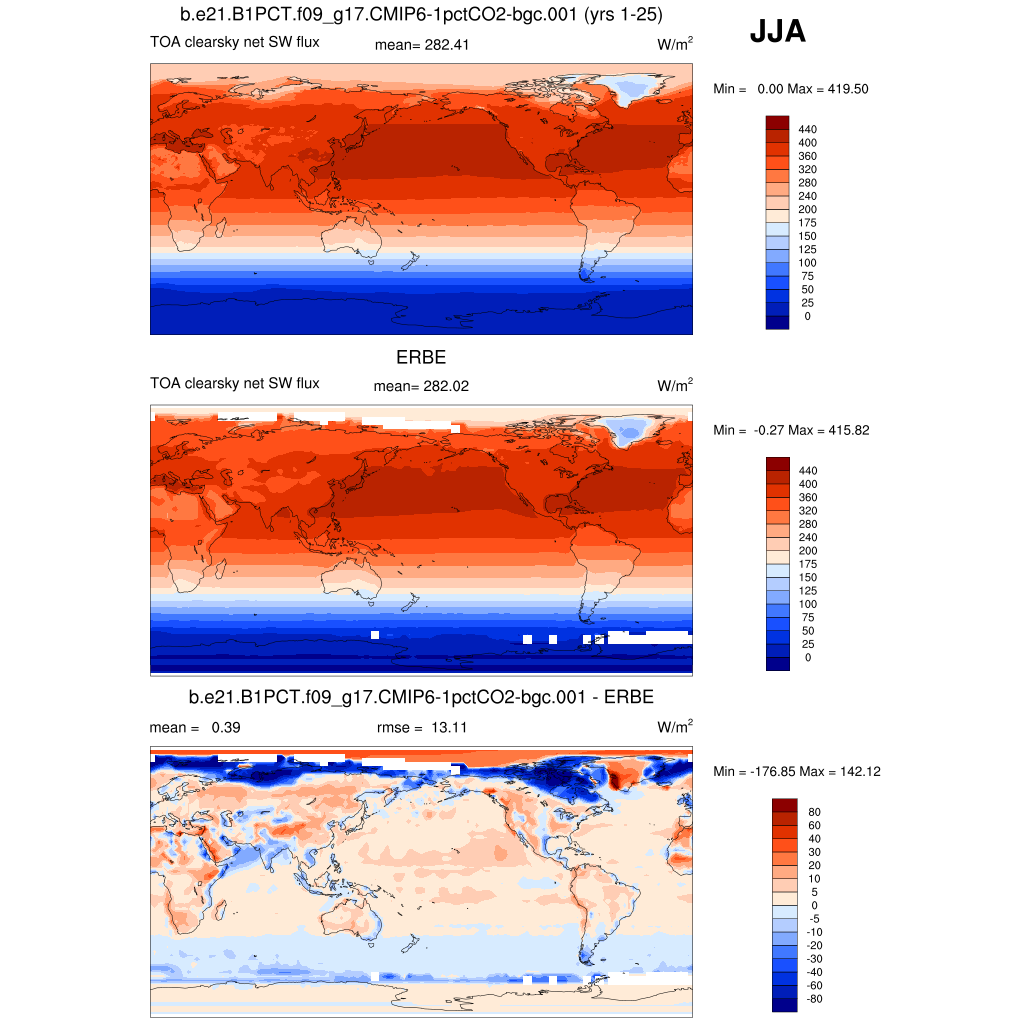
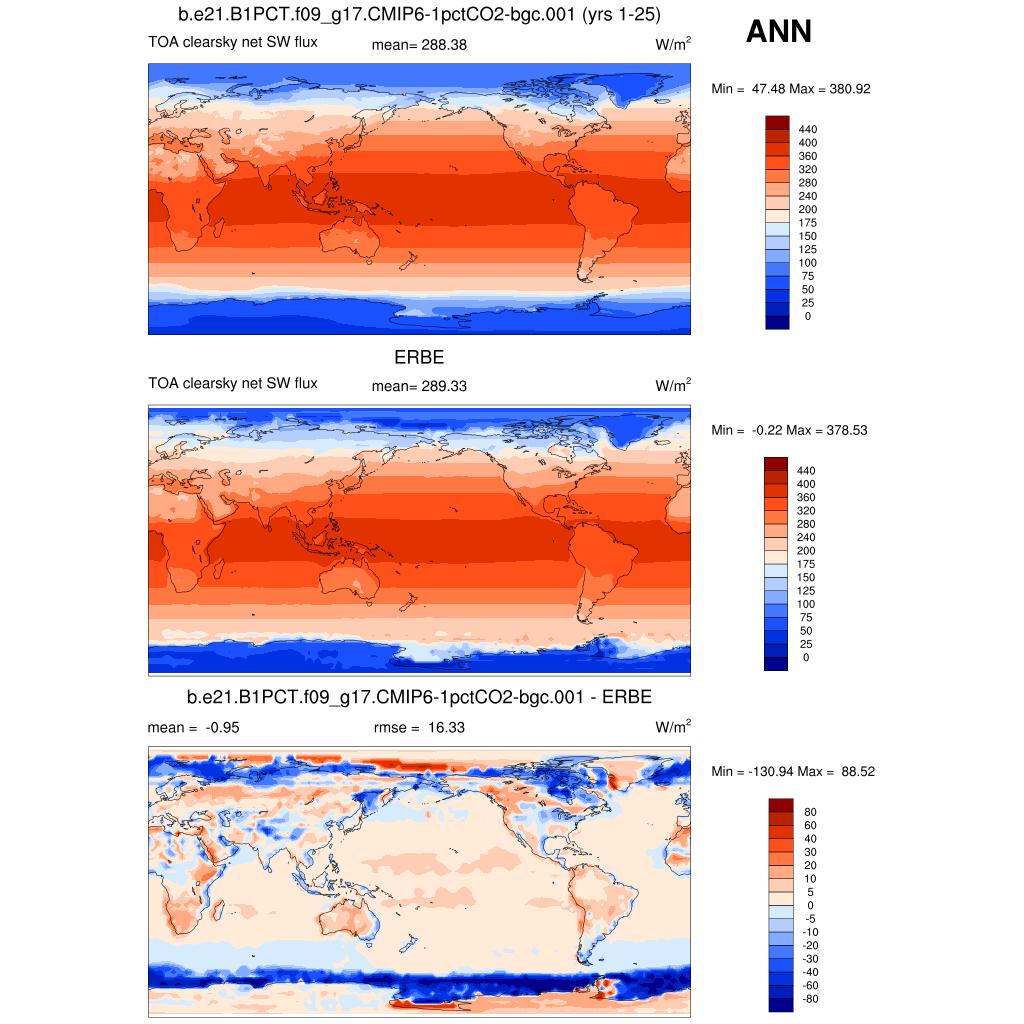
| FSNTOAC | TOA clearsky net SW flux | plot | plot | plot |
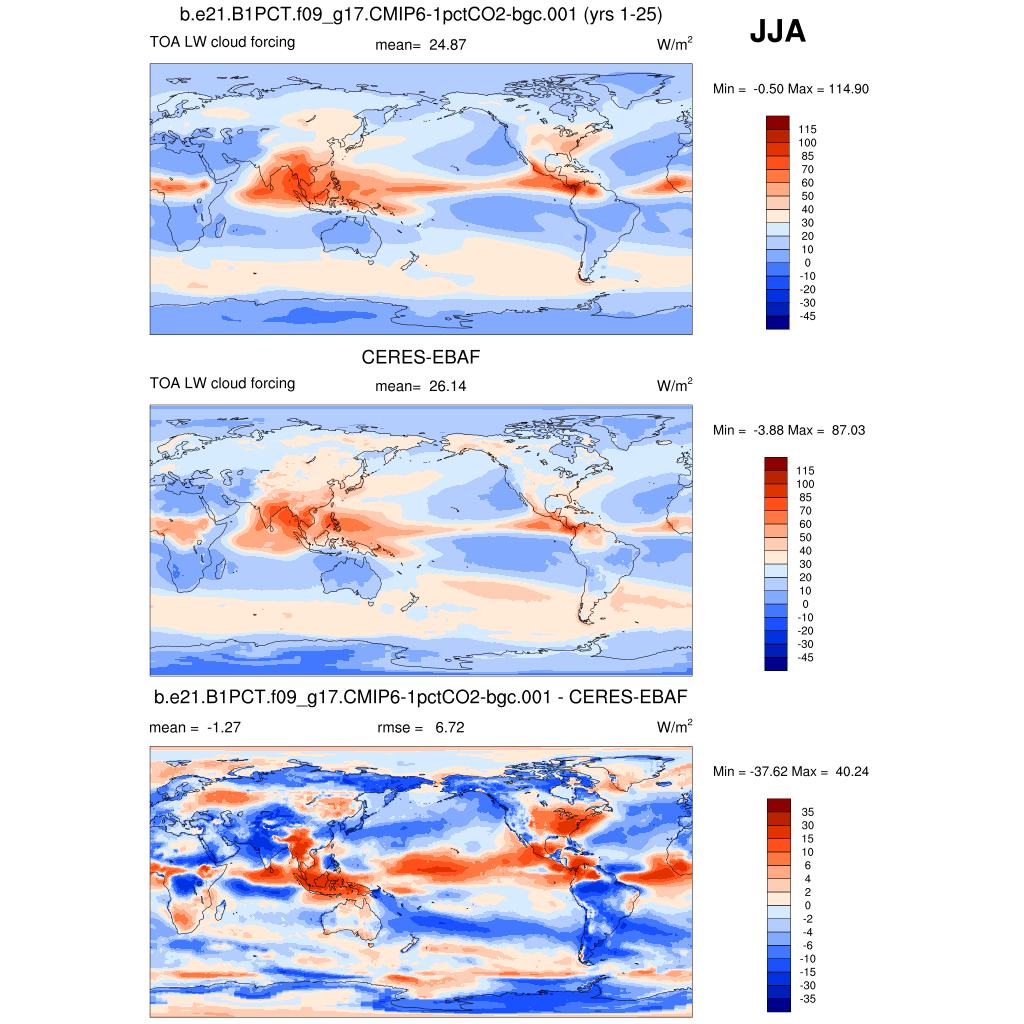
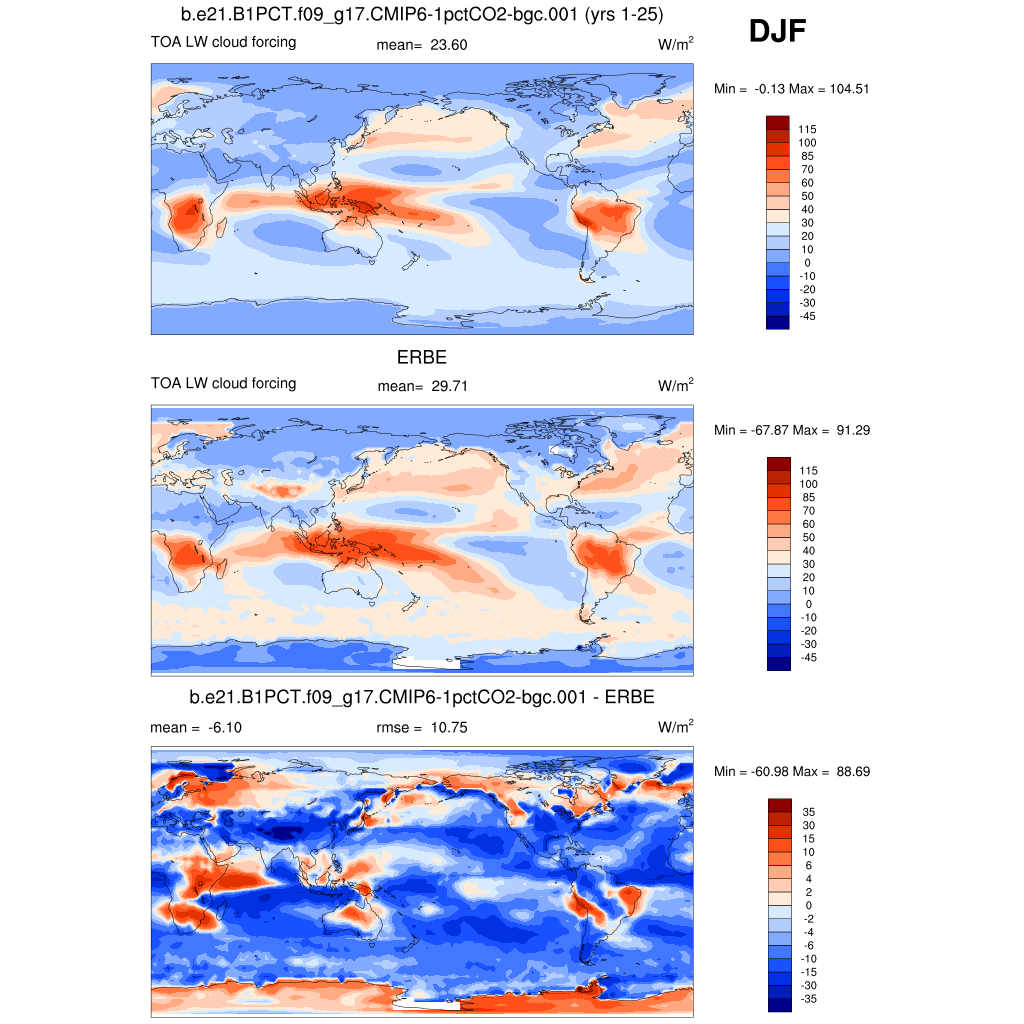
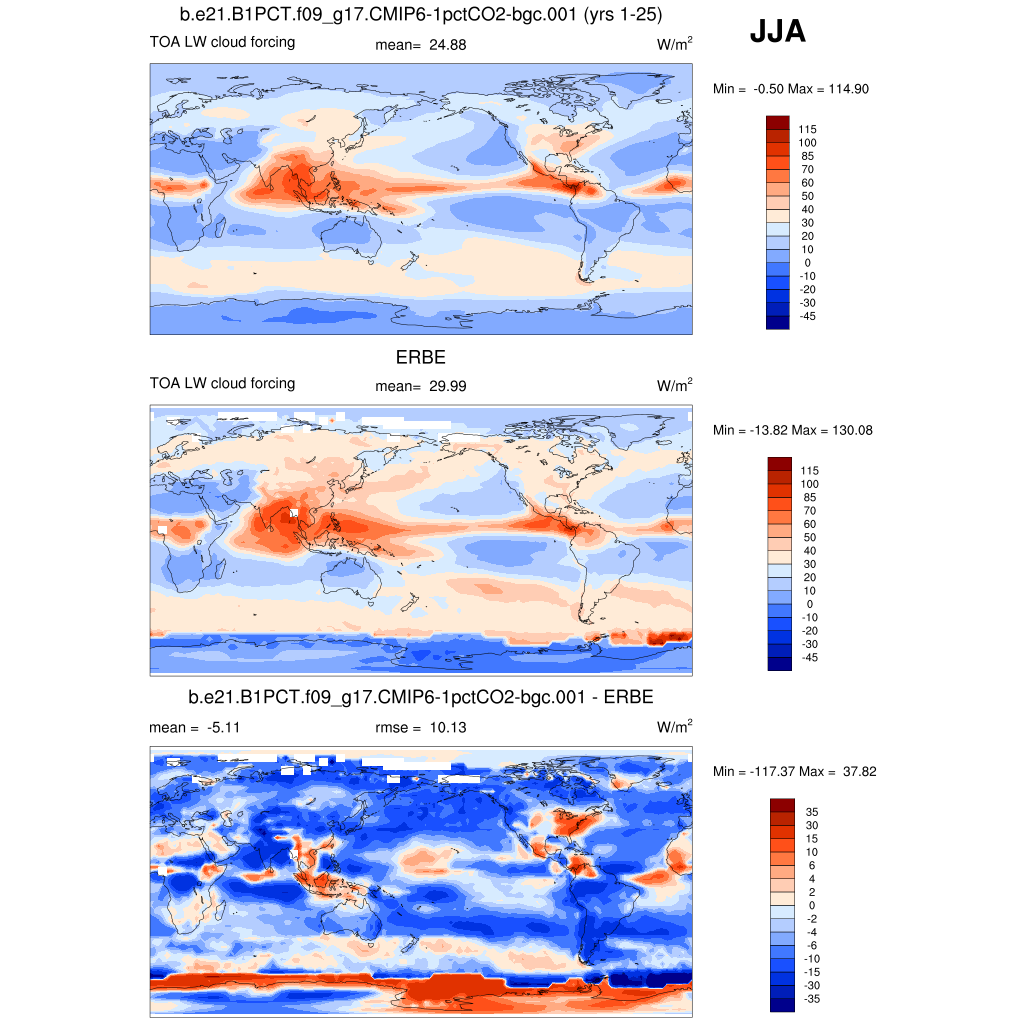
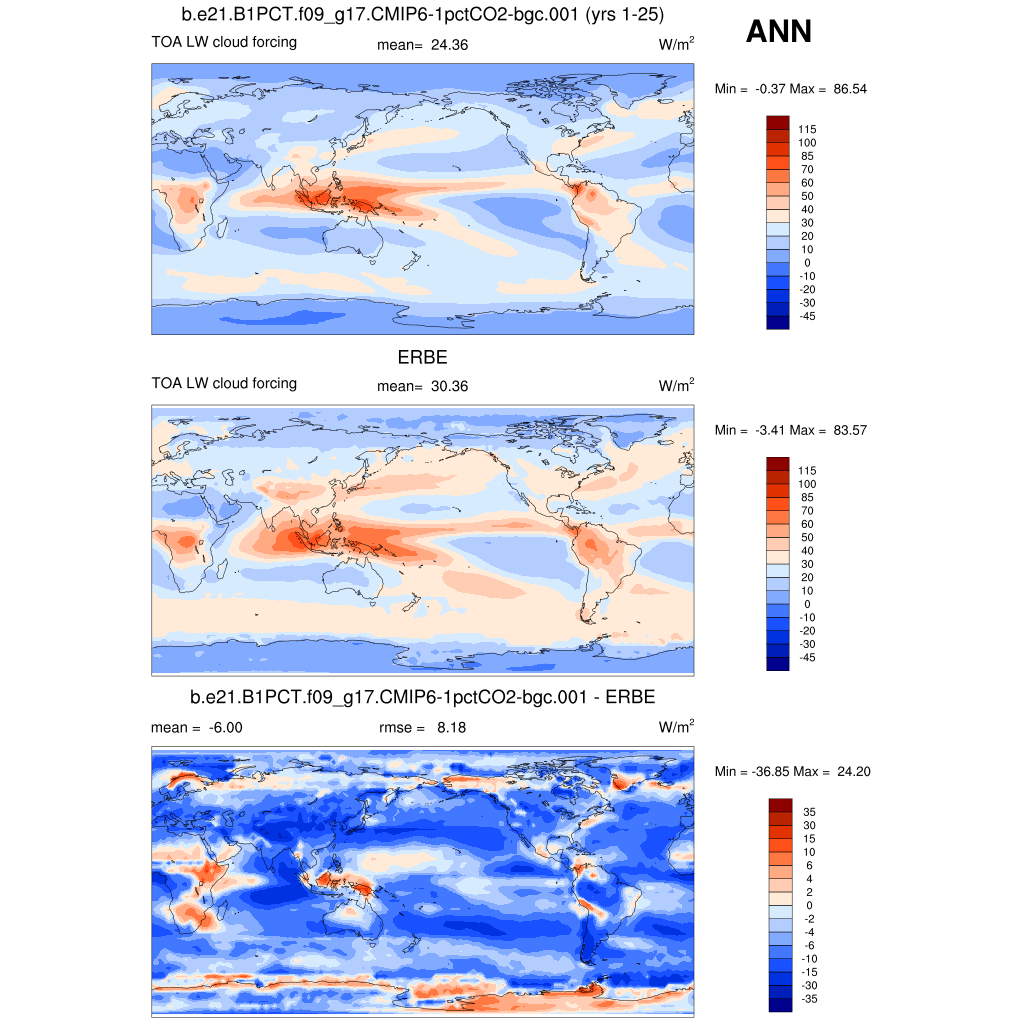
| LWCF * | TOA longwave cloud forcing | plot | plot | plot |
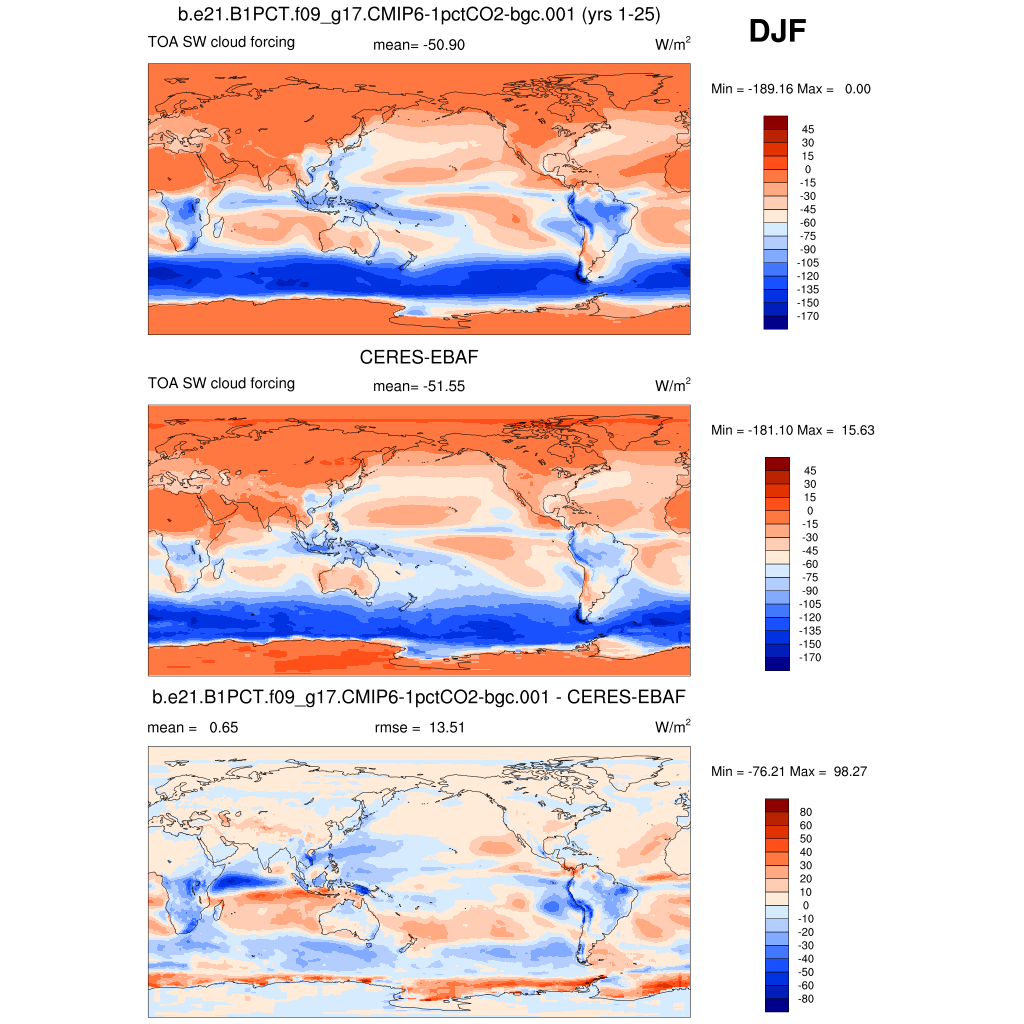
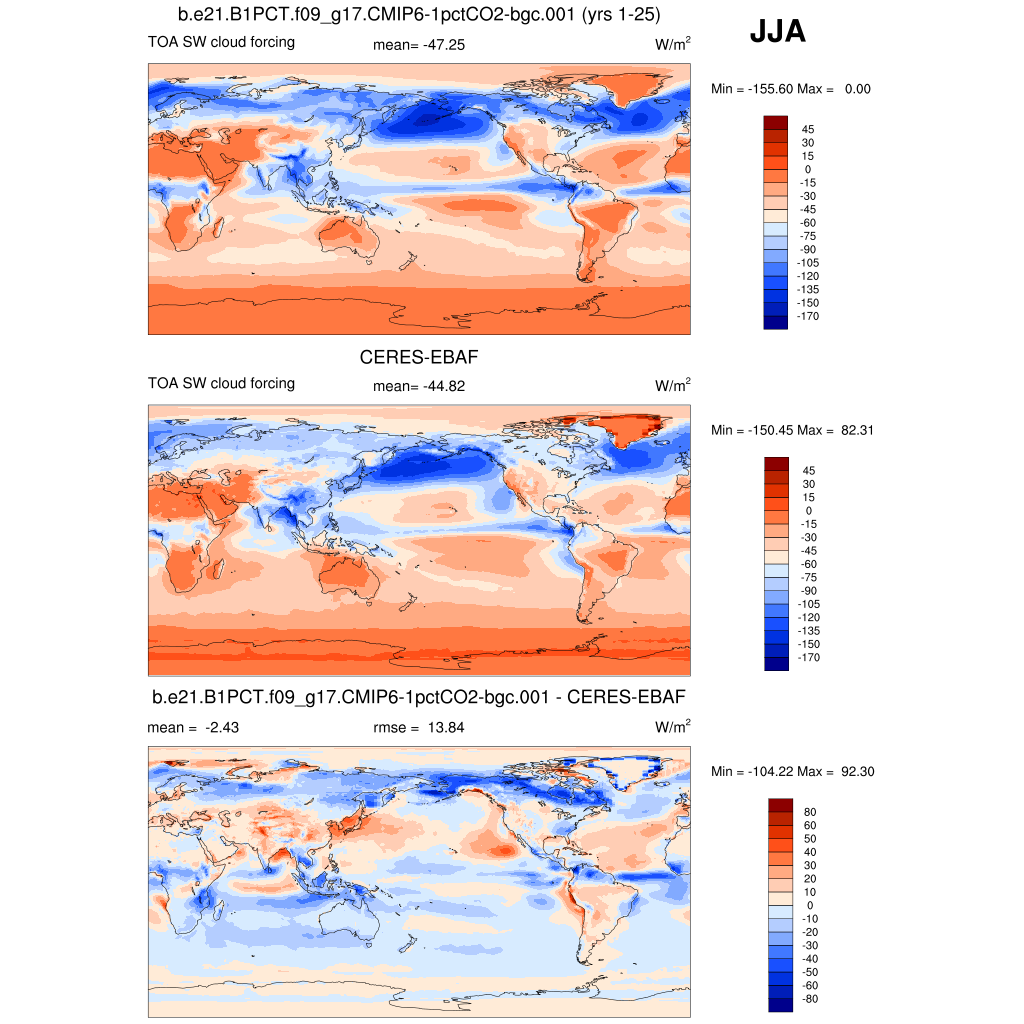
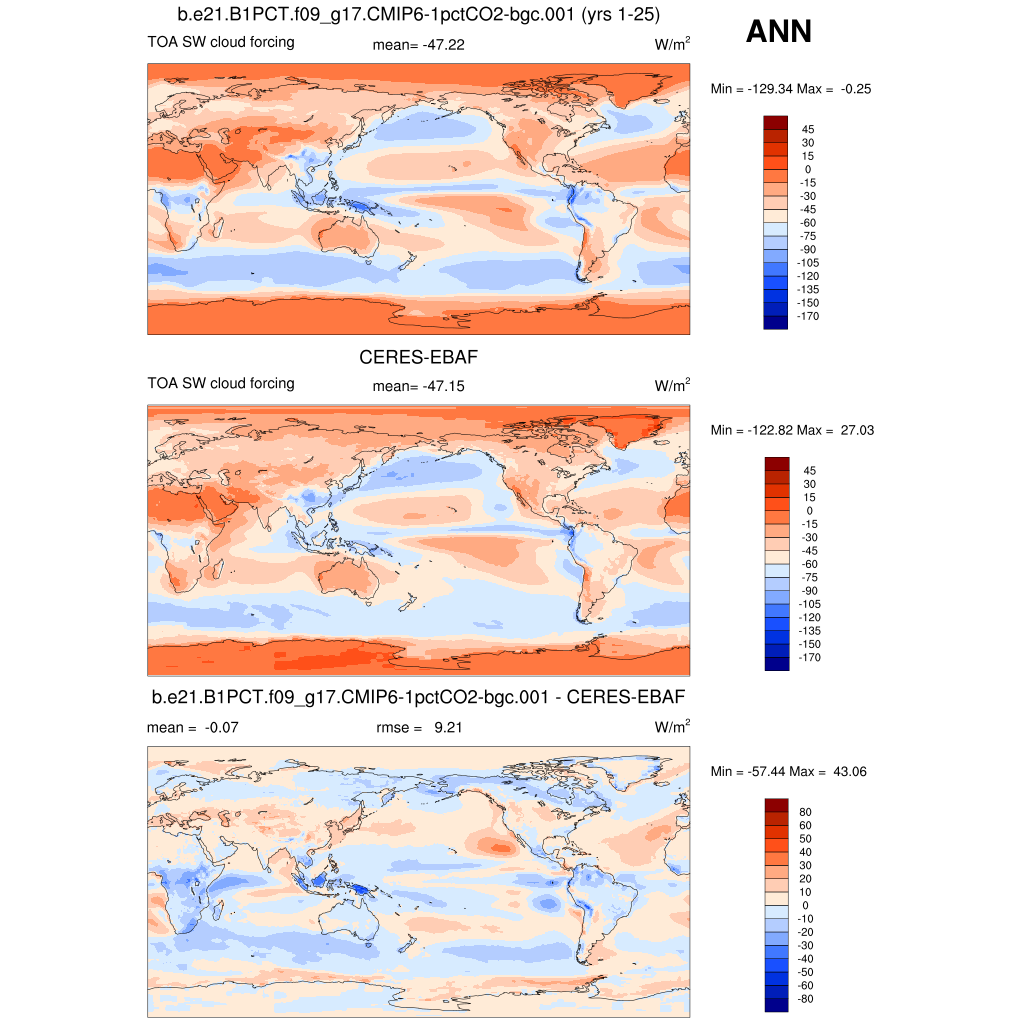
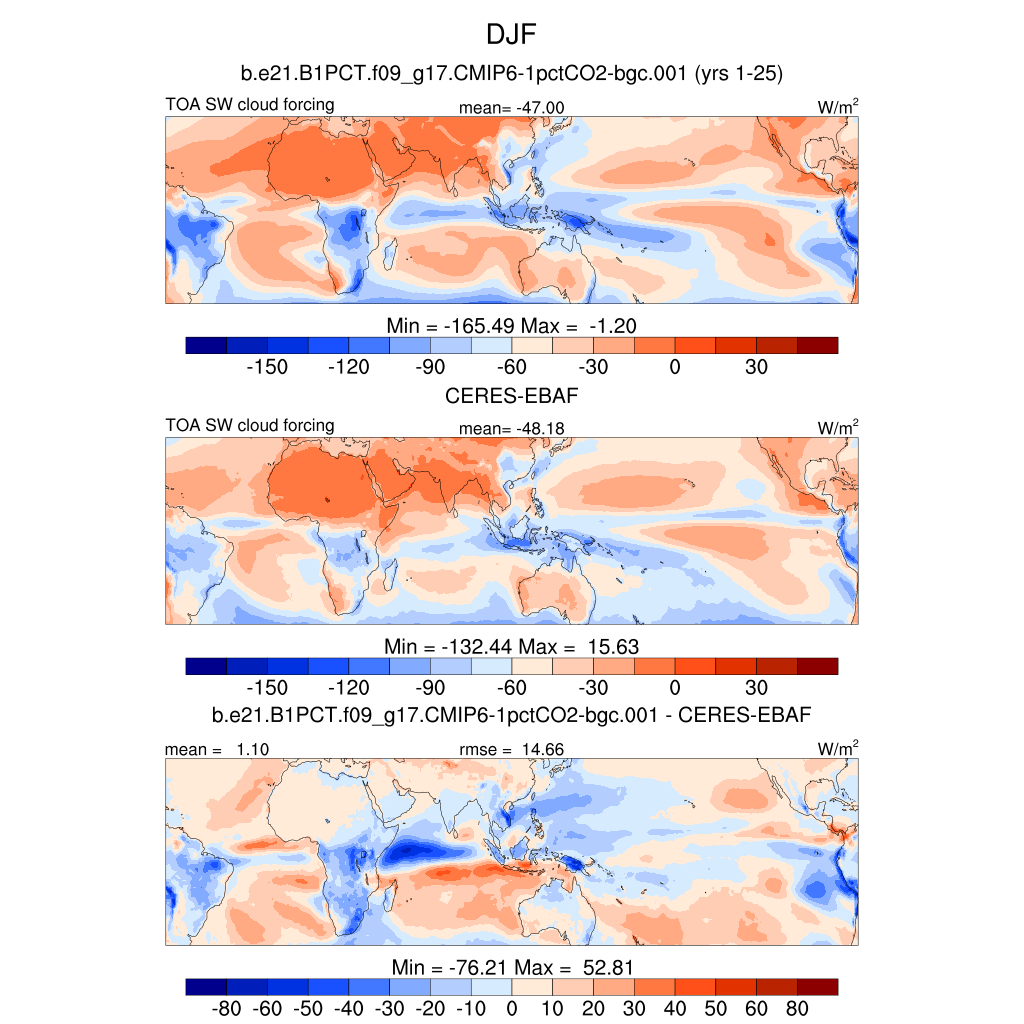
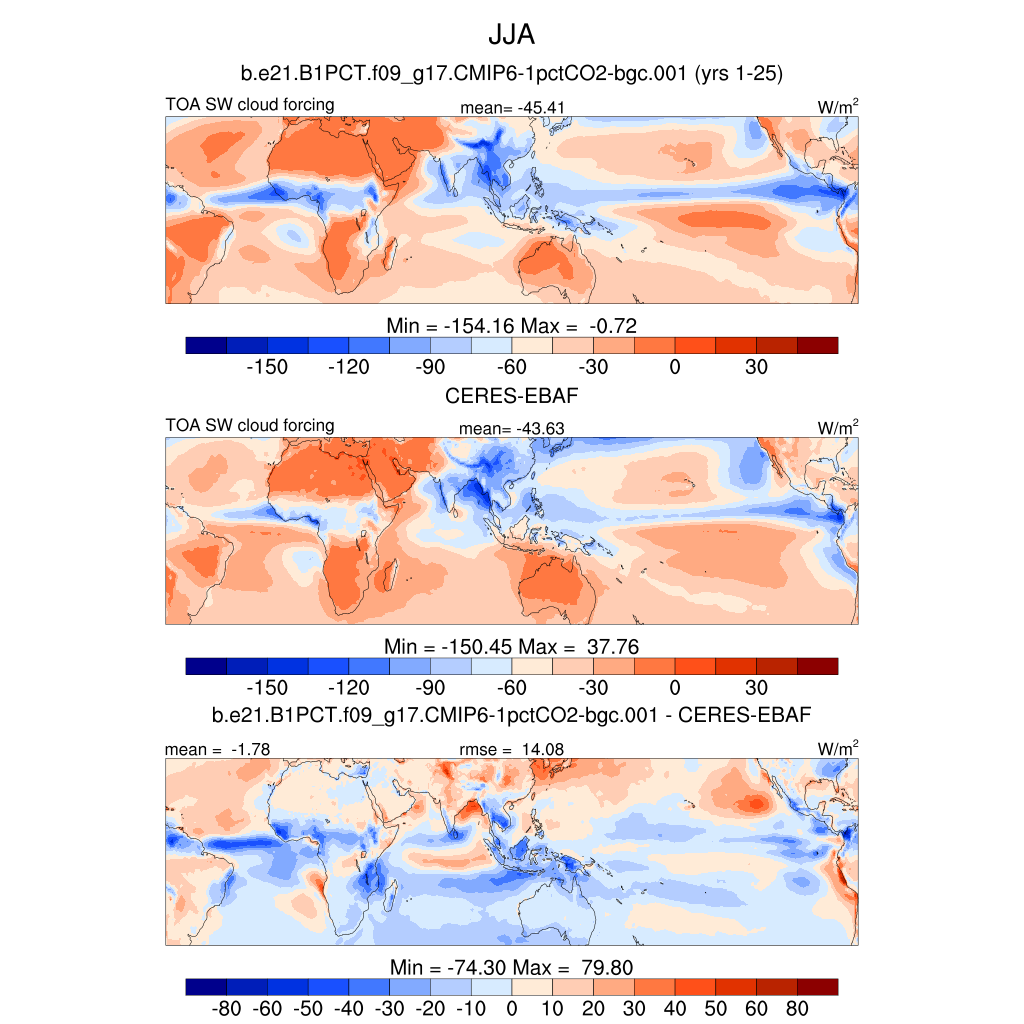
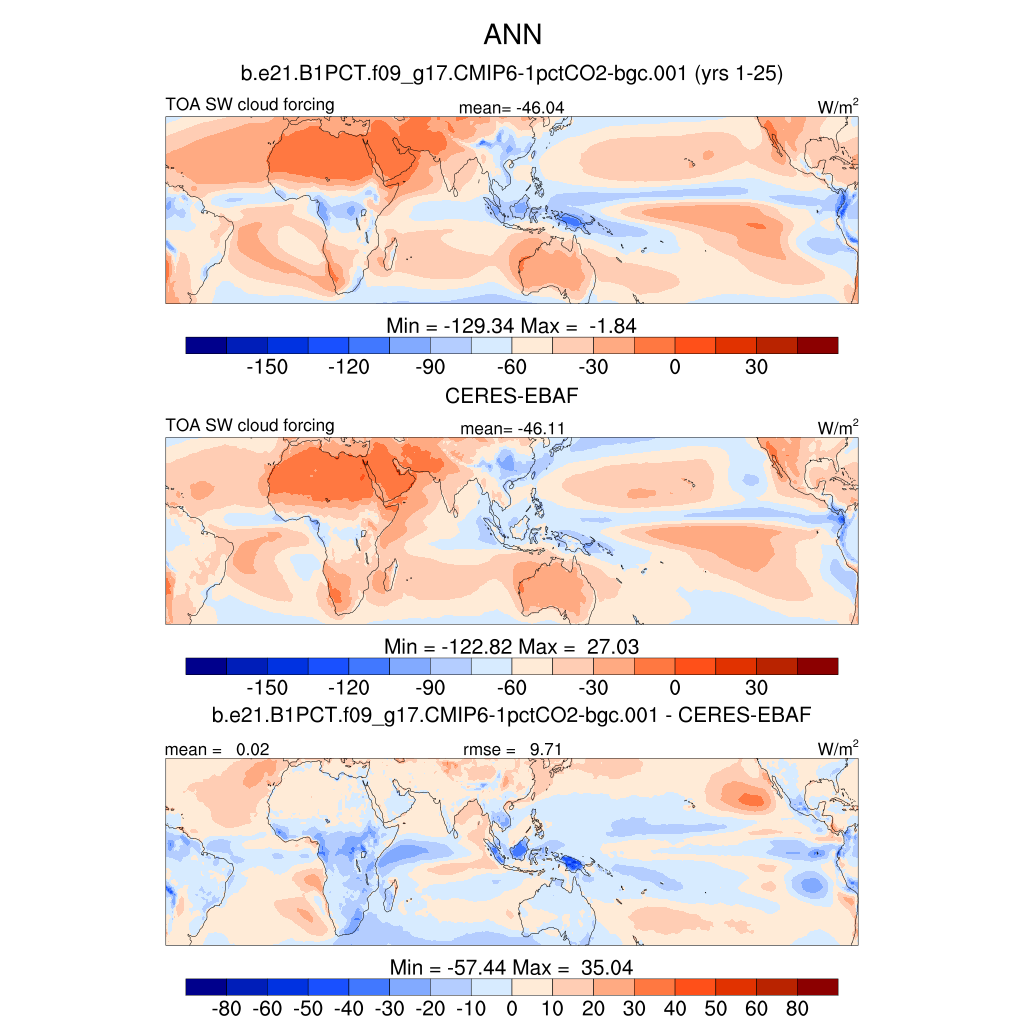
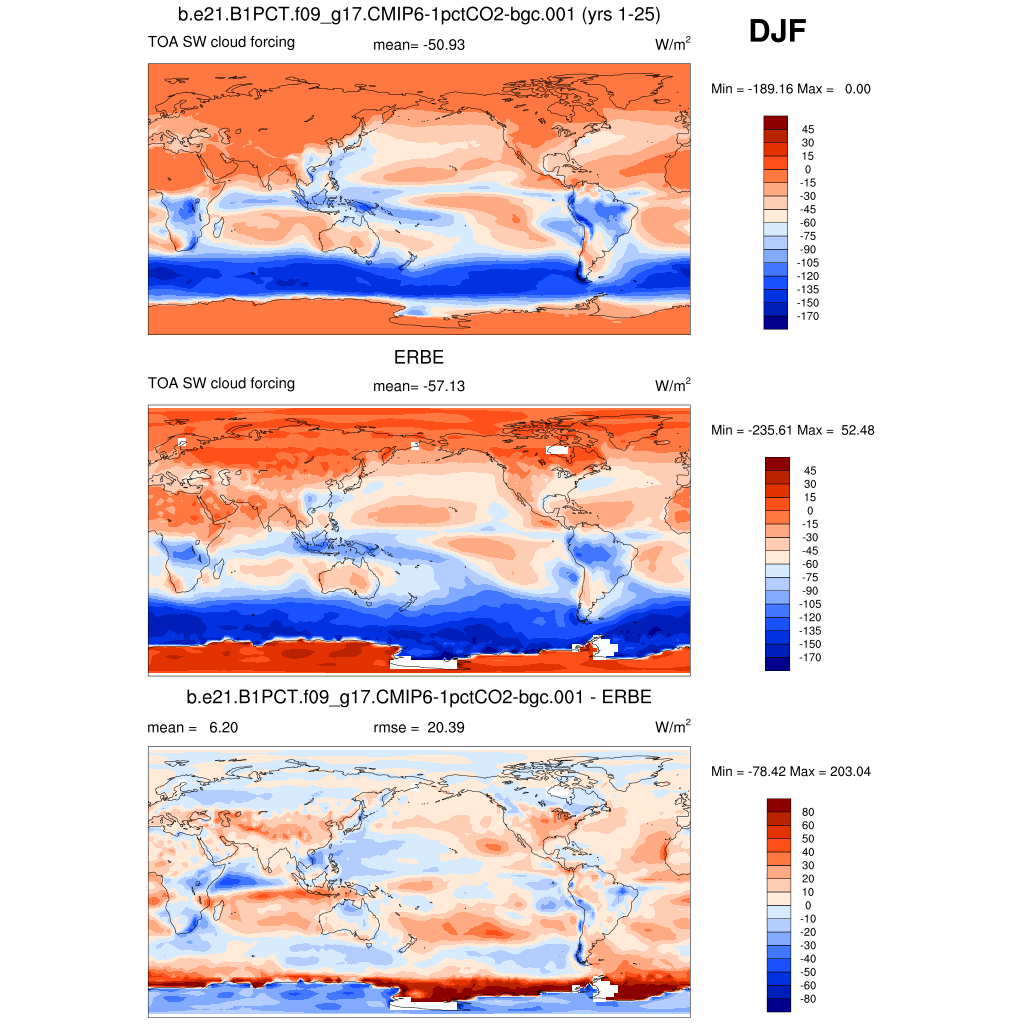
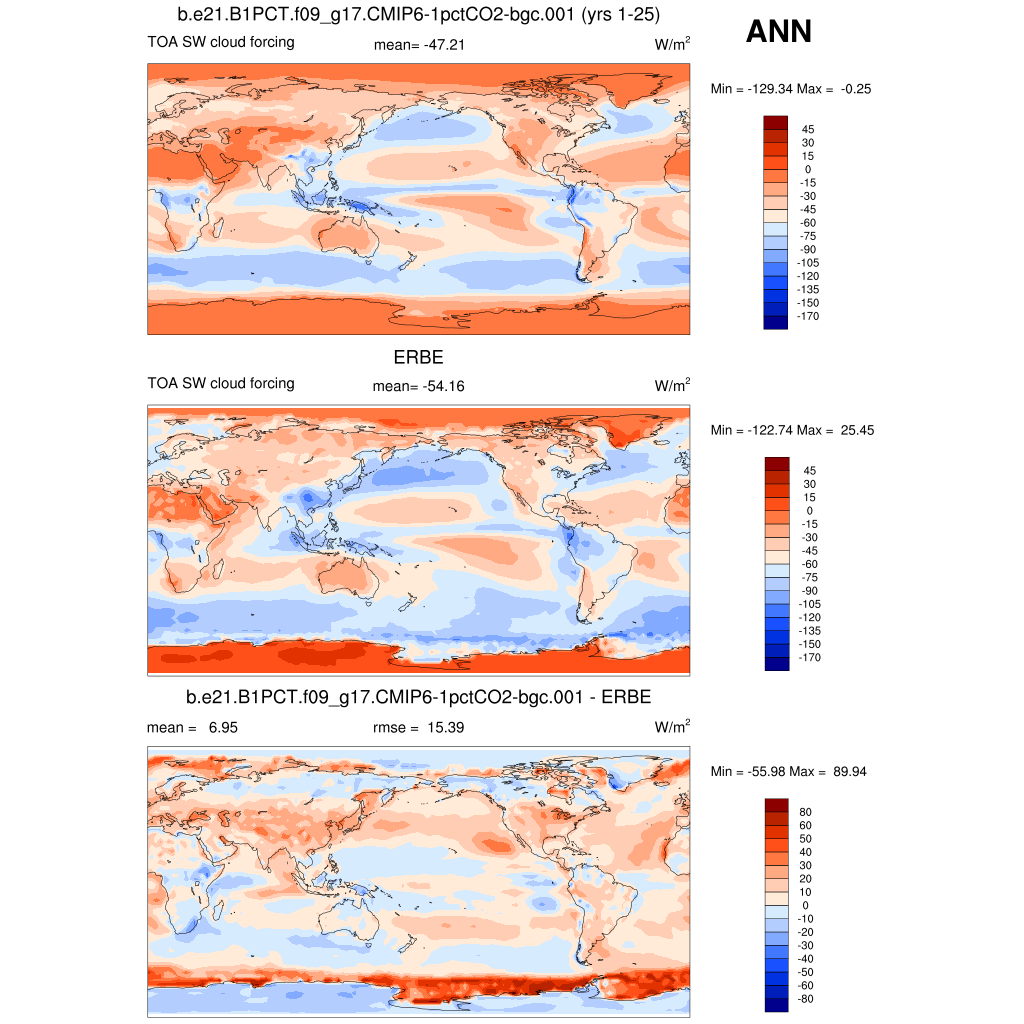
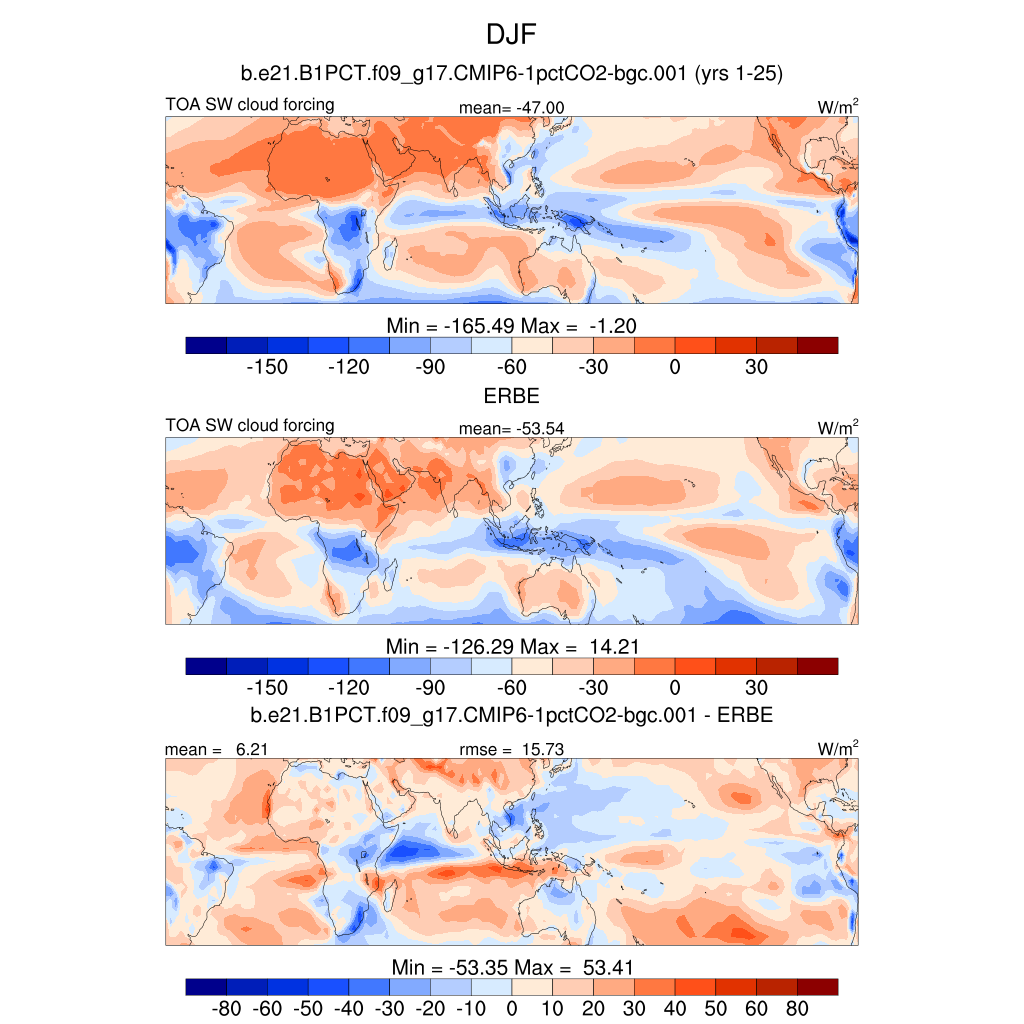
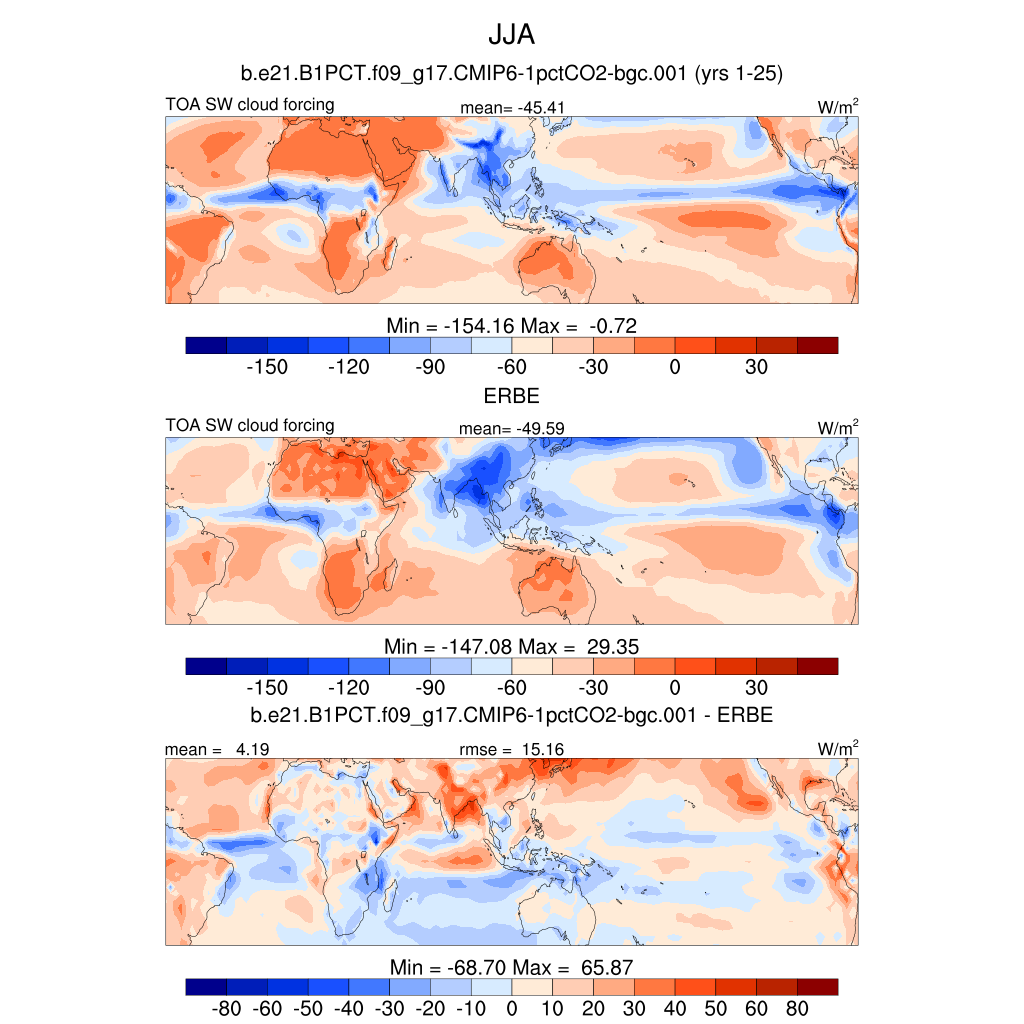
| SWCF * | TOA shortwave cloud forcing | plot | plot | plot |
| SWCF TROP | Tropical TOA SW cloud forcing | plot | plot | plot |
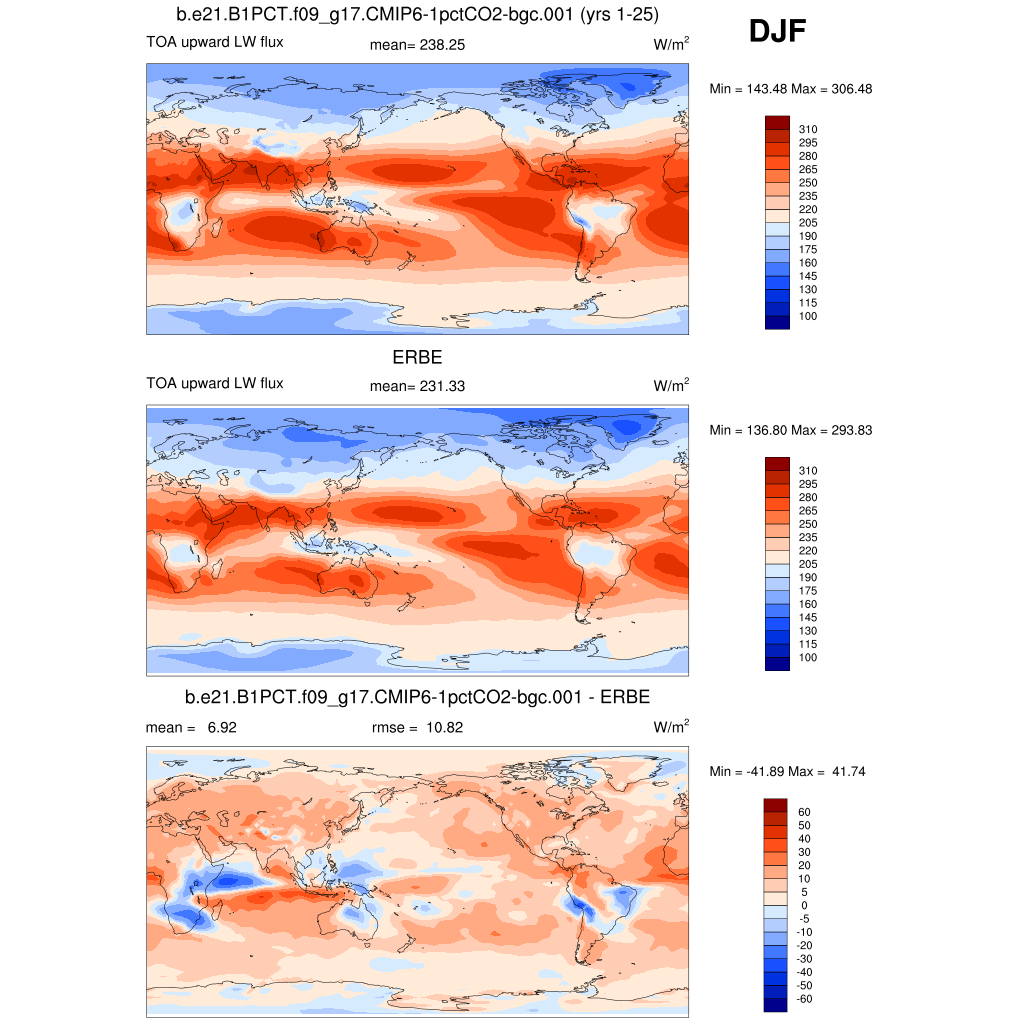
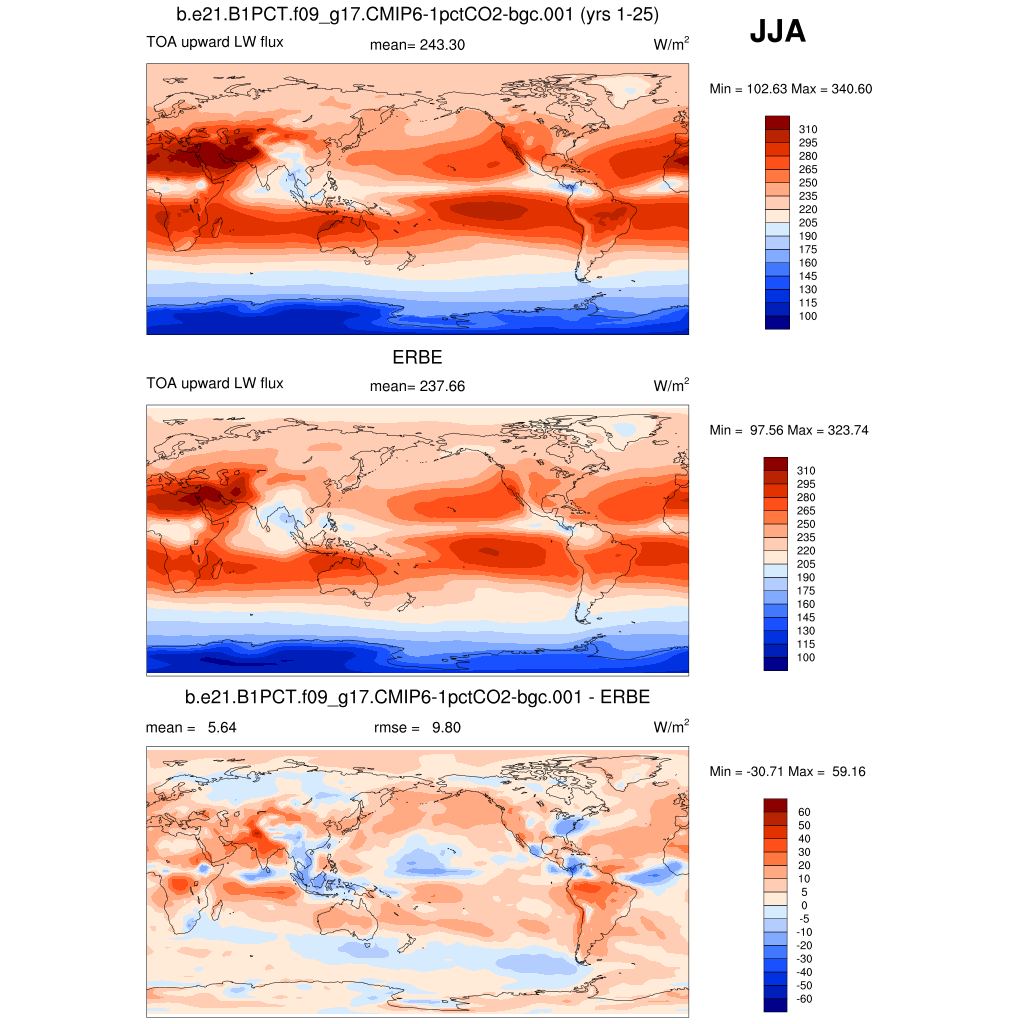
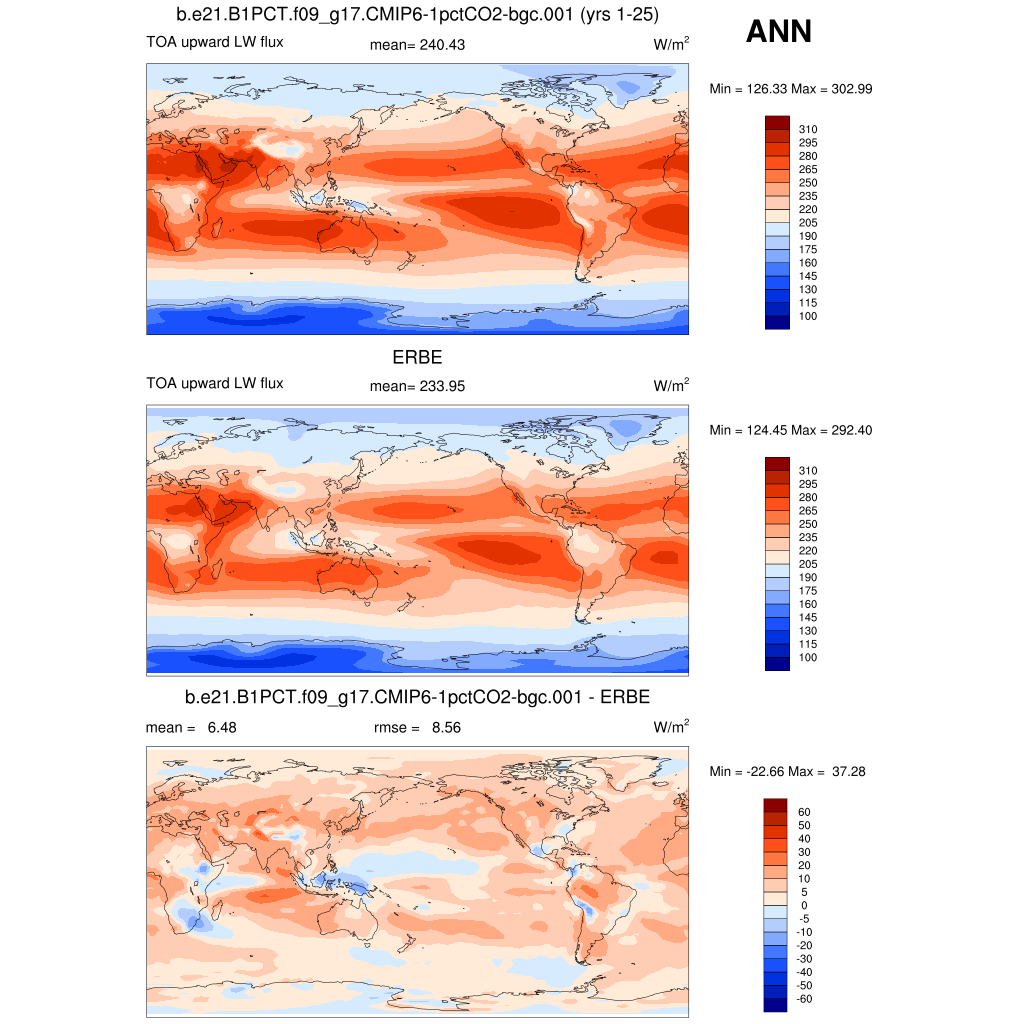
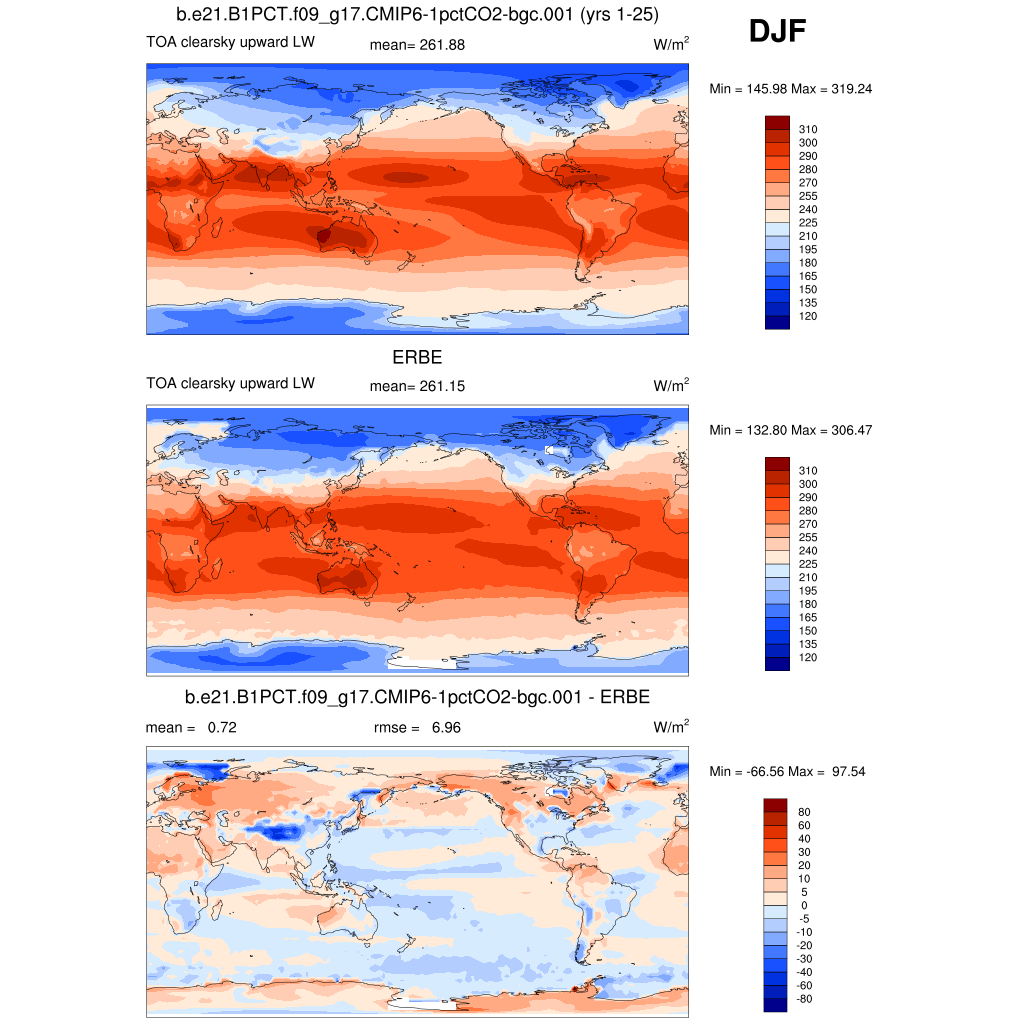
| ERBE Feb1985-Apr1989 | DJF | JJA | ANN | |
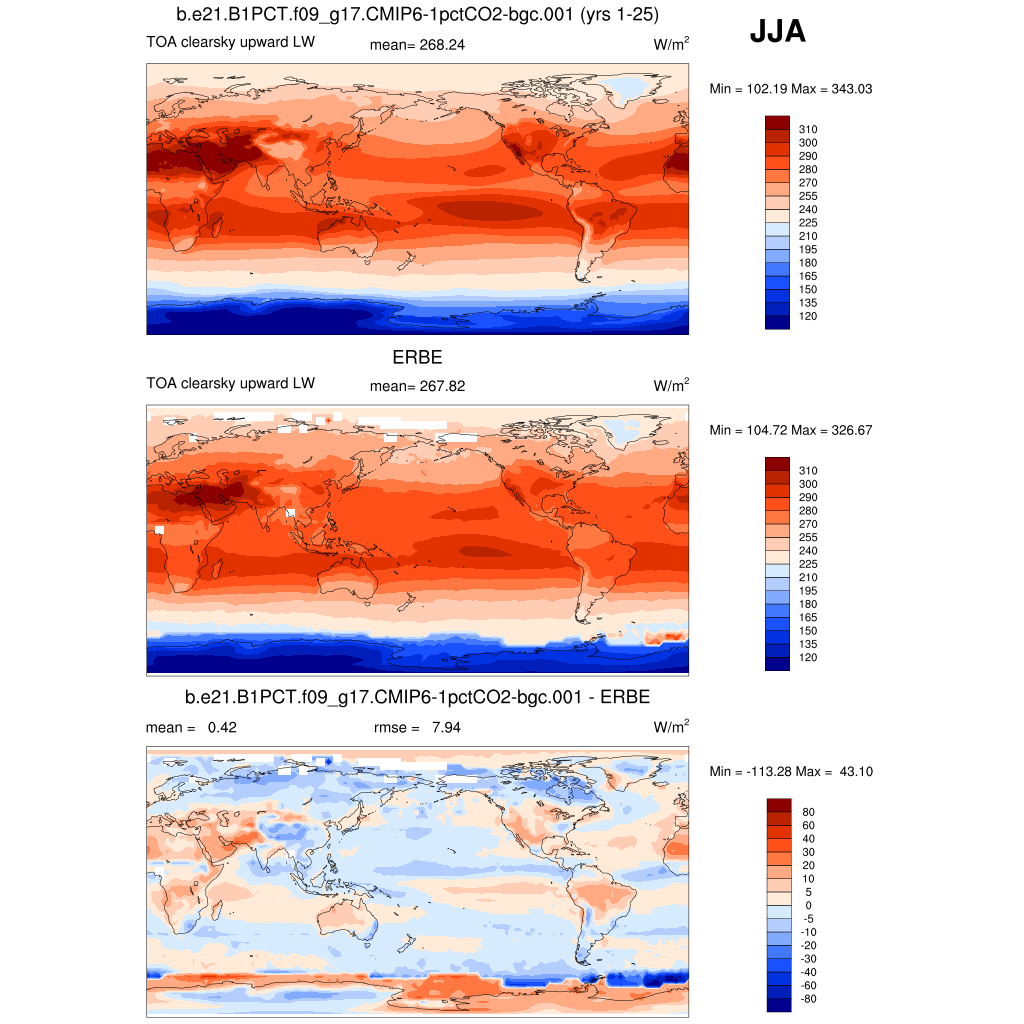
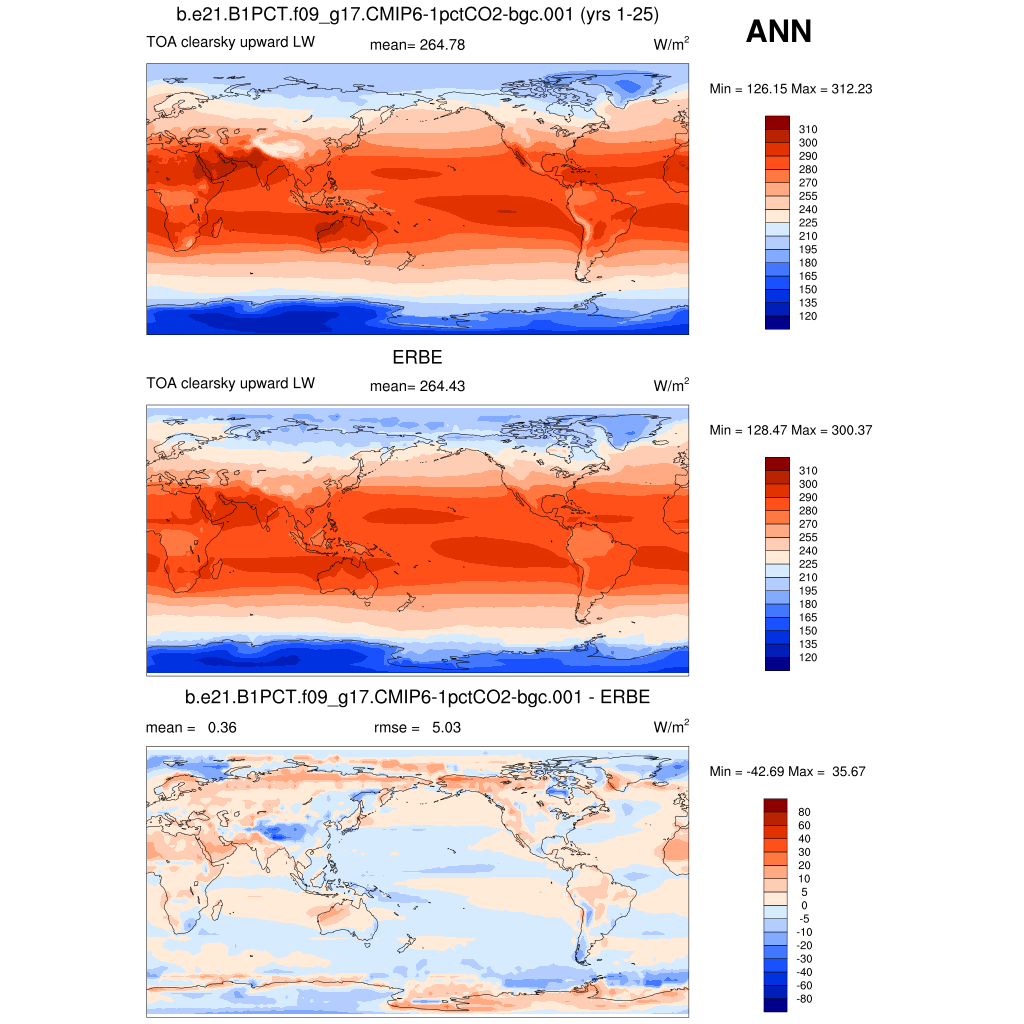
| FLUT * | TOA upward longwave flux | plot | plot | plot |
| FLUTC | TOA clearsky upward longwave flux | plot | plot | plot |
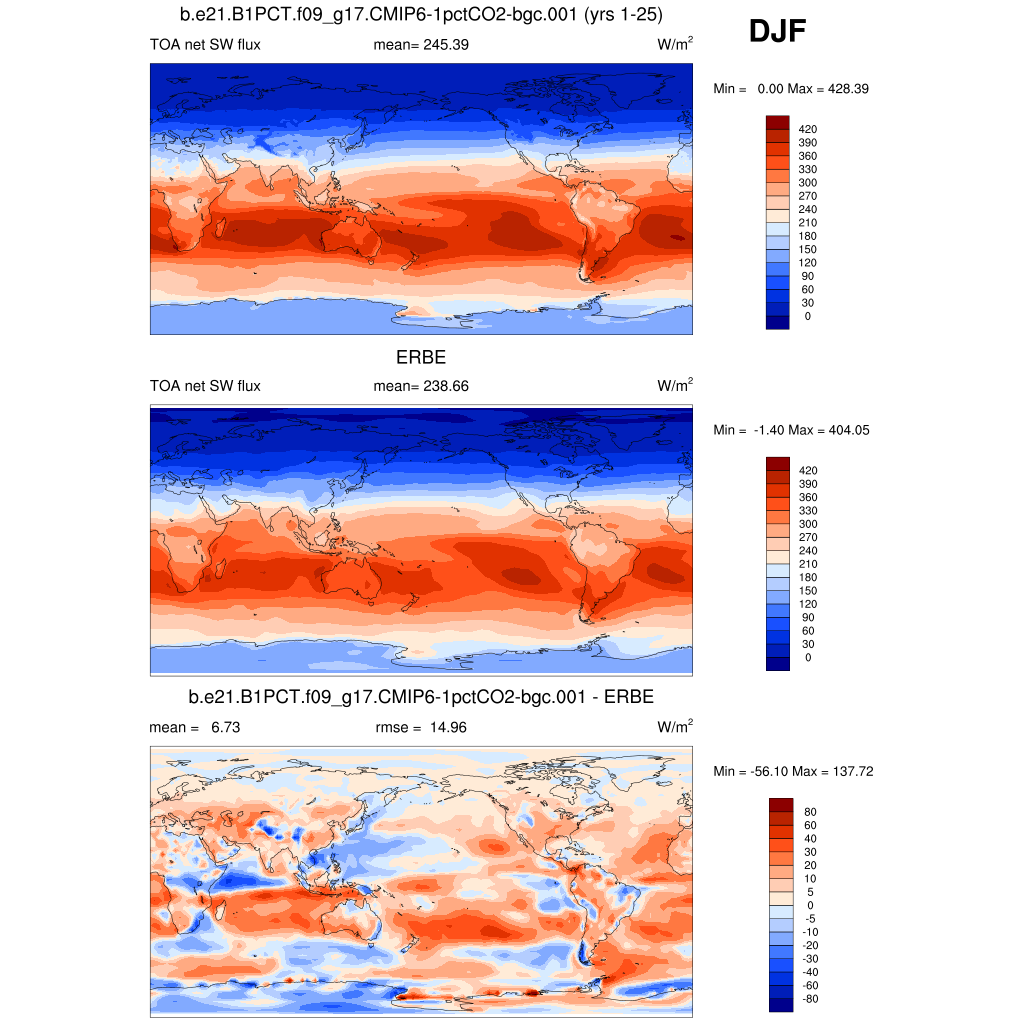
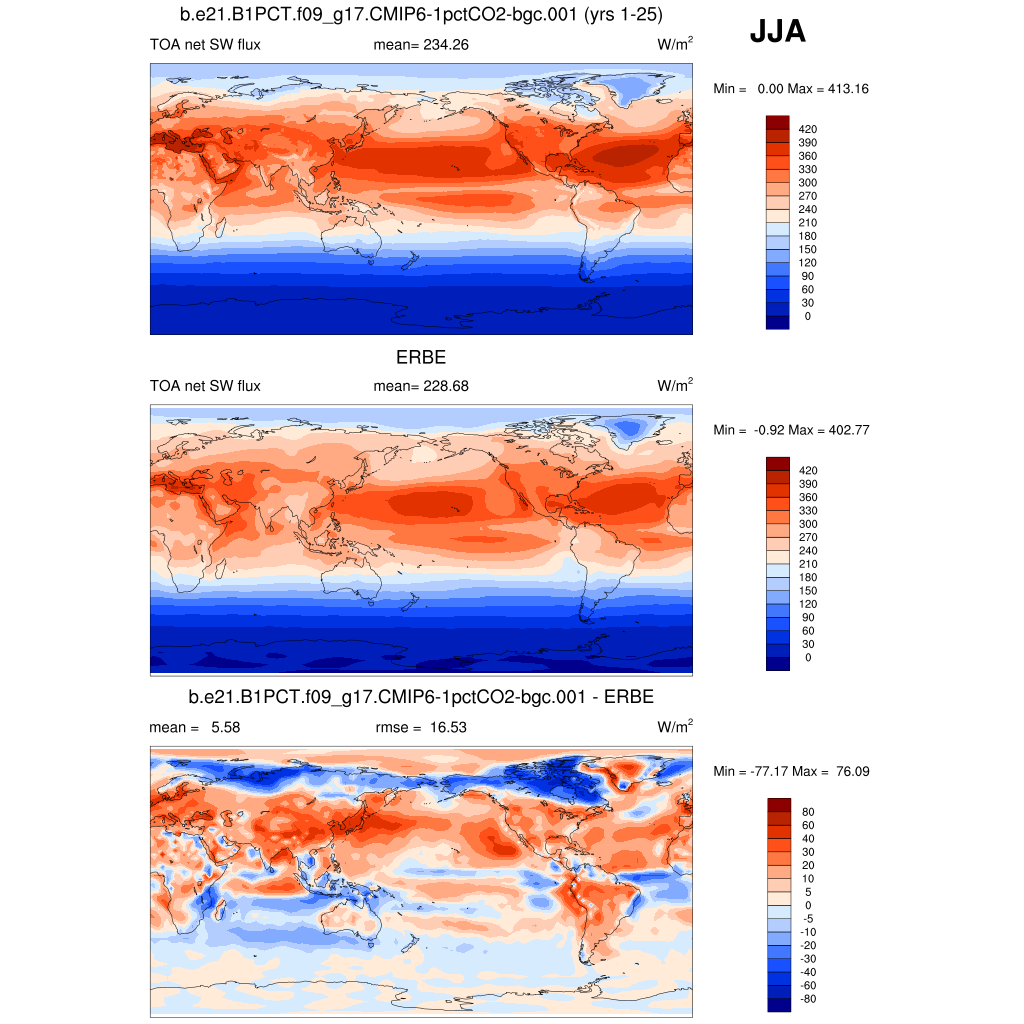
| FSNTOA * | TOA net shortwave flux | plot | plot | plot |
| FSNTOAC | TOA clearsky net shortwave flux | plot | plot | plot |
| LWCF * | TOA longwave cloud forcing | plot | plot | plot |
| SWCF * | TOA shortwave cloud forcing | plot | plot | plot |
| SWCF TROP | Tropical TOA SW cloud forcing | plot | plot | plot |
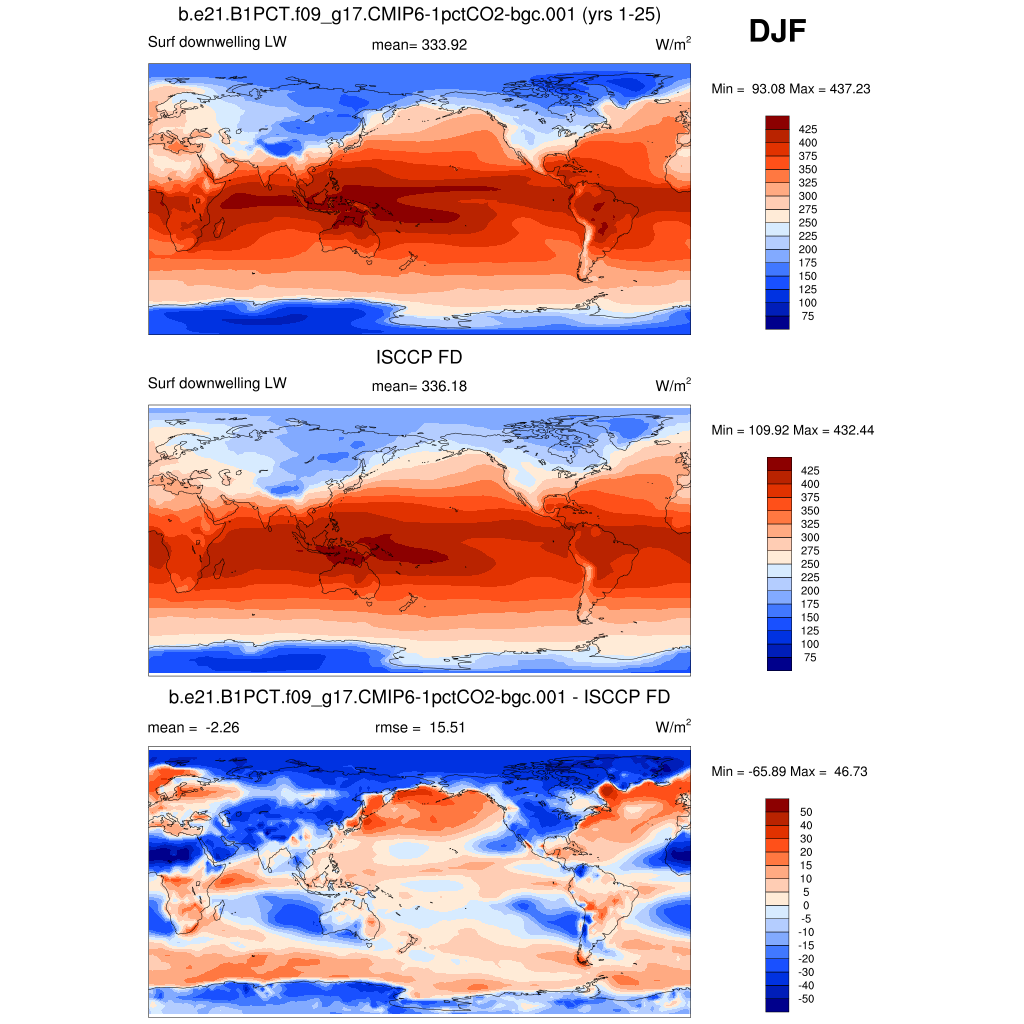
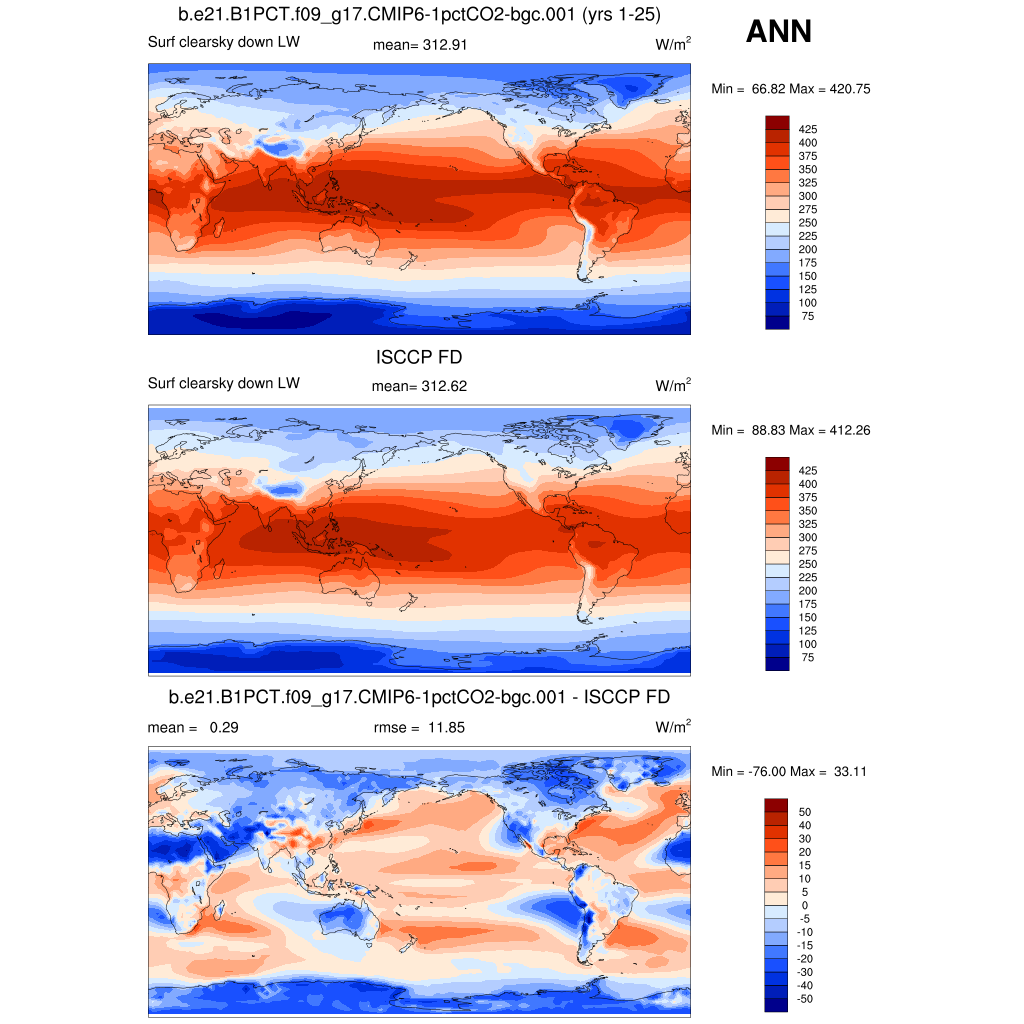
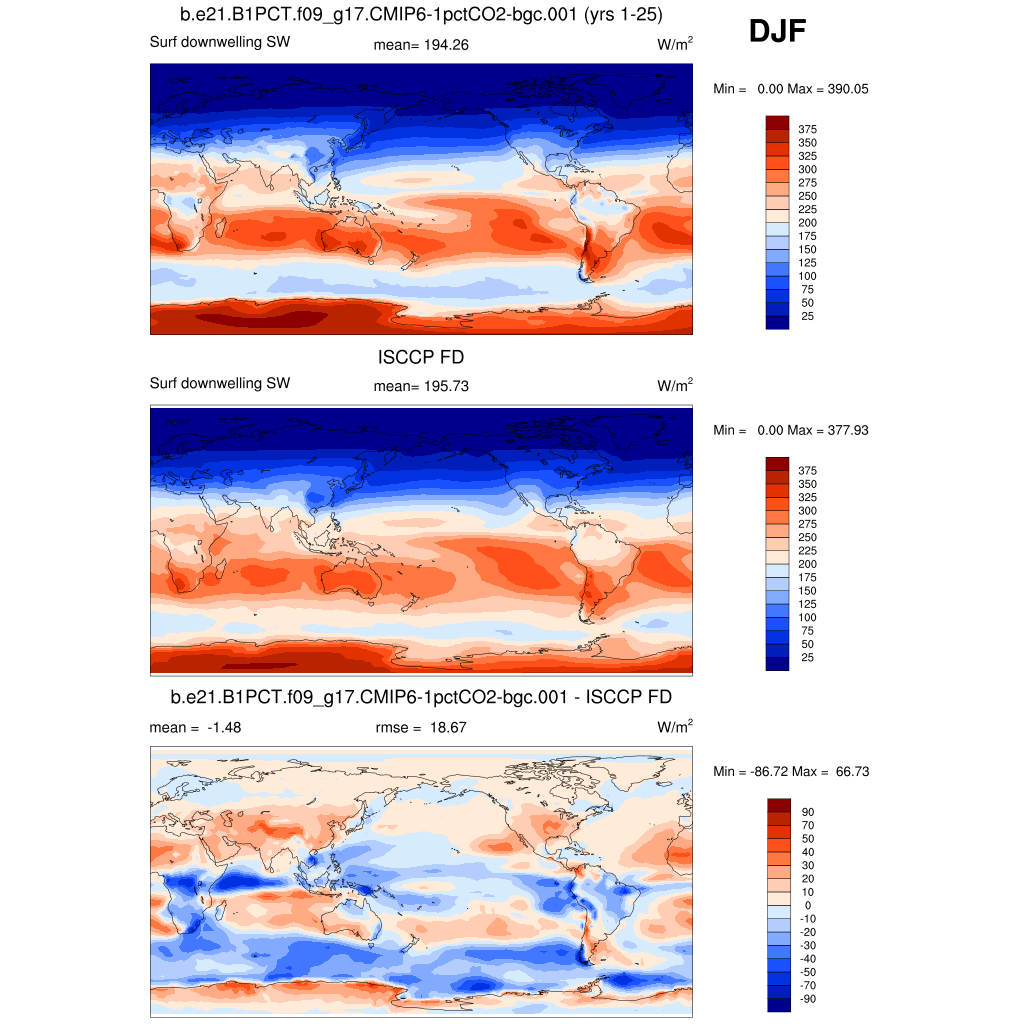
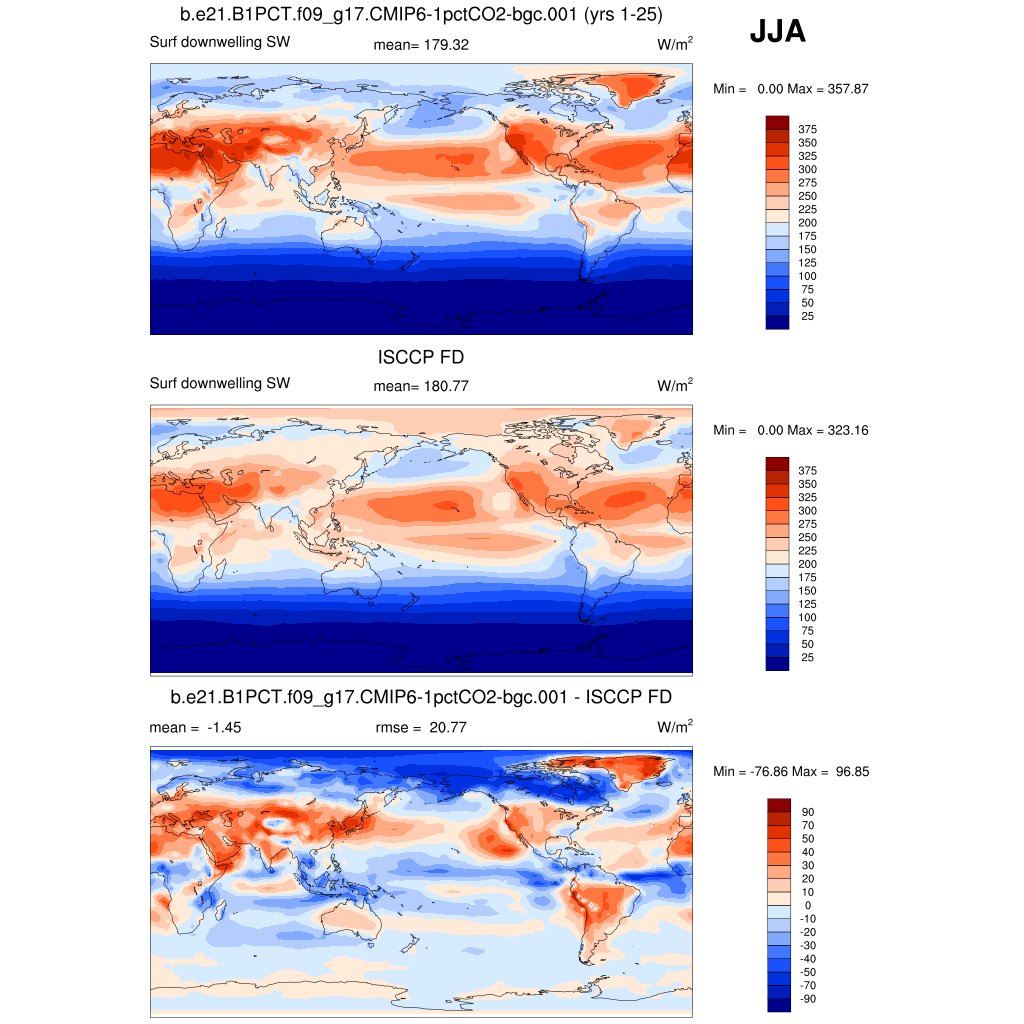
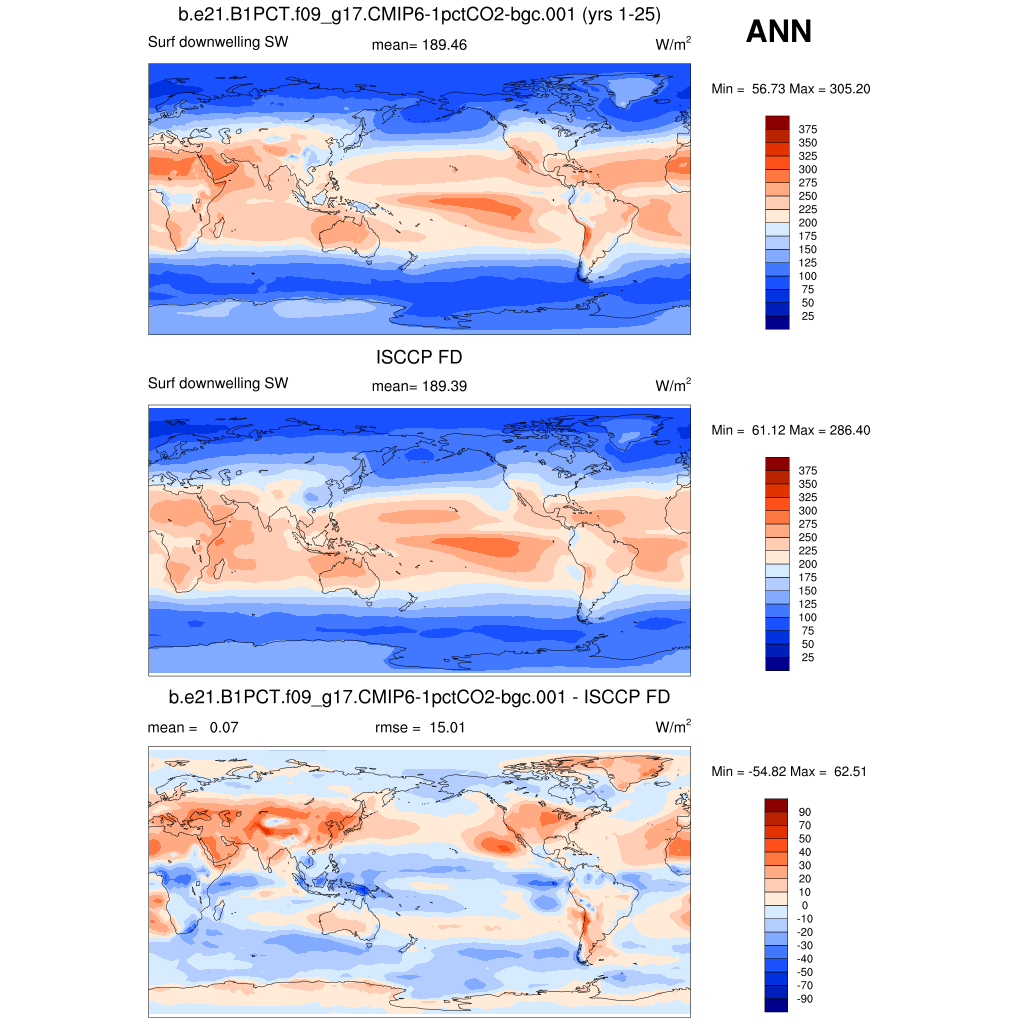
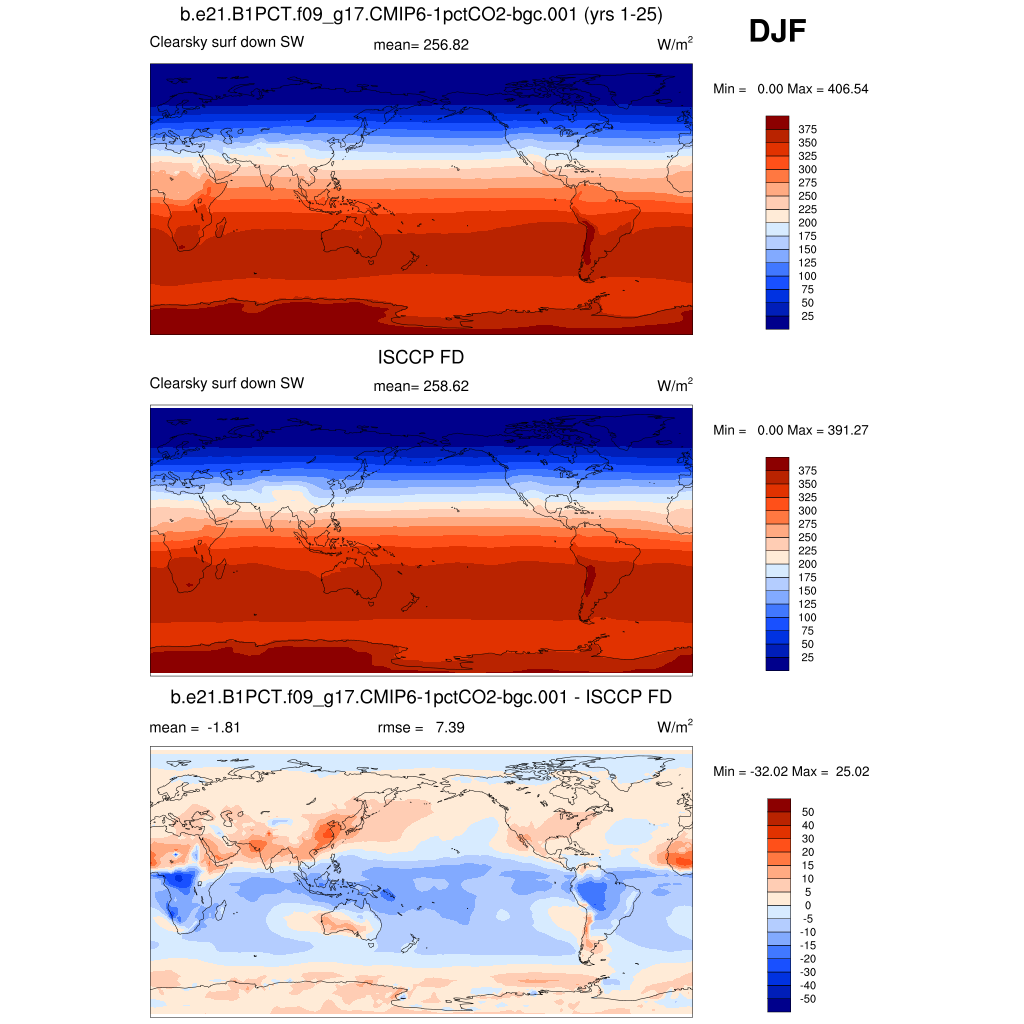
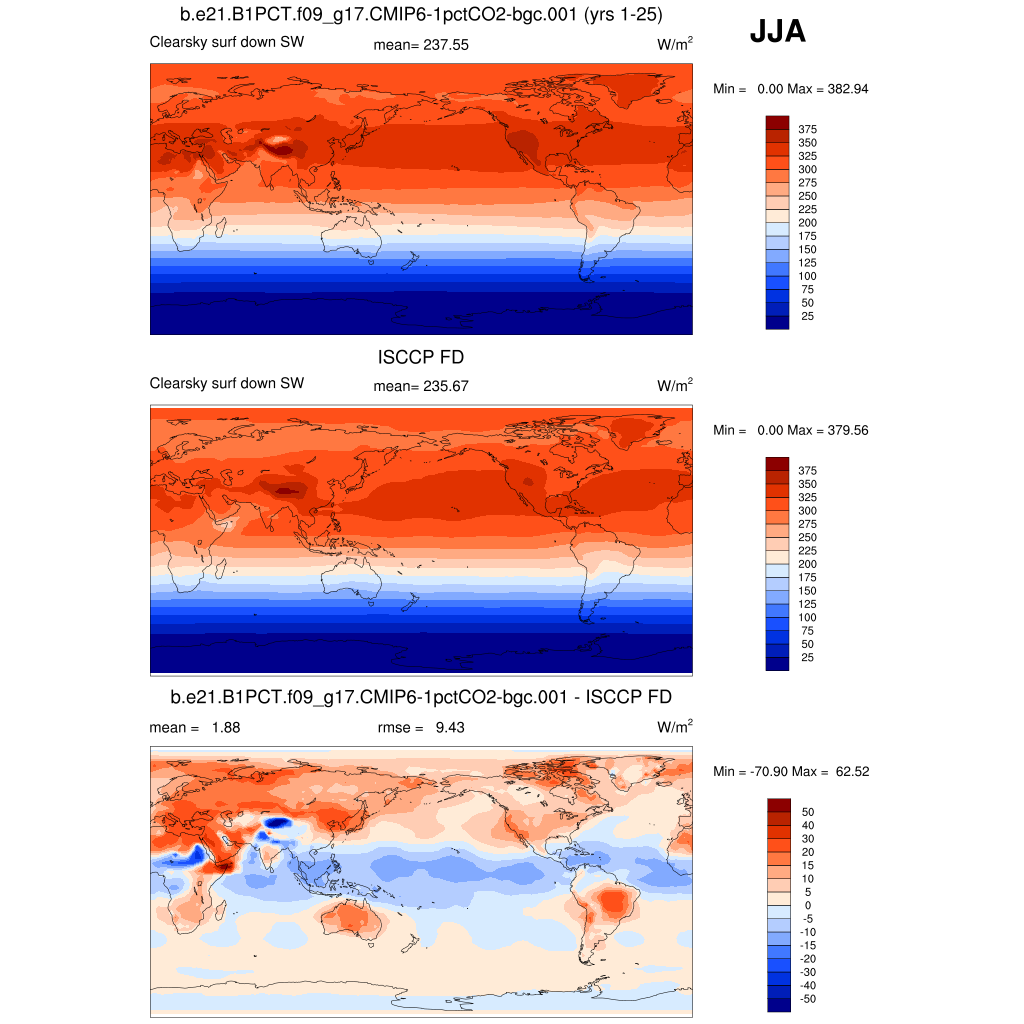
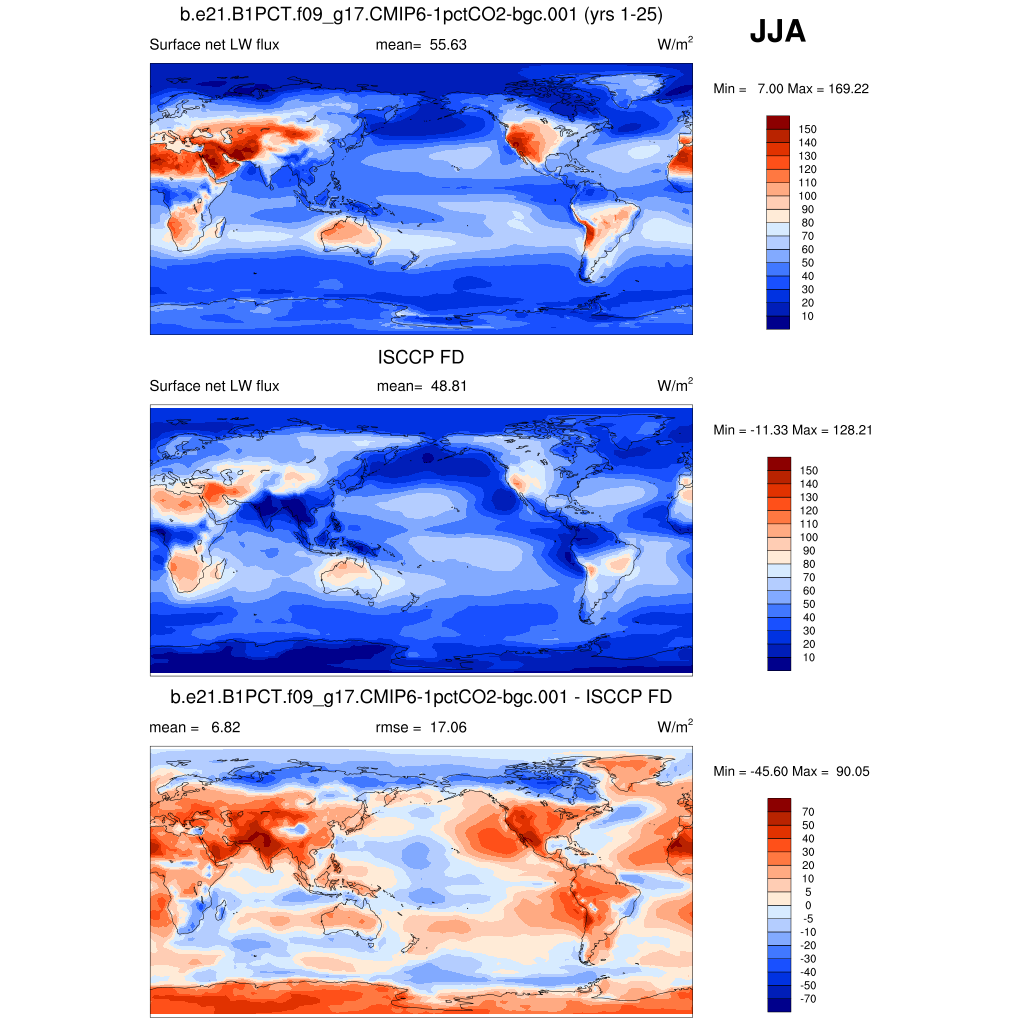
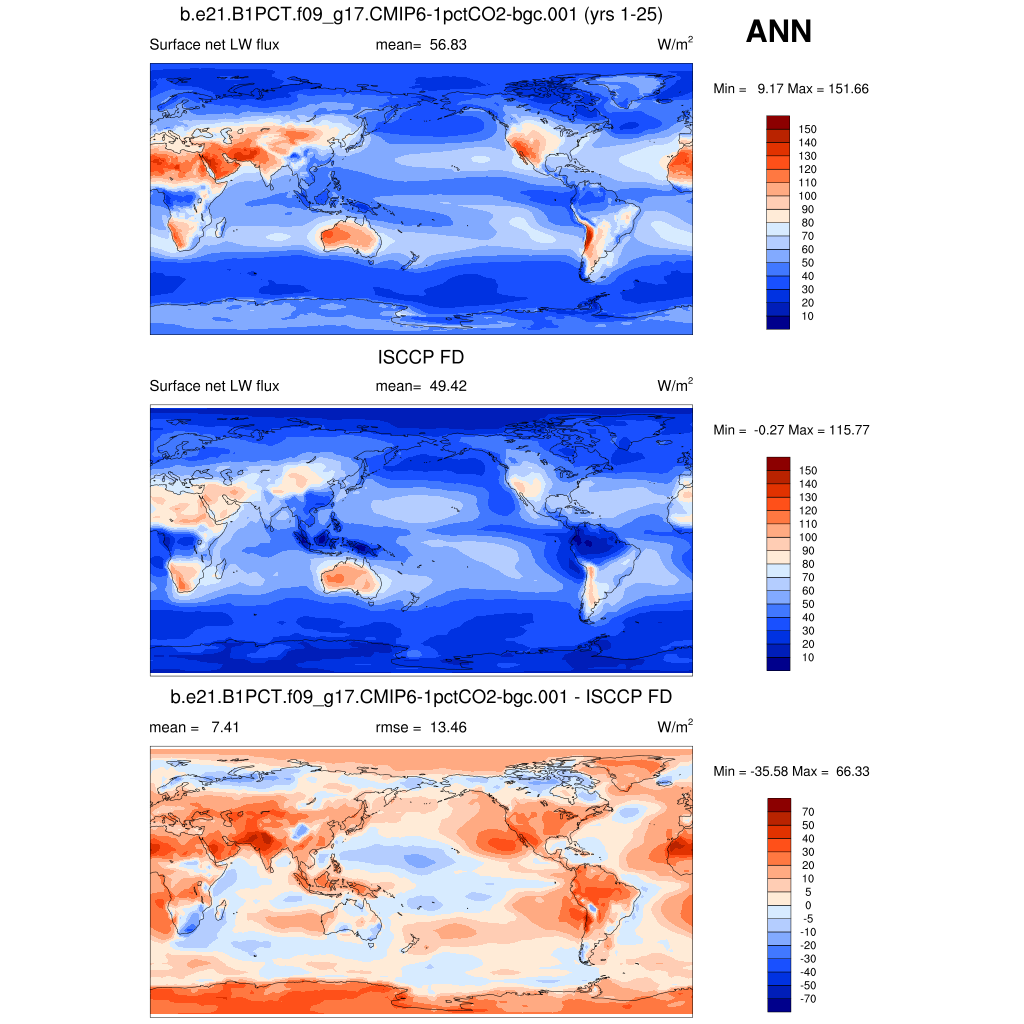
| ISCCP FD Jul1983-Dec2000 | DJF | JJA | ANN | |
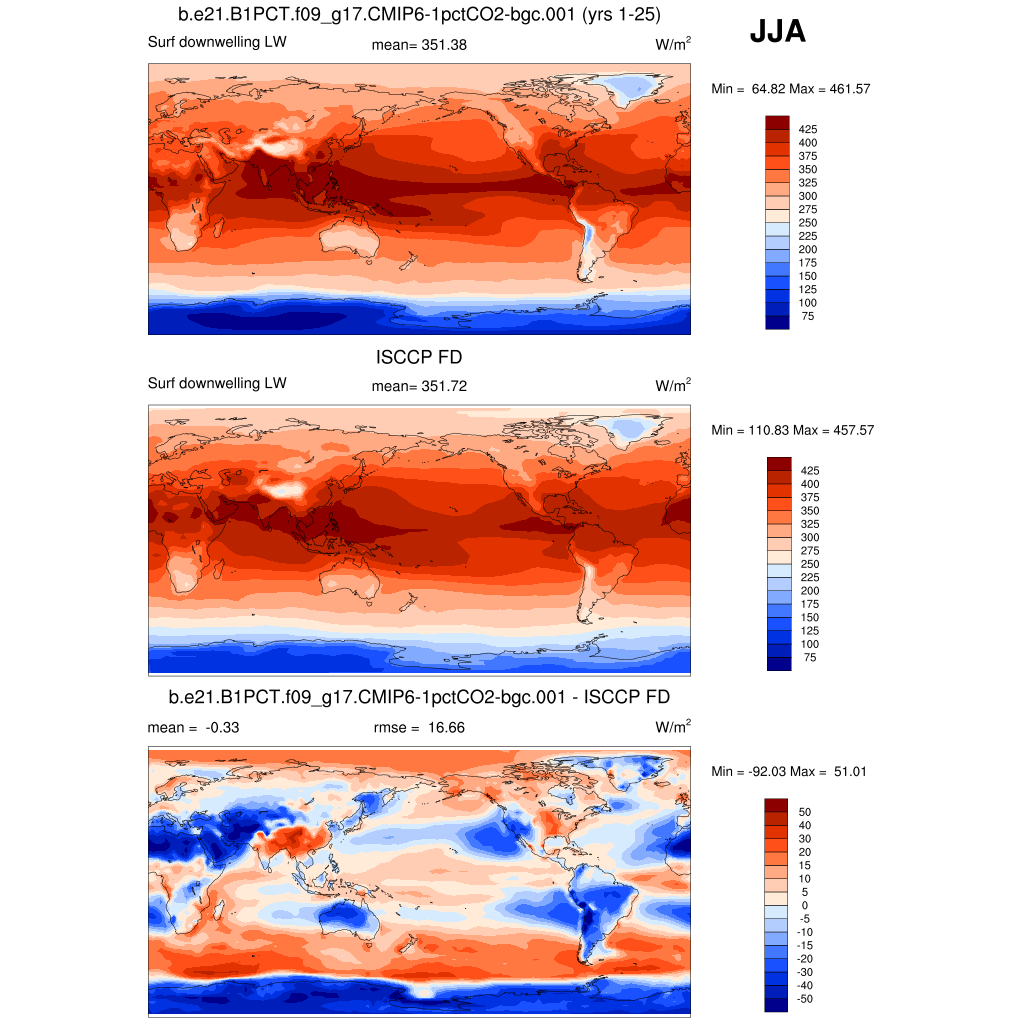
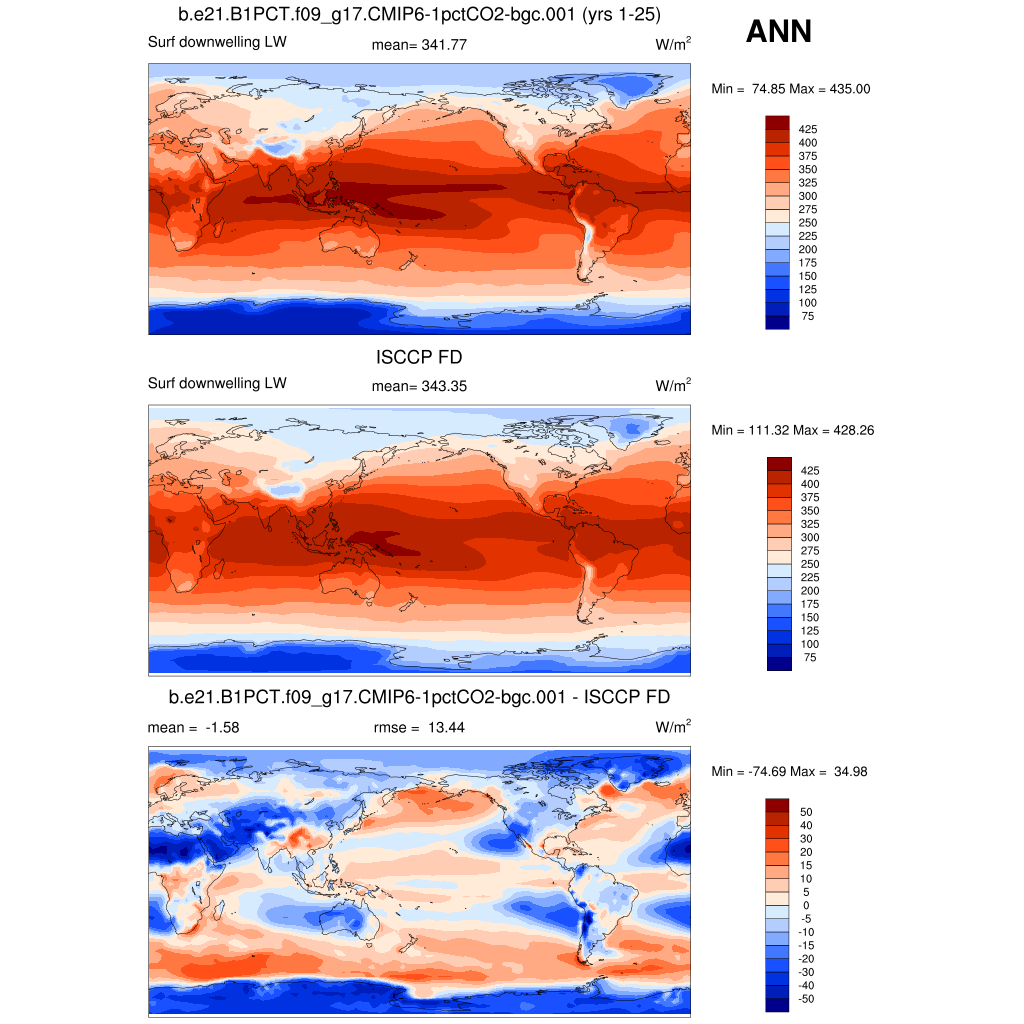
| FLDS | Surf LW downwelling flux | plot | plot | plot |
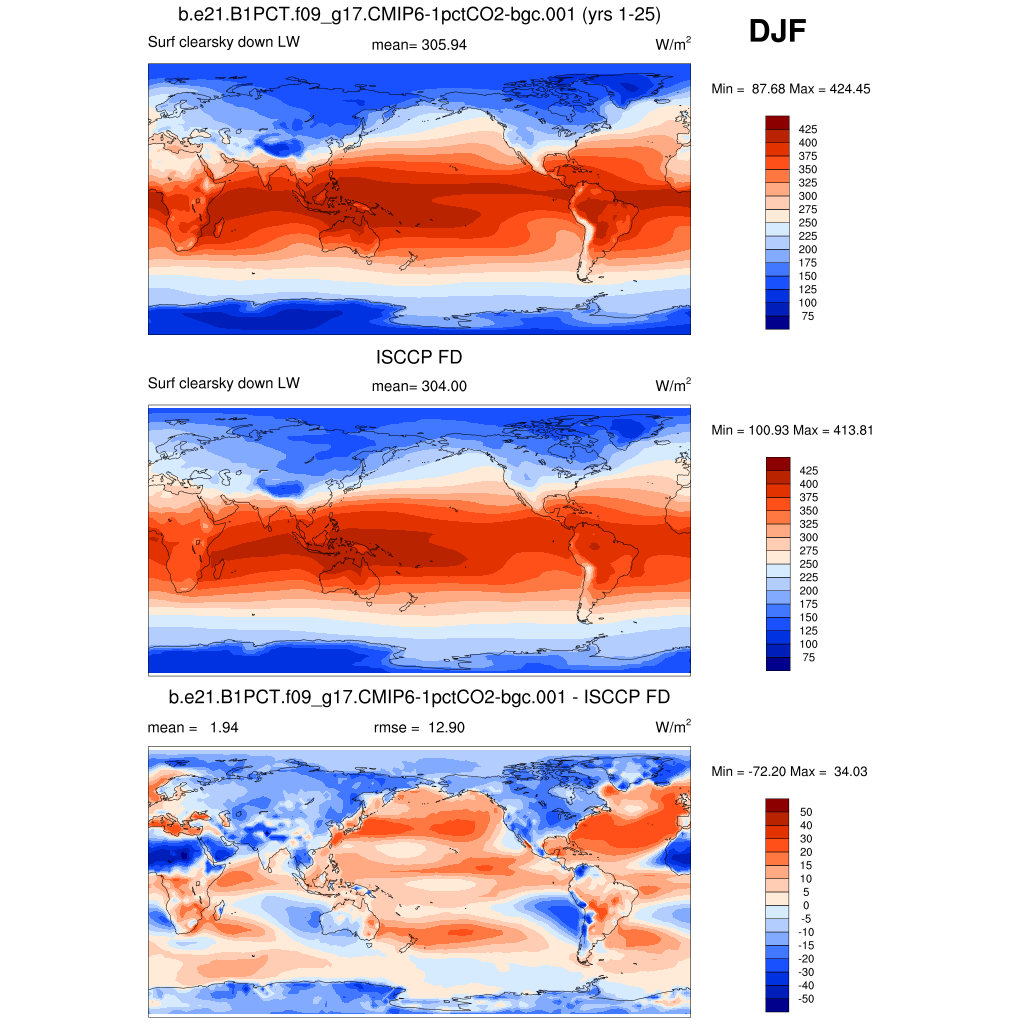
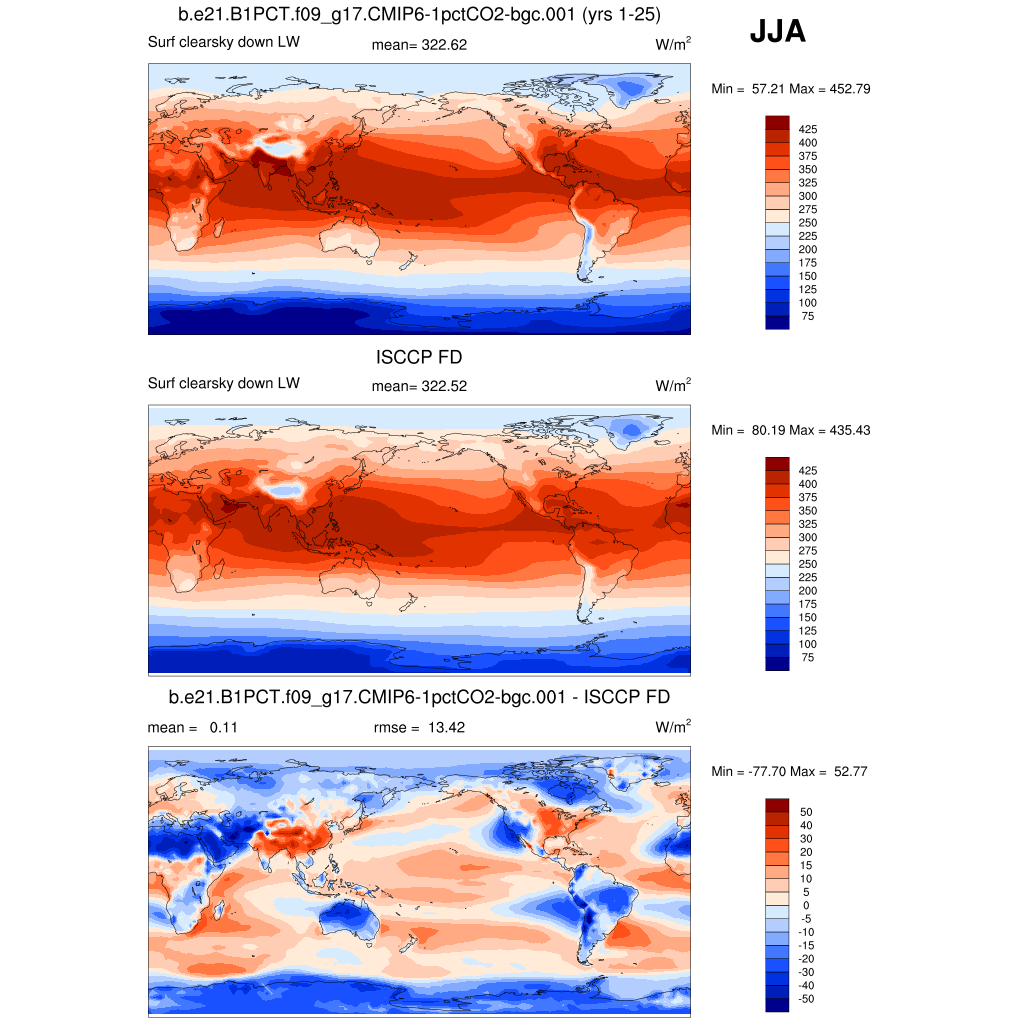
| FLDSC | Clearsky Surf LW downwelling flux | plot | plot | plot |
| FSDS | Surf SW downwelling flux | plot | plot | plot |
| FSDSC | Clearsky Surf SW downwelling flux | plot | plot | plot |
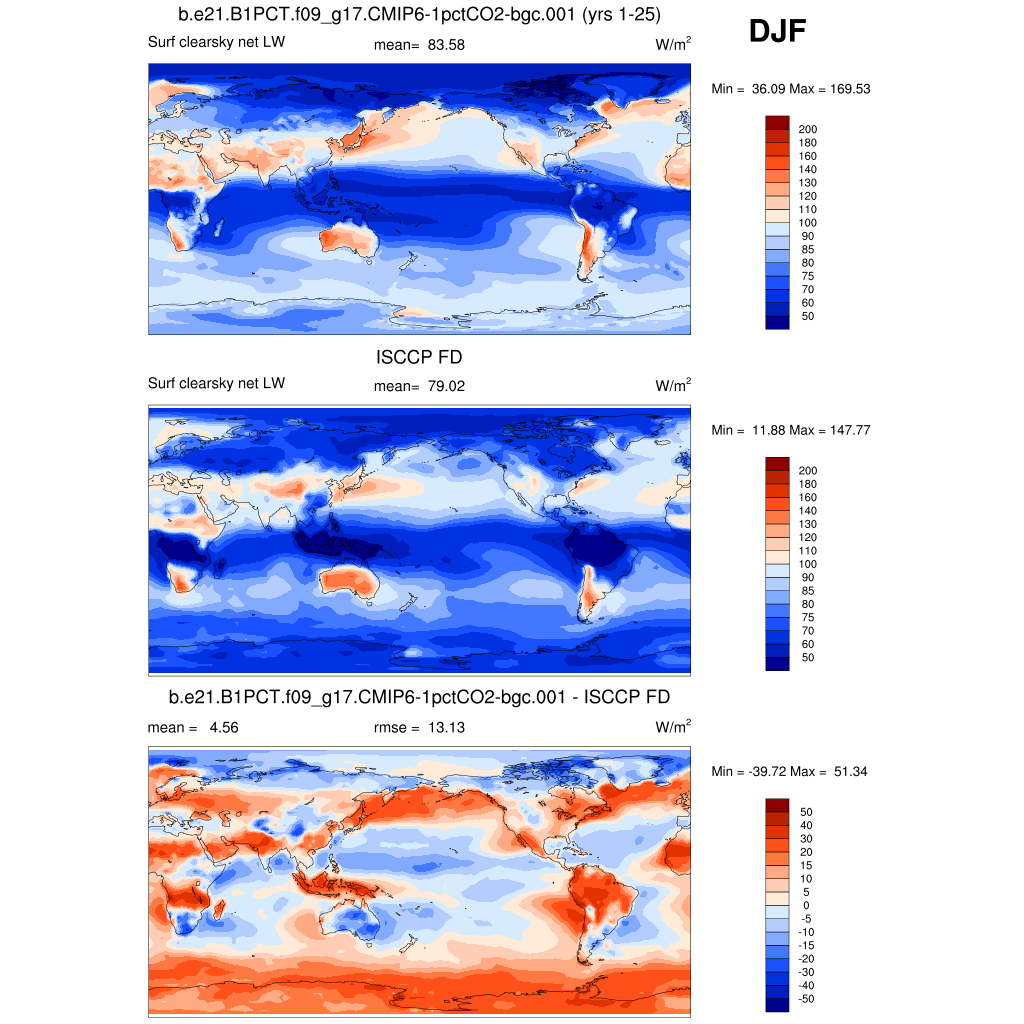
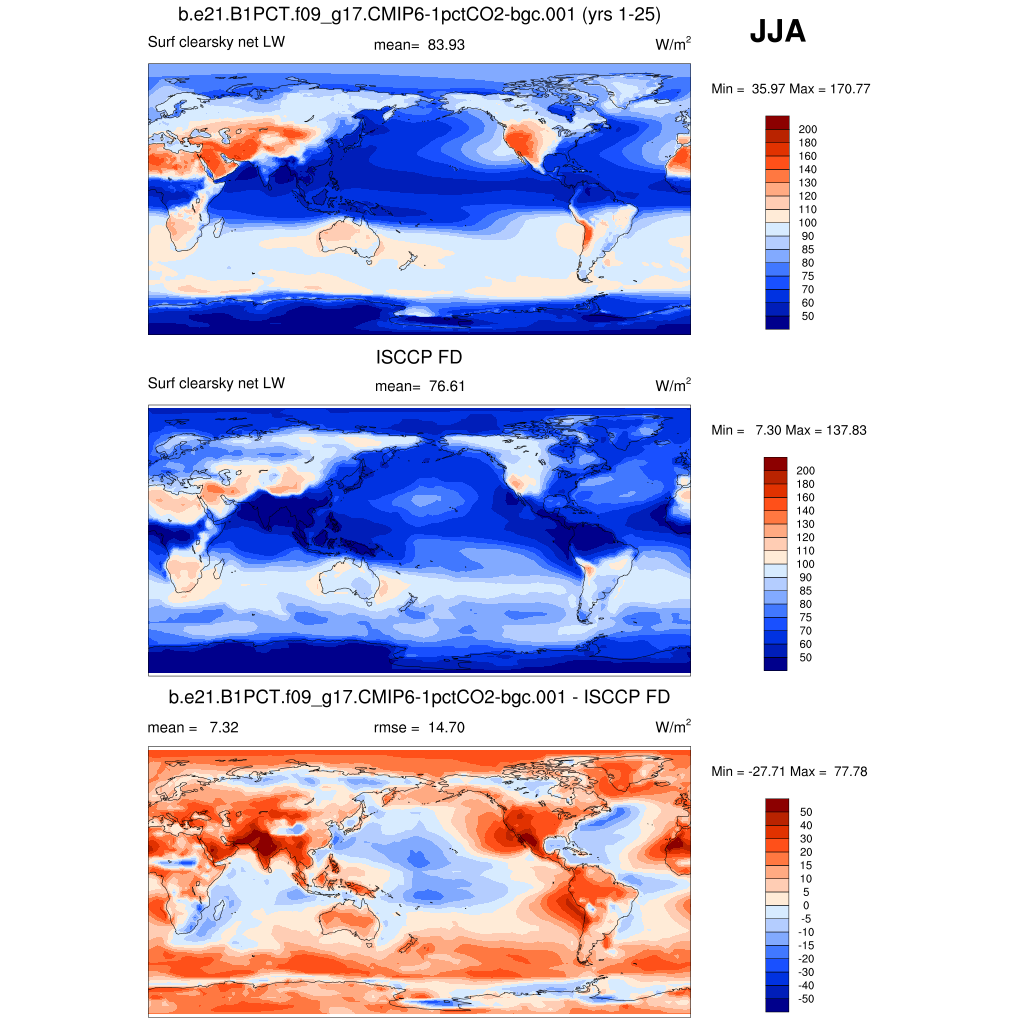
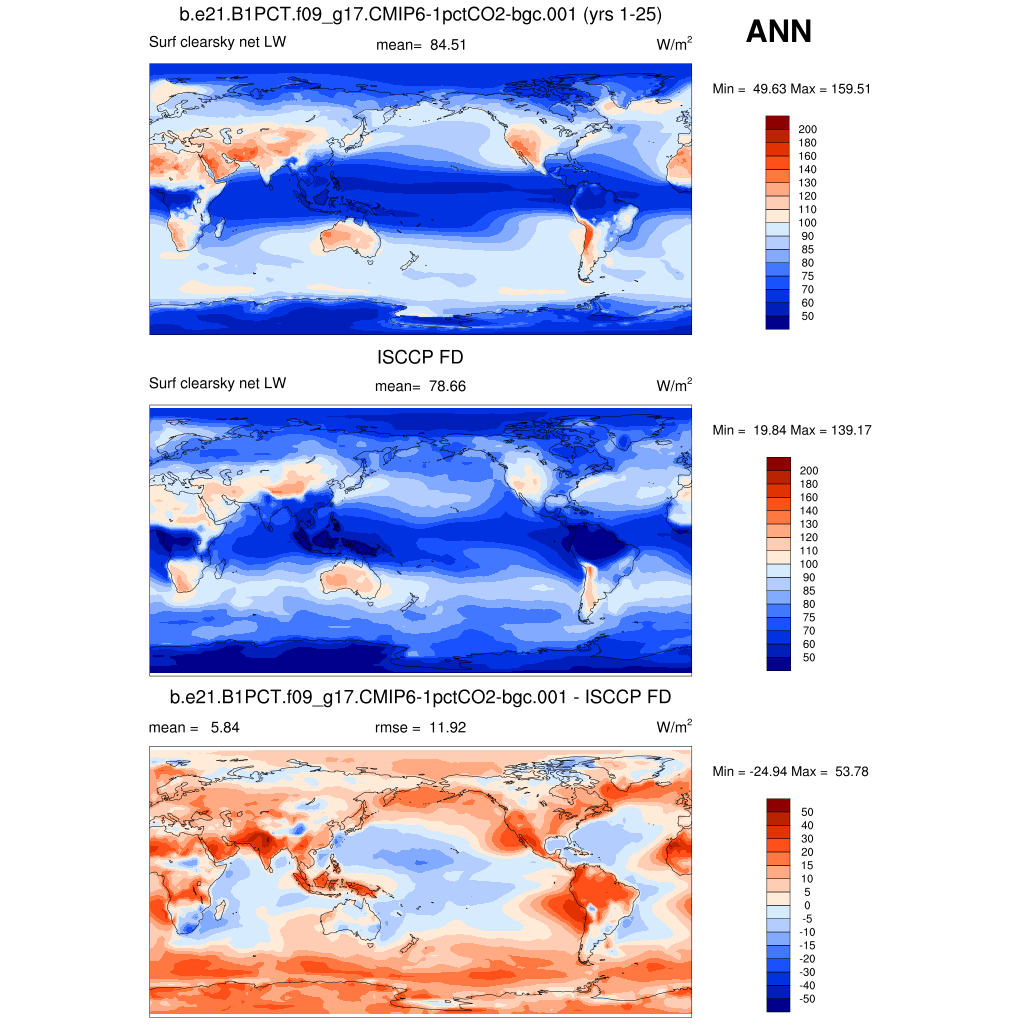
| FLNS | Surf Net LW flux | plot | plot | plot |
| FLNSC | Clearsky Surf Net LW flux | plot | plot | plot |
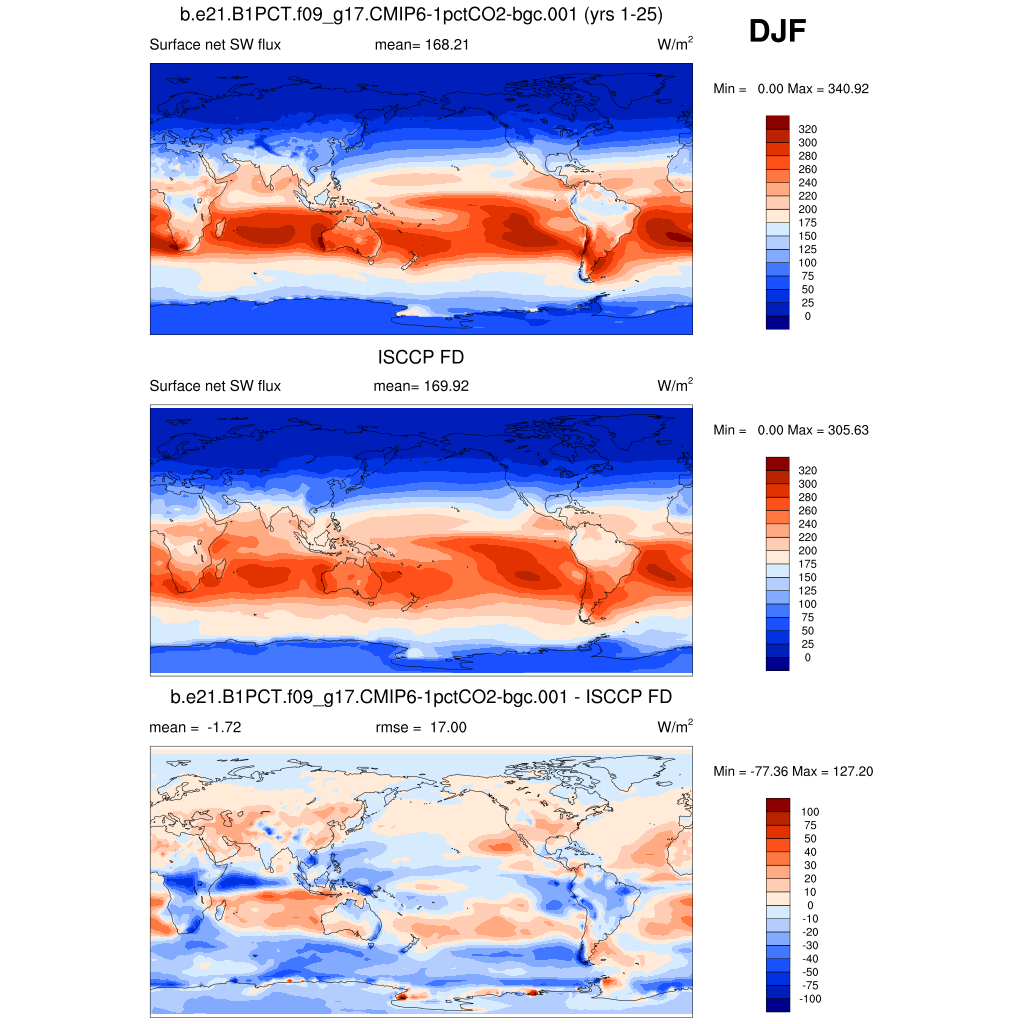
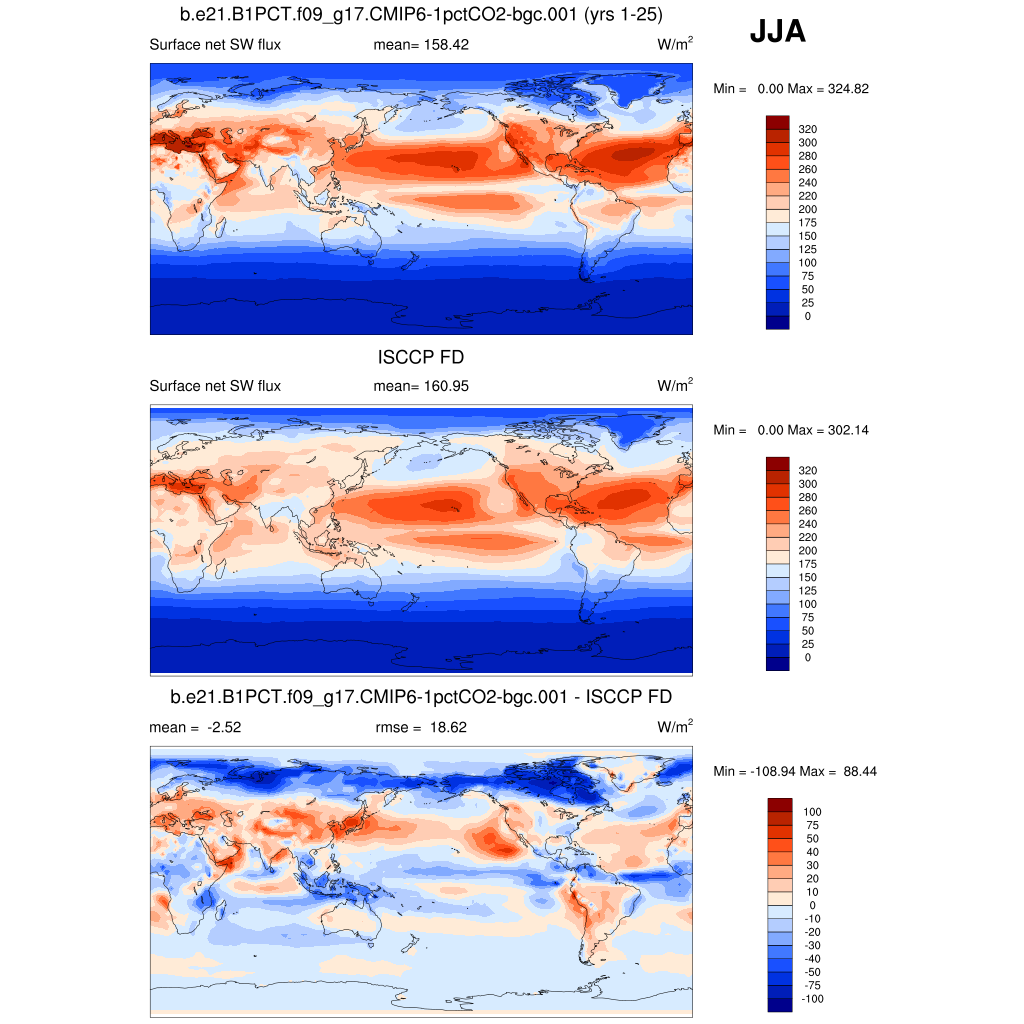
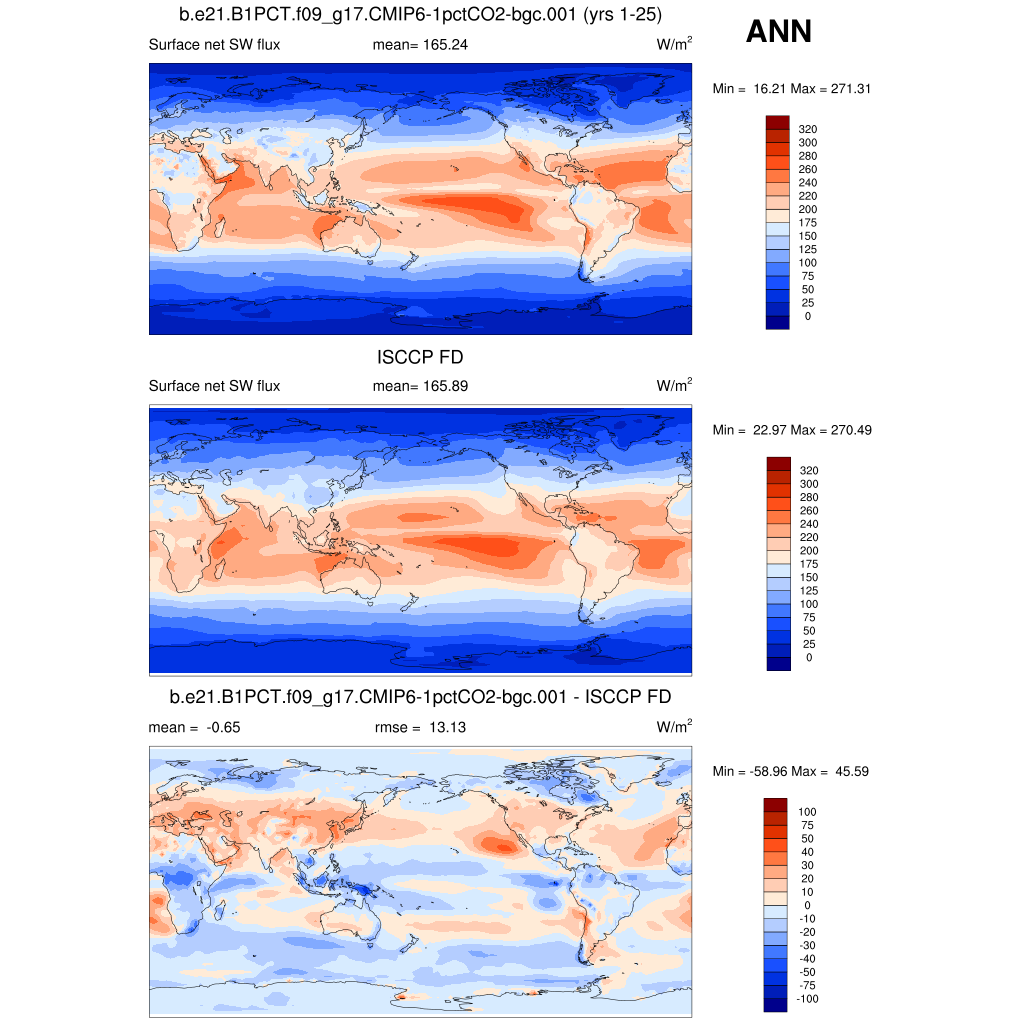
| FSNS | Surf Net SW flux | plot | plot | plot |
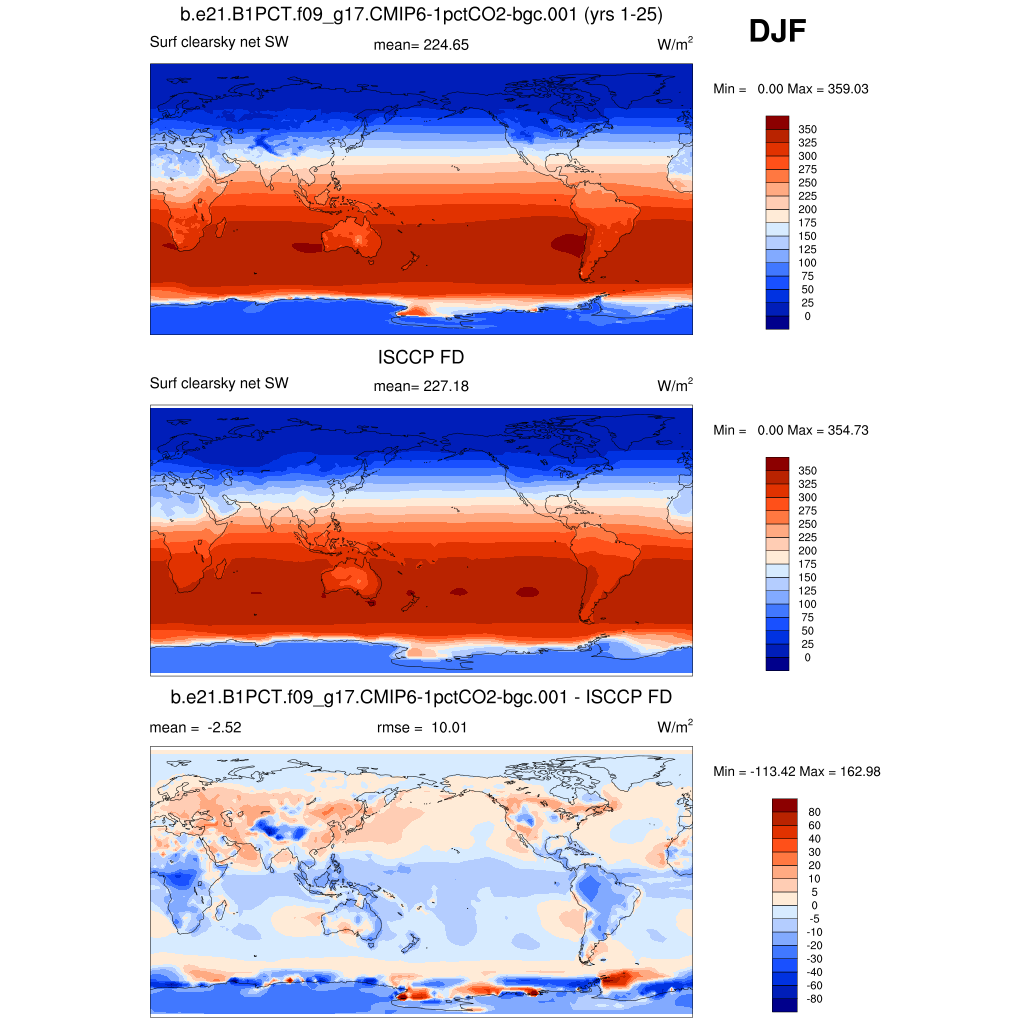
| FSNSC | Clearsky Surf Net SW flux | plot | plot | plot |
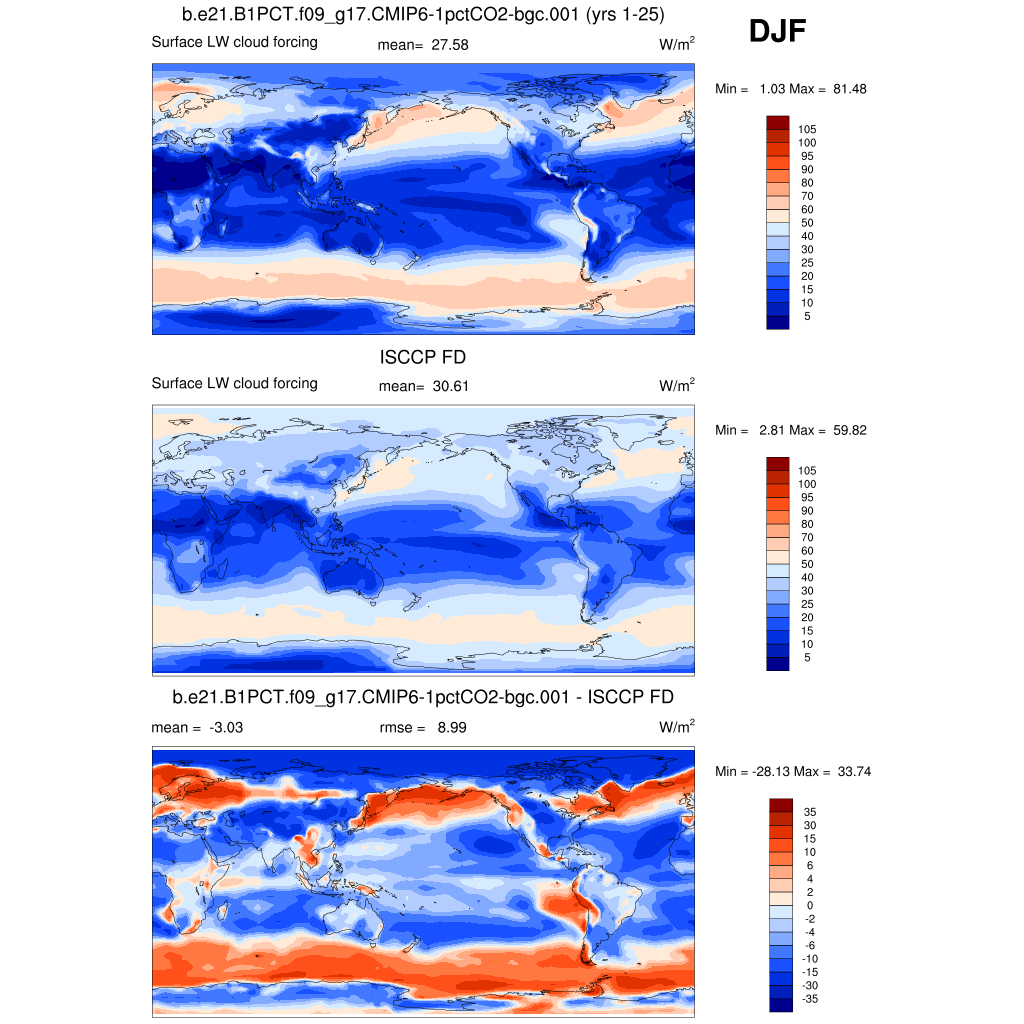
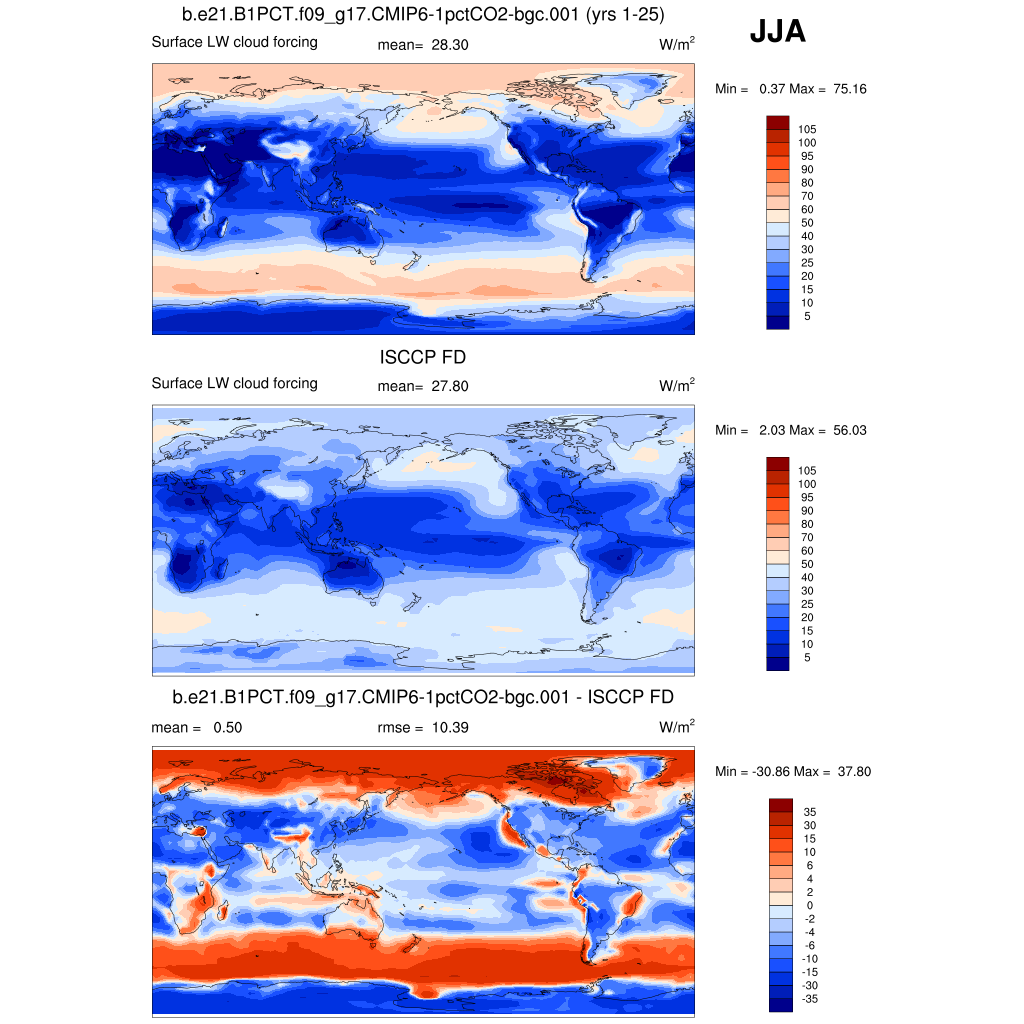
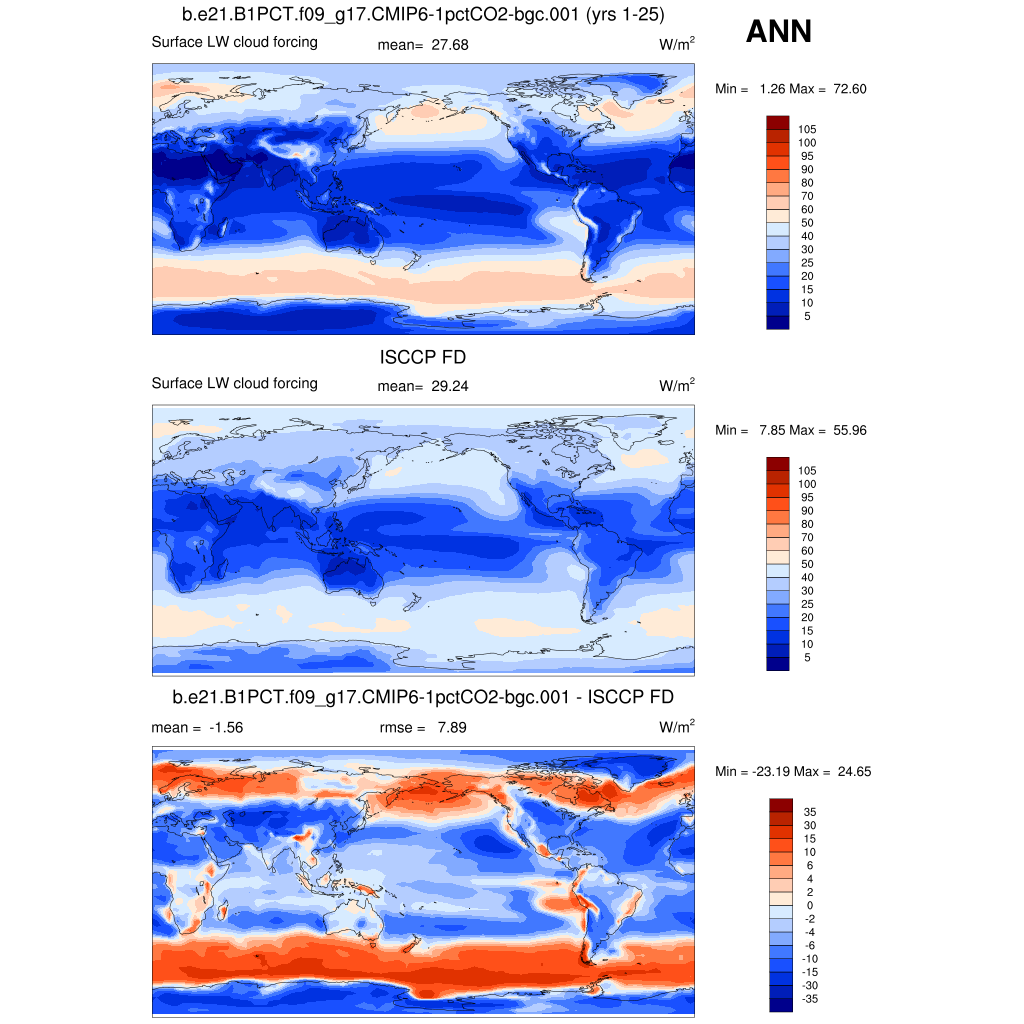
| LWCFSRF | Surf LW cloud forcing | plot | plot | plot |
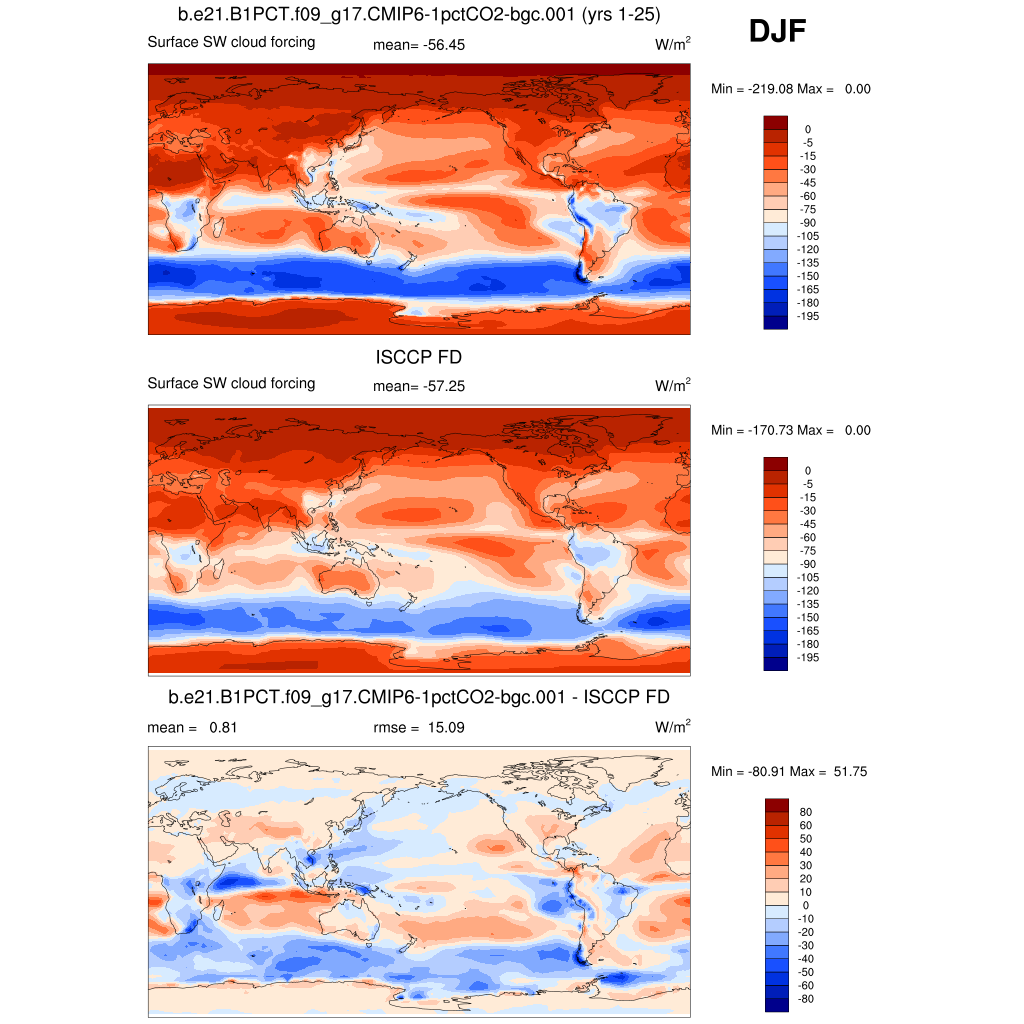
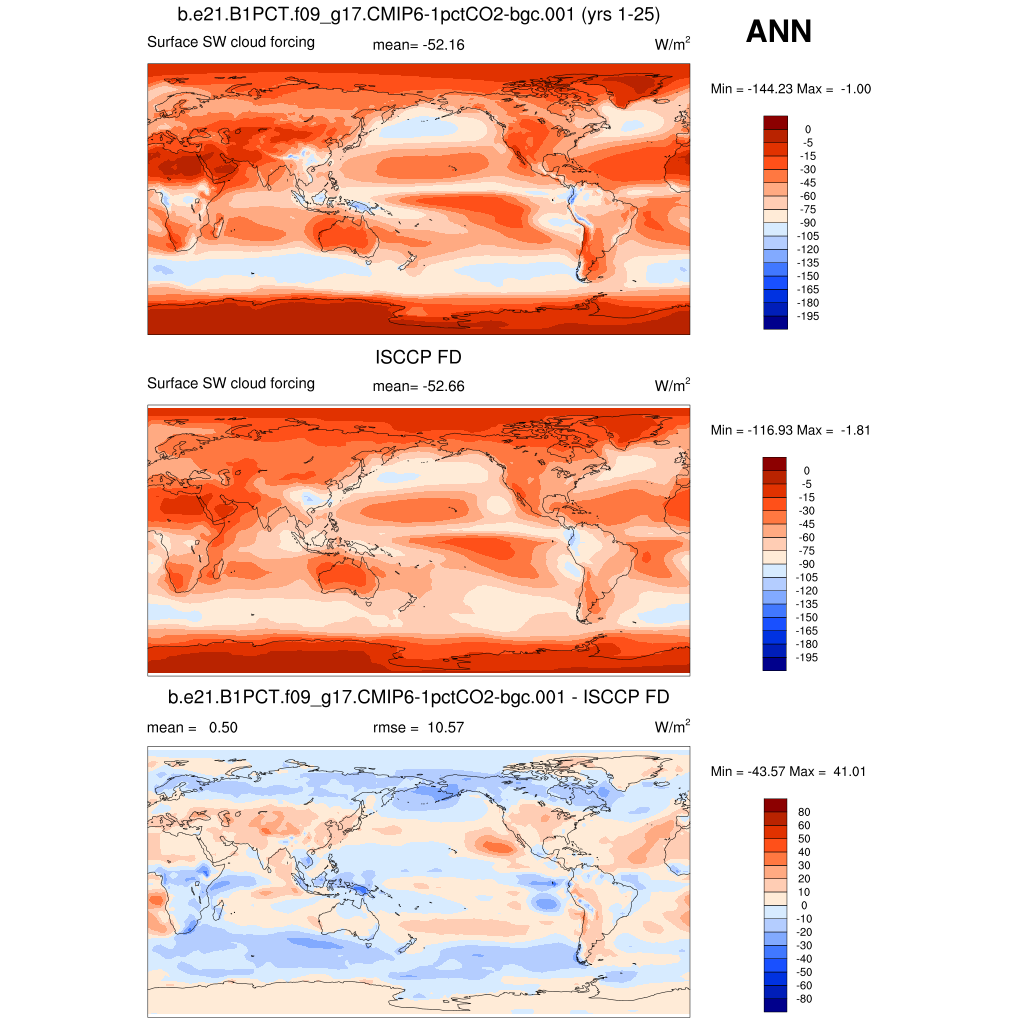
| SWCFSRF | Surf SW cloud forcing | plot | plot | plot |
| ISCCP D2 1983-2001 | DJF | JJA | ANN | |
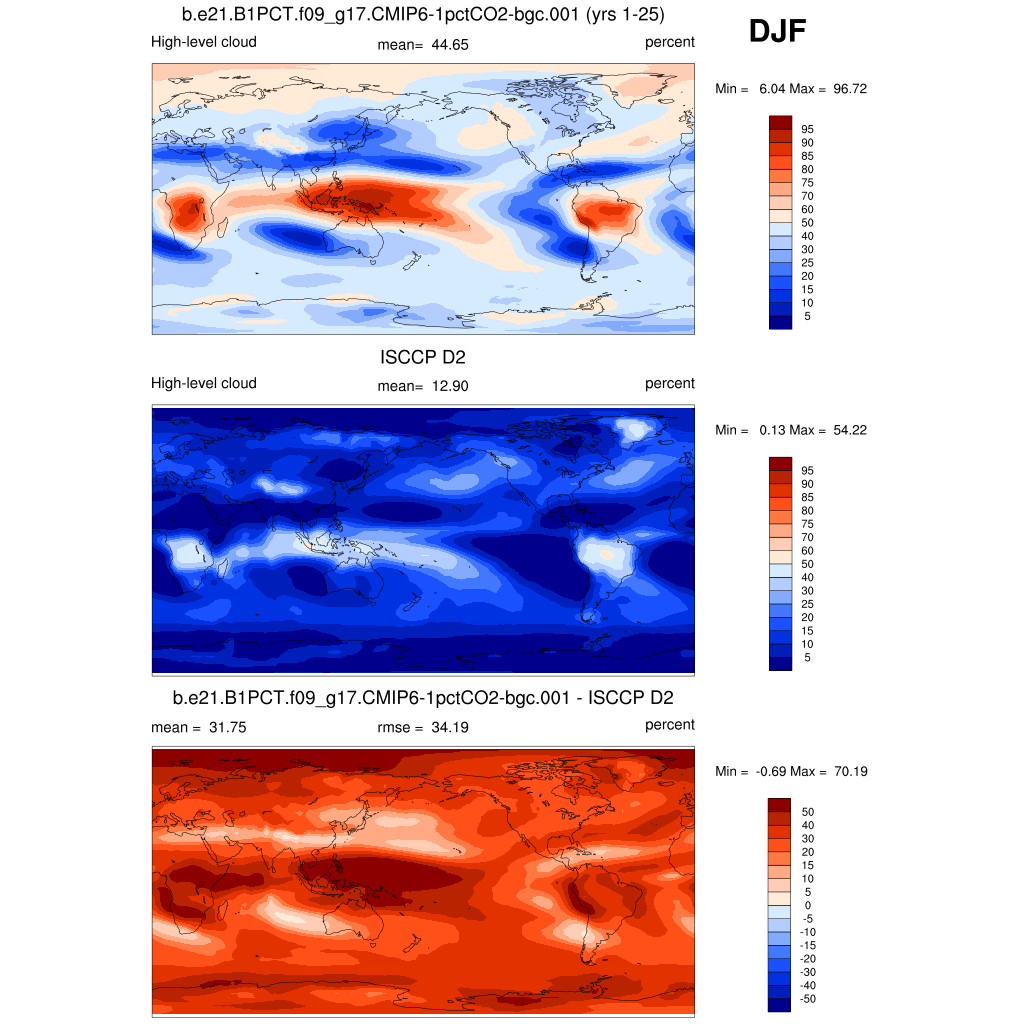
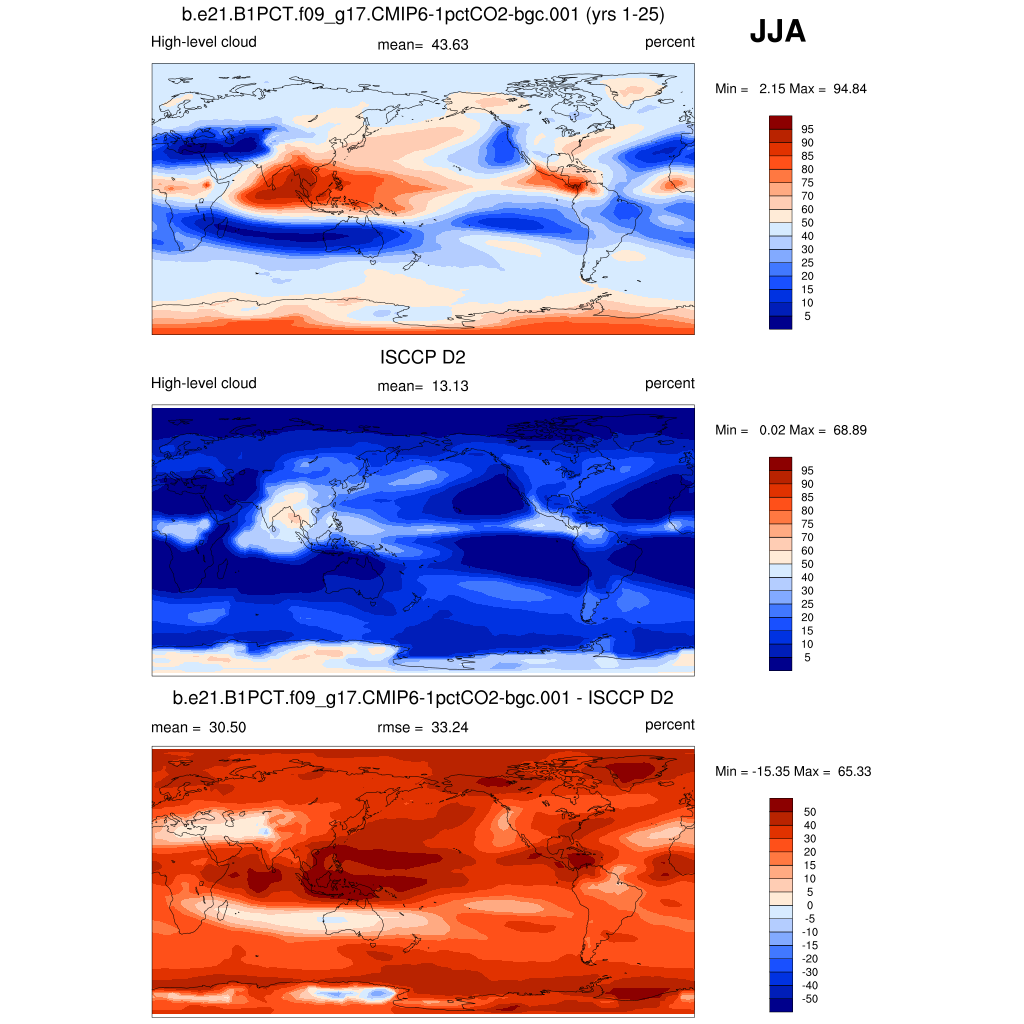
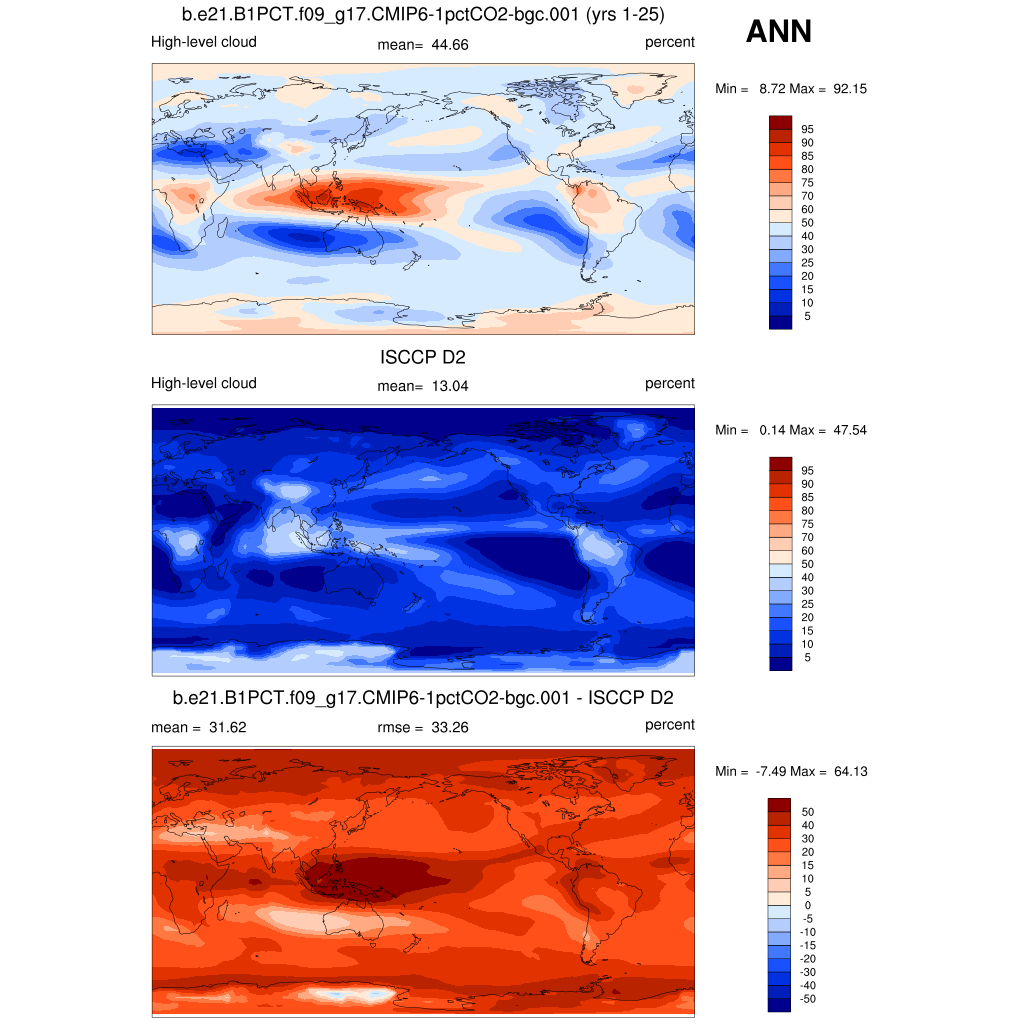
| CLDHGH (IR clouds) | High cloud amount | plot | plot | plot |
| CLDHGH (VIS/IR/NIR clouds) | High cloud amount | plot | plot | plot |
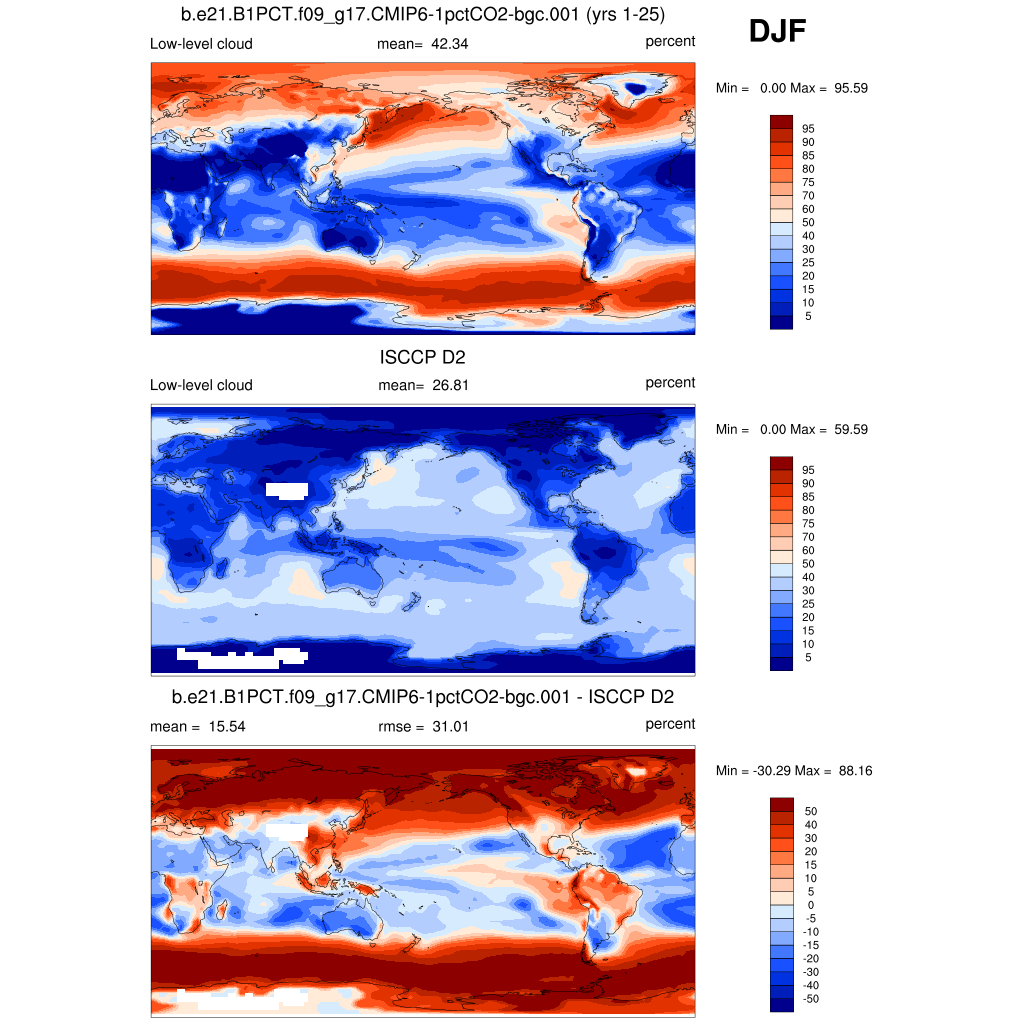
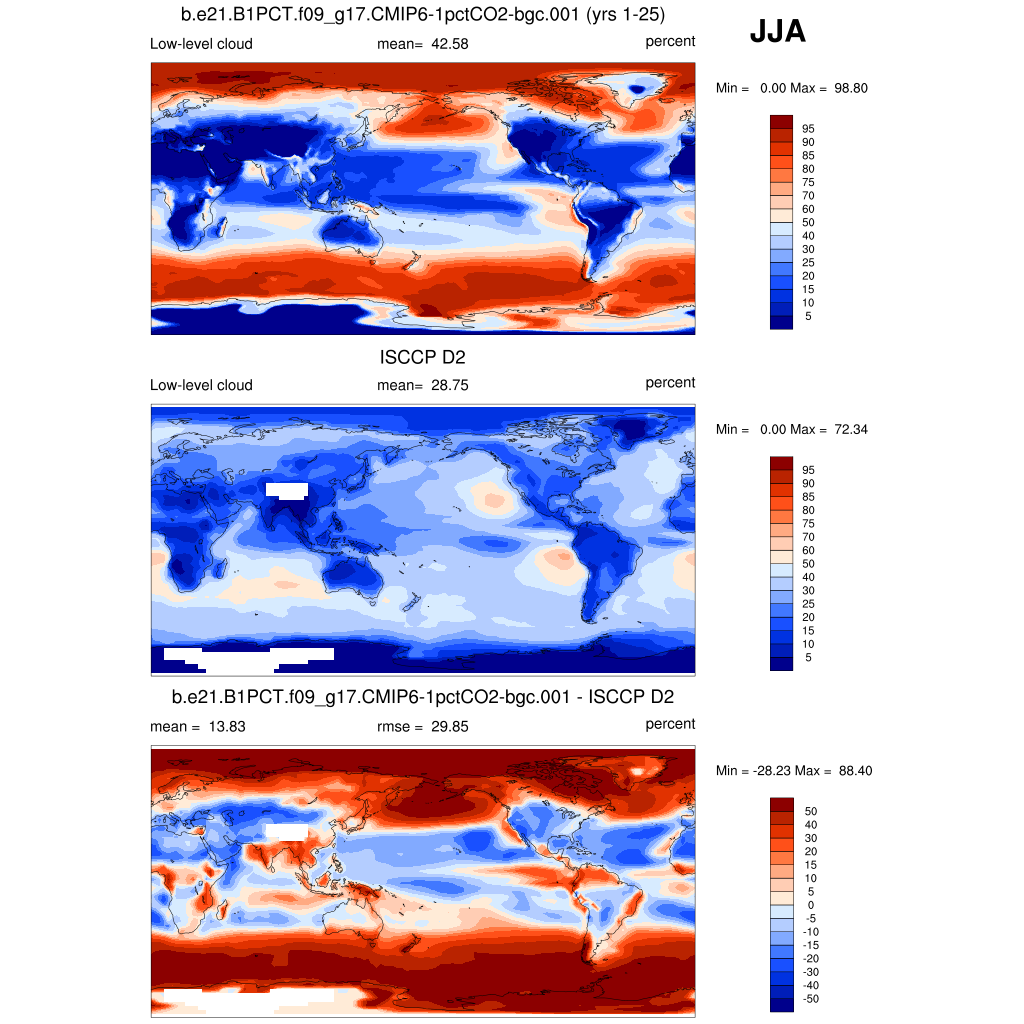
| CLDLOW (IR clouds) | Low cloud amount | plot | plot | plot |
| CLDLOW (VIS/IR/NIR clouds) | Low cloud amount | plot | plot | plot |
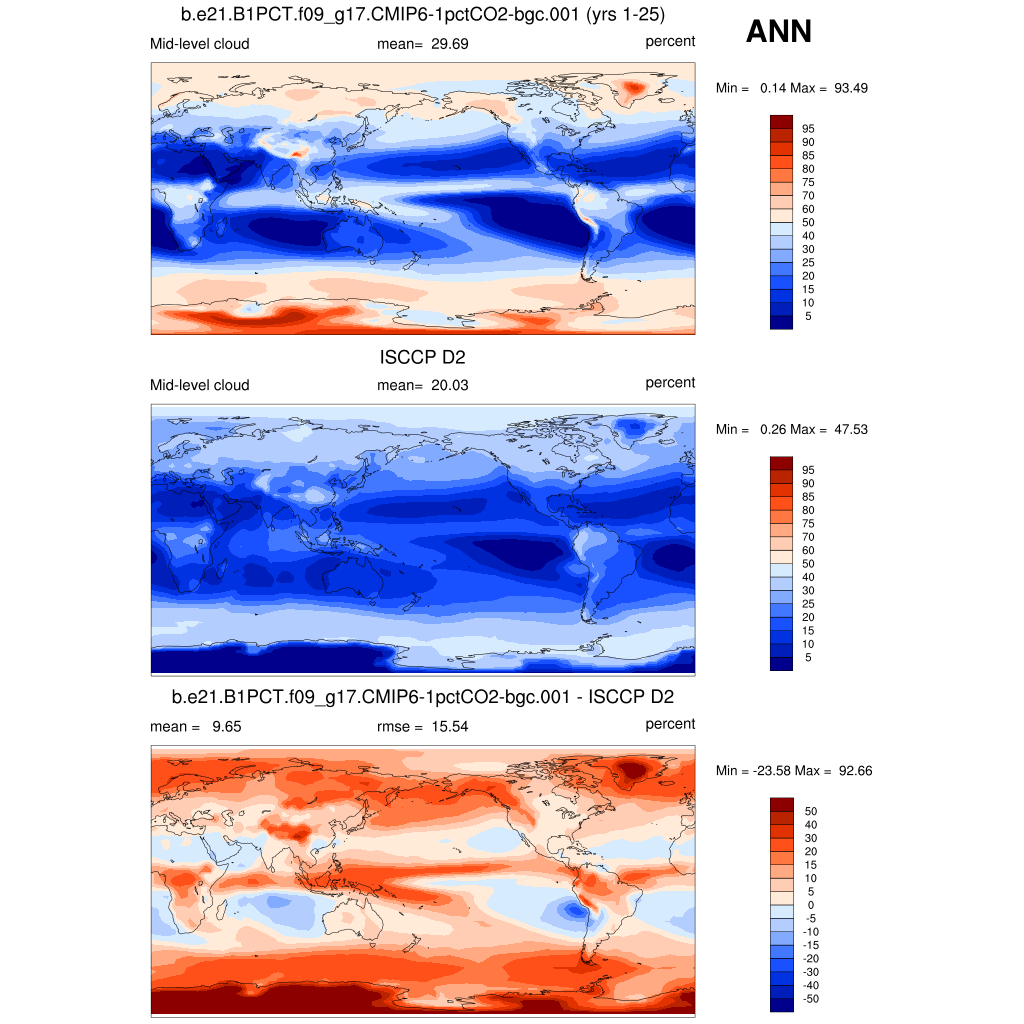
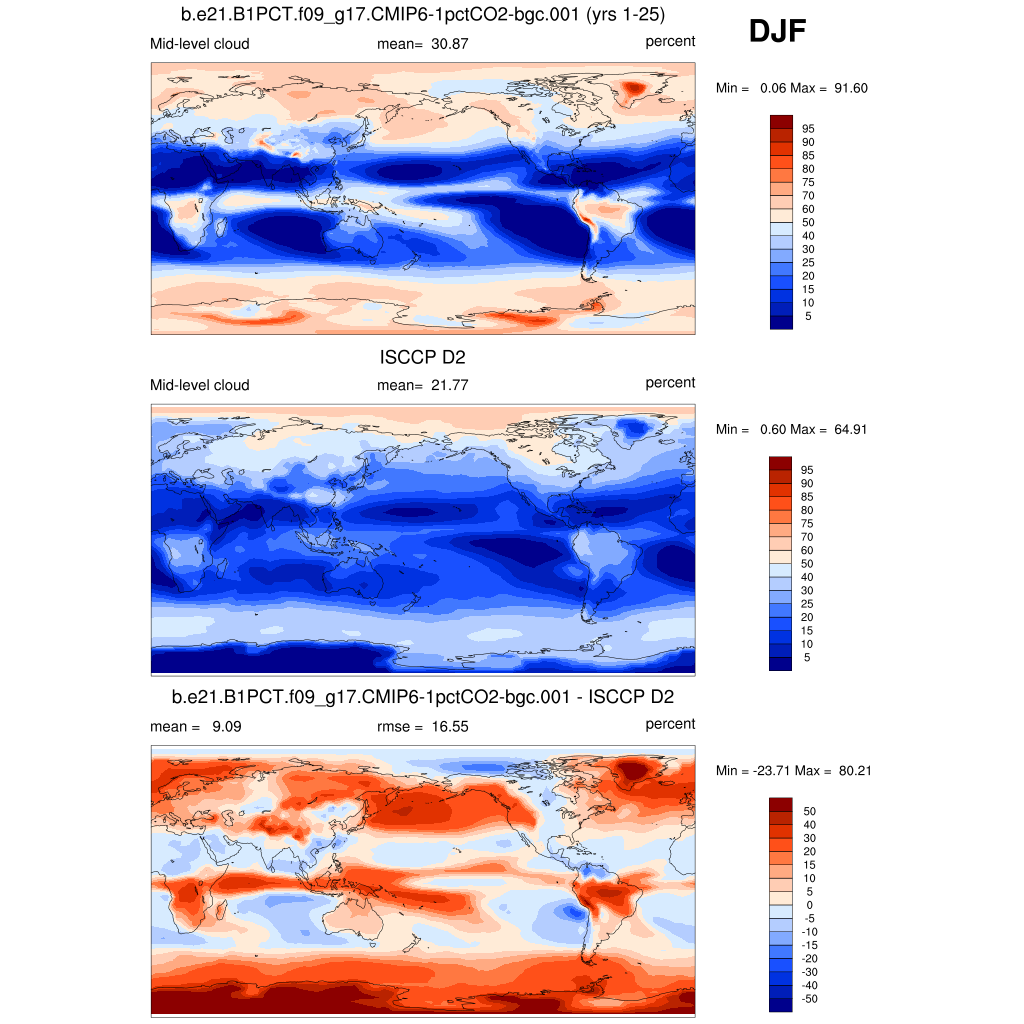
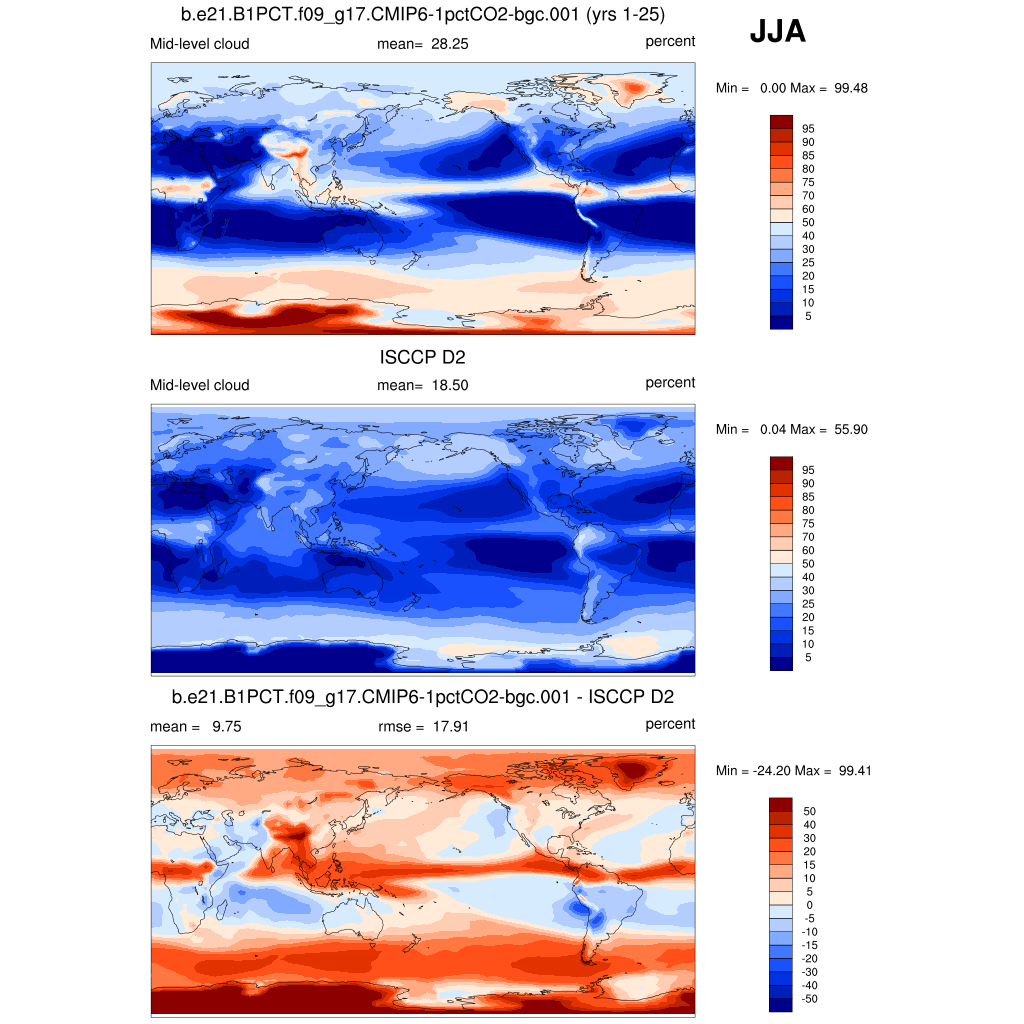
| CLDMED (IR clouds) | Mid cloud amount | plot | plot | plot |
| CLDMED (VIS/IR/NIR clouds) | Mid cloud amount | plot | plot | plot |
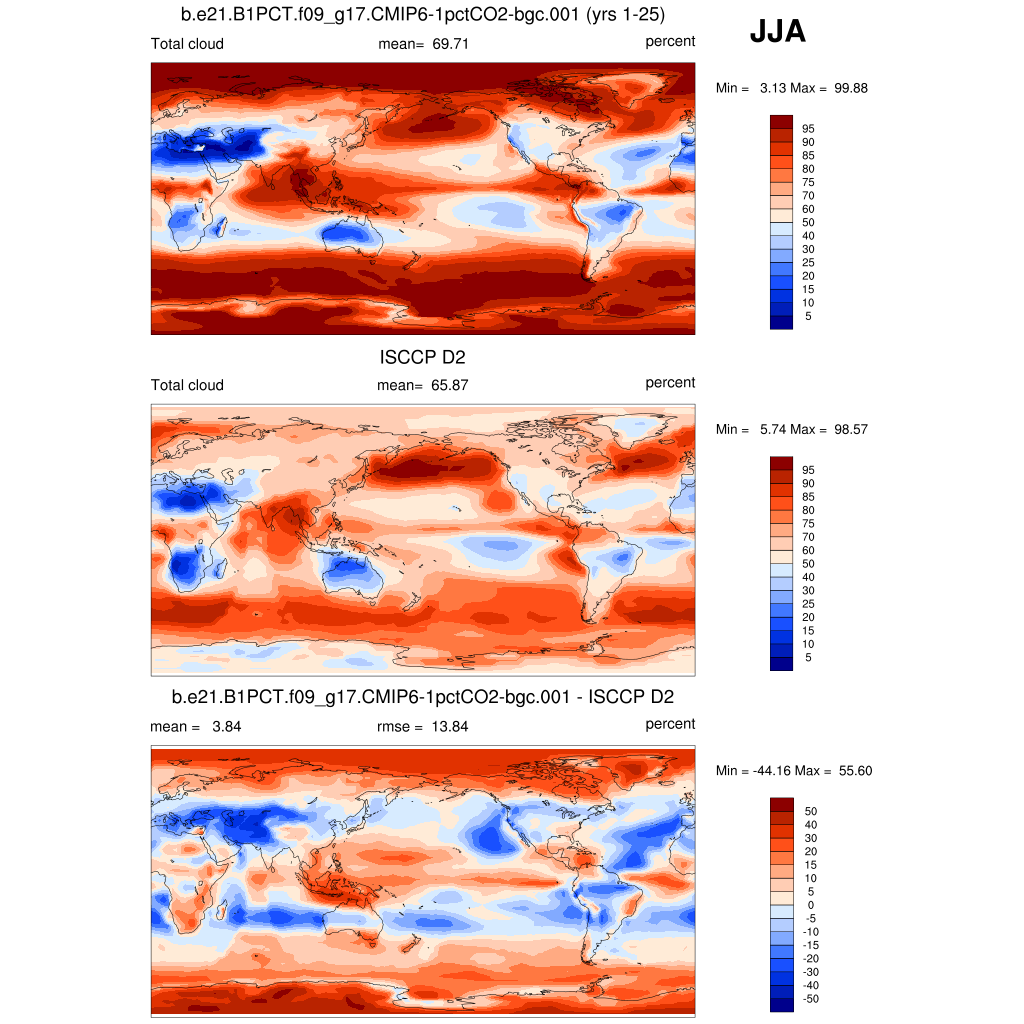
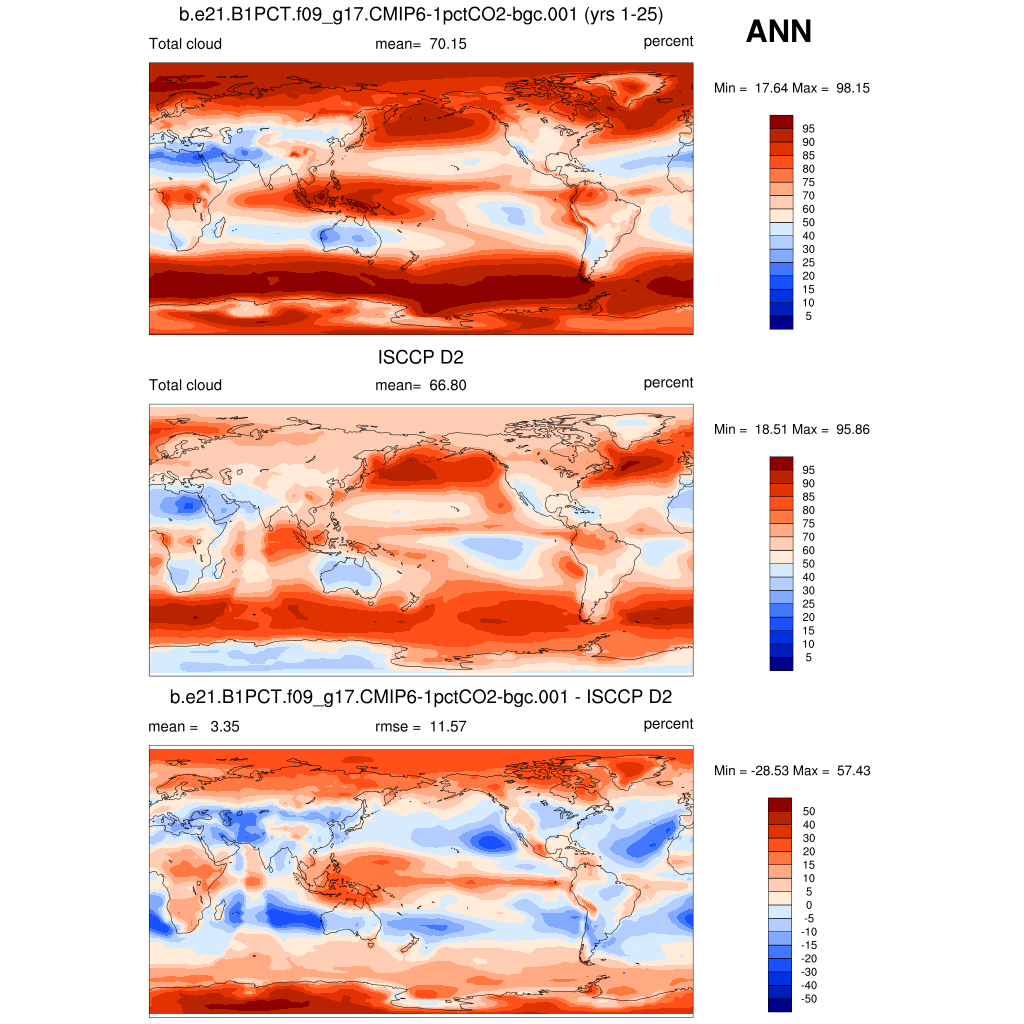
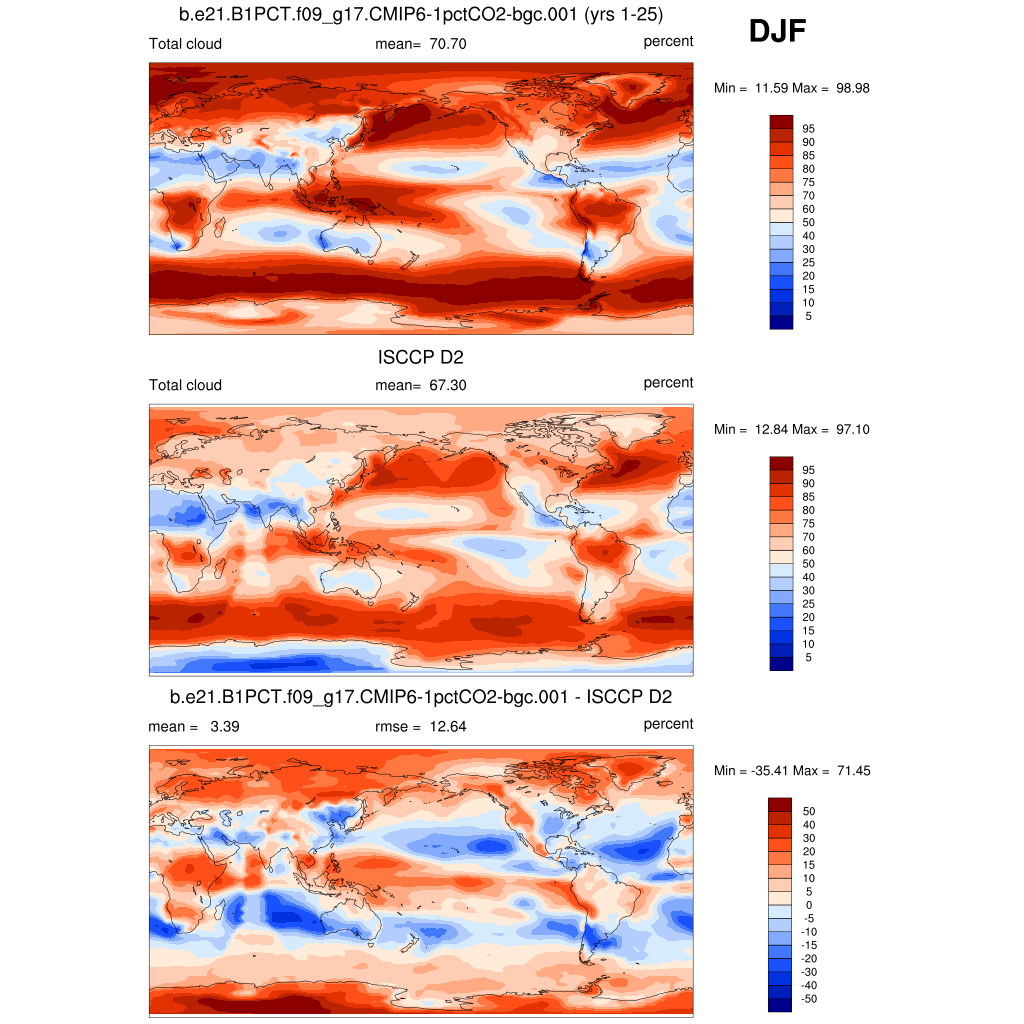
| CLDTOT (IR clouds) * | Total cloud amount | plot | plot | plot |
| CLDTOT (VIS/IR/NIR clouds) * | Total cloud amount | plot | plot | plot |
| ISCCP D1 Daytime Jul1983-Sep2001 | DJF | JJA | ANN | |
| MEANPTOP | Mean cloud top pressure | plot | plot | plot |
| MEANTTOP | Mean cloud top temperature | plot | plot | plot |
| MEANTAU | Mean cloud optical thickness | plot | plot | plot |
| TCLDAREA | Total cloud area | plot | plot | plot |
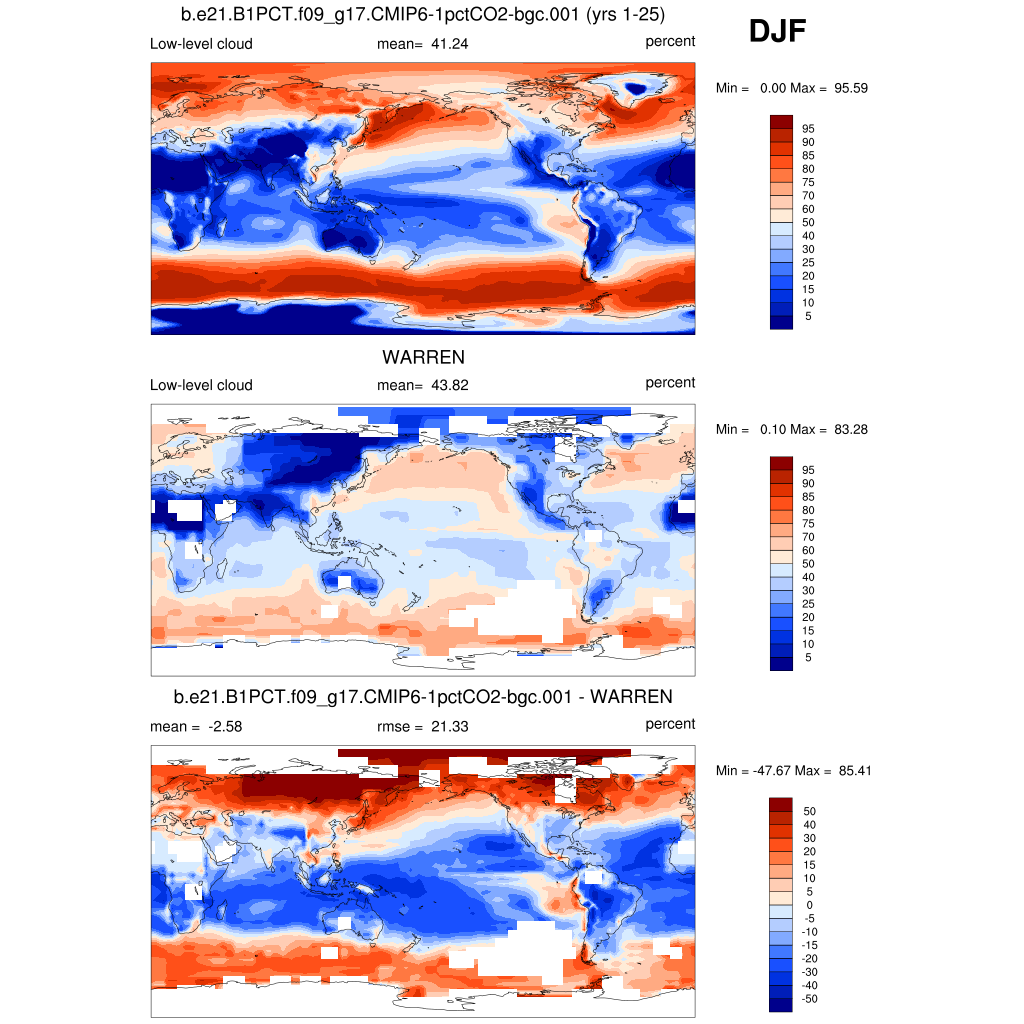
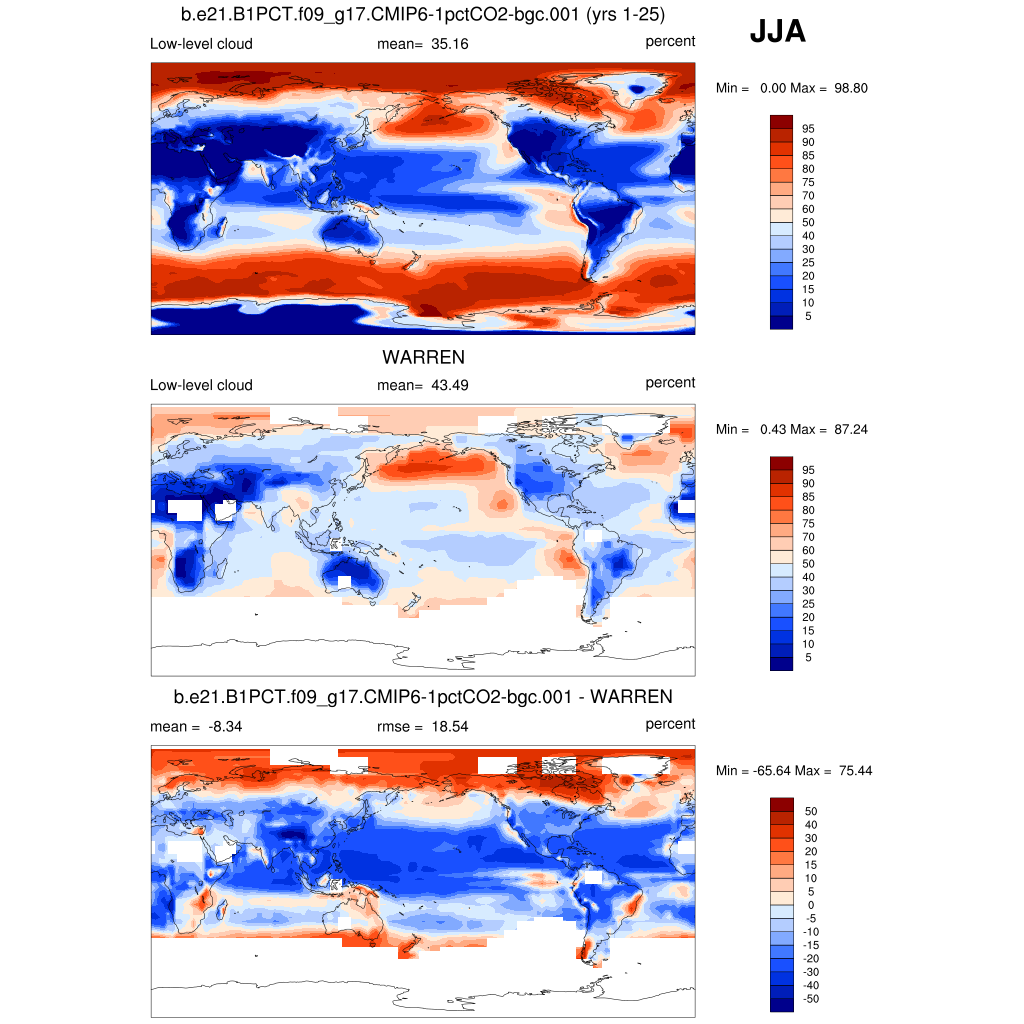
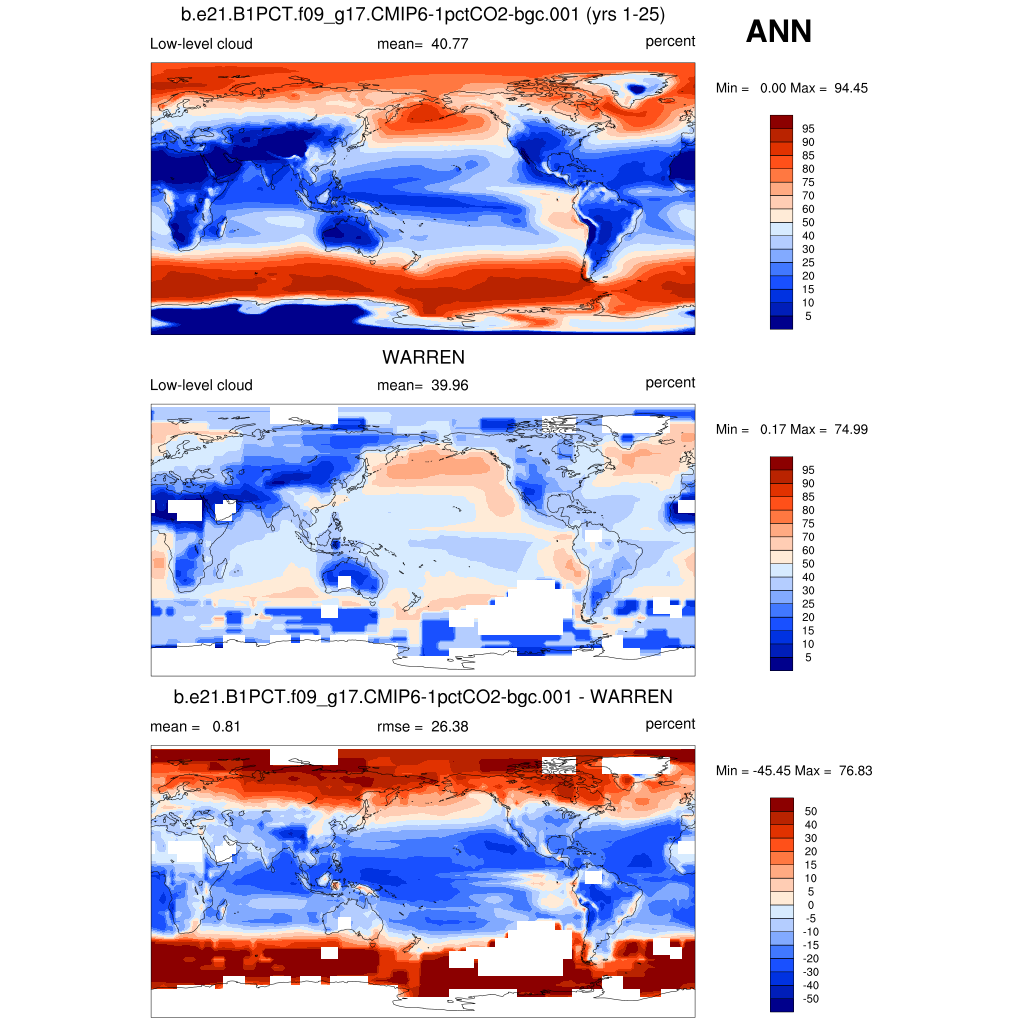
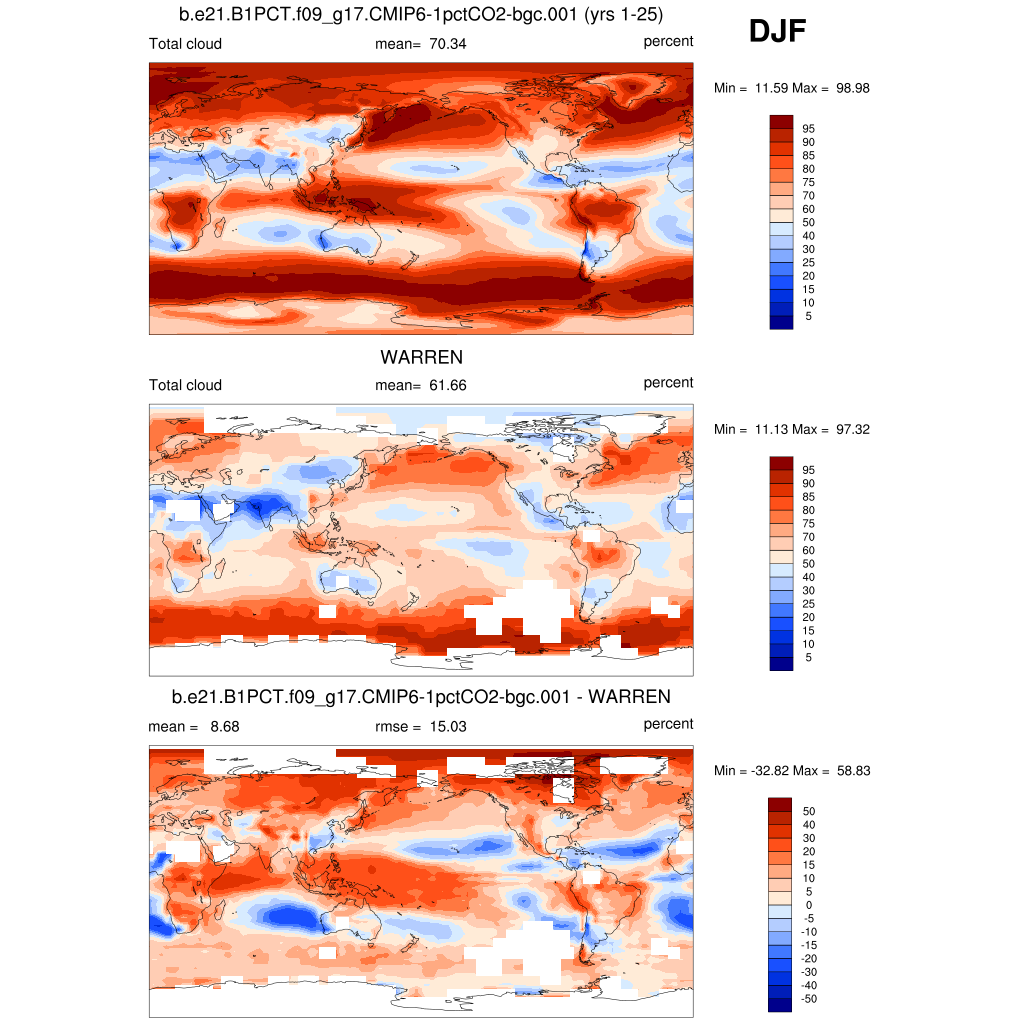
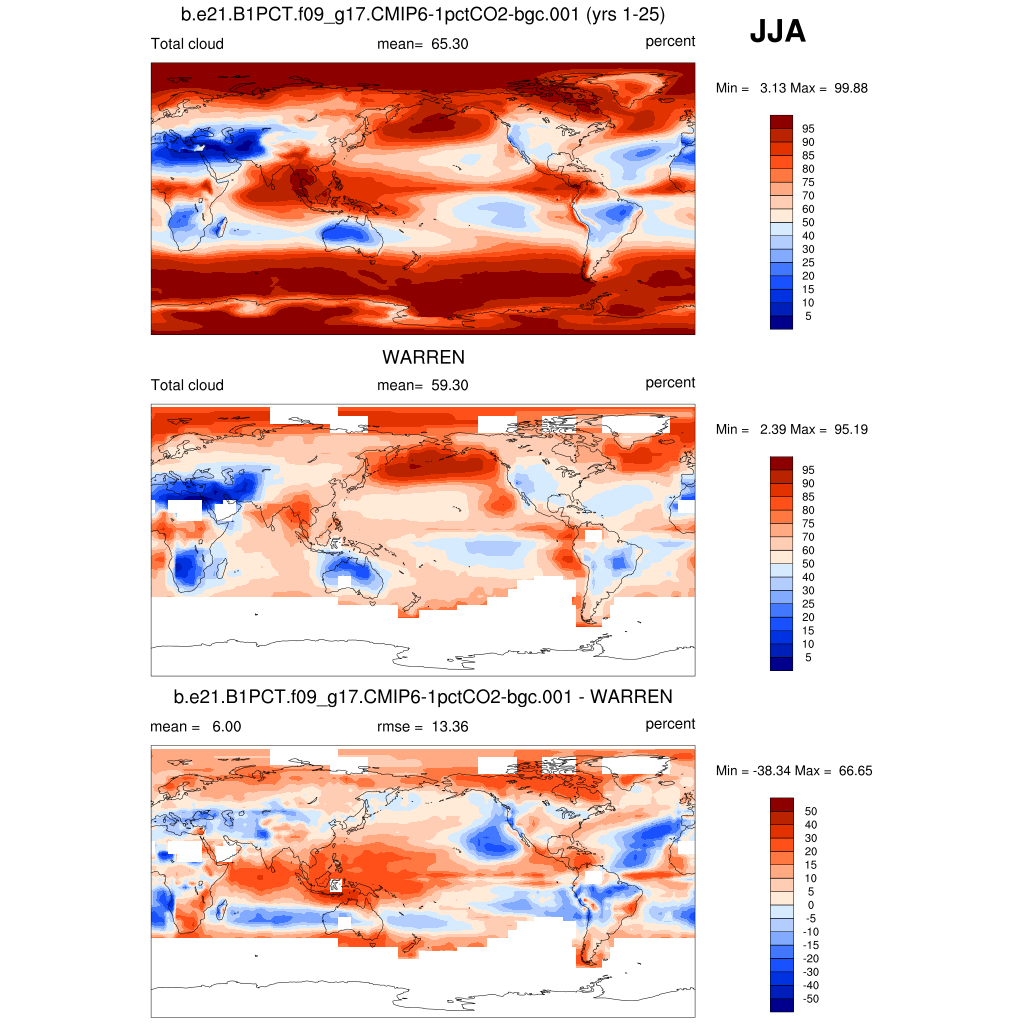
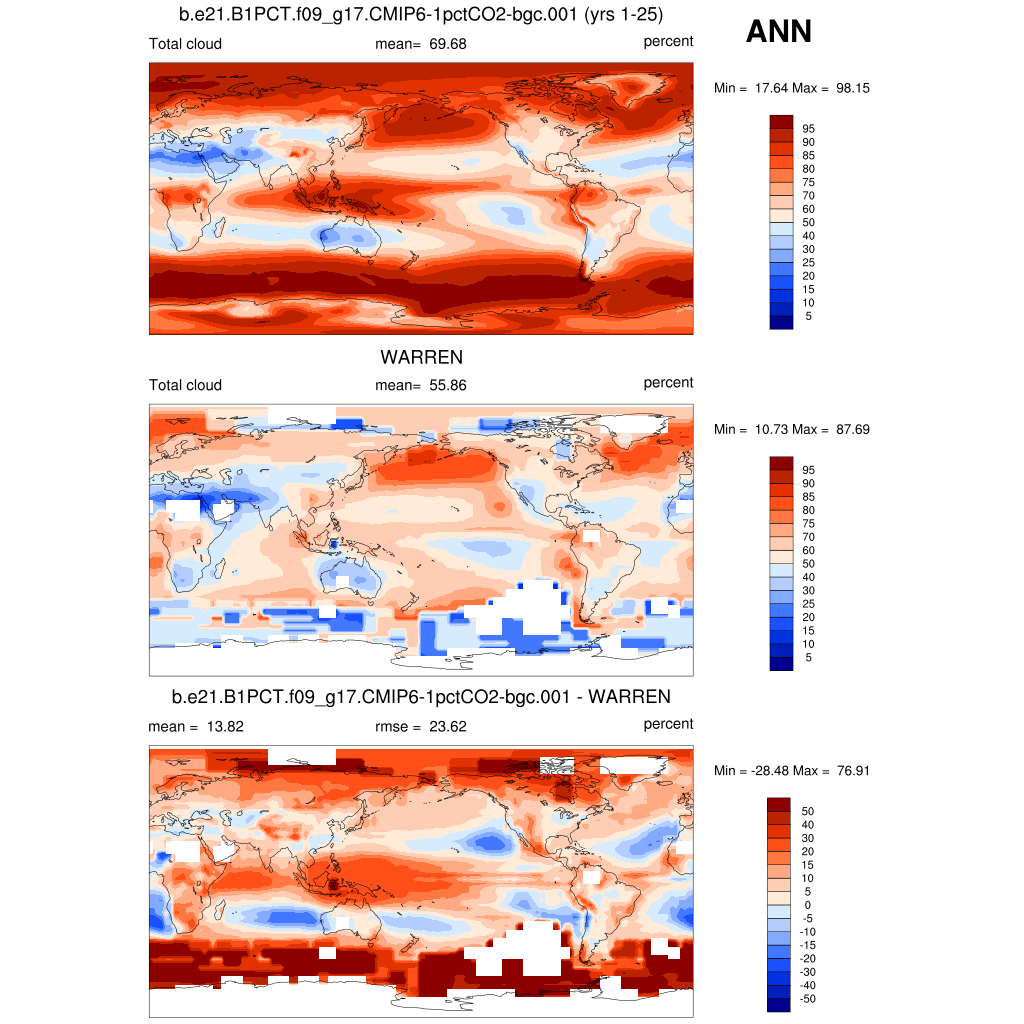
| Warren Cloud Surface OBS | DJF | JJA | ANN | |
| CLDLOW | Low cloud amount | plot | plot | plot |
| CLDTOT * | Total cloud amount | plot | plot | plot |
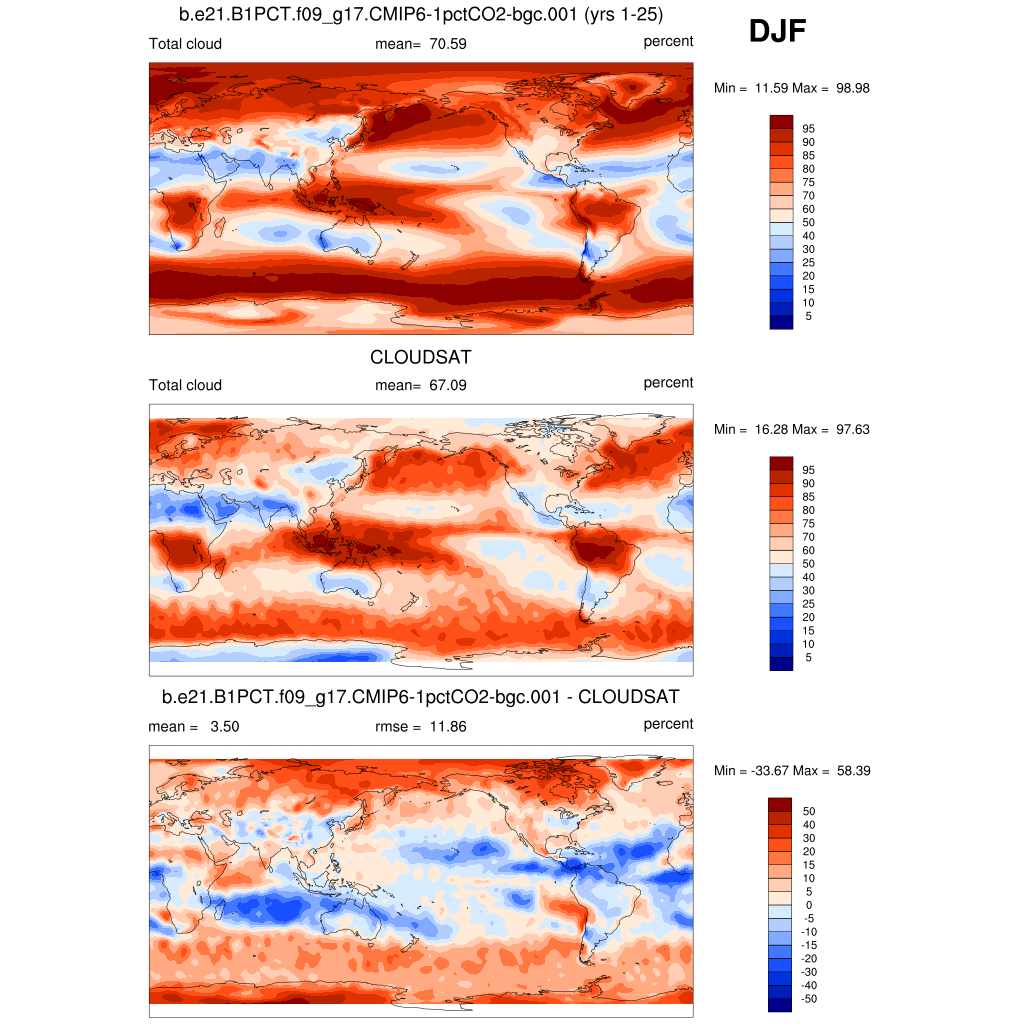
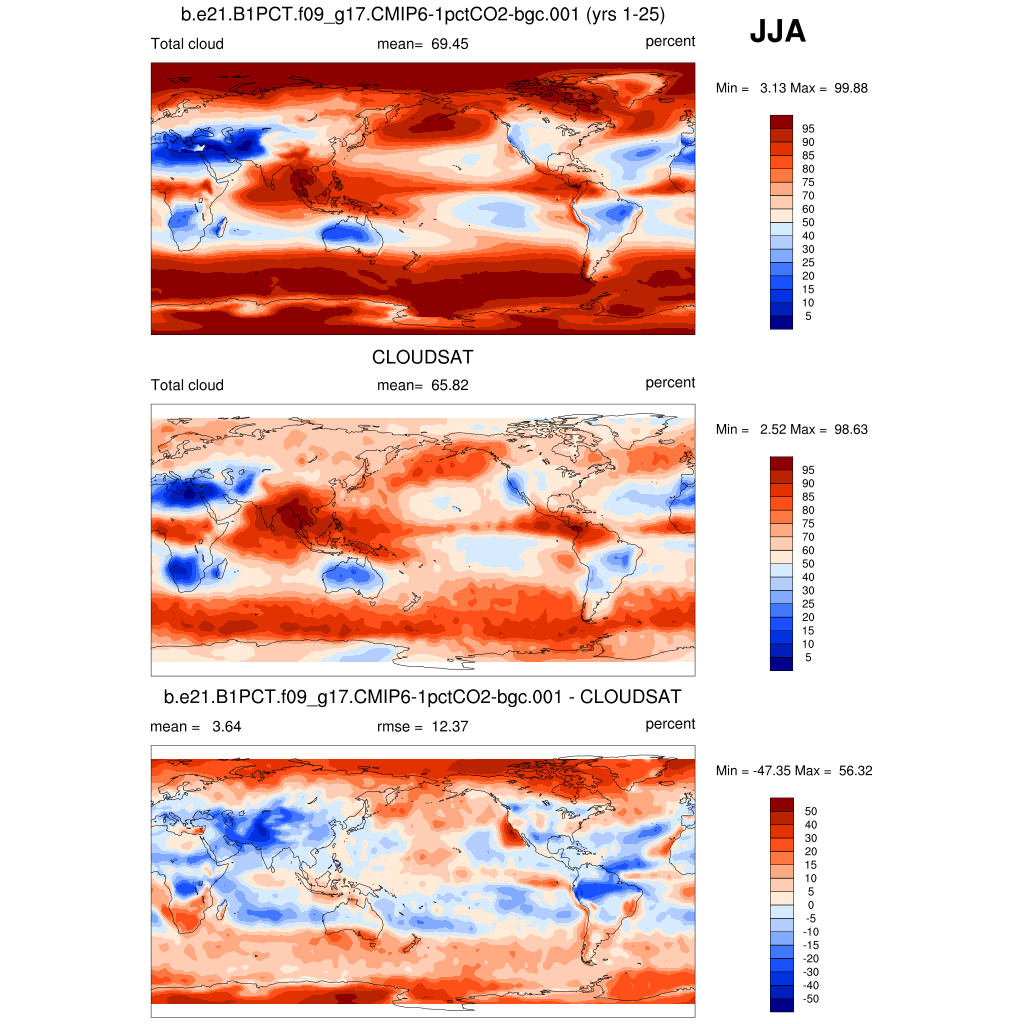
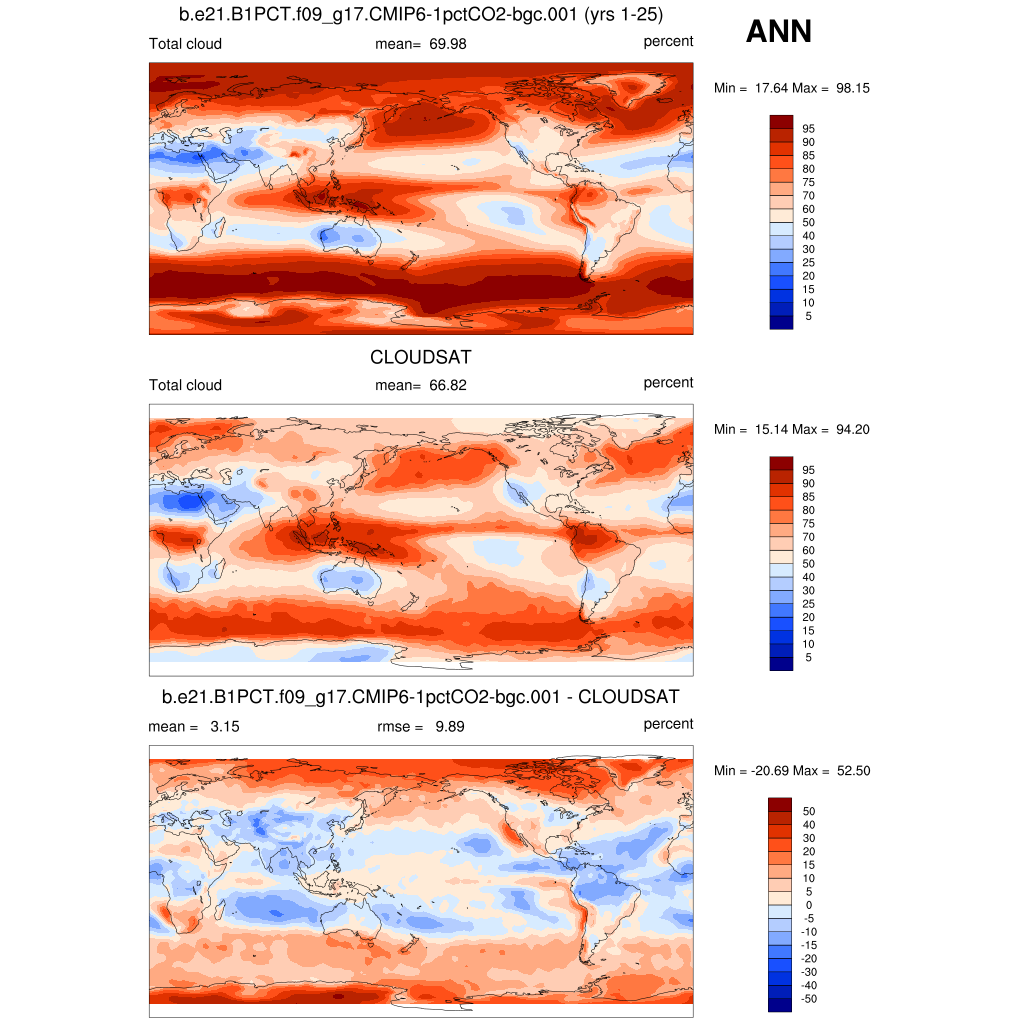
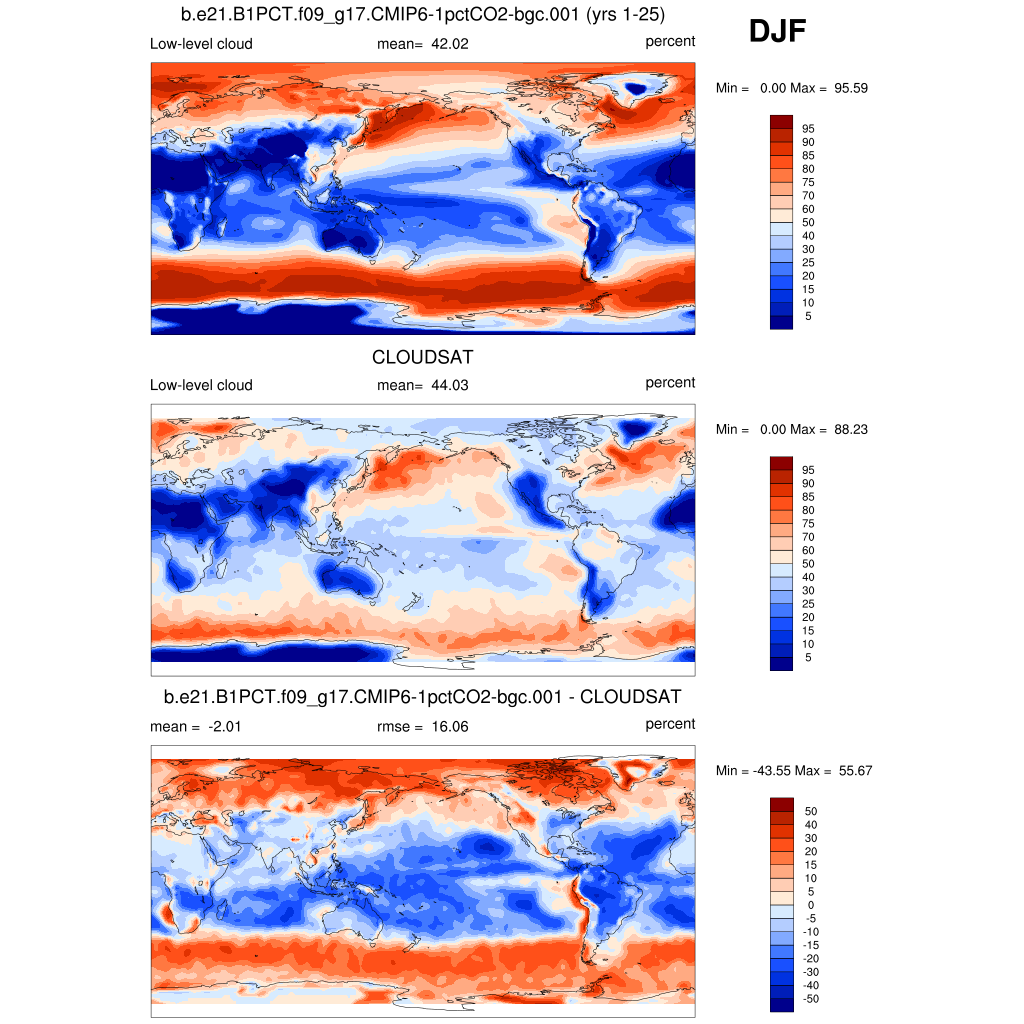
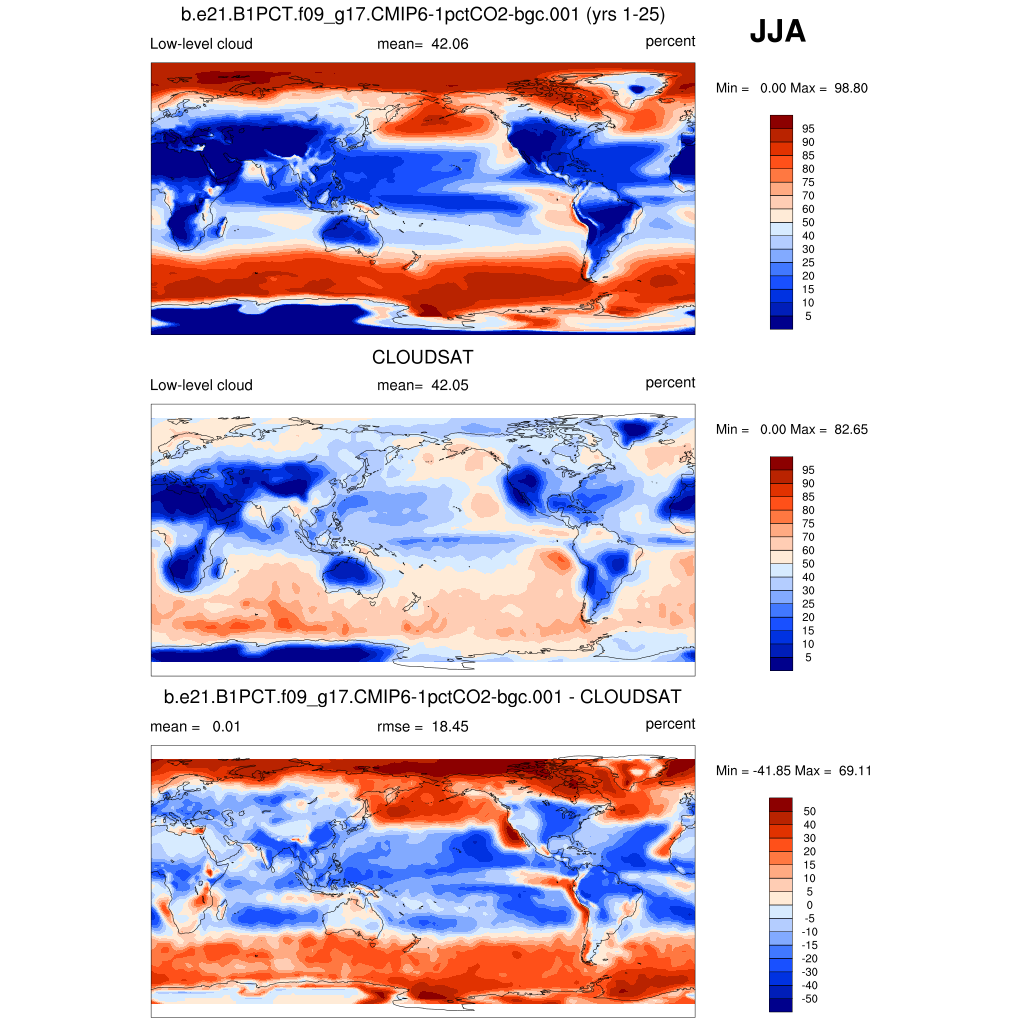
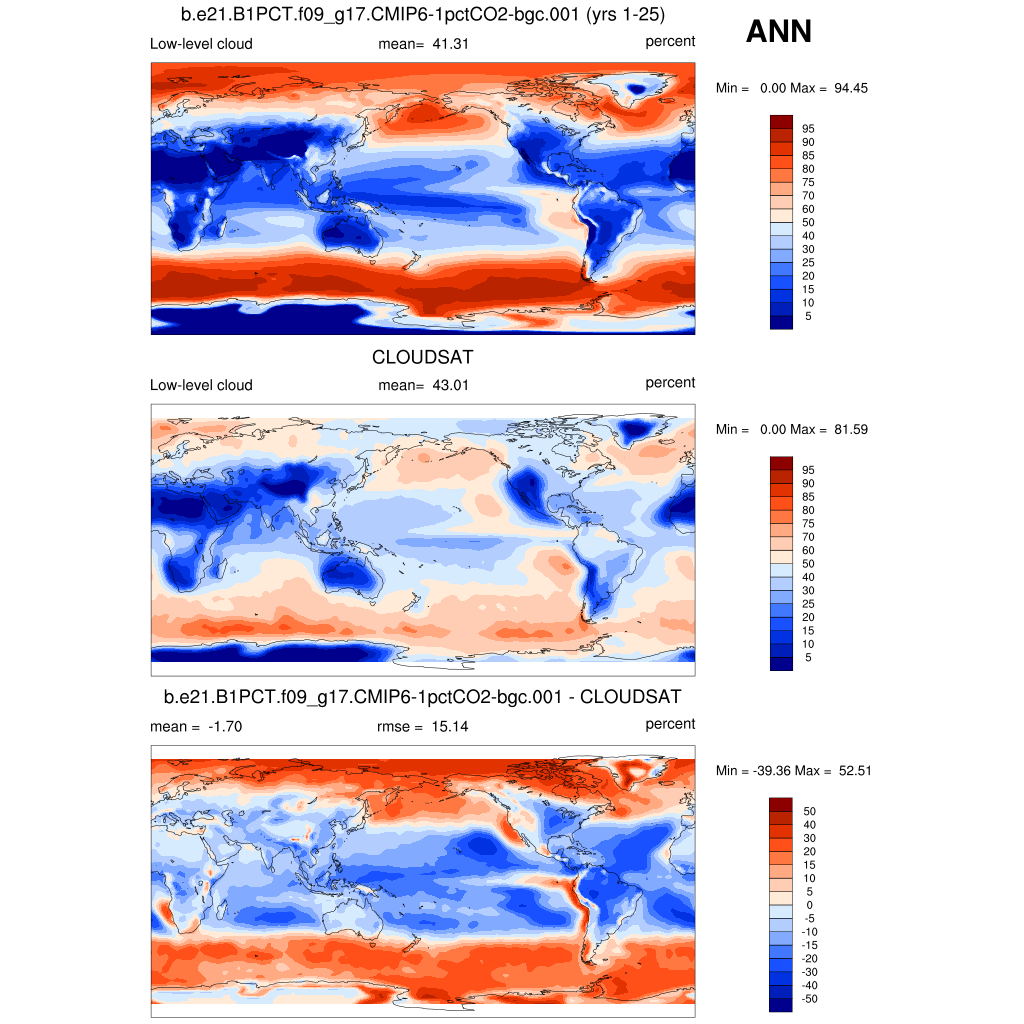
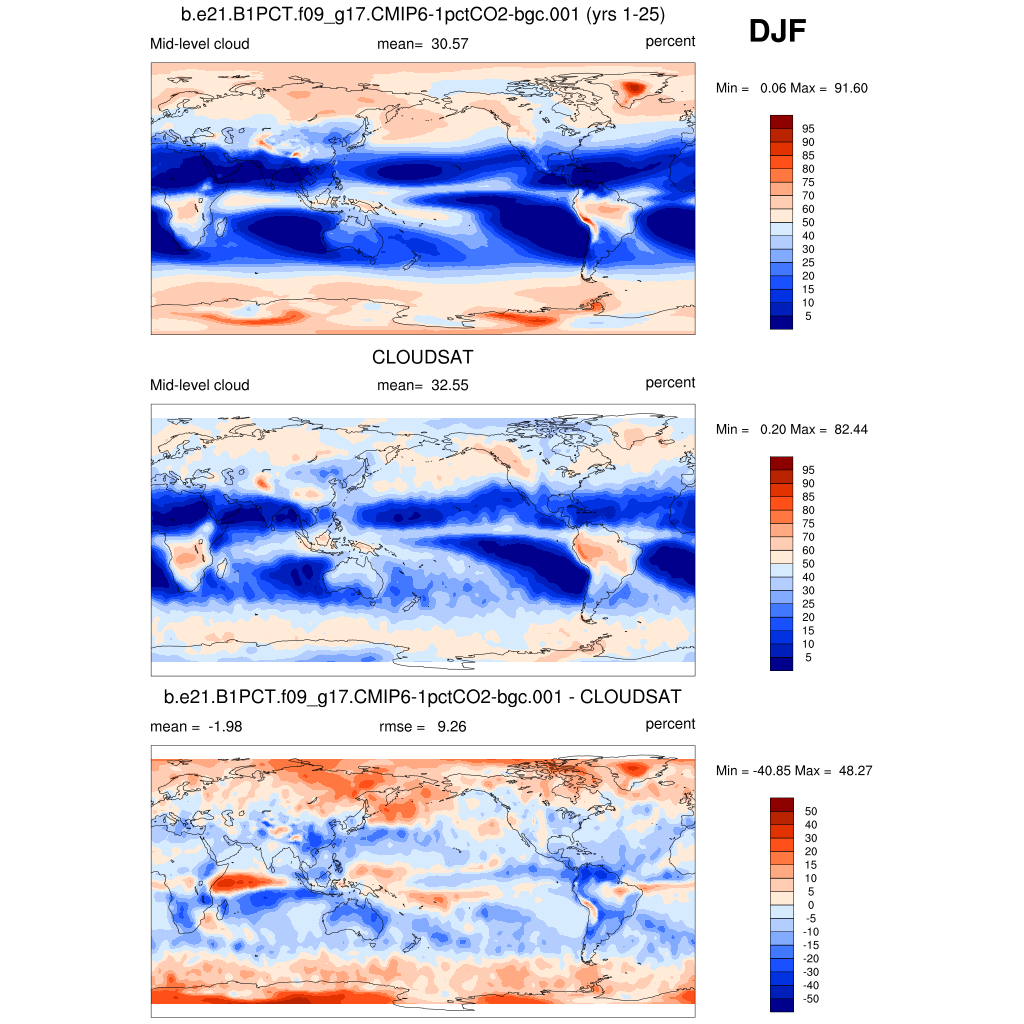
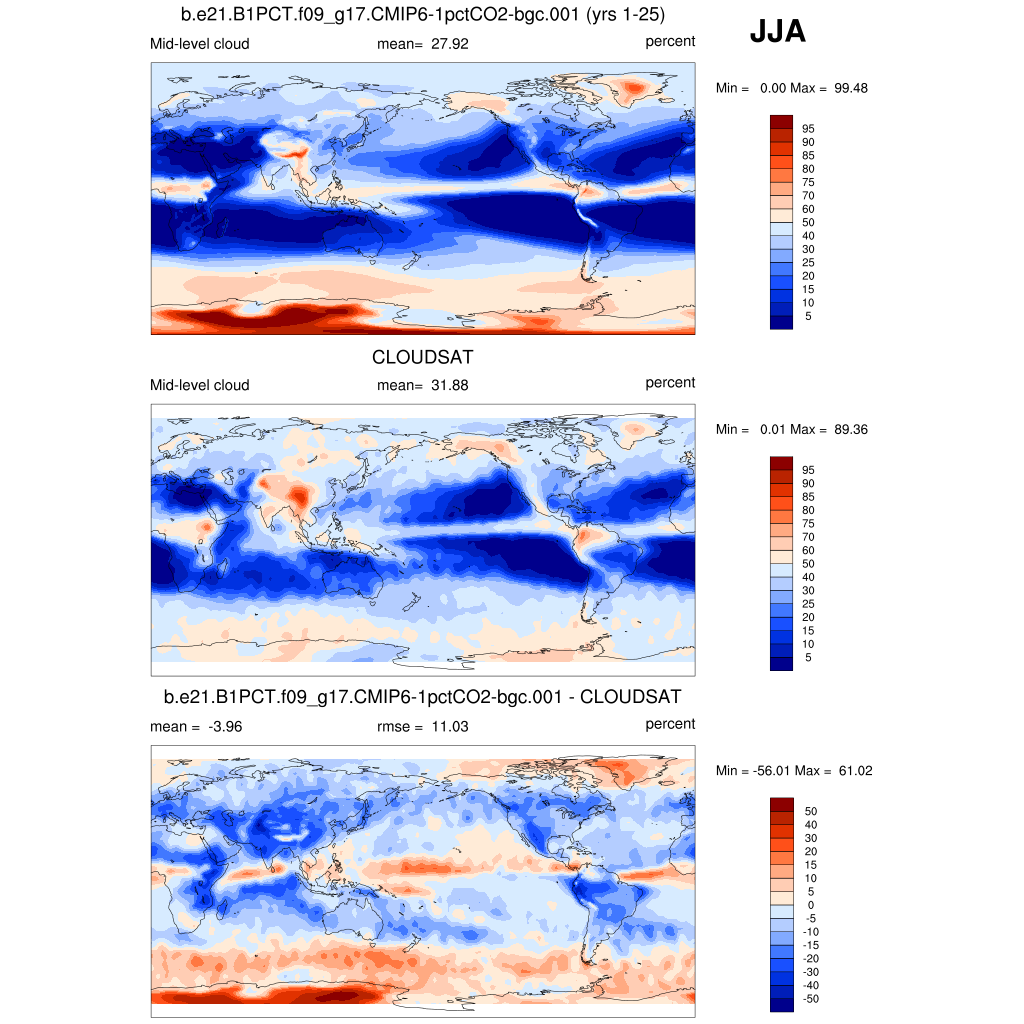
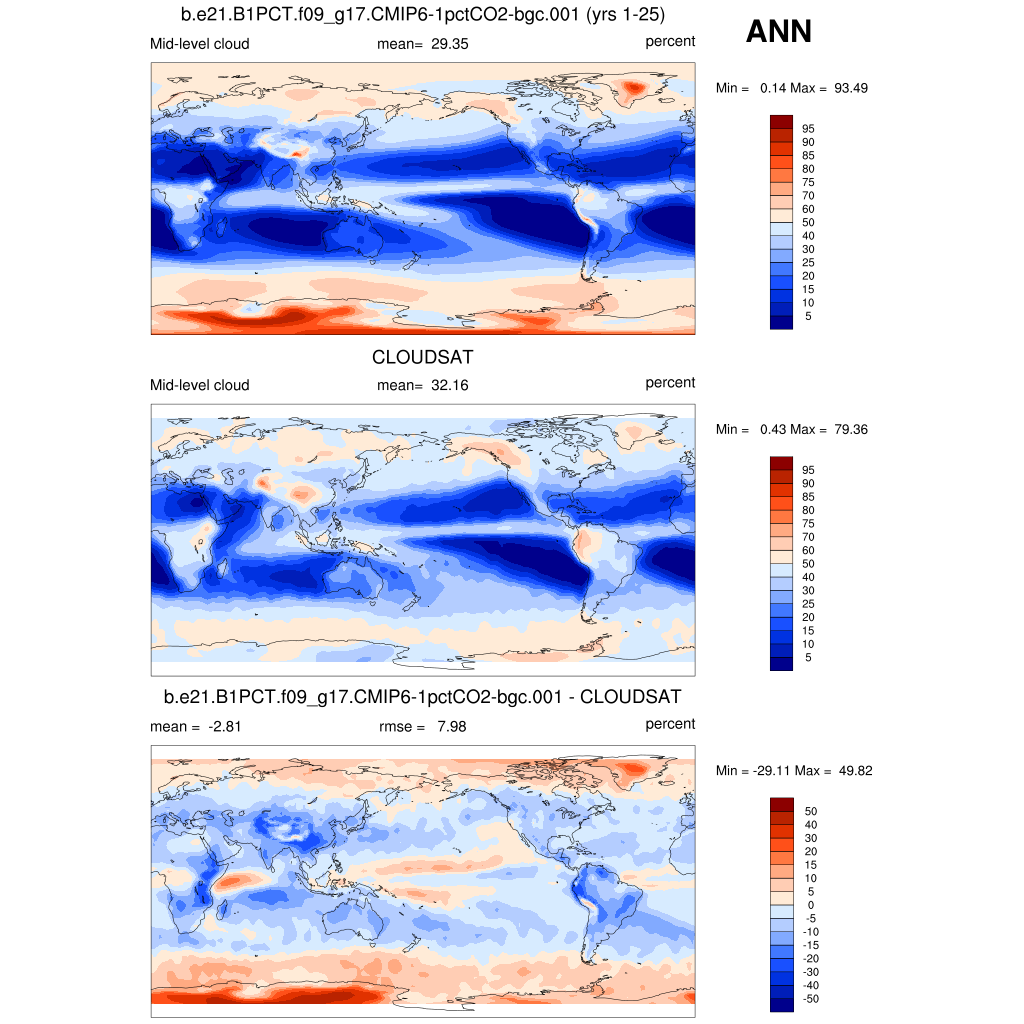
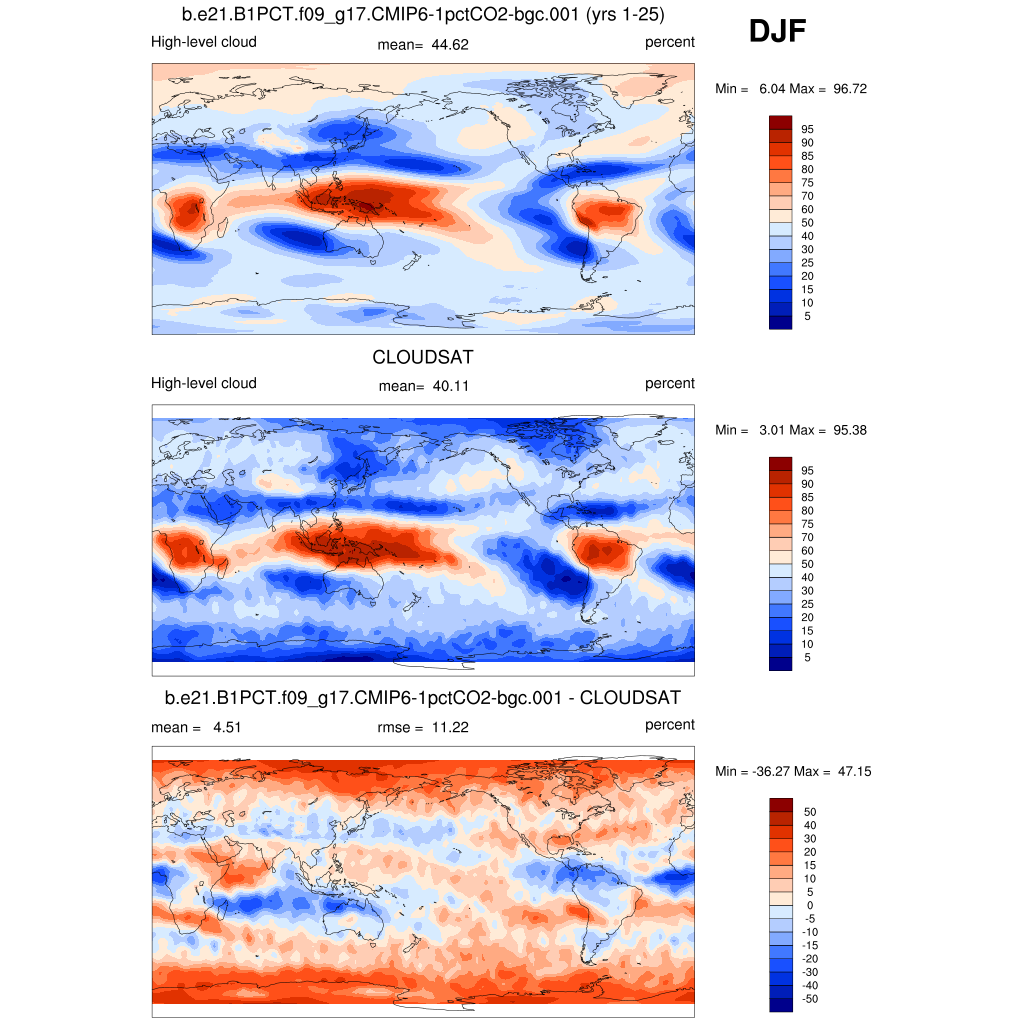
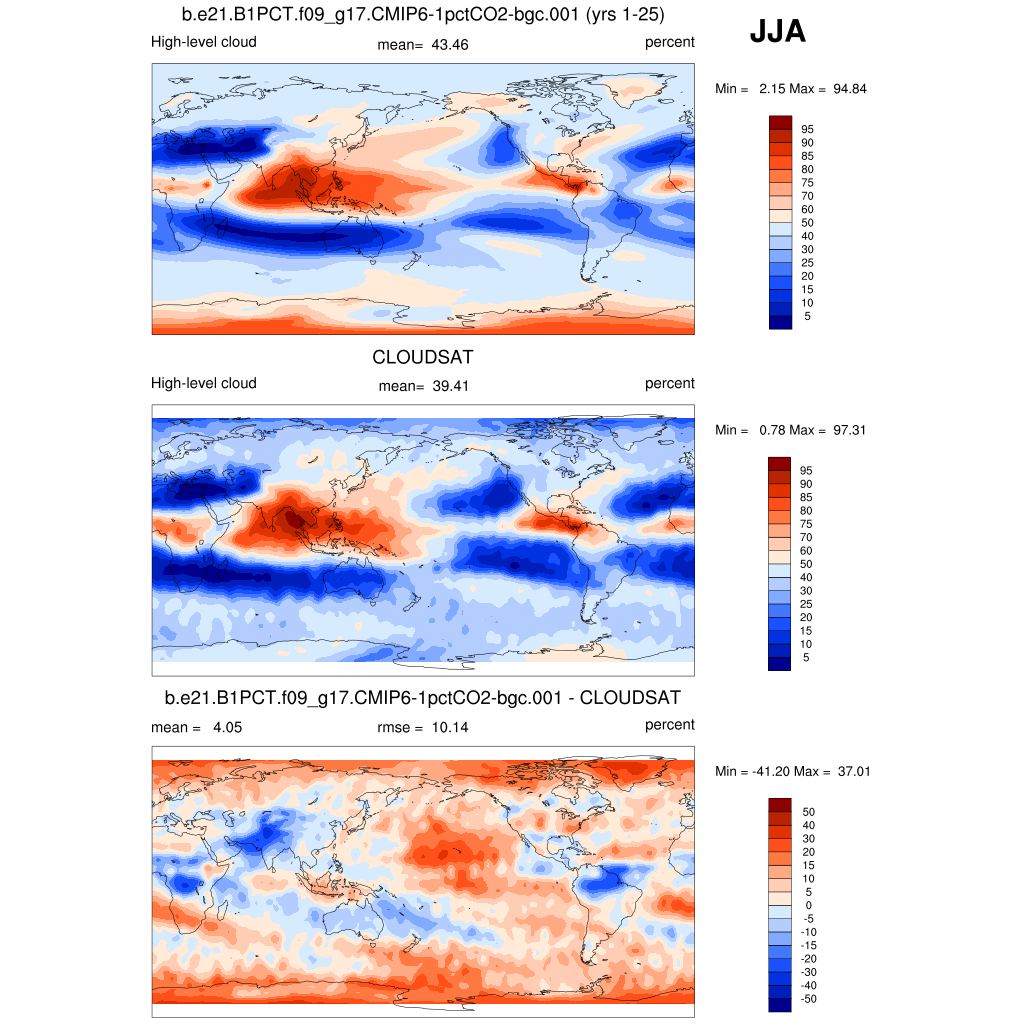
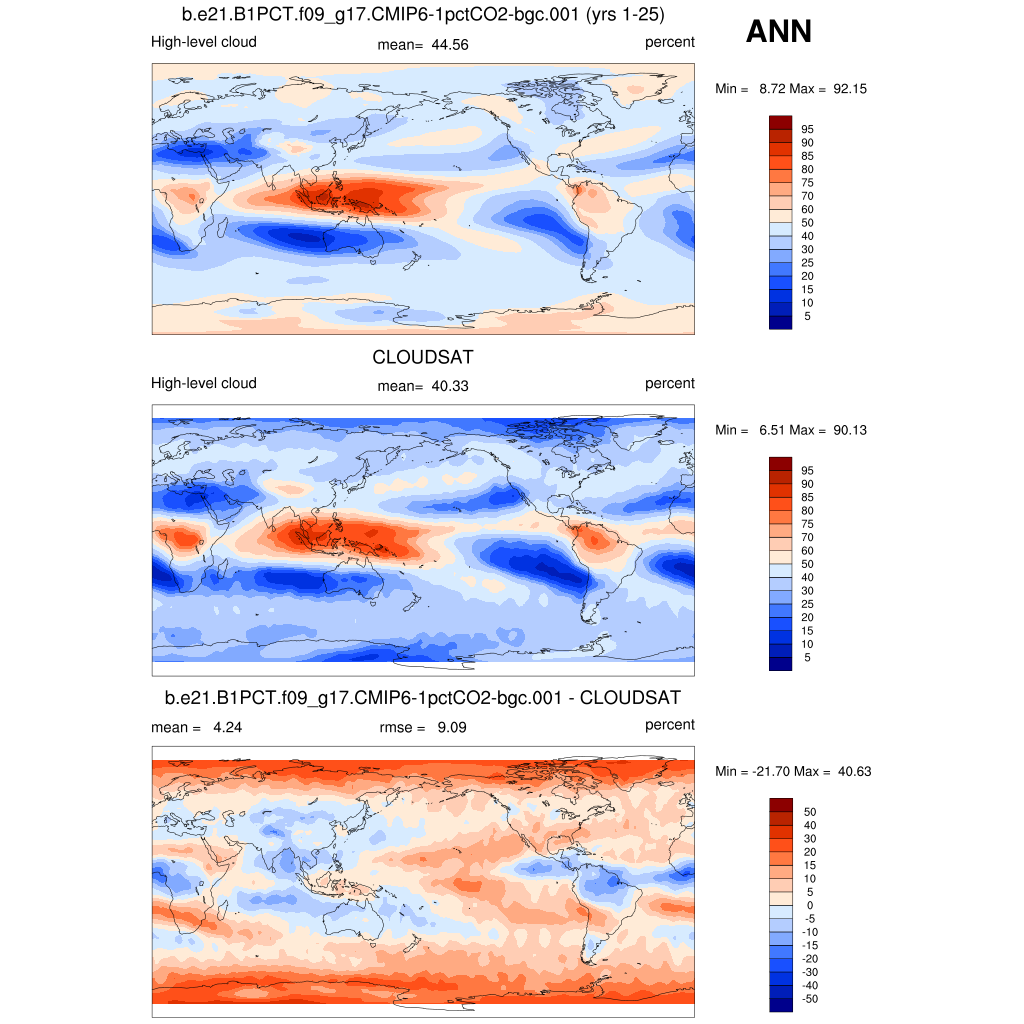
| CLOUDSAT (Radar+Lidar) Sep2006-Dec2010 | DJF | JJA | ANN | |
| CLDTOT * | Total cloud amount | plot | plot | plot |
| CLDLOW | Low cloud amount | plot | plot | plot |
| CLDMED | Medium cloud amount | plot | plot | plot |
| CLDHGH | High cloud amount | plot | plot | plot |
| CFMIP Observation Simulator Package
(COSP) Primary Diagnostics | ||||
| CALIPSO GOCCP 2007-2010 | DJF | JJA | ANN | |
| CLDTOT_CAL | Total cloud amount | plot | plot | plot |
| CLDLOW_CAL | Low-level cloud amount | plot | plot | plot |
| CLDMED_CAL | Mid-level cloud amount | plot | plot | plot |
| CLDHGH_CAL | High-level cloud amount | plot | plot | plot |
| ISCCP-COSP From D1 Daytime Jul1983-Jun2008 | DJF | JJA | ANN | |
| CLDTOT_ISCCPCOSP | Total cloud amount (tau > 0.3) | plot | plot | plot |
| CLDTHICK_ISCCPCOSP | Optically thick cloud amount (tau > 23.0) | plot | plot | plot |
| MISR L3 CTH-OD V5 Mar2000-Nov2009 | DJF | JJA | ANN | |
| CLDTOT_MISR | Total cloud amount (tau > 0.3) | plot | plot | plot |
| CLDTHICK_MISR | Optically thick cloud amount (tau > 23.0) | plot | plot | plot |
| MODIS-COSP 2003-2010 | DJF | JJA | ANN | |
| CLDTOT_MODIS | Total cloud amount (tau > 0.3) | plot | plot | plot |
| CLDTHICK_MODIS | Optically thick cloud amount (tau > 23.0) | plot | plot | plot |
| Additional COSP Diagnostics | ||||
| CALIPSO GOCCP 2007-2010 | DJF | JJA | ANN | |
| CLDTOT_CAL | Total cloud amount | plot | plot | plot |
| CLDLOW_CAL | Low-level cloud amount | plot | plot | plot |
| CLDMED_CAL | Mid-level cloud amount | plot | plot | plot |
| CLDHGH_CAL | High-level cloud amount | plot | plot | plot |
| CLOUDSAT-COSP From Level 2 GEOPROF Jun2006-Nov2010 | DJF | JJA | ANN | |
| CLDTOT_CS2 | Total cloud amount | plot | plot | plot |
| ISCCP-COSP From D1 Daytime Jul1983-Jun2008 | DJF | JJA | ANN | |
| CLDTOT_ISCCPCOSP | Total cloud amount (tau > 0.3) | plot | plot | plot |
| CLDLOW_ISCCPCOSP | Low-topped cloud amount (tau > 0.3) | plot | plot | plot |
| CLDMED_ISCCPCOSP | Mid-topped cloud amount (tau > 0.3) | plot | plot | plot |
| CLDHGH_ISCCPCOSP | High-topped cloud amount (tau > 0.3) | plot | plot | plot |
| CLDTHICK_ISCCPCOSP | Optically thick cloud amount (tau > 23.0) | plot | plot | plot |
| MEANPTOP_ISCCPCOSP | Mean cloud top pressure | plot | plot | plot |
| MEANCLDALB_ISCCPCOSP | Mean cloud albedo | plot | plot | plot |
| MISR L3 CTH-OD V5 Mar2000-Nov2009 | DJF | JJA | ANN | |
| CLDTOT_MISR | Total cloud amount (tau > 0.3) | plot | plot | plot |
| CLDLOW_MISR | Low-topped cloud amount (tau > 0.3) | plot | plot | plot |
| CLDMED_MISR | Mid-topped cloud amount (tau > 0.3) | plot | plot | plot |
| CLDHGH_MISR | High-topped cloud amount (tau > 0.3) | plot | plot | plot |
| CLDTHICK_MISR | Optically thick cloud amount (tau > 23.0) | plot | plot | plot |
| MODIS-COSP 2003-2010 | DJF | JJA | ANN | |
| CLDTOT_MODIS | Total cloud amount (tau > 0.3) | plot | plot | plot |
| CLDLOW_MODIS | Low-topped cloud amount (tau > 0.3) | plot | plot | plot |
| CLDMED_MODIS | Mid-topped cloud amount (tau > 0.3) | plot | plot | plot |
| CLDHGH_MODIS | High-topped cloud amount (tau > 0.3) | plot | plot | plot |
| CLDTHICK_MODIS | Optically thick cloud amount (tau > 23.0) | plot | plot | plot |
| CLIMODIS | Total ice cloud amount | plot | plot | plot |
| CLWMODIS | Total liquid cloud amount | plot | plot | plot |
| IWPMODIS | Mean ice water path | plot | plot | plot |
| LWPMODIS | Mean liquid water path | plot | plot | plot |
| PCTMODIS | Mean cloud top pressure | plot | plot | plot |
| REFFCLIMODIS | Mean effective radius (ice clouds) | plot | plot | plot |
| REFFCLWMODIS | Mean effective radius (liquid clouds) | plot | plot | plot |
| TAUILOGMODIS | Log-weighted mean optical thickness (ice clouds) | plot | plot | plot |
| TAUWLOGMODIS | Log-weighted mean optical thickness (liquid clouds) | plot | plot | plot |
| TAUTLOGMODIS | Log-weighted mean optical thickness (all clouds) | plot | plot | plot |
| TAUIMODIS | Mean optical thickness (ice clouds) | plot | plot | plot |
| TAUWMODIS | Mean optical thickness (liquid clouds) | plot | plot | plot |
| TAUTMODIS | Mean optical thickness (all clouds) | plot | plot | plot |