Mean State
Download Data |
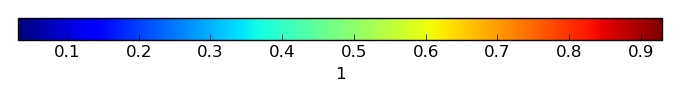
Period Mean (original grids) [1] |
Model Period Mean (intersection) [1] |
Model Period Mean (complement) [1] |
Benchmark Period Mean (intersection) [1] |
Benchmark Period Mean (complement) [1] |
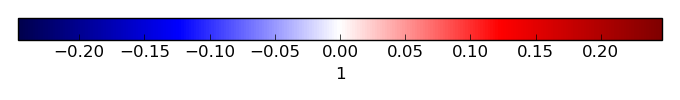
Bias [1] |
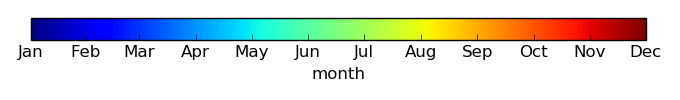
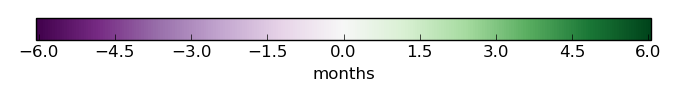
Phase Shift [months] |
Bias Score [1] |
Seasonal Cycle Score [1] |
Spatial Distribution Score [1] |
Overall Score [1] |
|||
|---|---|---|---|---|---|---|---|---|---|---|---|---|---|---|
| Benchmark | [-] | 0.487 | ||||||||||||
| CESM2_202_01 | [-] | 0.473 | 0.508 | 0.338 | 0.487 | 0.482 | 0.0220 | 1.74 | 0.81 | 0.74 | 0.98 | 0.84 | ||
| CESM2_227_01 | [-] | 0.471 | 0.508 | 0.336 | 0.486 | 0.498 | 0.0214 | 1.72 | 0.81 | 0.74 | 0.98 | 0.84 | ||
| CESM2_297_01 | [-] | 0.477 | 0.513 | 0.342 | 0.486 | 0.596 | 0.0279 | 1.75 | 0.80 | 0.74 | 0.98 | 0.84 | ||
| CLM45BGC | [-] | 0.523 | 0.568 | 0.342 | 0.487 | 0.465 | 0.0808 | 1.72 | 0.80 | 0.74 | 0.96 | 0.83 | ||
| LENS1 | [-] | 0.524 | 0.561 | 0.380 | 0.486 | 0.564 | 0.0758 | 1.73 | 0.79 | 0.74 | 0.98 | 0.84 |
Temporally integrated period mean