Download Data |
Period Mean (original grids) [Pg yr-1] |
Model Period Mean (intersection) [Pg yr-1] |
Model Period Mean (complement) [Pg yr-1] |
Benchmark Period Mean (intersection) [Pg yr-1] |
Benchmark Period Mean (complement) [Pg yr-1] |
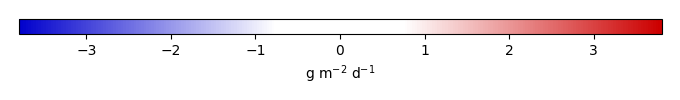
Bias [g m-2 d-1] |
RMSE [g m-2 d-1] |
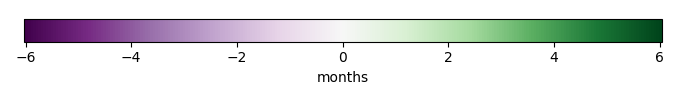
Phase Shift [months] |
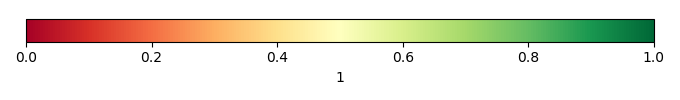
Bias Score [1] |
RMSE Score [1] |
Seasonal Cycle Score [1] |
Spatial Distribution Score [1] |
Overall Score [1] |
|||
---|---|---|---|---|---|---|---|---|---|---|---|---|---|---|---|---|
Benchmark | [-] | 119. | ||||||||||||||
CESM2_1_001 | [-] | 111. | 106. | 4.83 | 118. | 0.774 | -0.0797 | 1.73 | 1.52 | 0.41 | 0.36 | 0.79 | 0.93 | 0.57 | ||
CESM2_1_002 | [-] | 112. | 107. | 4.86 | 118. | 0.774 | -0.0659 | 1.74 | 1.52 | 0.41 | 0.36 | 0.79 | 0.93 | 0.57 | ||
CESM2_1_003 | [-] | 111. | 106. | 4.84 | 118. | 0.774 | -0.0764 | 1.73 | 1.53 | 0.41 | 0.36 | 0.78 | 0.94 | 0.57 | ||
CESM2_1_FV2_001 | [-] | 150. | 117. | 33.7 | 118. | 0.413 | -0.0356 | 1.78 | 1.56 | 0.41 | 0.36 | 0.78 | 0.93 | 0.57 | ||
CESM2_1_WFV2_001 | [-] | 153. | 120. | 33.7 | 118. | 0.413 | 0.0268 | 1.80 | 1.56 | 0.41 | 0.36 | 0.78 | 0.93 | 0.57 | ||
LENS1 | [-] | 131. | 125. | 5.28 | 118. | 0.802 | 0.358 | 1.68 | 1.37 | 0.41 | 0.35 | 0.76 | 0.90 | 0.55 | ||
LENS10 | [-] | 131. | 125. | 5.29 | 118. | 0.802 | 0.354 | 1.67 | 1.38 | 0.41 | 0.35 | 0.76 | 0.89 | 0.55 | ||
LENS5 | [-] | 131. | 126. | 5.38 | 118. | 0.802 | 0.373 | 1.68 | 1.39 | 0.41 | 0.35 | 0.75 | 0.89 | 0.55 |
Download Data |
Precipitation Hellinger Distance [1] |
SurfaceAirTemperature Hellinger Distance [1] |
SurfaceDownwardSWRadiation Hellinger Distance [1] |
SurfaceNetSWRadiation Hellinger Distance [1] |
Evapotranspiration Hellinger Distance [1] |
SurfaceNetSWRadiation RMSE Score [1] |
Evapotranspiration RMSE Score [1] |
SurfaceDownwardSWRadiation RMSE Score [1] |
SurfaceAirTemperature RMSE Score [1] |
Precipitation RMSE Score [1] |
Overall Score [1] |
||
---|---|---|---|---|---|---|---|---|---|---|---|---|---|
CESM2_1_001 | [-] | 0.312 | 0.281 | 0.443 | 0.330 | 0.405 | 0.80 | 0.85 | 0.73 | 0.84 | 0.88 | 0.82 | |
CESM2_1_002 | [-] | 0.311 | 0.279 | 0.443 | 0.330 | 0.404 | 0.80 | 0.86 | 0.73 | 0.84 | 0.89 | 0.82 | |
CESM2_1_003 | [-] | 0.312 | 0.280 | 0.442 | 0.334 | 0.407 | 0.80 | 0.85 | 0.72 | 0.84 | 0.89 | 0.82 | |
CESM2_1_FV2_001 | [-] | 0.303 | 0.269 | 0.441 | 0.326 | 0.408 | 0.82 | 0.86 | 0.73 | 0.84 | 0.90 | 0.83 | |
CESM2_1_WFV2_001 | [-] | 0.302 | 0.279 | 0.440 | 0.337 | 0.406 | 0.83 | 0.86 | 0.73 | 0.84 | 0.91 | 0.83 | |
LENS1 | [-] | 0.339 | 0.304 | 0.479 | 0.395 | 0.443 | 0.64 | 0.84 | 0.60 | 0.65 | 0.75 | 0.70 | |
LENS10 | [-] | 0.343 | 0.300 | 0.481 | 0.394 | 0.443 | 0.64 | 0.84 | 0.60 | 0.65 | 0.78 | 0.70 | |
LENS5 | [-] | 0.340 | 0.300 | 0.479 | 0.394 | 0.442 | 0.63 | 0.84 | 0.59 | 0.65 | 0.82 | 0.71 |
creation_date: Wed Dec 4 23:59:04 PST 2013
Conventions: Please contact Prof. James Randerson (Email: jranders@uci.edu) or Dr. Mingquan Mu (mmu@uci.edu) for any question
source_file: This product is generated from monthly FluxNet MTE observations
title: derived FluxNet MTE in 0.5x0.5
Approach: I read this variable from data file, and then save the data in NetCDF format by each month and each year. Meanwhile, I also converted the unit from g C m-2 day-1 to Kg C m-2 s-1.
Temporal resolution: monthly
General information: This product was derived from Fluxnet-MTE originally from Monthly estimates of global biosphere-atmosphere fluxes from Biogeochemistry group at Max Planck Institute in Jena, Germany.
Spatial resolution: 0.5x0.5 degree
Derived data code: http://redwood.ess.uci.edu/mingquan/www/ILAMB/Download/CODES/CODES/subroutines/convert/convert-FluxNet-MTE.ncl