Mean State
Download Data |
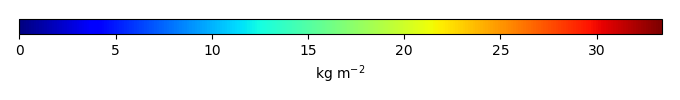
Period Mean (original grids) [Pg] |
Model Period Mean (intersection) [Pg] |
Model Period Mean (complement) [Pg] |
Benchmark Period Mean (intersection) [Pg] |
Benchmark Period Mean (complement) [Pg] |
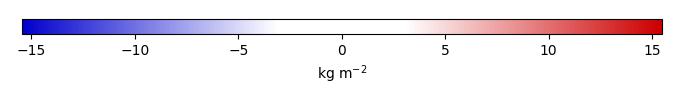
Bias [kg m-2] |
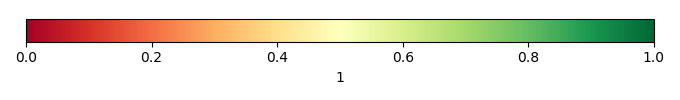
Bias Score [1] |
Spatial Distribution Score [1] |
Overall Score [1] |
|||
|---|---|---|---|---|---|---|---|---|---|---|---|---|
| Benchmark | [-] | 26.2 | ||||||||||
| CESM2_1_001 | [-] | 579. | 13.2 | 565. | 26.1 | 0.0878 | -1.58 | 0.55 | 0.70 | 0.63 | ||
| CESM2_1_002 | [-] | 580. | 13.3 | 566. | 26.1 | 0.0878 | -1.58 | 0.55 | 0.71 | 0.63 | ||
| CESM2_1_003 | [-] | 579. | 13.2 | 566. | 26.1 | 0.0878 | -1.58 | 0.55 | 0.70 | 0.63 | ||
| LENS1 | [-] | 552. | 22.8 | 529. | 26.1 | 0.0878 | -0.168 | 0.66 | 0.83 | 0.75 | ||
| LENS10 | [-] | 669. | 24.5 | 645. | 26.1 | 0.0878 | -0.200 | 0.66 | 0.83 | 0.74 | ||
| LENS5 | [-] | 674. | 24.5 | 649. | 26.1 | 0.0878 | -0.197 | 0.66 | 0.83 | 0.75 |
Download Data |
Period Mean (original grids) [Pg] |
Model Period Mean (intersection) [Pg] |
Model Period Mean (complement) [Pg] |
Benchmark Period Mean (intersection) [Pg] |
Benchmark Period Mean (complement) [Pg] |
Bias [kg m-2] |
Bias Score [1] |
Spatial Distribution Score [1] |
Overall Score [1] |
|||
|---|---|---|---|---|---|---|---|---|---|---|---|---|
| Benchmark | [-] | 0.00338 | ||||||||||
| CESM2_1_001 | [-] | 14.9 | 0.0273 | 14.3 | 0.00338 | 0.00 | 0.281 | 0.27 | 0.38 | 0.32 | ||
| CESM2_1_002 | [-] | 15.2 | 0.0251 | 14.5 | 0.00338 | 0.00 | 0.260 | 0.27 | 0.40 | 0.34 | ||
| CESM2_1_003 | [-] | 15.2 | 0.0262 | 14.5 | 0.00338 | 0.00 | 0.272 | 0.27 | 0.38 | 0.32 | ||
| LENS1 | [-] | 13.9 | 0.0288 | 13.7 | 0.00338 | 0.00 | 0.329 | 0.61 | 0.53 | 0.57 | ||
| LENS10 | [-] | 18.7 | 0.0281 | 18.0 | 0.00338 | 0.00 | 0.294 | 0.54 | 0.52 | 0.53 | ||
| LENS5 | [-] | 18.8 | 0.0268 | 18.1 | 0.00338 | 0.00 | 0.276 | 0.58 | 0.56 | 0.57 |
Download Data |
Period Mean (original grids) [Pg] |
Model Period Mean (intersection) [Pg] |
Model Period Mean (complement) [Pg] |
Benchmark Period Mean (intersection) [Pg] |
Benchmark Period Mean (complement) [Pg] |
Bias [kg m-2] |
Bias Score [1] |
Spatial Distribution Score [1] |
Overall Score [1] |
|||
|---|---|---|---|---|---|---|---|---|---|---|---|---|
| Benchmark | [-] | 17.5 | ||||||||||
| CESM2_1_001 | [-] | 11.9 | 10.7 | 0.844 | 17.4 | 0.0333 | -1.69 | 0.60 | 0.87 | 0.73 | ||
| CESM2_1_002 | [-] | 11.9 | 10.7 | 0.848 | 17.4 | 0.0333 | -1.68 | 0.60 | 0.87 | 0.74 | ||
| CESM2_1_003 | [-] | 11.9 | 10.6 | 0.840 | 17.4 | 0.0333 | -1.70 | 0.60 | 0.87 | 0.73 | ||
| LENS1 | [-] | 18.8 | 18.3 | 0.327 | 17.4 | 0.0333 | 0.592 | 0.74 | 0.94 | 0.84 | ||
| LENS10 | [-] | 21.6 | 19.9 | 1.12 | 17.4 | 0.0333 | 0.550 | 0.73 | 0.94 | 0.83 | ||
| LENS5 | [-] | 21.6 | 19.9 | 1.12 | 17.4 | 0.0333 | 0.556 | 0.73 | 0.94 | 0.84 |
Download Data |
Period Mean (original grids) [Pg] |
Model Period Mean (intersection) [Pg] |
Model Period Mean (complement) [Pg] |
Benchmark Period Mean (intersection) [Pg] |
Benchmark Period Mean (complement) [Pg] |
Bias [kg m-2] |
Bias Score [1] |
Spatial Distribution Score [1] |
Overall Score [1] |
|||
|---|---|---|---|---|---|---|---|---|---|---|---|---|
| Benchmark | [-] | 0.222 | ||||||||||
| CESM2_1_001 | [-] | 38.5 | 0.423 | 37.8 | 0.222 | 0.00 | 2.19 | 0.48 | 0.64 | 0.56 | ||
| CESM2_1_002 | [-] | 38.8 | 0.427 | 38.1 | 0.222 | 0.00 | 2.24 | 0.48 | 0.64 | 0.56 | ||
| CESM2_1_003 | [-] | 38.6 | 0.423 | 37.9 | 0.222 | 0.00 | 2.19 | 0.48 | 0.64 | 0.56 | ||
| LENS1 | [-] | 13.4 | 0.454 | 13.1 | 0.222 | 0.00 | 2.66 | 0.47 | 0.65 | 0.56 | ||
| LENS10 | [-] | 14.8 | 0.468 | 14.5 | 0.222 | 0.00 | 2.60 | 0.47 | 0.66 | 0.56 | ||
| LENS5 | [-] | 14.9 | 0.480 | 14.6 | 0.222 | 0.00 | 2.72 | 0.47 | 0.64 | 0.56 |
Download Data |
Period Mean (original grids) [Pg] |
Model Period Mean (intersection) [Pg] |
Model Period Mean (complement) [Pg] |
Benchmark Period Mean (intersection) [Pg] |
Benchmark Period Mean (complement) [Pg] |
Bias [kg m-2] |
Bias Score [1] |
Spatial Distribution Score [1] |
Overall Score [1] |
|||
|---|---|---|---|---|---|---|---|---|---|---|---|---|
| Benchmark | [-] | 8.47 | ||||||||||
| CESM2_1_001 | [-] | 2.17 | 2.13 | 0.171 | 8.42 | 0.0520 | -1.60 | 0.44 | 0.29 | 0.37 | ||
| CESM2_1_002 | [-] | 2.17 | 2.13 | 0.172 | 8.42 | 0.0520 | -1.60 | 0.44 | 0.29 | 0.37 | ||
| CESM2_1_003 | [-] | 2.19 | 2.15 | 0.173 | 8.42 | 0.0520 | -1.59 | 0.44 | 0.29 | 0.37 | ||
| LENS1 | [-] | 4.01 | 4.03 | 0.0544 | 8.42 | 0.0520 | -1.05 | 0.50 | 0.18 | 0.34 | ||
| LENS10 | [-] | 4.15 | 4.15 | 0.144 | 8.42 | 0.0520 | -1.07 | 0.50 | 0.18 | 0.34 | ||
| LENS5 | [-] | 4.13 | 4.14 | 0.141 | 8.42 | 0.0520 | -1.07 | 0.50 | 0.18 | 0.34 |
Temporally integrated period mean