Mean State
Download Data |
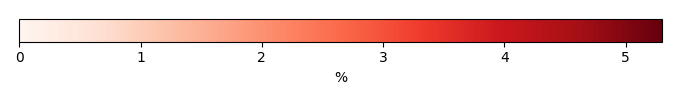
Period Mean (original grids) [%] |
Model Period Mean (intersection) [%] |
Model Period Mean (complement) [%] |
Benchmark Period Mean (intersection) [%] |
Benchmark Period Mean (complement) [%] |
Bias [%] |
RMSE [%] |
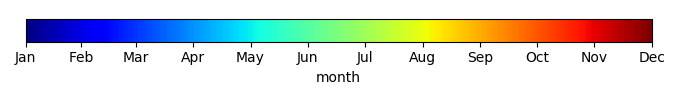
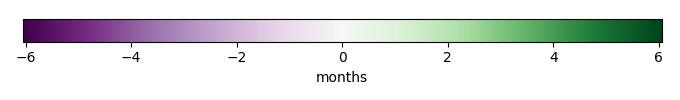
Phase Shift [months] |
Bias Score [1] |
RMSE Score [1] |
Seasonal Cycle Score [1] |
Spatial Distribution Score [1] |
Interannual Variability Score [1] |
Overall Score [1] |
|||
|---|---|---|---|---|---|---|---|---|---|---|---|---|---|---|---|---|---|
| Benchmark | [-] | 0.419 | |||||||||||||||
| CESM2_1_001 | [-] | 0.190 | 0.237 | 0.0158 | 0.420 | 0.0175 | -0.198 | 1.27 | 1.87 | 0.68 | 0.34 | 0.75 | 0.54 | 0.47 | 0.52 | ||
| CESM2_1_002 | [-] | 0.173 | 0.212 | 0.0137 | 0.420 | 0.0175 | -0.224 | 1.22 | 1.96 | 0.68 | 0.35 | 0.76 | 0.46 | 0.48 | 0.51 | ||
| CESM2_1_003 | [-] | 0.188 | 0.239 | 0.0169 | 0.420 | 0.0175 | -0.195 | 1.27 | 1.88 | 0.68 | 0.34 | 0.74 | 0.55 | 0.46 | 0.52 | ||
| LENS1 | [-] | 0.0510 | 0.0527 | 0.0125 | 0.466 | 0.0197 | -0.431 | 1.12 | 2.63 | 0.62 | 0.37 | 0.59 | 0.013 | 0.37 | 0.39 | ||
| LENS10 | [-] | 0.0425 | 0.0439 | 0.0238 | 0.466 | 0.0197 | -0.440 | 1.10 | 2.34 | 0.62 | 0.37 | 0.66 | 0.0068 | 0.37 | 0.40 | ||
| LENS5 | [-] | 0.0578 | 0.0581 | 0.0216 | 0.466 | 0.0197 | -0.427 | 1.12 | 2.41 | 0.62 | 0.37 | 0.66 | 0.059 | 0.37 | 0.41 |
Download Data |
Period Mean (original grids) [%] |
Model Period Mean (intersection) [%] |
Model Period Mean (complement) [%] |
Benchmark Period Mean (intersection) [%] |
Benchmark Period Mean (complement) [%] |
Bias [%] |
RMSE [%] |
Phase Shift [months] |
Bias Score [1] |
RMSE Score [1] |
Seasonal Cycle Score [1] |
Spatial Distribution Score [1] |
Interannual Variability Score [1] |
Overall Score [1] |
|||
|---|---|---|---|---|---|---|---|---|---|---|---|---|---|---|---|---|---|
| Benchmark | [-] | 1.70 | |||||||||||||||
| CESM2_1_001 | [-] | 1.07 | 1.10 | 0.0774 | 1.70 | 0.140 | -0.598 | 4.33 | 2.04 | 0.75 | 0.34 | 0.72 | 0.61 | 0.55 | 0.55 | ||
| CESM2_1_002 | [-] | 1.02 | 1.06 | 0.0808 | 1.70 | 0.140 | -0.640 | 4.29 | 2.08 | 0.75 | 0.34 | 0.72 | 0.57 | 0.56 | 0.55 | ||
| CESM2_1_003 | [-] | 1.18 | 1.22 | 0.0868 | 1.70 | 0.140 | -0.483 | 4.45 | 2.17 | 0.76 | 0.33 | 0.68 | 0.68 | 0.56 | 0.56 | ||
| LENS1 | [-] | 0.0862 | 0.0879 | 0.0636 | 1.91 | 0.149 | -1.82 | 4.36 | 3.47 | 0.61 | 0.37 | 0.37 | 0.011 | 0.37 | 0.35 | ||
| LENS10 | [-] | 0.0844 | 0.0876 | 0.0295 | 1.91 | 0.149 | -1.82 | 4.35 | 3.30 | 0.61 | 0.37 | 0.44 | 0.013 | 0.37 | 0.36 | ||
| LENS5 | [-] | 0.0939 | 0.0969 | 0.102 | 1.91 | 0.149 | -1.81 | 4.37 | 3.21 | 0.61 | 0.37 | 0.46 | 0.026 | 0.37 | 0.37 |
Download Data |
Period Mean (original grids) [%] |
Model Period Mean (intersection) [%] |
Model Period Mean (complement) [%] |
Benchmark Period Mean (intersection) [%] |
Benchmark Period Mean (complement) [%] |
Bias [%] |
RMSE [%] |
Phase Shift [months] |
Bias Score [1] |
RMSE Score [1] |
Seasonal Cycle Score [1] |
Spatial Distribution Score [1] |
Interannual Variability Score [1] |
Overall Score [1] |
|||
|---|---|---|---|---|---|---|---|---|---|---|---|---|---|---|---|---|---|
| Benchmark | [-] | 1.56 | |||||||||||||||
| CESM2_1_001 | [-] | 1.14 | 1.23 | 0.166 | 1.57 | 0.174 | -0.356 | 4.35 | 1.95 | 0.70 | 0.29 | 0.67 | 0.80 | 0.52 | 0.55 | ||
| CESM2_1_002 | [-] | 1.22 | 1.31 | 0.199 | 1.57 | 0.174 | -0.273 | 4.55 | 2.04 | 0.71 | 0.28 | 0.66 | 0.81 | 0.50 | 0.54 | ||
| CESM2_1_003 | [-] | 1.08 | 1.16 | 0.160 | 1.57 | 0.174 | -0.418 | 4.35 | 2.00 | 0.70 | 0.29 | 0.68 | 0.78 | 0.51 | 0.54 | ||
| LENS1 | [-] | 0.216 | 0.218 | 0.154 | 1.60 | 0.183 | -1.39 | 3.36 | 2.56 | 0.60 | 0.37 | 0.58 | 0.073 | 0.40 | 0.40 | ||
| LENS10 | [-] | 0.189 | 0.190 | 0.181 | 1.60 | 0.183 | -1.42 | 3.35 | 2.52 | 0.60 | 0.37 | 0.59 | 0.052 | 0.39 | 0.39 | ||
| LENS5 | [-] | 0.215 | 0.219 | 0.161 | 1.60 | 0.183 | -1.38 | 3.35 | 2.46 | 0.60 | 0.37 | 0.61 | 0.090 | 0.39 | 0.40 |
Download Data |
Period Mean (original grids) [%] |
Model Period Mean (intersection) [%] |
Model Period Mean (complement) [%] |
Benchmark Period Mean (intersection) [%] |
Benchmark Period Mean (complement) [%] |
Bias [%] |
RMSE [%] |
Phase Shift [months] |
Bias Score [1] |
RMSE Score [1] |
Seasonal Cycle Score [1] |
Spatial Distribution Score [1] |
Interannual Variability Score [1] |
Overall Score [1] |
|||
|---|---|---|---|---|---|---|---|---|---|---|---|---|---|---|---|---|---|
| Benchmark | [-] | 0.0193 | |||||||||||||||
| CESM2_1_001 | [-] | -9.72e-05 | 0.000207 | 1.78e-05 | 0.0194 | 0.00172 | -0.0196 | 0.166 | 2.27 | 0.88 | 0.37 | 0.93 | 0.00036 | 0.37 | 0.49 | ||
| CESM2_1_002 | [-] | -9.73e-05 | 0.000206 | 1.52e-05 | 0.0194 | 0.00172 | -0.0196 | 0.166 | 2.28 | 0.88 | 0.37 | 0.92 | 0.00038 | 0.37 | 0.49 | ||
| CESM2_1_003 | [-] | -9.39e-05 | 0.000204 | 1.73e-05 | 0.0194 | 0.00172 | -0.0196 | 0.166 | 2.29 | 0.88 | 0.37 | 0.93 | 0.00060 | 0.37 | 0.49 | ||
| LENS1 | [-] | 0.0138 | 0.0144 | 0.00512 | 0.0292 | 0.00258 | -0.0164 | 0.174 | 2.58 | 0.84 | 0.37 | 0.33 | 0.12 | 0.37 | 0.40 | ||
| LENS10 | [-] | -0.00660 | 0.0131 | 0.00138 | 0.0292 | 0.00258 | -0.0171 | 0.173 | 2.56 | 0.84 | 0.37 | 0.33 | 0.11 | 0.37 | 0.40 | ||
| LENS5 | [-] | -0.00676 | 0.0134 | 0.00136 | 0.0292 | 0.00258 | -0.0168 | 0.173 | 2.56 | 0.84 | 0.37 | 0.33 | 0.11 | 0.37 | 0.40 |
Download Data |
Period Mean (original grids) [%] |
Model Period Mean (intersection) [%] |
Model Period Mean (complement) [%] |
Benchmark Period Mean (intersection) [%] |
Benchmark Period Mean (complement) [%] |
Bias [%] |
RMSE [%] |
Phase Shift [months] |
Bias Score [1] |
RMSE Score [1] |
Seasonal Cycle Score [1] |
Spatial Distribution Score [1] |
Interannual Variability Score [1] |
Overall Score [1] |
|||
|---|---|---|---|---|---|---|---|---|---|---|---|---|---|---|---|---|---|
| Benchmark | [-] | 0.0475 | |||||||||||||||
| CESM2_1_001 | [-] | 0.113 | 0.112 | 0.113 | 0.0503 | 0.0178 | 0.0586 | 0.373 | 1.87 | 0.71 | 0.28 | 0.86 | 0.39 | 0.46 | 0.50 | ||
| CESM2_1_002 | [-] | 0.152 | 0.154 | 0.153 | 0.0503 | 0.0178 | 0.101 | 0.514 | 1.84 | 0.67 | 0.22 | 0.85 | 0.43 | 0.45 | 0.47 | ||
| CESM2_1_003 | [-] | 0.153 | 0.154 | 0.151 | 0.0503 | 0.0178 | 0.100 | 0.505 | 1.78 | 0.68 | 0.23 | 0.86 | 0.30 | 0.46 | 0.46 | ||
| LENS1 | [-] | 0.0334 | 0.0311 | 0.0526 | 0.0569 | 0.0202 | -0.0178 | 0.179 | 2.28 | 0.73 | 0.36 | 0.71 | 0.23 | 0.42 | 0.47 | ||
| LENS10 | [-] | 0.0364 | 0.0313 | 0.0507 | 0.0569 | 0.0202 | -0.0245 | 0.169 | 2.38 | 0.73 | 0.36 | 0.68 | 0.26 | 0.41 | 0.47 | ||
| LENS5 | [-] | 0.0234 | 0.0202 | 0.0329 | 0.0569 | 0.0202 | -0.0360 | 0.165 | 3.15 | 0.72 | 0.37 | 0.42 | 0.14 | 0.39 | 0.40 |
Download Data |
Period Mean (original grids) [%] |
Model Period Mean (intersection) [%] |
Model Period Mean (complement) [%] |
Benchmark Period Mean (intersection) [%] |
Benchmark Period Mean (complement) [%] |
Bias [%] |
RMSE [%] |
Phase Shift [months] |
Bias Score [1] |
RMSE Score [1] |
Seasonal Cycle Score [1] |
Spatial Distribution Score [1] |
Interannual Variability Score [1] |
Overall Score [1] |
|||
|---|---|---|---|---|---|---|---|---|---|---|---|---|---|---|---|---|---|
| Benchmark | [-] | 0.0788 | |||||||||||||||
| CESM2_1_001 | [-] | 0.0377 | 0.0379 | 0.000760 | 0.0789 | 0.0300 | -0.0395 | 0.496 | 1.95 | 0.83 | 0.34 | 0.78 | 0.57 | 0.43 | 0.55 | ||
| CESM2_1_002 | [-] | 0.0418 | 0.0418 | 0.000804 | 0.0789 | 0.0300 | -0.0356 | 0.499 | 1.97 | 0.84 | 0.34 | 0.74 | 0.60 | 0.44 | 0.55 | ||
| CESM2_1_003 | [-] | 0.0442 | 0.0444 | 0.00139 | 0.0789 | 0.0300 | -0.0327 | 0.508 | 1.92 | 0.83 | 0.34 | 0.77 | 0.65 | 0.43 | 0.56 | ||
| LENS1 | [-] | 0.0510 | 0.0513 | 0.0261 | 0.0796 | 0.0296 | -0.0271 | 0.366 | 3.13 | 0.79 | 0.37 | 0.42 | 0.042 | 0.37 | 0.39 | ||
| LENS10 | [-] | 0.0483 | 0.0492 | 0.0163 | 0.0796 | 0.0296 | -0.0288 | 0.366 | 3.14 | 0.79 | 0.37 | 0.45 | 0.042 | 0.37 | 0.40 | ||
| LENS5 | [-] | 0.0471 | 0.0479 | 0.0167 | 0.0796 | 0.0296 | -0.0300 | 0.365 | 3.06 | 0.79 | 0.37 | 0.46 | 0.044 | 0.37 | 0.40 |
Download Data |
Period Mean (original grids) [%] |
Model Period Mean (intersection) [%] |
Model Period Mean (complement) [%] |
Benchmark Period Mean (intersection) [%] |
Benchmark Period Mean (complement) [%] |
Bias [%] |
RMSE [%] |
Phase Shift [months] |
Bias Score [1] |
RMSE Score [1] |
Seasonal Cycle Score [1] |
Spatial Distribution Score [1] |
Interannual Variability Score [1] |
Overall Score [1] |
|||
|---|---|---|---|---|---|---|---|---|---|---|---|---|---|---|---|---|---|
| Benchmark | [-] | 0.115 | |||||||||||||||
| CESM2_1_001 | [-] | 0.131 | 0.148 | 0.0256 | 0.115 | 0.0223 | 0.0306 | 0.724 | 2.37 | 0.77 | 0.33 | 0.73 | 0.55 | 0.44 | 0.53 | ||
| CESM2_1_002 | [-] | 0.140 | 0.159 | 0.0256 | 0.115 | 0.0223 | 0.0420 | 0.750 | 2.36 | 0.77 | 0.32 | 0.73 | 0.52 | 0.45 | 0.52 | ||
| CESM2_1_003 | [-] | 0.157 | 0.178 | 0.0280 | 0.115 | 0.0223 | 0.0611 | 0.778 | 2.36 | 0.76 | 0.33 | 0.73 | 0.48 | 0.45 | 0.51 | ||
| LENS1 | [-] | 0.0271 | 0.0304 | 0.00508 | 0.133 | 0.135 | -0.102 | 0.483 | 3.02 | 0.75 | 0.37 | 0.51 | 0.067 | 0.38 | 0.41 | ||
| LENS10 | [-] | 0.0288 | 0.0313 | 0.0142 | 0.133 | 0.135 | -0.102 | 0.483 | 3.05 | 0.75 | 0.37 | 0.47 | 0.068 | 0.38 | 0.40 | ||
| LENS5 | [-] | 0.0273 | 0.0301 | 0.0123 | 0.133 | 0.135 | -0.103 | 0.483 | 3.08 | 0.75 | 0.37 | 0.51 | 0.051 | 0.38 | 0.40 |
Download Data |
Period Mean (original grids) [%] |
Model Period Mean (intersection) [%] |
Model Period Mean (complement) [%] |
Benchmark Period Mean (intersection) [%] |
Benchmark Period Mean (complement) [%] |
Bias [%] |
RMSE [%] |
Phase Shift [months] |
Bias Score [1] |
RMSE Score [1] |
Seasonal Cycle Score [1] |
Spatial Distribution Score [1] |
Interannual Variability Score [1] |
Overall Score [1] |
|||
|---|---|---|---|---|---|---|---|---|---|---|---|---|---|---|---|---|---|
| Benchmark | [-] | 0.177 | |||||||||||||||
| CESM2_1_001 | [-] | 0.211 | 0.229 | 0.103 | 0.179 | 0.0206 | 0.0543 | 0.783 | 1.59 | 0.68 | 0.31 | 0.82 | 0.65 | 0.44 | 0.54 | ||
| CESM2_1_002 | [-] | 0.211 | 0.230 | 0.102 | 0.179 | 0.0206 | 0.0550 | 0.790 | 1.60 | 0.68 | 0.31 | 0.82 | 0.64 | 0.44 | 0.53 | ||
| CESM2_1_003 | [-] | 0.209 | 0.228 | 0.102 | 0.179 | 0.0206 | 0.0527 | 0.784 | 1.59 | 0.68 | 0.31 | 0.82 | 0.64 | 0.44 | 0.53 | ||
| LENS1 | [-] | 0.146 | 0.154 | 0.0523 | 0.165 | 0.0230 | -0.0130 | 0.500 | 2.51 | 0.73 | 0.36 | 0.59 | 0.35 | 0.44 | 0.47 | ||
| LENS10 | [-] | 0.135 | 0.144 | 0.0845 | 0.165 | 0.0230 | -0.0188 | 0.514 | 2.60 | 0.71 | 0.35 | 0.54 | 0.38 | 0.42 | 0.46 | ||
| LENS5 | [-] | 0.138 | 0.146 | 0.0865 | 0.165 | 0.0230 | -0.0157 | 0.512 | 2.66 | 0.71 | 0.35 | 0.60 | 0.36 | 0.42 | 0.47 |
Download Data |
Period Mean (original grids) [%] |
Model Period Mean (intersection) [%] |
Model Period Mean (complement) [%] |
Benchmark Period Mean (intersection) [%] |
Benchmark Period Mean (complement) [%] |
Bias [%] |
RMSE [%] |
Phase Shift [months] |
Bias Score [1] |
RMSE Score [1] |
Seasonal Cycle Score [1] |
Spatial Distribution Score [1] |
Interannual Variability Score [1] |
Overall Score [1] |
|||
|---|---|---|---|---|---|---|---|---|---|---|---|---|---|---|---|---|---|
| Benchmark | [-] | 0.00900 | |||||||||||||||
| CESM2_1_001 | [-] | 0.000233 | 0.000271 | 9.09e-06 | 0.00902 | 0.000132 | -0.00879 | 0.0812 | 1.84 | 0.88 | 0.37 | 0.81 | 0.045 | 0.37 | 0.47 | ||
| CESM2_1_002 | [-] | 9.89e-05 | 0.000125 | 3.48e-06 | 0.00902 | 0.000132 | -0.00896 | 0.0805 | 1.85 | 0.88 | 0.37 | 0.77 | 0.019 | 0.37 | 0.46 | ||
| CESM2_1_003 | [-] | 0.000145 | 0.000168 | 1.07e-05 | 0.00902 | 0.000132 | -0.00891 | 0.0807 | 1.78 | 0.88 | 0.37 | 0.82 | 0.028 | 0.37 | 0.47 | ||
| LENS1 | [-] | 0.0155 | 0.0167 | 0.00792 | 0.00697 | 0.00 | 0.00977 | 0.0508 | 1.56 | 0.81 | 0.37 | 0.61 | 0.57 | 0.37 | 0.51 | ||
| LENS10 | [-] | 0.0142 | 0.0161 | 0.00384 | 0.00697 | 0.00 | 0.00954 | 0.0506 | 1.65 | 0.81 | 0.37 | 0.59 | 0.56 | 0.37 | 0.51 | ||
| LENS5 | [-] | 0.0142 | 0.0161 | 0.00360 | 0.00697 | 0.00 | 0.00948 | 0.0506 | 1.64 | 0.81 | 0.37 | 0.58 | 0.56 | 0.38 | 0.51 |
Download Data |
Period Mean (original grids) [%] |
Model Period Mean (intersection) [%] |
Model Period Mean (complement) [%] |
Benchmark Period Mean (intersection) [%] |
Benchmark Period Mean (complement) [%] |
Bias [%] |
RMSE [%] |
Phase Shift [months] |
Bias Score [1] |
RMSE Score [1] |
Seasonal Cycle Score [1] |
Spatial Distribution Score [1] |
Interannual Variability Score [1] |
Overall Score [1] |
|||
|---|---|---|---|---|---|---|---|---|---|---|---|---|---|---|---|---|---|
| Benchmark | [-] | 0.529 | |||||||||||||||
| CESM2_1_001 | [-] | 0.391 | 0.404 | 0.272 | 0.532 | 0.281 | -0.129 | 2.27 | 1.71 | 0.79 | 0.35 | 0.77 | 0.63 | 0.46 | 0.56 | ||
| CESM2_1_002 | [-] | 0.379 | 0.392 | 0.266 | 0.532 | 0.281 | -0.143 | 2.30 | 1.69 | 0.78 | 0.35 | 0.77 | 0.60 | 0.45 | 0.55 | ||
| CESM2_1_003 | [-] | 0.382 | 0.395 | 0.263 | 0.532 | 0.281 | -0.140 | 2.28 | 1.62 | 0.79 | 0.35 | 0.79 | 0.60 | 0.45 | 0.55 | ||
| LENS1 | [-] | 0.189 | 0.190 | 0.169 | 0.594 | 0.298 | -0.403 | 2.05 | 1.88 | 0.72 | 0.36 | 0.71 | 0.20 | 0.39 | 0.46 | ||
| LENS10 | [-] | 0.353 | 0.352 | 0.366 | 0.594 | 0.298 | -0.242 | 2.11 | 2.09 | 0.72 | 0.36 | 0.67 | 0.52 | 0.40 | 0.50 | ||
| LENS5 | [-] | 0.279 | 0.271 | 0.362 | 0.594 | 0.298 | -0.325 | 2.04 | 2.05 | 0.72 | 0.36 | 0.67 | 0.42 | 0.39 | 0.49 |
Download Data |
Period Mean (original grids) [%] |
Model Period Mean (intersection) [%] |
Model Period Mean (complement) [%] |
Benchmark Period Mean (intersection) [%] |
Benchmark Period Mean (complement) [%] |
Bias [%] |
RMSE [%] |
Phase Shift [months] |
Bias Score [1] |
RMSE Score [1] |
Seasonal Cycle Score [1] |
Spatial Distribution Score [1] |
Interannual Variability Score [1] |
Overall Score [1] |
|||
|---|---|---|---|---|---|---|---|---|---|---|---|---|---|---|---|---|---|
| Benchmark | [-] | 0.0201 | |||||||||||||||
| CESM2_1_001 | [-] | 0.139 | 0.141 | 0.117 | 0.0202 | 0.0135 | 0.122 | 0.321 | 2.23 | 0.59 | 0.24 | 0.85 | 0.070 | 0.49 | 0.41 | ||
| CESM2_1_002 | [-] | 0.134 | 0.137 | 0.110 | 0.0202 | 0.0135 | 0.118 | 0.331 | 2.26 | 0.58 | 0.24 | 0.85 | 0.076 | 0.48 | 0.41 | ||
| CESM2_1_003 | [-] | 0.152 | 0.155 | 0.126 | 0.0202 | 0.0135 | 0.136 | 0.349 | 2.25 | 0.56 | 0.23 | 0.85 | 0.065 | 0.48 | 0.40 | ||
| LENS1 | [-] | 0.0672 | 0.0654 | 0.0955 | 0.0227 | 0.0130 | 0.0509 | 0.134 | 2.77 | 0.71 | 0.34 | 0.63 | 0.37 | 0.43 | 0.47 | ||
| LENS10 | [-] | 0.0940 | 0.0847 | 0.136 | 0.0227 | 0.0130 | 0.0610 | 0.150 | 2.82 | 0.72 | 0.34 | 0.65 | 0.24 | 0.42 | 0.45 | ||
| LENS5 | [-] | 0.0742 | 0.0662 | 0.114 | 0.0227 | 0.0130 | 0.0433 | 0.128 | 2.78 | 0.73 | 0.34 | 0.63 | 0.44 | 0.42 | 0.49 |
Download Data |
Period Mean (original grids) [%] |
Model Period Mean (intersection) [%] |
Model Period Mean (complement) [%] |
Benchmark Period Mean (intersection) [%] |
Benchmark Period Mean (complement) [%] |
Bias [%] |
RMSE [%] |
Phase Shift [months] |
Bias Score [1] |
RMSE Score [1] |
Seasonal Cycle Score [1] |
Spatial Distribution Score [1] |
Interannual Variability Score [1] |
Overall Score [1] |
|||
|---|---|---|---|---|---|---|---|---|---|---|---|---|---|---|---|---|---|
| Benchmark | [-] | 0.319 | |||||||||||||||
| CESM2_1_001 | [-] | 0.291 | 0.325 | 0.0415 | 0.324 | 0.0326 | 0.000622 | 1.20 | 2.02 | 0.72 | 0.31 | 0.73 | 0.76 | 0.51 | 0.56 | ||
| CESM2_1_002 | [-] | 0.291 | 0.326 | 0.0422 | 0.324 | 0.0326 | 0.00127 | 1.21 | 2.03 | 0.72 | 0.31 | 0.72 | 0.76 | 0.50 | 0.55 | ||
| CESM2_1_003 | [-] | 0.290 | 0.324 | 0.0431 | 0.324 | 0.0326 | -0.000507 | 1.21 | 2.03 | 0.73 | 0.31 | 0.72 | 0.76 | 0.51 | 0.55 | ||
| LENS1 | [-] | 0.0825 | 0.0931 | 0.0156 | 0.347 | 0.0436 | -0.255 | 0.909 | 2.55 | 0.64 | 0.36 | 0.54 | 0.087 | 0.39 | 0.40 | ||
| LENS10 | [-] | 0.100 | 0.104 | 0.0459 | 0.347 | 0.0436 | -0.245 | 0.914 | 2.54 | 0.64 | 0.36 | 0.56 | 0.13 | 0.39 | 0.41 | ||
| LENS5 | [-] | 0.0947 | 0.0982 | 0.0432 | 0.347 | 0.0436 | -0.250 | 0.908 | 2.57 | 0.64 | 0.37 | 0.58 | 0.12 | 0.39 | 0.41 |
Download Data |
Period Mean (original grids) [%] |
Model Period Mean (intersection) [%] |
Model Period Mean (complement) [%] |
Benchmark Period Mean (intersection) [%] |
Benchmark Period Mean (complement) [%] |
Bias [%] |
RMSE [%] |
Phase Shift [months] |
Bias Score [1] |
RMSE Score [1] |
Seasonal Cycle Score [1] |
Spatial Distribution Score [1] |
Interannual Variability Score [1] |
Overall Score [1] |
|||
|---|---|---|---|---|---|---|---|---|---|---|---|---|---|---|---|---|---|
| Benchmark | [-] | 0.0194 | |||||||||||||||
| CESM2_1_001 | [-] | 0.0383 | 0.106 | 0.00618 | 0.0196 | 0.00285 | 0.0888 | 0.231 | 2.41 | 0.64 | 0.30 | 0.80 | 0.17 | 0.43 | 0.44 | ||
| CESM2_1_002 | [-] | 0.0394 | 0.109 | 0.00619 | 0.0196 | 0.00285 | 0.0912 | 0.232 | 2.43 | 0.64 | 0.30 | 0.80 | 0.17 | 0.42 | 0.44 | ||
| CESM2_1_003 | [-] | 0.0410 | 0.113 | 0.00667 | 0.0196 | 0.00285 | 0.0955 | 0.239 | 2.41 | 0.64 | 0.30 | 0.80 | 0.15 | 0.43 | 0.44 | ||
| LENS1 | [-] | 0.00950 | 0.0262 | 0.00105 | 0.0181 | 0.00305 | 0.0133 | 0.0822 | 2.23 | 0.68 | 0.35 | 0.43 | 0.53 | 0.41 | 0.46 | ||
| LENS10 | [-] | 0.0130 | 0.0304 | 0.00279 | 0.0181 | 0.00305 | 0.0121 | 0.0807 | 2.17 | 0.68 | 0.35 | 0.44 | 0.58 | 0.40 | 0.47 | ||
| LENS5 | [-] | 0.0121 | 0.0290 | 0.00255 | 0.0181 | 0.00305 | 0.0106 | 0.0789 | 2.17 | 0.68 | 0.36 | 0.43 | 0.58 | 0.40 | 0.47 |
Download Data |
Period Mean (original grids) [%] |
Model Period Mean (intersection) [%] |
Model Period Mean (complement) [%] |
Benchmark Period Mean (intersection) [%] |
Benchmark Period Mean (complement) [%] |
Bias [%] |
RMSE [%] |
Phase Shift [months] |
Bias Score [1] |
RMSE Score [1] |
Seasonal Cycle Score [1] |
Spatial Distribution Score [1] |
Interannual Variability Score [1] |
Overall Score [1] |
|||
|---|---|---|---|---|---|---|---|---|---|---|---|---|---|---|---|---|---|
| Benchmark | [-] | 0.0156 | |||||||||||||||
| CESM2_1_001 | [-] | 8.70e-05 | 0.000111 | 8.68e-06 | 0.0156 | 6.09e-05 | -0.0154 | 0.140 | 2.57 | 0.89 | 0.37 | 0.48 | 0.00039 | 0.37 | 0.41 | ||
| CESM2_1_002 | [-] | 0.000219 | 0.000242 | 4.80e-05 | 0.0156 | 6.09e-05 | -0.0152 | 0.141 | 2.54 | 0.89 | 0.37 | 0.50 | 0.0024 | 0.37 | 0.42 | ||
| CESM2_1_003 | [-] | 0.000107 | 0.000134 | 9.64e-06 | 0.0156 | 6.09e-05 | -0.0153 | 0.140 | 2.56 | 0.89 | 0.37 | 0.49 | 0.00073 | 0.37 | 0.41 | ||
| LENS1 | [-] | 0.0233 | 0.0257 | 0.00387 | 0.0234 | 0.000110 | 0.00143 | 0.151 | 2.02 | 0.85 | 0.37 | 0.63 | 0.17 | 0.37 | 0.46 | ||
| LENS10 | [-] | 0.0208 | 0.0249 | 0.00404 | 0.0234 | 0.000110 | 0.00185 | 0.152 | 2.05 | 0.85 | 0.37 | 0.72 | 0.18 | 0.37 | 0.48 | ||
| LENS5 | [-] | 0.0215 | 0.0255 | 0.00480 | 0.0234 | 0.000110 | 0.00243 | 0.152 | 2.01 | 0.85 | 0.37 | 0.72 | 0.18 | 0.37 | 0.48 |
Download Data |
Period Mean (original grids) [%] |
Model Period Mean (intersection) [%] |
Model Period Mean (complement) [%] |
Benchmark Period Mean (intersection) [%] |
Benchmark Period Mean (complement) [%] |
Bias [%] |
RMSE [%] |
Phase Shift [months] |
Bias Score [1] |
RMSE Score [1] |
Seasonal Cycle Score [1] |
Spatial Distribution Score [1] |
Interannual Variability Score [1] |
Overall Score [1] |
|||
|---|---|---|---|---|---|---|---|---|---|---|---|---|---|---|---|---|---|
| Benchmark | [-] | 0.0820 | |||||||||||||||
| CESM2_1_001 | [-] | 0.332 | 0.351 | 0.230 | 0.0842 | 0.0187 | 0.266 | 0.823 | 1.88 | 0.60 | 0.26 | 0.79 | 0.11 | 0.40 | 0.40 | ||
| CESM2_1_002 | [-] | 0.333 | 0.356 | 0.215 | 0.0842 | 0.0187 | 0.271 | 0.836 | 1.85 | 0.60 | 0.26 | 0.81 | 0.12 | 0.39 | 0.41 | ||
| CESM2_1_003 | [-] | 0.328 | 0.348 | 0.220 | 0.0842 | 0.0187 | 0.262 | 0.790 | 1.88 | 0.60 | 0.26 | 0.79 | 0.12 | 0.39 | 0.40 | ||
| LENS1 | [-] | 0.125 | 0.128 | 0.0755 | 0.0872 | 0.0167 | 0.0350 | 0.323 | 2.52 | 0.71 | 0.35 | 0.64 | 0.58 | 0.42 | 0.51 | ||
| LENS10 | [-] | 0.136 | 0.134 | 0.159 | 0.0872 | 0.0167 | 0.0451 | 0.329 | 2.44 | 0.70 | 0.34 | 0.61 | 0.56 | 0.41 | 0.49 | ||
| LENS5 | [-] | 0.163 | 0.168 | 0.121 | 0.0872 | 0.0167 | 0.0793 | 0.376 | 2.57 | 0.71 | 0.35 | 0.61 | 0.37 | 0.41 | 0.47 |
Download Data |
Period Mean (original grids) [%] |
Model Period Mean (intersection) [%] |
Model Period Mean (complement) [%] |
Benchmark Period Mean (intersection) [%] |
Benchmark Period Mean (complement) [%] |
Bias [%] |
RMSE [%] |
Phase Shift [months] |
Bias Score [1] |
RMSE Score [1] |
Seasonal Cycle Score [1] |
Spatial Distribution Score [1] |
Interannual Variability Score [1] |
Overall Score [1] |
|||
|---|---|---|---|---|---|---|---|---|---|---|---|---|---|---|---|---|---|
| Benchmark | [-] | 0.0297 | |||||||||||||||
| CESM2_1_001 | [-] | 0.0475 | 0.0484 | 0.0231 | 0.0299 | 0.00710 | 0.0182 | 0.174 | 3.03 | 0.67 | 0.28 | 0.49 | 0.66 | 0.46 | 0.47 | ||
| CESM2_1_002 | [-] | 0.0487 | 0.0497 | 0.0229 | 0.0299 | 0.00710 | 0.0197 | 0.177 | 3.04 | 0.66 | 0.28 | 0.48 | 0.64 | 0.45 | 0.47 | ||
| CESM2_1_003 | [-] | 0.0453 | 0.0464 | 0.0180 | 0.0299 | 0.00710 | 0.0162 | 0.169 | 3.07 | 0.67 | 0.28 | 0.49 | 0.67 | 0.45 | 0.47 | ||
| LENS1 | [-] | 0.0479 | 0.0483 | 0.0445 | 0.0243 | 0.00567 | 0.0241 | 0.0885 | 3.47 | 0.66 | 0.35 | 0.41 | 0.32 | 0.44 | 0.42 | ||
| LENS10 | [-] | 0.0474 | 0.0473 | 0.0515 | 0.0243 | 0.00567 | 0.0230 | 0.0887 | 3.23 | 0.67 | 0.35 | 0.45 | 0.45 | 0.44 | 0.45 | ||
| LENS5 | [-] | 0.0481 | 0.0487 | 0.0469 | 0.0243 | 0.00567 | 0.0242 | 0.0901 | 3.42 | 0.66 | 0.35 | 0.43 | 0.49 | 0.43 | 0.45 |
Download Data |
Period Mean (original grids) [%] |
Model Period Mean (intersection) [%] |
Model Period Mean (complement) [%] |
Benchmark Period Mean (intersection) [%] |
Benchmark Period Mean (complement) [%] |
Bias [%] |
RMSE [%] |
Phase Shift [months] |
Bias Score [1] |
RMSE Score [1] |
Seasonal Cycle Score [1] |
Spatial Distribution Score [1] |
Interannual Variability Score [1] |
Overall Score [1] |
|||
|---|---|---|---|---|---|---|---|---|---|---|---|---|---|---|---|---|---|
| Benchmark | [-] | 0.0271 | |||||||||||||||
| CESM2_1_001 | [-] | 0.0174 | 0.0182 | 0.00250 | 0.0273 | 0.000223 | -0.00955 | 0.259 | 2.38 | 0.87 | 0.35 | 0.79 | 0.55 | 0.40 | 0.55 | ||
| CESM2_1_002 | [-] | 0.0158 | 0.0165 | 0.00267 | 0.0273 | 0.000223 | -0.0108 | 0.253 | 2.33 | 0.88 | 0.35 | 0.82 | 0.51 | 0.41 | 0.55 | ||
| CESM2_1_003 | [-] | 0.0175 | 0.0183 | 0.00282 | 0.0273 | 0.000223 | -0.00930 | 0.262 | 2.37 | 0.87 | 0.35 | 0.81 | 0.56 | 0.40 | 0.56 | ||
| LENS1 | [-] | 0.0498 | 0.0503 | 0.0323 | 0.0234 | 0.000179 | 0.0263 | 0.166 | 2.79 | 0.84 | 0.37 | 0.58 | 0.25 | 0.38 | 0.46 | ||
| LENS10 | [-] | 0.0481 | 0.0492 | 0.0279 | 0.0234 | 0.000179 | 0.0260 | 0.166 | 2.79 | 0.84 | 0.37 | 0.58 | 0.28 | 0.38 | 0.47 | ||
| LENS5 | [-] | 0.0493 | 0.0506 | 0.0265 | 0.0234 | 0.000179 | 0.0274 | 0.167 | 2.86 | 0.84 | 0.37 | 0.58 | 0.28 | 0.38 | 0.47 |
Download Data |
Period Mean (original grids) [%] |
Model Period Mean (intersection) [%] |
Model Period Mean (complement) [%] |
Benchmark Period Mean (intersection) [%] |
Benchmark Period Mean (complement) [%] |
Bias [%] |
RMSE [%] |
Phase Shift [months] |
Bias Score [1] |
RMSE Score [1] |
Seasonal Cycle Score [1] |
Spatial Distribution Score [1] |
Interannual Variability Score [1] |
Overall Score [1] |
|||
|---|---|---|---|---|---|---|---|---|---|---|---|---|---|---|---|---|---|
| Benchmark | [-] | 0.0297 | |||||||||||||||
| CESM2_1_001 | [-] | 0.0929 | 0.0957 | 0.0854 | 0.0297 | 0.0262 | 0.0669 | 0.370 | 2.21 | 0.75 | 0.30 | 0.74 | 0.16 | 0.42 | 0.45 | ||
| CESM2_1_002 | [-] | 0.0875 | 0.0908 | 0.0820 | 0.0297 | 0.0262 | 0.0626 | 0.364 | 2.23 | 0.76 | 0.30 | 0.74 | 0.19 | 0.42 | 0.45 | ||
| CESM2_1_003 | [-] | 0.0953 | 0.0985 | 0.0963 | 0.0297 | 0.0262 | 0.0696 | 0.373 | 2.23 | 0.75 | 0.30 | 0.74 | 0.16 | 0.43 | 0.45 | ||
| LENS1 | [-] | 0.193 | 0.189 | 0.333 | 0.0236 | 0.0288 | 0.175 | 0.303 | 2.92 | 0.64 | 0.31 | 0.50 | 0.058 | 0.43 | 0.37 | ||
| LENS10 | [-] | 0.154 | 0.147 | 0.356 | 0.0236 | 0.0288 | 0.125 | 0.250 | 2.91 | 0.70 | 0.33 | 0.52 | 0.11 | 0.43 | 0.40 | ||
| LENS5 | [-] | 0.188 | 0.183 | 0.347 | 0.0236 | 0.0288 | 0.160 | 0.298 | 2.94 | 0.68 | 0.32 | 0.52 | 0.070 | 0.42 | 0.39 |
Download Data |
Period Mean (original grids) [%] |
Model Period Mean (intersection) [%] |
Model Period Mean (complement) [%] |
Benchmark Period Mean (intersection) [%] |
Benchmark Period Mean (complement) [%] |
Bias [%] |
RMSE [%] |
Phase Shift [months] |
Bias Score [1] |
RMSE Score [1] |
Seasonal Cycle Score [1] |
Spatial Distribution Score [1] |
Interannual Variability Score [1] |
Overall Score [1] |
|||
|---|---|---|---|---|---|---|---|---|---|---|---|---|---|---|---|---|---|
| Benchmark | [-] | 0.125 | |||||||||||||||
| CESM2_1_001 | [-] | 0.214 | 0.217 | 0.0650 | 0.125 | 0.0201 | 0.0926 | 0.604 | 1.36 | 0.65 | 0.29 | 0.88 | 0.39 | 0.46 | 0.49 | ||
| CESM2_1_002 | [-] | 0.211 | 0.214 | 0.0571 | 0.125 | 0.0201 | 0.0897 | 0.601 | 1.37 | 0.65 | 0.29 | 0.87 | 0.42 | 0.45 | 0.49 | ||
| CESM2_1_003 | [-] | 0.204 | 0.206 | 0.0776 | 0.125 | 0.0201 | 0.0812 | 0.591 | 1.42 | 0.66 | 0.29 | 0.87 | 0.43 | 0.46 | 0.50 | ||
| LENS1 | [-] | 0.0998 | 0.0994 | 0.0752 | 0.146 | 0.0215 | -0.0470 | 0.364 | 1.80 | 0.69 | 0.37 | 0.74 | 0.24 | 0.42 | 0.47 | ||
| LENS10 | [-] | 0.107 | 0.107 | 0.157 | 0.146 | 0.0215 | -0.0390 | 0.375 | 1.75 | 0.68 | 0.37 | 0.77 | 0.35 | 0.40 | 0.49 | ||
| LENS5 | [-] | 0.109 | 0.108 | 0.212 | 0.146 | 0.0215 | -0.0375 | 0.380 | 1.78 | 0.68 | 0.37 | 0.73 | 0.36 | 0.40 | 0.48 |
Download Data |
Period Mean (original grids) [%] |
Model Period Mean (intersection) [%] |
Model Period Mean (complement) [%] |
Benchmark Period Mean (intersection) [%] |
Benchmark Period Mean (complement) [%] |
Bias [%] |
RMSE [%] |
Phase Shift [months] |
Bias Score [1] |
RMSE Score [1] |
Seasonal Cycle Score [1] |
Spatial Distribution Score [1] |
Interannual Variability Score [1] |
Overall Score [1] |
|||
|---|---|---|---|---|---|---|---|---|---|---|---|---|---|---|---|---|---|
| Benchmark | [-] | 0.224 | |||||||||||||||
| CESM2_1_001 | [-] | 0.970 | 0.995 | 0.0584 | 0.225 | 0.0102 | 0.771 | 2.05 | 1.46 | 0.51 | 0.18 | 0.86 | 0.31 | 0.48 | 0.42 | ||
| CESM2_1_002 | [-] | 0.906 | 0.928 | 0.0517 | 0.225 | 0.0102 | 0.705 | 1.89 | 1.41 | 0.54 | 0.20 | 0.88 | 0.34 | 0.49 | 0.44 | ||
| CESM2_1_003 | [-] | 0.839 | 0.860 | 0.0467 | 0.225 | 0.0102 | 0.636 | 1.83 | 1.38 | 0.56 | 0.20 | 0.88 | 0.37 | 0.51 | 0.45 | ||
| LENS1 | [-] | 0.210 | 0.209 | 0.108 | 0.232 | 0.0114 | -0.0295 | 0.624 | 1.99 | 0.69 | 0.35 | 0.78 | 0.60 | 0.43 | 0.53 | ||
| LENS10 | [-] | 0.214 | 0.217 | 0.111 | 0.232 | 0.0114 | -0.0182 | 0.634 | 1.87 | 0.69 | 0.35 | 0.79 | 0.57 | 0.44 | 0.54 | ||
| LENS5 | [-] | 0.164 | 0.165 | 0.115 | 0.232 | 0.0114 | -0.0708 | 0.582 | 2.07 | 0.70 | 0.36 | 0.77 | 0.35 | 0.43 | 0.50 |
Download Data |
Period Mean (original grids) [%] |
Model Period Mean (intersection) [%] |
Model Period Mean (complement) [%] |
Benchmark Period Mean (intersection) [%] |
Benchmark Period Mean (complement) [%] |
Bias [%] |
RMSE [%] |
Phase Shift [months] |
Bias Score [1] |
RMSE Score [1] |
Seasonal Cycle Score [1] |
Spatial Distribution Score [1] |
Interannual Variability Score [1] |
Overall Score [1] |
|||
|---|---|---|---|---|---|---|---|---|---|---|---|---|---|---|---|---|---|
| Benchmark | [-] | 0.0270 | |||||||||||||||
| CESM2_1_001 | [-] | 0.185 | 0.180 | 0.114 | 0.0272 | 0.00281 | 0.154 | 0.433 | 1.54 | 0.70 | 0.27 | 0.87 | 0.084 | 0.46 | 0.44 | ||
| CESM2_1_002 | [-] | 0.164 | 0.160 | 0.105 | 0.0272 | 0.00281 | 0.135 | 0.415 | 1.57 | 0.72 | 0.28 | 0.83 | 0.095 | 0.45 | 0.44 | ||
| CESM2_1_003 | [-] | 0.167 | 0.162 | 0.106 | 0.0272 | 0.00281 | 0.137 | 0.406 | 1.59 | 0.71 | 0.28 | 0.86 | 0.096 | 0.46 | 0.45 | ||
| LENS1 | [-] | 0.0836 | 0.0872 | 0.0525 | 0.0498 | 0.00255 | 0.0372 | 0.292 | 2.09 | 0.78 | 0.36 | 0.74 | 0.42 | 0.39 | 0.51 | ||
| LENS10 | [-] | 0.165 | 0.171 | 0.119 | 0.0498 | 0.00255 | 0.121 | 0.353 | 2.23 | 0.79 | 0.35 | 0.70 | 0.68 | 0.45 | 0.55 | ||
| LENS5 | [-] | 0.112 | 0.113 | 0.110 | 0.0498 | 0.00255 | 0.0623 | 0.313 | 2.21 | 0.78 | 0.35 | 0.70 | 0.66 | 0.41 | 0.54 |
Temporally integrated period mean