Mean State
Download Data |
Period Mean (original grids) [Pg yr-1] |
Model Period Mean (intersection) [Pg yr-1] |
Model Period Mean (complement) [Pg yr-1] |
Benchmark Period Mean (intersection) [Pg yr-1] |
Benchmark Period Mean (complement) [Pg yr-1] |
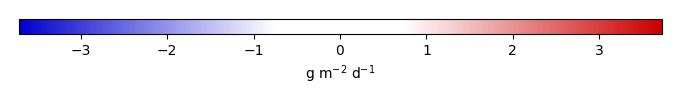
Bias [g m-2 d-1] |
RMSE [g m-2 d-1] |
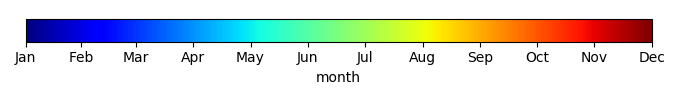
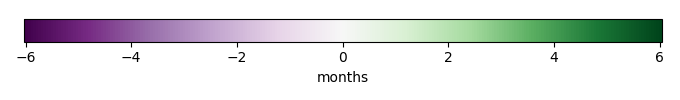
Phase Shift [months] |
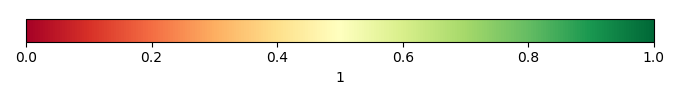
Bias Score [1] |
RMSE Score [1] |
Seasonal Cycle Score [1] |
Spatial Distribution Score [1] |
Overall Score [1] |
|||
|---|---|---|---|---|---|---|---|---|---|---|---|---|---|---|---|---|
| Benchmark | [-] | 8.19 | ||||||||||||||
| CESM2_1_001 | [-] | 7.99 | 8.03 | 0.233 | 8.18 | 0.00755 | 0.0776 | 1.59 | 2.52 | 0.378 | 0.350 | 0.585 | 0.983 | 0.529 | ||
| CESM2_1_002 | [-] | 8.00 | 8.05 | 0.234 | 8.18 | 0.00755 | 0.0914 | 1.58 | 2.56 | 0.379 | 0.351 | 0.579 | 0.983 | 0.529 | ||
| CESM2_1_003 | [-] | 7.99 | 8.04 | 0.234 | 8.18 | 0.00755 | 0.0816 | 1.59 | 2.74 | 0.381 | 0.353 | 0.577 | 0.983 | 0.530 | ||
| LENS1 | [-] | 11.0 | 11.3 | 0.237 | 8.17 | 0.00755 | 2.10 | 2.83 | 3.09 | 0.133 | 0.211 | 0.520 | 0.798 | 0.375 | ||
| LENS10 | [-] | 10.9 | 11.1 | 0.238 | 8.17 | 0.00755 | 2.02 | 2.77 | 3.16 | 0.133 | 0.204 | 0.507 | 0.805 | 0.370 | ||
| LENS5 | [-] | 10.9 | 11.2 | 0.241 | 8.17 | 0.00755 | 2.06 | 2.82 | 3.10 | 0.131 | 0.204 | 0.512 | 0.797 | 0.370 |
Download Data |
Period Mean (original grids) [Pg yr-1] |
Model Period Mean (intersection) [Pg yr-1] |
Model Period Mean (complement) [Pg yr-1] |
Benchmark Period Mean (intersection) [Pg yr-1] |
Benchmark Period Mean (complement) [Pg yr-1] |
Bias [g m-2 d-1] |
RMSE [g m-2 d-1] |
Phase Shift [months] |
Bias Score [1] |
RMSE Score [1] |
Seasonal Cycle Score [1] |
Spatial Distribution Score [1] |
Overall Score [1] |
|||
|---|---|---|---|---|---|---|---|---|---|---|---|---|---|---|---|---|
| Benchmark | [-] | 5.55 | ||||||||||||||
| CESM2_1_001 | [-] | 4.57 | 4.32 | 0.0234 | 5.55 | 0.00508 | -0.470 | 1.92 | 1.79 | 0.505 | 0.384 | 0.691 | 0.885 | 0.570 | ||
| CESM2_1_002 | [-] | 4.56 | 4.30 | 0.0230 | 5.55 | 0.00508 | -0.479 | 1.92 | 1.80 | 0.509 | 0.380 | 0.663 | 0.891 | 0.565 | ||
| CESM2_1_003 | [-] | 4.57 | 4.31 | 0.0234 | 5.55 | 0.00508 | -0.473 | 1.94 | 1.83 | 0.503 | 0.380 | 0.678 | 0.884 | 0.565 | ||
| LENS1 | [-] | 8.65 | 8.18 | 0.0137 | 5.52 | 0.00508 | 1.07 | 1.94 | 1.35 | 0.500 | 0.415 | 0.761 | 0.857 | 0.590 | ||
| LENS10 | [-] | 8.58 | 8.10 | 0.0135 | 5.52 | 0.00508 | 1.04 | 1.91 | 1.37 | 0.503 | 0.421 | 0.756 | 0.860 | 0.592 | ||
| LENS5 | [-] | 8.60 | 8.12 | 0.0138 | 5.52 | 0.00508 | 1.05 | 1.90 | 1.38 | 0.503 | 0.425 | 0.755 | 0.862 | 0.594 |
Download Data |
Period Mean (original grids) [Pg yr-1] |
Model Period Mean (intersection) [Pg yr-1] |
Model Period Mean (complement) [Pg yr-1] |
Benchmark Period Mean (intersection) [Pg yr-1] |
Benchmark Period Mean (complement) [Pg yr-1] |
Bias [g m-2 d-1] |
RMSE [g m-2 d-1] |
Phase Shift [months] |
Bias Score [1] |
RMSE Score [1] |
Seasonal Cycle Score [1] |
Spatial Distribution Score [1] |
Overall Score [1] |
|||
|---|---|---|---|---|---|---|---|---|---|---|---|---|---|---|---|---|
| Benchmark | [-] | 9.94 | ||||||||||||||
| CESM2_1_001 | [-] | 9.44 | 9.00 | 0.344 | 9.92 | 0.0215 | -0.136 | 2.28 | 1.62 | 0.366 | 0.360 | 0.781 | 0.878 | 0.549 | ||
| CESM2_1_002 | [-] | 9.37 | 8.94 | 0.333 | 9.92 | 0.0215 | -0.165 | 2.31 | 1.59 | 0.365 | 0.356 | 0.785 | 0.885 | 0.549 | ||
| CESM2_1_003 | [-] | 9.22 | 8.79 | 0.335 | 9.92 | 0.0215 | -0.206 | 2.28 | 1.50 | 0.367 | 0.358 | 0.785 | 0.883 | 0.550 | ||
| LENS1 | [-] | 9.76 | 9.36 | 0.330 | 9.91 | 0.0215 | -0.0550 | 1.75 | 1.49 | 0.483 | 0.427 | 0.752 | 0.920 | 0.602 | ||
| LENS10 | [-] | 9.73 | 9.34 | 0.326 | 9.91 | 0.0215 | -0.0648 | 1.76 | 1.51 | 0.485 | 0.423 | 0.747 | 0.922 | 0.600 | ||
| LENS5 | [-] | 9.92 | 9.51 | 0.334 | 9.91 | 0.0215 | -0.00846 | 1.75 | 1.59 | 0.491 | 0.427 | 0.744 | 0.924 | 0.603 |
Download Data |
Period Mean (original grids) [Pg yr-1] |
Model Period Mean (intersection) [Pg yr-1] |
Model Period Mean (complement) [Pg yr-1] |
Benchmark Period Mean (intersection) [Pg yr-1] |
Benchmark Period Mean (complement) [Pg yr-1] |
Bias [g m-2 d-1] |
RMSE [g m-2 d-1] |
Phase Shift [months] |
Bias Score [1] |
RMSE Score [1] |
Seasonal Cycle Score [1] |
Spatial Distribution Score [1] |
Overall Score [1] |
|||
|---|---|---|---|---|---|---|---|---|---|---|---|---|---|---|---|---|
| Benchmark | [-] | 1.03 | ||||||||||||||
| CESM2_1_001 | [-] | 1.21 | 1.20 | 0.0138 | 1.03 | 0.00296 | 0.184 | 1.69 | 0.896 | 0.579 | 0.358 | 0.879 | 0.538 | 0.542 | ||
| CESM2_1_002 | [-] | 1.12 | 1.12 | 0.0130 | 1.03 | 0.00296 | 0.108 | 1.62 | 0.921 | 0.599 | 0.365 | 0.874 | 0.570 | 0.554 | ||
| CESM2_1_003 | [-] | 1.17 | 1.16 | 0.0135 | 1.03 | 0.00296 | 0.151 | 1.66 | 0.910 | 0.584 | 0.360 | 0.877 | 0.550 | 0.546 | ||
| LENS1 | [-] | 0.215 | 0.207 | 0.0137 | 1.02 | 0.00294 | -0.678 | 1.26 | 0.947 | 0.568 | 0.438 | 0.892 | 0.670 | 0.601 | ||
| LENS10 | [-] | 0.209 | 0.201 | 0.0135 | 1.02 | 0.00294 | -0.683 | 1.27 | 0.932 | 0.566 | 0.436 | 0.893 | 0.653 | 0.597 | ||
| LENS5 | [-] | 0.211 | 0.203 | 0.0135 | 1.02 | 0.00294 | -0.681 | 1.26 | 0.941 | 0.567 | 0.437 | 0.892 | 0.661 | 0.599 |
Download Data |
Period Mean (original grids) [Pg yr-1] |
Model Period Mean (intersection) [Pg yr-1] |
Model Period Mean (complement) [Pg yr-1] |
Benchmark Period Mean (intersection) [Pg yr-1] |
Benchmark Period Mean (complement) [Pg yr-1] |
Bias [g m-2 d-1] |
RMSE [g m-2 d-1] |
Phase Shift [months] |
Bias Score [1] |
RMSE Score [1] |
Seasonal Cycle Score [1] |
Spatial Distribution Score [1] |
Overall Score [1] |
|||
|---|---|---|---|---|---|---|---|---|---|---|---|---|---|---|---|---|
| Benchmark | [-] | 7.13 | ||||||||||||||
| CESM2_1_001 | [-] | 6.57 | 5.53 | 0.999 | 6.94 | 0.197 | 0.409 | 2.14 | 1.82 | 0.124 | 0.187 | 0.755 | 0.426 | 0.336 | ||
| CESM2_1_002 | [-] | 6.59 | 5.54 | 1.01 | 6.94 | 0.197 | 0.432 | 2.14 | 1.81 | 0.124 | 0.195 | 0.753 | 0.423 | 0.338 | ||
| CESM2_1_003 | [-] | 6.60 | 5.56 | 1.00 | 6.94 | 0.197 | 0.448 | 2.14 | 1.81 | 0.127 | 0.189 | 0.743 | 0.435 | 0.337 | ||
| LENS1 | [-] | 9.74 | 8.24 | 1.45 | 6.94 | 0.197 | 3.92 | 4.23 | 1.63 | 0.0484 | 0.0717 | 0.779 | 0.873 | 0.369 | ||
| LENS10 | [-] | 9.86 | 8.34 | 1.47 | 6.94 | 0.197 | 4.07 | 4.35 | 1.66 | 0.0492 | 0.0782 | 0.772 | 0.895 | 0.375 | ||
| LENS5 | [-] | 10.0 | 8.48 | 1.51 | 6.94 | 0.197 | 4.28 | 4.49 | 2.06 | 0.0407 | 0.100 | 0.690 | 0.897 | 0.366 |
Download Data |
Period Mean (original grids) [Pg yr-1] |
Model Period Mean (intersection) [Pg yr-1] |
Model Period Mean (complement) [Pg yr-1] |
Benchmark Period Mean (intersection) [Pg yr-1] |
Benchmark Period Mean (complement) [Pg yr-1] |
Bias [g m-2 d-1] |
RMSE [g m-2 d-1] |
Phase Shift [months] |
Bias Score [1] |
RMSE Score [1] |
Seasonal Cycle Score [1] |
Spatial Distribution Score [1] |
Overall Score [1] |
|||
|---|---|---|---|---|---|---|---|---|---|---|---|---|---|---|---|---|
| Benchmark | [-] | 6.86 | ||||||||||||||
| CESM2_1_001 | [-] | 7.49 | 7.24 | 0.0706 | 6.85 | 0.00296 | 0.144 | 1.43 | 0.248 | 0.796 | 0.635 | 0.982 | 0.965 | 0.803 | ||
| CESM2_1_002 | [-] | 7.36 | 7.11 | 0.0704 | 6.85 | 0.00296 | 0.105 | 1.43 | 0.232 | 0.802 | 0.629 | 0.983 | 0.962 | 0.801 | ||
| CESM2_1_003 | [-] | 7.56 | 7.30 | 0.0724 | 6.85 | 0.00296 | 0.165 | 1.41 | 0.225 | 0.803 | 0.638 | 0.984 | 0.967 | 0.806 | ||
| LENS1 | [-] | 6.48 | 6.25 | 0.0692 | 6.86 | 0.00295 | -0.154 | 1.70 | 0.552 | 0.708 | 0.582 | 0.958 | 0.814 | 0.729 | ||
| LENS10 | [-] | 6.52 | 6.29 | 0.0690 | 6.86 | 0.00295 | -0.142 | 1.66 | 0.548 | 0.712 | 0.590 | 0.959 | 0.812 | 0.733 | ||
| LENS5 | [-] | 6.59 | 6.36 | 0.0692 | 6.86 | 0.00295 | -0.122 | 1.67 | 0.564 | 0.714 | 0.588 | 0.958 | 0.813 | 0.732 |
Download Data |
Period Mean (original grids) [Pg yr-1] |
Model Period Mean (intersection) [Pg yr-1] |
Model Period Mean (complement) [Pg yr-1] |
Benchmark Period Mean (intersection) [Pg yr-1] |
Benchmark Period Mean (complement) [Pg yr-1] |
Bias [g m-2 d-1] |
RMSE [g m-2 d-1] |
Phase Shift [months] |
Bias Score [1] |
RMSE Score [1] |
Seasonal Cycle Score [1] |
Spatial Distribution Score [1] |
Overall Score [1] |
|||
|---|---|---|---|---|---|---|---|---|---|---|---|---|---|---|---|---|
| Benchmark | [-] | 10.1 | ||||||||||||||
| CESM2_1_001 | [-] | 11.6 | 11.4 | 0.323 | 10.1 | 0.0106 | 0.287 | 1.68 | 1.10 | 0.628 | 0.521 | 0.927 | 0.910 | 0.701 | ||
| CESM2_1_002 | [-] | 11.8 | 11.6 | 0.327 | 10.1 | 0.0106 | 0.322 | 1.70 | 1.12 | 0.628 | 0.523 | 0.926 | 0.911 | 0.702 | ||
| CESM2_1_003 | [-] | 11.5 | 11.3 | 0.322 | 10.1 | 0.0106 | 0.276 | 1.69 | 1.13 | 0.626 | 0.519 | 0.922 | 0.911 | 0.700 | ||
| LENS1 | [-] | 13.5 | 13.2 | 0.397 | 10.0 | 0.0372 | 0.603 | 1.41 | 0.794 | 0.564 | 0.555 | 0.970 | 0.849 | 0.698 | ||
| LENS10 | [-] | 13.5 | 13.2 | 0.397 | 10.0 | 0.0372 | 0.598 | 1.40 | 0.789 | 0.573 | 0.553 | 0.969 | 0.856 | 0.701 | ||
| LENS5 | [-] | 13.5 | 13.2 | 0.396 | 10.0 | 0.0372 | 0.600 | 1.41 | 0.790 | 0.568 | 0.557 | 0.970 | 0.852 | 0.701 |
Download Data |
Period Mean (original grids) [Pg yr-1] |
Model Period Mean (intersection) [Pg yr-1] |
Model Period Mean (complement) [Pg yr-1] |
Benchmark Period Mean (intersection) [Pg yr-1] |
Benchmark Period Mean (complement) [Pg yr-1] |
Bias [g m-2 d-1] |
RMSE [g m-2 d-1] |
Phase Shift [months] |
Bias Score [1] |
RMSE Score [1] |
Seasonal Cycle Score [1] |
Spatial Distribution Score [1] |
Overall Score [1] |
|||
|---|---|---|---|---|---|---|---|---|---|---|---|---|---|---|---|---|
| Benchmark | [-] | 8.37 | ||||||||||||||
| CESM2_1_001 | [-] | 6.82 | 6.21 | 0.475 | 8.32 | 0.0454 | -0.424 | 2.14 | 2.68 | 0.436 | 0.340 | 0.595 | 0.945 | 0.531 | ||
| CESM2_1_002 | [-] | 6.91 | 6.29 | 0.476 | 8.32 | 0.0454 | -0.385 | 2.15 | 2.71 | 0.443 | 0.338 | 0.601 | 0.946 | 0.533 | ||
| CESM2_1_003 | [-] | 6.90 | 6.29 | 0.478 | 8.32 | 0.0454 | -0.385 | 2.14 | 2.72 | 0.441 | 0.342 | 0.598 | 0.946 | 0.534 | ||
| LENS1 | [-] | 9.65 | 8.97 | 0.535 | 8.28 | 0.0454 | 0.800 | 2.16 | 1.16 | 0.482 | 0.335 | 0.869 | 0.932 | 0.591 | ||
| LENS10 | [-] | 9.75 | 9.04 | 0.552 | 8.28 | 0.0454 | 0.850 | 2.18 | 1.09 | 0.479 | 0.338 | 0.884 | 0.919 | 0.592 | ||
| LENS5 | [-] | 9.82 | 9.11 | 0.553 | 8.28 | 0.0454 | 0.879 | 2.17 | 1.13 | 0.482 | 0.348 | 0.874 | 0.916 | 0.593 |
Download Data |
Period Mean (original grids) [Pg yr-1] |
Model Period Mean (intersection) [Pg yr-1] |
Model Period Mean (complement) [Pg yr-1] |
Benchmark Period Mean (intersection) [Pg yr-1] |
Benchmark Period Mean (complement) [Pg yr-1] |
Bias [g m-2 d-1] |
RMSE [g m-2 d-1] |
Phase Shift [months] |
Bias Score [1] |
RMSE Score [1] |
Seasonal Cycle Score [1] |
Spatial Distribution Score [1] |
Overall Score [1] |
|||
|---|---|---|---|---|---|---|---|---|---|---|---|---|---|---|---|---|
| Benchmark | [-] | 1.28 | ||||||||||||||
| CESM2_1_001 | [-] | 0.674 | 0.698 | 0.00209 | 1.28 | 0.00137 | -0.454 | 1.70 | 2.03 | 0.557 | 0.376 | 0.771 | 0.665 | 0.549 | ||
| CESM2_1_002 | [-] | 0.678 | 0.704 | 0.00232 | 1.28 | 0.00137 | -0.448 | 1.67 | 2.08 | 0.566 | 0.381 | 0.762 | 0.684 | 0.555 | ||
| CESM2_1_003 | [-] | 0.654 | 0.680 | 0.00241 | 1.28 | 0.00137 | -0.466 | 1.67 | 2.03 | 0.566 | 0.383 | 0.770 | 0.692 | 0.559 | ||
| LENS1 | [-] | 0.156 | 0.167 | 0.00699 | 1.28 | 0.00137 | -0.877 | 1.55 | 1.36 | 0.542 | 0.415 | 0.885 | 0.444 | 0.540 | ||
| LENS10 | [-] | 0.156 | 0.167 | 0.00691 | 1.28 | 0.00137 | -0.877 | 1.55 | 1.40 | 0.542 | 0.416 | 0.884 | 0.442 | 0.540 | ||
| LENS5 | [-] | 0.158 | 0.169 | 0.00716 | 1.28 | 0.00137 | -0.875 | 1.54 | 1.40 | 0.543 | 0.416 | 0.885 | 0.454 | 0.543 |
Download Data |
Period Mean (original grids) [Pg yr-1] |
Model Period Mean (intersection) [Pg yr-1] |
Model Period Mean (complement) [Pg yr-1] |
Benchmark Period Mean (intersection) [Pg yr-1] |
Benchmark Period Mean (complement) [Pg yr-1] |
Bias [g m-2 d-1] |
RMSE [g m-2 d-1] |
Phase Shift [months] |
Bias Score [1] |
RMSE Score [1] |
Seasonal Cycle Score [1] |
Spatial Distribution Score [1] |
Overall Score [1] |
|||
|---|---|---|---|---|---|---|---|---|---|---|---|---|---|---|---|---|
| Benchmark | [-] | 3.53 | ||||||||||||||
| CESM2_1_001 | [-] | 4.92 | 4.48 | 0.406 | 3.49 | 0.0402 | 0.561 | 1.33 | 2.04 | 0.415 | 0.253 | 0.802 | 0.894 | 0.524 | ||
| CESM2_1_002 | [-] | 5.24 | 4.78 | 0.426 | 3.49 | 0.0402 | 0.671 | 1.37 | 1.85 | 0.387 | 0.262 | 0.818 | 0.876 | 0.521 | ||
| CESM2_1_003 | [-] | 5.14 | 4.68 | 0.426 | 3.49 | 0.0402 | 0.636 | 1.36 | 2.05 | 0.394 | 0.260 | 0.805 | 0.871 | 0.518 | ||
| LENS1 | [-] | 4.46 | 4.05 | 0.386 | 3.50 | 0.0402 | 0.365 | 0.923 | 1.58 | 0.445 | 0.350 | 0.852 | 0.853 | 0.570 | ||
| LENS10 | [-] | 4.40 | 3.99 | 0.377 | 3.50 | 0.0402 | 0.344 | 0.914 | 1.46 | 0.449 | 0.350 | 0.864 | 0.869 | 0.577 | ||
| LENS5 | [-] | 4.54 | 4.12 | 0.390 | 3.50 | 0.0402 | 0.392 | 0.937 | 1.49 | 0.437 | 0.351 | 0.867 | 0.846 | 0.570 |
Download Data |
Period Mean (original grids) [Pg yr-1] |
Model Period Mean (intersection) [Pg yr-1] |
Model Period Mean (complement) [Pg yr-1] |
Benchmark Period Mean (intersection) [Pg yr-1] |
Benchmark Period Mean (complement) [Pg yr-1] |
Bias [g m-2 d-1] |
RMSE [g m-2 d-1] |
Phase Shift [months] |
Bias Score [1] |
RMSE Score [1] |
Seasonal Cycle Score [1] |
Spatial Distribution Score [1] |
Overall Score [1] |
|||
|---|---|---|---|---|---|---|---|---|---|---|---|---|---|---|---|---|
| Benchmark | [-] | 5.29 | ||||||||||||||
| CESM2_1_001 | [-] | 4.43 | 4.21 | 0.173 | 5.26 | 0.0312 | -0.229 | 1.73 | 0.376 | 0.703 | 0.562 | 0.978 | 0.875 | 0.736 | ||
| CESM2_1_002 | [-] | 4.39 | 4.17 | 0.171 | 5.26 | 0.0312 | -0.255 | 1.75 | 0.369 | 0.698 | 0.559 | 0.978 | 0.857 | 0.730 | ||
| CESM2_1_003 | [-] | 4.44 | 4.22 | 0.172 | 5.26 | 0.0312 | -0.225 | 1.74 | 0.351 | 0.702 | 0.559 | 0.979 | 0.867 | 0.733 | ||
| LENS1 | [-] | 3.82 | 3.65 | 0.140 | 5.24 | 0.0312 | -0.593 | 1.89 | 0.524 | 0.667 | 0.504 | 0.967 | 0.951 | 0.719 | ||
| LENS10 | [-] | 3.81 | 3.64 | 0.141 | 5.24 | 0.0312 | -0.596 | 1.91 | 0.493 | 0.667 | 0.500 | 0.970 | 0.952 | 0.718 | ||
| LENS5 | [-] | 3.84 | 3.67 | 0.141 | 5.24 | 0.0312 | -0.581 | 1.91 | 0.491 | 0.670 | 0.500 | 0.970 | 0.952 | 0.718 |
Download Data |
Period Mean (original grids) [Pg yr-1] |
Model Period Mean (intersection) [Pg yr-1] |
Model Period Mean (complement) [Pg yr-1] |
Benchmark Period Mean (intersection) [Pg yr-1] |
Benchmark Period Mean (complement) [Pg yr-1] |
Bias [g m-2 d-1] |
RMSE [g m-2 d-1] |
Phase Shift [months] |
Bias Score [1] |
RMSE Score [1] |
Seasonal Cycle Score [1] |
Spatial Distribution Score [1] |
Overall Score [1] |
|||
|---|---|---|---|---|---|---|---|---|---|---|---|---|---|---|---|---|
| Benchmark | [-] | 119. | ||||||||||||||
| CESM2_1_001 | [-] | 111. | 106. | 4.83 | 118. | 0.774 | -0.0797 | 1.73 | 1.52 | 0.412 | 0.362 | 0.786 | 0.934 | 0.571 | ||
| CESM2_1_002 | [-] | 112. | 107. | 4.86 | 118. | 0.774 | -0.0659 | 1.74 | 1.52 | 0.413 | 0.363 | 0.785 | 0.935 | 0.572 | ||
| CESM2_1_003 | [-] | 111. | 106. | 4.84 | 118. | 0.774 | -0.0764 | 1.73 | 1.53 | 0.412 | 0.364 | 0.782 | 0.935 | 0.571 | ||
| LENS1 | [-] | 131. | 125. | 5.28 | 118. | 0.802 | 0.358 | 1.68 | 1.37 | 0.408 | 0.347 | 0.764 | 0.896 | 0.552 | ||
| LENS10 | [-] | 131. | 125. | 5.29 | 118. | 0.802 | 0.354 | 1.67 | 1.38 | 0.408 | 0.348 | 0.758 | 0.895 | 0.551 | ||
| LENS5 | [-] | 131. | 126. | 5.38 | 118. | 0.802 | 0.373 | 1.68 | 1.39 | 0.408 | 0.349 | 0.753 | 0.893 | 0.550 |
Download Data |
Period Mean (original grids) [Pg yr-1] |
Model Period Mean (intersection) [Pg yr-1] |
Model Period Mean (complement) [Pg yr-1] |
Benchmark Period Mean (intersection) [Pg yr-1] |
Benchmark Period Mean (complement) [Pg yr-1] |
Bias [g m-2 d-1] |
RMSE [g m-2 d-1] |
Phase Shift [months] |
Bias Score [1] |
RMSE Score [1] |
Seasonal Cycle Score [1] |
Spatial Distribution Score [1] |
Overall Score [1] |
|||
|---|---|---|---|---|---|---|---|---|---|---|---|---|---|---|---|---|
| Benchmark | [-] | 0.864 | ||||||||||||||
| CESM2_1_001 | [-] | 1.44 | 1.40 | 0.0552 | 0.859 | 0.00489 | 0.214 | 0.698 | 2.19 | 0.449 | 0.222 | 0.868 | 0.845 | 0.521 | ||
| CESM2_1_002 | [-] | 1.45 | 1.41 | 0.0558 | 0.859 | 0.00489 | 0.220 | 0.708 | 2.20 | 0.453 | 0.218 | 0.868 | 0.844 | 0.520 | ||
| CESM2_1_003 | [-] | 1.41 | 1.37 | 0.0543 | 0.859 | 0.00489 | 0.204 | 0.688 | 2.19 | 0.453 | 0.222 | 0.866 | 0.851 | 0.523 | ||
| LENS1 | [-] | 0.951 | 0.905 | 0.0520 | 0.857 | 0.00577 | 0.0478 | 0.346 | 2.05 | 0.481 | 0.373 | 0.859 | 0.884 | 0.594 | ||
| LENS10 | [-] | 0.920 | 0.875 | 0.0513 | 0.857 | 0.00577 | 0.0377 | 0.340 | 2.06 | 0.483 | 0.374 | 0.858 | 0.884 | 0.595 | ||
| LENS5 | [-] | 0.920 | 0.875 | 0.0509 | 0.857 | 0.00577 | 0.0377 | 0.340 | 2.00 | 0.481 | 0.375 | 0.863 | 0.884 | 0.596 |
Download Data |
Period Mean (original grids) [Pg yr-1] |
Model Period Mean (intersection) [Pg yr-1] |
Model Period Mean (complement) [Pg yr-1] |
Benchmark Period Mean (intersection) [Pg yr-1] |
Benchmark Period Mean (complement) [Pg yr-1] |
Bias [g m-2 d-1] |
RMSE [g m-2 d-1] |
Phase Shift [months] |
Bias Score [1] |
RMSE Score [1] |
Seasonal Cycle Score [1] |
Spatial Distribution Score [1] |
Overall Score [1] |
|||
|---|---|---|---|---|---|---|---|---|---|---|---|---|---|---|---|---|
| Benchmark | [-] | 1.56 | ||||||||||||||
| CESM2_1_001 | [-] | 1.82 | 1.82 | 0.0337 | 1.55 | 0.00323 | 0.143 | 1.15 | 2.17 | 0.529 | 0.374 | 0.874 | 0.590 | 0.548 | ||
| CESM2_1_002 | [-] | 1.83 | 1.82 | 0.0340 | 1.55 | 0.00323 | 0.147 | 1.14 | 2.17 | 0.532 | 0.378 | 0.873 | 0.590 | 0.550 | ||
| CESM2_1_003 | [-] | 1.85 | 1.84 | 0.0351 | 1.55 | 0.00323 | 0.157 | 1.17 | 2.20 | 0.524 | 0.366 | 0.870 | 0.579 | 0.541 | ||
| LENS1 | [-] | 1.13 | 1.08 | 0.0290 | 1.55 | 0.00323 | -0.173 | 0.697 | 1.34 | 0.639 | 0.520 | 0.934 | 0.876 | 0.698 | ||
| LENS10 | [-] | 1.11 | 1.06 | 0.0286 | 1.55 | 0.00323 | -0.180 | 0.693 | 1.34 | 0.641 | 0.522 | 0.933 | 0.877 | 0.699 | ||
| LENS5 | [-] | 1.12 | 1.07 | 0.0286 | 1.55 | 0.00323 | -0.177 | 0.696 | 1.32 | 0.641 | 0.520 | 0.935 | 0.877 | 0.699 |
Download Data |
Period Mean (original grids) [Pg yr-1] |
Model Period Mean (intersection) [Pg yr-1] |
Model Period Mean (complement) [Pg yr-1] |
Benchmark Period Mean (intersection) [Pg yr-1] |
Benchmark Period Mean (complement) [Pg yr-1] |
Bias [g m-2 d-1] |
RMSE [g m-2 d-1] |
Phase Shift [months] |
Bias Score [1] |
RMSE Score [1] |
Seasonal Cycle Score [1] |
Spatial Distribution Score [1] |
Overall Score [1] |
|||
|---|---|---|---|---|---|---|---|---|---|---|---|---|---|---|---|---|
| Benchmark | [-] | 3.62 | ||||||||||||||
| CESM2_1_001 | [-] | 3.37 | 2.94 | 0.358 | 3.60 | 0.0267 | 0.0266 | 2.20 | 2.35 | 0.323 | 0.262 | 0.666 | 0.931 | 0.489 | ||
| CESM2_1_002 | [-] | 3.34 | 2.91 | 0.361 | 3.60 | 0.0267 | -0.00174 | 2.15 | 2.28 | 0.332 | 0.266 | 0.676 | 0.933 | 0.495 | ||
| CESM2_1_003 | [-] | 3.39 | 2.96 | 0.359 | 3.60 | 0.0267 | 0.0351 | 2.17 | 2.30 | 0.329 | 0.274 | 0.677 | 0.934 | 0.498 | ||
| LENS1 | [-] | 3.52 | 3.16 | 0.291 | 3.59 | 0.0267 | 0.164 | 2.31 | 2.00 | 0.261 | 0.277 | 0.694 | 0.920 | 0.486 | ||
| LENS10 | [-] | 3.43 | 3.09 | 0.279 | 3.59 | 0.0267 | 0.0807 | 2.32 | 2.19 | 0.252 | 0.280 | 0.650 | 0.917 | 0.476 | ||
| LENS5 | [-] | 3.51 | 3.15 | 0.287 | 3.59 | 0.0267 | 0.154 | 2.32 | 2.19 | 0.261 | 0.277 | 0.661 | 0.920 | 0.479 |
Download Data |
Period Mean (original grids) [Pg yr-1] |
Model Period Mean (intersection) [Pg yr-1] |
Model Period Mean (complement) [Pg yr-1] |
Benchmark Period Mean (intersection) [Pg yr-1] |
Benchmark Period Mean (complement) [Pg yr-1] |
Bias [g m-2 d-1] |
RMSE [g m-2 d-1] |
Phase Shift [months] |
Bias Score [1] |
RMSE Score [1] |
Seasonal Cycle Score [1] |
Spatial Distribution Score [1] |
Overall Score [1] |
|||
|---|---|---|---|---|---|---|---|---|---|---|---|---|---|---|---|---|
| Benchmark | [-] | 5.09 | ||||||||||||||
| CESM2_1_001 | [-] | 3.84 | 3.65 | 0.122 | 5.09 | 0.00487 | -0.846 | 2.13 | 0.861 | 0.675 | 0.570 | 0.928 | 0.962 | 0.741 | ||
| CESM2_1_002 | [-] | 3.89 | 3.70 | 0.122 | 5.09 | 0.00487 | -0.813 | 2.12 | 0.871 | 0.680 | 0.570 | 0.928 | 0.961 | 0.742 | ||
| CESM2_1_003 | [-] | 3.88 | 3.69 | 0.121 | 5.09 | 0.00487 | -0.825 | 2.12 | 0.843 | 0.678 | 0.571 | 0.931 | 0.961 | 0.743 | ||
| LENS1 | [-] | 6.29 | 6.01 | 0.186 | 5.10 | 0.00489 | 0.838 | 2.24 | 0.698 | 0.663 | 0.560 | 0.948 | 0.739 | 0.694 | ||
| LENS10 | [-] | 6.21 | 5.94 | 0.184 | 5.10 | 0.00489 | 0.789 | 2.24 | 0.787 | 0.662 | 0.556 | 0.937 | 0.737 | 0.690 | ||
| LENS5 | [-] | 6.29 | 6.01 | 0.185 | 5.10 | 0.00489 | 0.836 | 2.24 | 0.703 | 0.662 | 0.563 | 0.947 | 0.743 | 0.695 |
Download Data |
Period Mean (original grids) [Pg yr-1] |
Model Period Mean (intersection) [Pg yr-1] |
Model Period Mean (complement) [Pg yr-1] |
Benchmark Period Mean (intersection) [Pg yr-1] |
Benchmark Period Mean (complement) [Pg yr-1] |
Bias [g m-2 d-1] |
RMSE [g m-2 d-1] |
Phase Shift [months] |
Bias Score [1] |
RMSE Score [1] |
Seasonal Cycle Score [1] |
Spatial Distribution Score [1] |
Overall Score [1] |
|||
|---|---|---|---|---|---|---|---|---|---|---|---|---|---|---|---|---|
| Benchmark | [-] | 3.36 | ||||||||||||||
| CESM2_1_001 | [-] | 4.19 | 4.11 | 0.0650 | 3.34 | 0.0222 | 0.498 | 1.68 | 0.518 | 0.630 | 0.532 | 0.966 | 0.862 | 0.705 | ||
| CESM2_1_002 | [-] | 4.25 | 4.17 | 0.0666 | 3.34 | 0.0222 | 0.532 | 1.69 | 0.549 | 0.630 | 0.531 | 0.964 | 0.878 | 0.707 | ||
| CESM2_1_003 | [-] | 4.18 | 4.10 | 0.0652 | 3.34 | 0.0222 | 0.496 | 1.67 | 0.473 | 0.631 | 0.535 | 0.969 | 0.875 | 0.709 | ||
| LENS1 | [-] | 3.73 | 3.68 | 0.0787 | 3.33 | 0.0221 | 0.275 | 1.35 | 0.879 | 0.679 | 0.576 | 0.940 | 0.778 | 0.709 | ||
| LENS10 | [-] | 3.72 | 3.68 | 0.0782 | 3.33 | 0.0221 | 0.273 | 1.35 | 0.892 | 0.679 | 0.576 | 0.937 | 0.782 | 0.710 | ||
| LENS5 | [-] | 3.80 | 3.76 | 0.0797 | 3.33 | 0.0221 | 0.315 | 1.38 | 0.864 | 0.672 | 0.572 | 0.941 | 0.767 | 0.705 |
Download Data |
Period Mean (original grids) [Pg yr-1] |
Model Period Mean (intersection) [Pg yr-1] |
Model Period Mean (complement) [Pg yr-1] |
Benchmark Period Mean (intersection) [Pg yr-1] |
Benchmark Period Mean (complement) [Pg yr-1] |
Bias [g m-2 d-1] |
RMSE [g m-2 d-1] |
Phase Shift [months] |
Bias Score [1] |
RMSE Score [1] |
Seasonal Cycle Score [1] |
Spatial Distribution Score [1] |
Overall Score [1] |
|||
|---|---|---|---|---|---|---|---|---|---|---|---|---|---|---|---|---|
| Benchmark | [-] | 1.79 | ||||||||||||||
| CESM2_1_001 | [-] | 1.24 | 1.31 | 0.0103 | 1.79 | 0.00506 | -0.280 | 1.17 | 1.13 | 0.551 | 0.417 | 0.900 | 0.802 | 0.617 | ||
| CESM2_1_002 | [-] | 1.28 | 1.34 | 0.0103 | 1.79 | 0.00506 | -0.259 | 1.18 | 1.11 | 0.546 | 0.413 | 0.902 | 0.805 | 0.616 | ||
| CESM2_1_003 | [-] | 1.26 | 1.32 | 0.00982 | 1.79 | 0.00506 | -0.270 | 1.18 | 1.14 | 0.549 | 0.415 | 0.900 | 0.804 | 0.616 | ||
| LENS1 | [-] | 2.09 | 2.16 | 0.0101 | 1.79 | 0.00507 | 0.309 | 1.09 | 0.907 | 0.556 | 0.469 | 0.932 | 0.901 | 0.665 | ||
| LENS10 | [-] | 2.05 | 2.12 | 0.00974 | 1.79 | 0.00507 | 0.283 | 1.07 | 0.985 | 0.557 | 0.471 | 0.925 | 0.903 | 0.665 | ||
| LENS5 | [-] | 2.07 | 2.15 | 0.00946 | 1.79 | 0.00507 | 0.299 | 1.10 | 1.00 | 0.554 | 0.465 | 0.922 | 0.900 | 0.661 |
Download Data |
Period Mean (original grids) [Pg yr-1] |
Model Period Mean (intersection) [Pg yr-1] |
Model Period Mean (complement) [Pg yr-1] |
Benchmark Period Mean (intersection) [Pg yr-1] |
Benchmark Period Mean (complement) [Pg yr-1] |
Bias [g m-2 d-1] |
RMSE [g m-2 d-1] |
Phase Shift [months] |
Bias Score [1] |
RMSE Score [1] |
Seasonal Cycle Score [1] |
Spatial Distribution Score [1] |
Overall Score [1] |
|||
|---|---|---|---|---|---|---|---|---|---|---|---|---|---|---|---|---|
| Benchmark | [-] | 23.2 | ||||||||||||||
| CESM2_1_001 | [-] | 19.1 | 18.9 | 0.142 | 23.2 | 0.0226 | -1.20 | 2.42 | 2.19 | 0.0982 | 0.162 | 0.681 | 0.970 | 0.415 | ||
| CESM2_1_002 | [-] | 19.4 | 19.1 | 0.145 | 23.2 | 0.0226 | -1.12 | 2.36 | 2.20 | 0.101 | 0.171 | 0.684 | 0.968 | 0.419 | ||
| CESM2_1_003 | [-] | 19.3 | 19.1 | 0.144 | 23.2 | 0.0226 | -1.14 | 2.37 | 2.26 | 0.0983 | 0.170 | 0.667 | 0.969 | 0.415 | ||
| LENS1 | [-] | 24.1 | 23.9 | 0.130 | 23.1 | 0.0227 | 0.403 | 2.67 | 3.09 | 0.184 | 0.0831 | 0.462 | 0.739 | 0.310 | ||
| LENS10 | [-] | 24.1 | 23.9 | 0.129 | 23.1 | 0.0227 | 0.418 | 2.65 | 3.11 | 0.176 | 0.0878 | 0.455 | 0.732 | 0.308 | ||
| LENS5 | [-] | 24.0 | 23.8 | 0.127 | 23.1 | 0.0227 | 0.365 | 2.68 | 3.13 | 0.179 | 0.0816 | 0.451 | 0.737 | 0.306 |
Download Data |
Period Mean (original grids) [Pg yr-1] |
Model Period Mean (intersection) [Pg yr-1] |
Model Period Mean (complement) [Pg yr-1] |
Benchmark Period Mean (intersection) [Pg yr-1] |
Benchmark Period Mean (complement) [Pg yr-1] |
Bias [g m-2 d-1] |
RMSE [g m-2 d-1] |
Phase Shift [months] |
Bias Score [1] |
RMSE Score [1] |
Seasonal Cycle Score [1] |
Spatial Distribution Score [1] |
Overall Score [1] |
|||
|---|---|---|---|---|---|---|---|---|---|---|---|---|---|---|---|---|
| Benchmark | [-] | 10.4 | ||||||||||||||
| CESM2_1_001 | [-] | 7.46 | 7.37 | 0.265 | 10.4 | 0.00314 | -1.18 | 2.39 | 1.07 | 0.454 | 0.416 | 0.888 | 0.928 | 0.621 | ||
| CESM2_1_002 | [-] | 7.33 | 7.25 | 0.255 | 10.4 | 0.00314 | -1.23 | 2.42 | 1.14 | 0.449 | 0.415 | 0.884 | 0.925 | 0.618 | ||
| CESM2_1_003 | [-] | 7.28 | 7.20 | 0.252 | 10.4 | 0.00314 | -1.26 | 2.42 | 1.05 | 0.443 | 0.415 | 0.891 | 0.925 | 0.618 | ||
| LENS1 | [-] | 8.74 | 8.66 | 0.262 | 10.4 | 0.00314 | -0.662 | 2.17 | 1.07 | 0.444 | 0.463 | 0.868 | 0.855 | 0.619 | ||
| LENS10 | [-] | 8.82 | 8.74 | 0.266 | 10.4 | 0.00314 | -0.626 | 2.16 | 1.21 | 0.453 | 0.460 | 0.837 | 0.849 | 0.612 | ||
| LENS5 | [-] | 8.78 | 8.70 | 0.265 | 10.4 | 0.00314 | -0.644 | 2.16 | 1.20 | 0.452 | 0.459 | 0.848 | 0.859 | 0.616 |
Download Data |
Period Mean (original grids) [Pg yr-1] |
Model Period Mean (intersection) [Pg yr-1] |
Model Period Mean (complement) [Pg yr-1] |
Benchmark Period Mean (intersection) [Pg yr-1] |
Benchmark Period Mean (complement) [Pg yr-1] |
Bias [g m-2 d-1] |
RMSE [g m-2 d-1] |
Phase Shift [months] |
Bias Score [1] |
RMSE Score [1] |
Seasonal Cycle Score [1] |
Spatial Distribution Score [1] |
Overall Score [1] |
|||
|---|---|---|---|---|---|---|---|---|---|---|---|---|---|---|---|---|
| Benchmark | [-] | 1.16 | ||||||||||||||
| CESM2_1_001 | [-] | 2.23 | 2.04 | 0.0920 | 1.14 | 0.0148 | 0.995 | 1.74 | 1.56 | 0.375 | 0.389 | 0.886 | 0.875 | 0.583 | ||
| CESM2_1_002 | [-] | 2.27 | 2.08 | 0.0955 | 1.14 | 0.0148 | 1.03 | 1.76 | 1.52 | 0.376 | 0.396 | 0.886 | 0.873 | 0.585 | ||
| CESM2_1_003 | [-] | 2.24 | 2.05 | 0.0938 | 1.14 | 0.0148 | 1.01 | 1.75 | 1.57 | 0.375 | 0.391 | 0.882 | 0.873 | 0.582 | ||
| LENS1 | [-] | 2.36 | 2.19 | 0.0585 | 1.14 | 0.0148 | 1.10 | 1.57 | 1.49 | 0.355 | 0.392 | 0.857 | 0.799 | 0.559 | ||
| LENS10 | [-] | 2.32 | 2.15 | 0.0576 | 1.14 | 0.0148 | 1.07 | 1.54 | 1.50 | 0.360 | 0.395 | 0.867 | 0.795 | 0.563 | ||
| LENS5 | [-] | 2.34 | 2.17 | 0.0577 | 1.14 | 0.0148 | 1.08 | 1.56 | 1.48 | 0.355 | 0.393 | 0.858 | 0.798 | 0.559 |
Temporally integrated period mean