Mean State
Download Data |
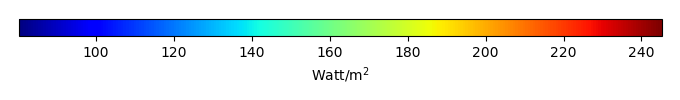
Period Mean (original grids) [Watt/m2] |
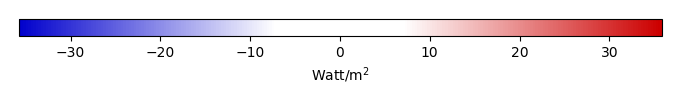
Bias [Watt/m2] |
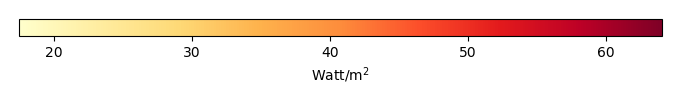
RMSE [Watt/m2] |
Phase Shift [months] |
Bias Score [1] |
RMSE Score [1] |
Seasonal Cycle Score [1] |
Interannual Variability Score [1] |
Overall Score [1] |
|||
|---|---|---|---|---|---|---|---|---|---|---|---|---|
| Benchmark | [-] | 225. | ||||||||||
| CESM2_1_001 | [-] | 218. | -6.92 | 27.1 | 0.508 | 0.827 | 0.517 | 0.966 | 0.956 | 0.757 | ||
| CESM2_1_002 | [-] | 213. | -12.0 | 32.3 | 1.00 | 0.746 | 0.451 | 0.935 | 0.939 | 0.704 | ||
| CESM2_1_003 | [-] | 214. | -11.4 | 30.7 | 0.508 | 0.765 | 0.466 | 0.966 | 0.964 | 0.726 | ||
| LENS1 | [-] | 205. | -19.9 | 43.2 | 0.508 | 0.605 | 0.400 | 0.966 | 0.874 | 0.649 | ||
| LENS10 | [-] | 201. | -24.3 | 42.5 | 1.00 | 0.538 | 0.409 | 0.935 | 0.883 | 0.634 | ||
| LENS5 | [-] | 202. | -22.8 | 41.6 | 0.508 | 0.550 | 0.389 | 0.966 | 0.906 | 0.640 |
Download Data |
Period Mean (original grids) [Watt/m2] |
Bias [Watt/m2] |
RMSE [Watt/m2] |
Phase Shift [months] |
Bias Score [1] |
RMSE Score [1] |
Seasonal Cycle Score [1] |
Interannual Variability Score [1] |
Overall Score [1] |
|||
|---|---|---|---|---|---|---|---|---|---|---|---|---|
| Benchmark | [-] | 150. | ||||||||||
| CESM2_1_001 | [-] | 86.0 | -64.0 | 64.4 | 0.00 | 0.364 | 0.422 | 1.00 | 0.735 | 0.588 | ||
| CESM2_1_002 | [-] | 83.4 | -66.5 | 68.8 | 1.02 | 0.350 | 0.402 | 0.933 | 0.769 | 0.571 | ||
| CESM2_1_003 | [-] | 86.9 | -63.1 | 63.4 | 0.00 | 0.369 | 0.422 | 1.00 | 0.731 | 0.589 | ||
| LENS1 | [-] | 118. | -32.0 | 69.5 | 1.02 | 0.604 | 0.293 | 0.933 | 0.473 | 0.519 | ||
| LENS10 | [-] | 118. | -31.8 | 68.8 | 1.02 | 0.605 | 0.296 | 0.933 | 0.473 | 0.521 | ||
| LENS5 | [-] | 116. | -34.2 | 64.2 | 0.00 | 0.582 | 0.324 | 1.00 | 0.503 | 0.546 |
Download Data |
Period Mean (original grids) [Watt/m2] |
Bias [Watt/m2] |
RMSE [Watt/m2] |
Phase Shift [months] |
Bias Score [1] |
RMSE Score [1] |
Seasonal Cycle Score [1] |
Interannual Variability Score [1] |
Overall Score [1] |
|||
|---|---|---|---|---|---|---|---|---|---|---|---|---|
| Benchmark | [-] | 197. | ||||||||||
| CESM2_1_001 | [-] | 182. | -14.4 | 26.0 | 5.05 | 0.499 | 0.316 | 0.0695 | 0.968 | 0.434 | ||
| CESM2_1_002 | [-] | 184. | -13.0 | 32.6 | 5.05 | 0.535 | 0.216 | 0.0695 | 0.941 | 0.396 | ||
| CESM2_1_003 | [-] | 182. | -14.9 | 30.7 | 5.05 | 0.487 | 0.257 | 0.0695 | 0.890 | 0.392 | ||
| LENS1 | [-] | 163. | -34.1 | 46.5 | 4.07 | 0.194 | 0.159 | 0.248 | 0.755 | 0.303 | ||
| LENS10 | [-] | 156. | -40.6 | 46.4 | 5.05 | 0.141 | 0.310 | 0.0695 | 0.982 | 0.363 | ||
| LENS5 | [-] | 157. | -40.0 | 49.3 | 5.05 | 0.146 | 0.238 | 0.0695 | 0.920 | 0.322 |
Download Data |
Period Mean (original grids) [Watt/m2] |
Bias [Watt/m2] |
RMSE [Watt/m2] |
Phase Shift [months] |
Bias Score [1] |
RMSE Score [1] |
Seasonal Cycle Score [1] |
Interannual Variability Score [1] |
Overall Score [1] |
|||
|---|---|---|---|---|---|---|---|---|---|---|---|---|
| Benchmark | [-] | 123. | ||||||||||
| CESM2_1_001 | [-] | 118. | -5.22 | 35.6 | 0.508 | 0.862 | 0.646 | 0.966 | 0.890 | 0.802 | ||
| CESM2_1_002 | [-] | 121. | -1.57 | 29.2 | 0.508 | 0.856 | 0.703 | 0.966 | 0.886 | 0.823 | ||
| CESM2_1_003 | [-] | 117. | -6.05 | 34.0 | 1.02 | 0.865 | 0.681 | 0.933 | 0.886 | 0.809 | ||
| LENS1 | [-] | 130. | 6.88 | 28.6 | 0.508 | 0.914 | 0.709 | 0.966 | 0.926 | 0.845 | ||
| LENS10 | [-] | 131. | 8.26 | 29.5 | 0.508 | 0.898 | 0.713 | 0.966 | 0.908 | 0.840 | ||
| LENS5 | [-] | 128. | 4.71 | 30.4 | 0.00 | 0.939 | 0.691 | 1.00 | 0.936 | 0.851 |
Download Data |
Period Mean (original grids) [Watt/m2] |
Bias [Watt/m2] |
RMSE [Watt/m2] |
Phase Shift [months] |
Bias Score [1] |
RMSE Score [1] |
Seasonal Cycle Score [1] |
Interannual Variability Score [1] |
Overall Score [1] |
|||
|---|---|---|---|---|---|---|---|---|---|---|---|---|
| Benchmark | [-] | 214. | ||||||||||
| CESM2_1_001 | [-] | 213. | -1.58 | 35.3 | 0.517 | 0.739 | 0.445 | 0.965 | 0.734 | 0.666 | ||
| CESM2_1_002 | [-] | 208. | -6.25 | 40.0 | 0.508 | 0.743 | 0.415 | 0.966 | 0.722 | 0.652 | ||
| CESM2_1_003 | [-] | 209. | -5.12 | 36.1 | 0.517 | 0.717 | 0.442 | 0.965 | 0.723 | 0.658 | ||
| LENS1 | [-] | 195. | -19.4 | 49.1 | 0.508 | 0.664 | 0.375 | 0.966 | 0.630 | 0.602 | ||
| LENS10 | [-] | 199. | -15.5 | 44.2 | 1.02 | 0.732 | 0.389 | 0.932 | 0.630 | 0.614 | ||
| LENS5 | [-] | 193. | -20.6 | 44.7 | 1.02 | 0.641 | 0.415 | 0.933 | 0.671 | 0.615 |
Download Data |
Period Mean (original grids) [Watt/m2] |
Bias [Watt/m2] |
RMSE [Watt/m2] |
Phase Shift [months] |
Bias Score [1] |
RMSE Score [1] |
Seasonal Cycle Score [1] |
Interannual Variability Score [1] |
Overall Score [1] |
|||
|---|---|---|---|---|---|---|---|---|---|---|---|---|
| Benchmark | [-] | 138. | ||||||||||
| CESM2_1_001 | [-] | 150. | 11.8 | 34.6 | 0.470 | 0.819 | 0.684 | 0.962 | 0.892 | 0.808 | ||
| CESM2_1_002 | [-] | 150. | 11.8 | 35.3 | 0.665 | 0.819 | 0.671 | 0.950 | 0.892 | 0.801 | ||
| CESM2_1_003 | [-] | 150. | 11.7 | 35.0 | 0.371 | 0.820 | 0.678 | 0.973 | 0.887 | 0.807 | ||
| LENS1 | [-] | 142. | 3.96 | 31.9 | 0.489 | 0.871 | 0.684 | 0.962 | 0.898 | 0.820 | ||
| LENS10 | [-] | 142. | 4.18 | 31.6 | 0.587 | 0.870 | 0.688 | 0.954 | 0.903 | 0.821 | ||
| LENS5 | [-] | 142. | 3.80 | 33.2 | 0.469 | 0.871 | 0.672 | 0.967 | 0.898 | 0.816 |
Download Data |
Period Mean (original grids) [Watt/m2] |
Bias [Watt/m2] |
RMSE [Watt/m2] |
Phase Shift [months] |
Bias Score [1] |
RMSE Score [1] |
Seasonal Cycle Score [1] |
Interannual Variability Score [1] |
Overall Score [1] |
|||
|---|---|---|---|---|---|---|---|---|---|---|---|---|
| Benchmark | [-] | 150. | ||||||||||
| CESM2_1_001 | [-] | 160. | 10.3 | 34.7 | 0.577 | 0.797 | 0.662 | 0.946 | 0.898 | 0.793 | ||
| CESM2_1_002 | [-] | 160. | 10.4 | 35.1 | 0.645 | 0.795 | 0.655 | 0.945 | 0.897 | 0.790 | ||
| CESM2_1_003 | [-] | 160. | 10.1 | 34.9 | 0.528 | 0.795 | 0.659 | 0.953 | 0.895 | 0.792 | ||
| LENS1 | [-] | 154. | 4.51 | 33.6 | 0.616 | 0.831 | 0.656 | 0.949 | 0.888 | 0.796 | ||
| LENS10 | [-] | 154. | 4.92 | 33.3 | 0.694 | 0.833 | 0.659 | 0.943 | 0.894 | 0.798 | ||
| LENS5 | [-] | 154. | 4.71 | 34.0 | 0.547 | 0.833 | 0.653 | 0.954 | 0.891 | 0.797 |
Download Data |
Period Mean (original grids) [Watt/m2] |
Bias [Watt/m2] |
RMSE [Watt/m2] |
Phase Shift [months] |
Bias Score [1] |
RMSE Score [1] |
Seasonal Cycle Score [1] |
Interannual Variability Score [1] |
Overall Score [1] |
|||
|---|---|---|---|---|---|---|---|---|---|---|---|---|
| Benchmark | [-] | 251. | ||||||||||
| CESM2_1_001 | [-] | 243. | -7.65 | 30.5 | 1.02 | 0.913 | 0.702 | 0.933 | 0.973 | 0.844 | ||
| CESM2_1_002 | [-] | 244. | -6.55 | 25.6 | 0.00 | 0.925 | 0.739 | 1.00 | 0.946 | 0.870 | ||
| CESM2_1_003 | [-] | 245. | -6.13 | 26.8 | 1.02 | 0.930 | 0.729 | 0.933 | 0.944 | 0.853 | ||
| LENS1 | [-] | 234. | -16.5 | 29.5 | 0.00 | 0.823 | 0.727 | 1.00 | 0.922 | 0.840 | ||
| LENS10 | [-] | 236. | -15.2 | 26.4 | 0.00 | 0.835 | 0.752 | 1.00 | 0.949 | 0.858 | ||
| LENS5 | [-] | 236. | -15.3 | 28.4 | 0.00 | 0.835 | 0.729 | 1.00 | 0.920 | 0.842 |
Download Data |
Period Mean (original grids) [Watt/m2] |
Bias [Watt/m2] |
RMSE [Watt/m2] |
Phase Shift [months] |
Bias Score [1] |
RMSE Score [1] |
Seasonal Cycle Score [1] |
Interannual Variability Score [1] |
Overall Score [1] |
|||
|---|---|---|---|---|---|---|---|---|---|---|---|---|
| Benchmark | [-] | 160. | ||||||||||
| CESM2_1_001 | [-] | 182. | 22.1 | 36.6 | 0.582 | 0.712 | 0.660 | 0.945 | 0.880 | 0.772 | ||
| CESM2_1_002 | [-] | 182. | 21.9 | 36.4 | 0.679 | 0.715 | 0.660 | 0.938 | 0.891 | 0.773 | ||
| CESM2_1_003 | [-] | 183. | 22.3 | 36.4 | 0.533 | 0.712 | 0.658 | 0.953 | 0.892 | 0.774 | ||
| LENS1 | [-] | 169. | 8.84 | 36.6 | 0.921 | 0.791 | 0.628 | 0.928 | 0.881 | 0.771 | ||
| LENS10 | [-] | 170. | 10.1 | 35.2 | 0.775 | 0.805 | 0.640 | 0.937 | 0.886 | 0.782 | ||
| LENS5 | [-] | 171. | 10.8 | 34.1 | 0.485 | 0.809 | 0.653 | 0.957 | 0.876 | 0.789 |
Download Data |
Period Mean (original grids) [Watt/m2] |
Bias [Watt/m2] |
RMSE [Watt/m2] |
Phase Shift [months] |
Bias Score [1] |
RMSE Score [1] |
Seasonal Cycle Score [1] |
Interannual Variability Score [1] |
Overall Score [1] |
|||
|---|---|---|---|---|---|---|---|---|---|---|---|---|
| Benchmark | [-] | 130. | ||||||||||
| CESM2_1_001 | [-] | 129. | -0.613 | 31.0 | 0.799 | 0.900 | 0.681 | 0.922 | 0.940 | 0.825 | ||
| CESM2_1_002 | [-] | 130. | 0.495 | 29.0 | 0.436 | 0.897 | 0.697 | 0.971 | 0.935 | 0.839 | ||
| CESM2_1_003 | [-] | 129. | -0.927 | 30.6 | 0.871 | 0.898 | 0.682 | 0.917 | 0.936 | 0.823 | ||
| LENS1 | [-] | 144. | 13.8 | 29.1 | 0.581 | 0.834 | 0.729 | 0.962 | 0.935 | 0.838 | ||
| LENS10 | [-] | 144. | 14.3 | 31.6 | 0.799 | 0.830 | 0.700 | 0.947 | 0.930 | 0.821 | ||
| LENS5 | [-] | 144. | 13.9 | 30.4 | 0.726 | 0.834 | 0.715 | 0.944 | 0.932 | 0.828 |
Download Data |
Period Mean (original grids) [Watt/m2] |
Bias [Watt/m2] |
RMSE [Watt/m2] |
Phase Shift [months] |
Bias Score [1] |
RMSE Score [1] |
Seasonal Cycle Score [1] |
Interannual Variability Score [1] |
Overall Score [1] |
|||
|---|---|---|---|---|---|---|---|---|---|---|---|---|
| Benchmark | [-] | 196. | ||||||||||
| CESM2_1_001 | [-] | 211. | 14.8 | 33.6 | 0.508 | 0.839 | 0.708 | 0.966 | 0.919 | 0.828 | ||
| CESM2_1_002 | [-] | 211. | 15.6 | 35.9 | 0.339 | 0.830 | 0.691 | 0.978 | 0.912 | 0.820 | ||
| CESM2_1_003 | [-] | 211. | 15.1 | 31.8 | 0.339 | 0.833 | 0.731 | 0.978 | 0.922 | 0.839 | ||
| LENS1 | [-] | 203. | 7.10 | 32.3 | 0.339 | 0.895 | 0.697 | 0.978 | 0.929 | 0.839 | ||
| LENS10 | [-] | 204. | 7.84 | 32.4 | 0.339 | 0.899 | 0.696 | 0.978 | 0.941 | 0.842 | ||
| LENS5 | [-] | 204. | 8.14 | 34.7 | 0.339 | 0.900 | 0.679 | 0.978 | 0.932 | 0.833 |
Download Data |
Period Mean (original grids) [Watt/m2] |
Bias [Watt/m2] |
RMSE [Watt/m2] |
Phase Shift [months] |
Bias Score [1] |
RMSE Score [1] |
Seasonal Cycle Score [1] |
Interannual Variability Score [1] |
Overall Score [1] |
|||
|---|---|---|---|---|---|---|---|---|---|---|---|---|
| Benchmark | [-] | 185. | ||||||||||
| CESM2_1_001 | [-] | 229. | 43.7 | 56.1 | 0.00 | 0.302 | 0.432 | 1.00 | 0.952 | 0.624 | ||
| CESM2_1_002 | [-] | 230. | 44.4 | 58.6 | 0.00 | 0.297 | 0.399 | 1.00 | 0.986 | 0.616 | ||
| CESM2_1_003 | [-] | 229. | 44.1 | 60.3 | 0.00 | 0.300 | 0.381 | 1.00 | 0.927 | 0.598 | ||
| LENS1 | [-] | 195. | 10.2 | 44.8 | 1.02 | 0.757 | 0.310 | 0.933 | 0.676 | 0.597 | ||
| LENS10 | [-] | 193. | 7.51 | 42.0 | 1.02 | 0.814 | 0.324 | 0.933 | 0.672 | 0.614 | ||
| LENS5 | [-] | 196. | 10.3 | 45.8 | 1.02 | 0.754 | 0.305 | 0.933 | 0.653 | 0.590 |
Temporally integrated period mean