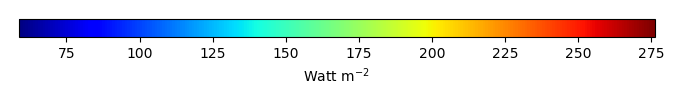
Mean State
Download Data |
Period Mean (original grids) [Watt m-2] |
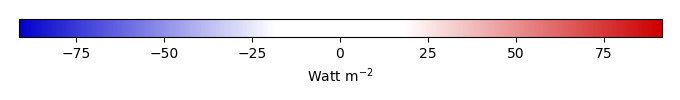
Bias [Watt m-2] |
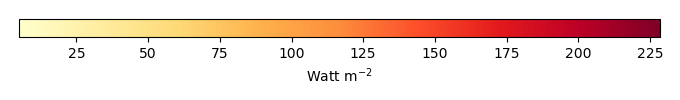
RMSE [Watt m-2] |
Phase Shift [months] |
Bias Score [1] |
RMSE Score [1] |
Seasonal Cycle Score [1] |
Interannual Variability Score [1] |
Overall Score [1] |
|||
|---|---|---|---|---|---|---|---|---|---|---|---|---|
| Benchmark | [-] | 199. | ||||||||||
| CESM2_1_001 | [-] | 213. | 14.5 | 34.5 | 0.983 | 0.590 | 0.328 | 0.937 | 0.853 | 0.607 | ||
| CESM2_1_002 | [-] | 211. | 12.3 | 33.1 | 0.983 | 0.639 | 0.329 | 0.937 | 0.868 | 0.620 | ||
| CESM2_1_003 | [-] | 213. | 14.3 | 35.4 | 0.983 | 0.593 | 0.306 | 0.937 | 0.810 | 0.590 | ||
| LENS1 | [-] | 189. | -9.64 | 43.9 | 0.983 | 0.704 | 0.209 | 0.937 | 0.489 | 0.509 | ||
| LENS10 | [-] | 189. | -9.64 | 42.8 | 0.983 | 0.703 | 0.218 | 0.937 | 0.481 | 0.511 | ||
| LENS5 | [-] | 190. | -9.04 | 43.2 | 0.983 | 0.719 | 0.214 | 0.937 | 0.479 | 0.513 |
Download Data |
Period Mean (original grids) [Watt m-2] |
Bias [Watt m-2] |
RMSE [Watt m-2] |
Phase Shift [months] |
Bias Score [1] |
RMSE Score [1] |
Seasonal Cycle Score [1] |
Interannual Variability Score [1] |
Overall Score [1] |
|||
|---|---|---|---|---|---|---|---|---|---|---|---|---|
| Benchmark | [-] | 242. | ||||||||||
| CESM2_1_001 | [-] | 228. | -14.1 | 20.4 | 0.00 | 0.817 | 0.759 | 1.00 | 0.987 | 0.864 | ||
| CESM2_1_002 | [-] | 229. | -13.3 | 27.9 | 0.00 | 0.827 | 0.697 | 1.00 | 0.999 | 0.844 | ||
| CESM2_1_003 | [-] | 232. | -9.90 | 23.5 | 0.00 | 0.868 | 0.703 | 1.00 | 0.983 | 0.852 | ||
| LENS1 | [-] | 221. | -20.7 | 33.4 | 0.00 | 0.745 | 0.627 | 1.00 | 0.894 | 0.778 | ||
| LENS10 | [-] | 218. | -24.1 | 36.0 | 1.02 | 0.709 | 0.646 | 0.933 | 0.887 | 0.764 | ||
| LENS5 | [-] | 216. | -26.1 | 36.0 | 1.02 | 0.689 | 0.649 | 0.933 | 0.914 | 0.767 |
Download Data |
Period Mean (original grids) [Watt m-2] |
Bias [Watt m-2] |
RMSE [Watt m-2] |
Phase Shift [months] |
Bias Score [1] |
RMSE Score [1] |
Seasonal Cycle Score [1] |
Interannual Variability Score [1] |
Overall Score [1] |
|||
|---|---|---|---|---|---|---|---|---|---|---|---|---|
| Benchmark | [-] | 105. | ||||||||||
| CESM2_1_001 | [-] | 80.3 | -24.9 | 24.4 | 0.00 | 0.739 | 0.754 | 1.00 | 0.941 | 0.838 | ||
| CESM2_1_002 | [-] | 80.2 | -25.0 | 15.4 | 1.02 | 0.738 | 0.751 | 0.933 | 0.942 | 0.823 | ||
| CESM2_1_003 | [-] | 80.3 | -24.9 | 28.1 | 0.00 | 0.739 | 0.738 | 1.00 | 0.947 | 0.832 | ||
| LENS1 | [-] | 110. | nan | nan | nan | 0.00 | nan | nan | 0.00 | nan | ||
| LENS10 | [-] | 107. | nan | nan | nan | 0.00 | nan | nan | 0.00 | nan | ||
| LENS5 | [-] | 108. | nan | nan | nan | 0.00 | nan | nan | 0.00 | nan |
Download Data |
Period Mean (original grids) [Watt m-2] |
Bias [Watt m-2] |
RMSE [Watt m-2] |
Phase Shift [months] |
Bias Score [1] |
RMSE Score [1] |
Seasonal Cycle Score [1] |
Interannual Variability Score [1] |
Overall Score [1] |
|||
|---|---|---|---|---|---|---|---|---|---|---|---|---|
| Benchmark | [-] | 153. | ||||||||||
| CESM2_1_001 | [-] | 170. | 15.9 | 33.4 | 0.339 | 0.564 | 0.587 | 0.978 | 0.588 | 0.661 | ||
| CESM2_1_002 | [-] | 171. | 16.7 | 34.0 | 1.02 | 0.556 | 0.584 | 0.932 | 0.588 | 0.649 | ||
| CESM2_1_003 | [-] | 170. | 15.9 | 36.5 | 0.683 | 0.566 | 0.547 | 0.954 | 0.586 | 0.640 | ||
| LENS1 | [-] | 154. | -0.379 | 23.4 | 1.02 | 0.248 | 0.638 | 0.933 | 0.203 | 0.532 | ||
| LENS10 | [-] | 155. | 3.37 | 26.0 | 1.02 | 0.234 | 0.599 | 0.933 | 0.216 | 0.516 | ||
| LENS5 | [-] | 153. | 0.174 | 35.0 | 1.02 | 0.249 | 0.510 | 0.933 | 0.278 | 0.496 |
Download Data |
Period Mean (original grids) [Watt m-2] |
Bias [Watt m-2] |
RMSE [Watt m-2] |
Phase Shift [months] |
Bias Score [1] |
RMSE Score [1] |
Seasonal Cycle Score [1] |
Interannual Variability Score [1] |
Overall Score [1] |
|||
|---|---|---|---|---|---|---|---|---|---|---|---|---|
| Benchmark | [-] | 222. | ||||||||||
| CESM2_1_001 | [-] | 218. | -4.16 | 37.5 | 0.00 | 0.770 | 0.493 | 1.00 | 0.826 | 0.716 | ||
| CESM2_1_002 | [-] | 219. | -3.35 | 40.1 | 0.517 | 0.784 | 0.468 | 0.965 | 0.825 | 0.702 | ||
| CESM2_1_003 | [-] | 220. | -2.48 | 39.3 | 0.517 | 0.792 | 0.480 | 0.965 | 0.811 | 0.706 | ||
| LENS1 | [-] | 200. | -34.8 | 54.7 | 1.03 | 0.450 | 0.543 | 0.931 | 0.610 | 0.615 | ||
| LENS10 | [-] | 202. | -33.3 | 53.8 | 1.37 | 0.461 | 0.546 | 0.869 | 0.630 | 0.611 | ||
| LENS5 | [-] | 198. | -36.7 | 55.1 | 0.683 | 0.437 | 0.556 | 0.954 | 0.618 | 0.624 |
Download Data |
Period Mean (original grids) [Watt m-2] |
Bias [Watt m-2] |
RMSE [Watt m-2] |
Phase Shift [months] |
Bias Score [1] |
RMSE Score [1] |
Seasonal Cycle Score [1] |
Interannual Variability Score [1] |
Overall Score [1] |
|||
|---|---|---|---|---|---|---|---|---|---|---|---|---|
| Benchmark | [-] | 135. | ||||||||||
| CESM2_1_001 | [-] | 145. | 9.52 | 31.1 | 0.381 | 0.851 | 0.705 | 0.975 | 0.931 | 0.834 | ||
| CESM2_1_002 | [-] | 145. | 9.62 | 32.6 | 0.127 | 0.844 | 0.692 | 0.992 | 0.927 | 0.829 | ||
| CESM2_1_003 | [-] | 145. | 9.52 | 31.0 | 0.254 | 0.849 | 0.705 | 0.983 | 0.928 | 0.834 | ||
| LENS1 | [-] | 134. | 14.1 | 25.5 | 0.874 | 0.666 | 0.610 | 0.873 | 0.718 | 0.695 | ||
| LENS10 | [-] | 133. | 13.5 | 25.6 | 0.583 | 0.665 | 0.620 | 0.918 | 0.725 | 0.710 | ||
| LENS5 | [-] | 134. | 14.0 | 25.6 | 0.729 | 0.671 | 0.602 | 0.882 | 0.719 | 0.696 |
Download Data |
Period Mean (original grids) [Watt m-2] |
Bias [Watt m-2] |
RMSE [Watt m-2] |
Phase Shift [months] |
Bias Score [1] |
RMSE Score [1] |
Seasonal Cycle Score [1] |
Interannual Variability Score [1] |
Overall Score [1] |
|||
|---|---|---|---|---|---|---|---|---|---|---|---|---|
| Benchmark | [-] | 181. | ||||||||||
| CESM2_1_001 | [-] | 179. | 4.92 | 36.4 | 0.557 | 0.683 | 0.627 | 0.925 | 0.771 | 0.726 | ||
| CESM2_1_002 | [-] | 179. | 4.83 | 35.3 | 0.776 | 0.683 | 0.604 | 0.912 | 0.771 | 0.715 | ||
| CESM2_1_003 | [-] | 180. | 5.23 | 35.5 | 0.729 | 0.684 | 0.607 | 0.915 | 0.767 | 0.716 | ||
| LENS1 | [-] | 170. | -2.29 | 44.5 | 0.788 | 0.500 | 0.561 | 0.925 | 0.545 | 0.618 | ||
| LENS10 | [-] | 171. | -1.85 | 41.9 | 0.690 | 0.500 | 0.566 | 0.933 | 0.550 | 0.623 | ||
| LENS5 | [-] | 170. | -2.10 | 43.0 | 0.591 | 0.500 | 0.560 | 0.938 | 0.559 | 0.623 |
Download Data |
Period Mean (original grids) [Watt m-2] |
Bias [Watt m-2] |
RMSE [Watt m-2] |
Phase Shift [months] |
Bias Score [1] |
RMSE Score [1] |
Seasonal Cycle Score [1] |
Interannual Variability Score [1] |
Overall Score [1] |
|||
|---|---|---|---|---|---|---|---|---|---|---|---|---|
| Benchmark | [-] | 249. | ||||||||||
| CESM2_1_001 | [-] | 268. | 10.9 | 21.8 | 0.508 | 0.569 | 0.750 | 0.966 | 0.652 | 0.738 | ||
| CESM2_1_002 | [-] | 267. | 10.9 | 22.4 | 1.02 | 0.570 | 0.740 | 0.933 | 0.646 | 0.726 | ||
| CESM2_1_003 | [-] | 269. | 12.0 | 22.9 | 1.02 | 0.559 | 0.751 | 0.933 | 0.653 | 0.729 | ||
| LENS1 | [-] | 252. | -5.74 | 30.5 | 0.508 | 0.572 | 0.662 | 0.966 | 0.793 | 0.731 | ||
| LENS10 | [-] | 253. | -5.81 | 27.7 | 0.508 | 0.563 | 0.691 | 0.966 | 0.788 | 0.740 | ||
| LENS5 | [-] | 252. | -6.00 | 26.8 | 0.508 | 0.568 | 0.692 | 0.966 | 0.787 | 0.741 |
Download Data |
Period Mean (original grids) [Watt m-2] |
Bias [Watt m-2] |
RMSE [Watt m-2] |
Phase Shift [months] |
Bias Score [1] |
RMSE Score [1] |
Seasonal Cycle Score [1] |
Interannual Variability Score [1] |
Overall Score [1] |
|||
|---|---|---|---|---|---|---|---|---|---|---|---|---|
| Benchmark | [-] | 151. | ||||||||||
| CESM2_1_001 | [-] | 90.3 | -61.0 | 13.3 | 0.00 | 0.489 | 0.442 | 1.00 | 0.610 | 0.596 | ||
| CESM2_1_002 | [-] | 89.7 | -61.6 | 14.9 | 0.508 | 0.498 | 0.436 | 0.966 | 0.592 | 0.585 | ||
| CESM2_1_003 | [-] | 89.4 | -61.8 | 19.6 | 0.508 | 0.493 | 0.437 | 0.966 | 0.602 | 0.587 | ||
| LENS1 | [-] | 113. | -102. | 53.4 | 1.02 | 0.0200 | 0.00891 | 0.933 | 0.0534 | 0.205 | ||
| LENS10 | [-] | 114. | -101. | 52.2 | 1.02 | 0.0205 | 0.00932 | 0.933 | 0.0536 | 0.205 | ||
| LENS5 | [-] | 114. | -100. | 43.2 | 1.02 | 0.0211 | 0.0123 | 0.933 | 0.0528 | 0.206 |
Download Data |
Period Mean (original grids) [Watt m-2] |
Bias [Watt m-2] |
RMSE [Watt m-2] |
Phase Shift [months] |
Bias Score [1] |
RMSE Score [1] |
Seasonal Cycle Score [1] |
Interannual Variability Score [1] |
Overall Score [1] |
|||
|---|---|---|---|---|---|---|---|---|---|---|---|---|
| Benchmark | [-] | 187. | ||||||||||
| CESM2_1_001 | [-] | 193. | 6.52 | 36.7 | 0.00 | 0.803 | 0.686 | 1.00 | 0.903 | 0.816 | ||
| CESM2_1_002 | [-] | 192. | 5.59 | 37.3 | 0.145 | 0.806 | 0.672 | 0.990 | 0.904 | 0.809 | ||
| CESM2_1_003 | [-] | 193. | 6.67 | 38.0 | 0.436 | 0.800 | 0.670 | 0.954 | 0.901 | 0.799 | ||
| LENS1 | [-] | 177. | -8.36 | 40.7 | 0.581 | 0.855 | 0.634 | 0.962 | 0.814 | 0.780 | ||
| LENS10 | [-] | 178. | -7.57 | 39.7 | 0.436 | 0.853 | 0.636 | 0.971 | 0.818 | 0.783 | ||
| LENS5 | [-] | 179. | -6.95 | 39.4 | 0.436 | 0.853 | 0.639 | 0.954 | 0.812 | 0.779 |
Download Data |
Period Mean (original grids) [Watt m-2] |
Bias [Watt m-2] |
RMSE [Watt m-2] |
Phase Shift [months] |
Bias Score [1] |
RMSE Score [1] |
Seasonal Cycle Score [1] |
Interannual Variability Score [1] |
Overall Score [1] |
|||
|---|---|---|---|---|---|---|---|---|---|---|---|---|
| Benchmark | [-] | 162. | ||||||||||
| CESM2_1_001 | [-] | 170. | 8.54 | 24.3 | 0.00 | 0.899 | 0.762 | 1.00 | 0.937 | 0.872 | ||
| CESM2_1_002 | [-] | 171. | 8.90 | 25.4 | 0.00 | 0.895 | 0.750 | 1.00 | 0.934 | 0.866 | ||
| CESM2_1_003 | [-] | 172. | 10.2 | 25.1 | 0.00 | 0.881 | 0.755 | 1.00 | 0.925 | 0.863 | ||
| LENS1 | [-] | 166. | 3.34 | 21.0 | 0.00 | 0.959 | 0.773 | 1.00 | 0.983 | 0.898 | ||
| LENS10 | [-] | 168. | 5.78 | 21.8 | 0.00 | 0.930 | 0.770 | 1.00 | 0.988 | 0.892 | ||
| LENS5 | [-] | 165. | 2.29 | 25.6 | 0.00 | 0.972 | 0.729 | 1.00 | 0.999 | 0.886 |
Download Data |
Period Mean (original grids) [Watt m-2] |
Bias [Watt m-2] |
RMSE [Watt m-2] |
Phase Shift [months] |
Bias Score [1] |
RMSE Score [1] |
Seasonal Cycle Score [1] |
Interannual Variability Score [1] |
Overall Score [1] |
|||
|---|---|---|---|---|---|---|---|---|---|---|---|---|
| Benchmark | [-] | 193. | ||||||||||
| CESM2_1_001 | [-] | 212. | 19.2 | 30.0 | 0.00 | 0.772 | 0.748 | 1.00 | 0.964 | 0.846 | ||
| CESM2_1_002 | [-] | 211. | 17.8 | 28.2 | 0.508 | 0.788 | 0.759 | 0.966 | 0.968 | 0.848 | ||
| CESM2_1_003 | [-] | 211. | 18.3 | 27.9 | 0.00 | 0.782 | 0.765 | 1.00 | 0.970 | 0.856 | ||
| LENS1 | [-] | 202. | 10.4 | 25.7 | 0.508 | 0.868 | 0.740 | 0.966 | 0.936 | 0.850 | ||
| LENS10 | [-] | 202. | 9.69 | 25.0 | 0.00 | 0.878 | 0.743 | 1.00 | 0.943 | 0.861 | ||
| LENS5 | [-] | 203. | 10.8 | 25.8 | 0.00 | 0.865 | 0.739 | 1.00 | 0.941 | 0.857 |
Download Data |
Period Mean (original grids) [Watt m-2] |
Bias [Watt m-2] |
RMSE [Watt m-2] |
Phase Shift [months] |
Bias Score [1] |
RMSE Score [1] |
Seasonal Cycle Score [1] |
Interannual Variability Score [1] |
Overall Score [1] |
|||
|---|---|---|---|---|---|---|---|---|---|---|---|---|
| Benchmark | [-] | 195. | ||||||||||
| CESM2_1_001 | [-] | 223. | 27.2 | 27.8 | 4.08 | 0.138 | 0.795 | 0.244 | 0.514 | 0.497 | ||
| CESM2_1_002 | [-] | 223. | 27.8 | 29.1 | 5.10 | 0.133 | 0.204 | 0.0631 | 0.587 | 0.238 | ||
| CESM2_1_003 | [-] | 224. | 28.1 | 23.1 | 5.10 | 0.131 | 0.174 | 0.0631 | 0.553 | 0.219 | ||
| LENS1 | [-] | 201. | nan | nan | nan | 0.00 | nan | nan | nan | nan | ||
| LENS10 | [-] | 201. | nan | nan | nan | 0.00 | nan | nan | nan | nan | ||
| LENS5 | [-] | 202. | nan | nan | nan | 0.00 | nan | nan | nan | nan |
Download Data |
Period Mean (original grids) [Watt m-2] |
Bias [Watt m-2] |
RMSE [Watt m-2] |
Phase Shift [months] |
Bias Score [1] |
RMSE Score [1] |
Seasonal Cycle Score [1] |
Interannual Variability Score [1] |
Overall Score [1] |
|||
|---|---|---|---|---|---|---|---|---|---|---|---|---|
| Benchmark | [-] | 208. | ||||||||||
| CESM2_1_001 | [-] | 212. | 3.81 | 36.7 | 2.54 | 0.773 | 0.454 | 0.578 | 0.950 | 0.642 | ||
| CESM2_1_002 | [-] | 214. | 5.31 | 35.8 | 2.54 | 0.735 | 0.465 | 0.624 | 0.952 | 0.648 | ||
| CESM2_1_003 | [-] | 213. | 4.48 | 33.9 | 2.30 | 0.755 | 0.487 | 0.668 | 0.931 | 0.666 | ||
| LENS1 | [-] | 193. | -13.4 | 36.4 | 2.02 | 0.189 | 0.504 | 0.752 | 0.309 | 0.452 | ||
| LENS10 | [-] | 193. | -8.96 | 31.3 | 2.02 | 0.207 | 0.536 | 0.752 | 0.308 | 0.468 | ||
| LENS5 | [-] | 193. | -8.30 | 30.1 | 0.00 | 0.210 | 0.549 | 1.00 | 0.291 | 0.520 |
Temporally integrated period mean