Mean State
Download Data |
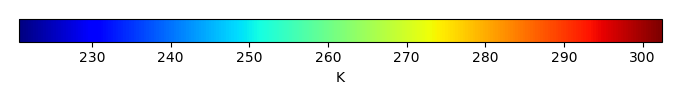
Period Mean (original grids) [K] |
Model Period Mean (intersection) [K] |
Model Period Mean (complement) [K] |
Benchmark Period Mean (intersection) [K] |
Benchmark Period Mean (complement) [K] |
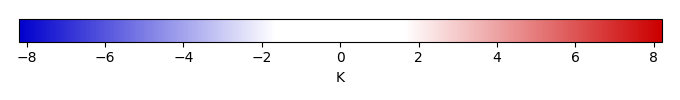
Bias [K] |
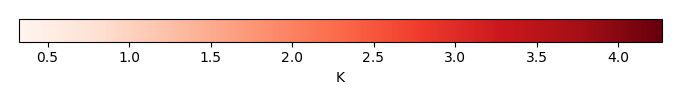
RMSE [K] |
Phase Shift [months] |
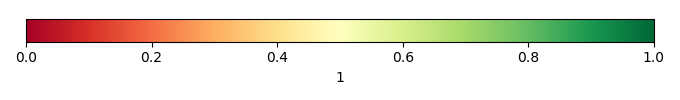
Bias Score [1] |
RMSE Score [1] |
Seasonal Cycle Score [1] |
Spatial Distribution Score [1] |
Interannual Variability Score [1] |
Overall Score [1] |
|||
|---|---|---|---|---|---|---|---|---|---|---|---|---|---|---|---|---|---|
| Benchmark | [-] | 287. | |||||||||||||||
| CESM2_1_001 | [-] | 283. | 287. | 246. | 287. | 292. | 0.873 | 3.15 | 0.518 | 0.73 | 0.62 | 0.95 | 1.0 | 0.85 | 0.80 | ||
| CESM2_1_002 | [-] | 283. | 287. | 246. | 287. | 292. | 0.906 | 3.16 | 0.526 | 0.73 | 0.62 | 0.95 | 1.0 | 0.81 | 0.79 | ||
| CESM2_1_003 | [-] | 283. | 287. | 246. | 287. | 292. | 0.882 | 3.17 | 0.519 | 0.73 | 0.62 | 0.95 | 1.0 | 0.83 | 0.79 | ||
| LENS1 | [-] | 280. | 285. | 243. | 287. | 292. | -1.29 | 3.45 | 0.543 | 0.66 | 0.62 | 0.94 | 1.0 | 0.81 | 0.77 | ||
| LENS10 | [-] | 280. | 285. | 243. | 287. | 292. | -1.29 | 3.43 | 0.572 | 0.66 | 0.62 | 0.93 | 1.0 | 0.82 | 0.78 | ||
| LENS5 | [-] | 281. | 285. | 244. | 287. | 292. | -1.22 | 3.40 | 0.573 | 0.66 | 0.62 | 0.93 | 1.0 | 0.84 | 0.78 |
Temporally integrated period mean