Mean State
Download Data |
Period Mean (original grids) [Pg] |
Model Period Mean (intersection) [Pg] |
Benchmark Period Mean (intersection) [Pg] |
Model Period Mean (complement) [Pg] |
Benchmark Period Mean (complement) [Pg] |
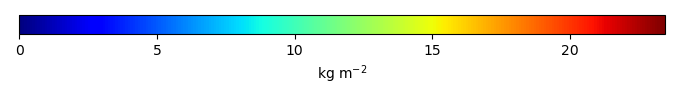
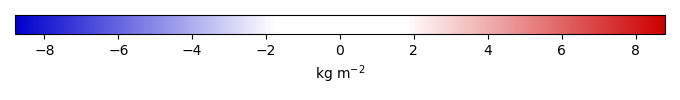
Bias [kg m-2] |
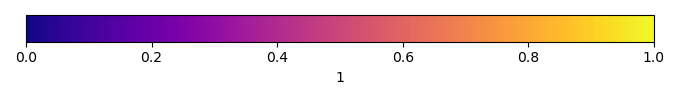
Bias Score [1] |
Spatial Distribution Score [1] |
Overall Score [1] |
|||
|---|---|---|---|---|---|---|---|---|---|---|---|---|
| Benchmark | [-] | 38.7 | ||||||||||
| CESM3_092H | [-] | 59.5 | 60.0 | 38.7 | 0.445 | 2.83e-06 | 5.22 | 0.487 | 0.714 | 0.600 | ||
| CMIP6_001 | [-] | 48.0 | 48.6 | 38.7 | 0.213 | 0.0457 | 2.55 | 0.555 | 0.866 | 0.710 | ||
| LE2_001 | [-] | 47.9 | 48.5 | 38.7 | 0.211 | 0.0457 | 2.53 | 0.550 | 0.865 | 0.708 |
Download Data |
Period Mean (original grids) [Pg] |
Model Period Mean (intersection) [Pg] |
Benchmark Period Mean (intersection) [Pg] |
Model Period Mean (complement) [Pg] |
Benchmark Period Mean (complement) [Pg] |
Bias [kg m-2] |
Bias Score [1] |
Spatial Distribution Score [1] |
Overall Score [1] |
|||
|---|---|---|---|---|---|---|---|---|---|---|---|---|
| Benchmark | [-] | 11.9 | ||||||||||
| CESM3_092H | [-] | 5.31 | 4.62 | 11.9 | 0.0430 | 0.00349 | -1.08 | 0.483 | 0.816 | 0.650 | ||
| CMIP6_001 | [-] | 4.43 | 3.84 | 11.9 | 0.0294 | 0.0196 | -1.19 | 0.484 | 0.782 | 0.633 | ||
| LE2_001 | [-] | 4.48 | 3.89 | 11.9 | 0.0307 | 0.0196 | -1.19 | 0.486 | 0.782 | 0.634 |
Download Data |
Period Mean (original grids) [Pg] |
Model Period Mean (intersection) [Pg] |
Benchmark Period Mean (intersection) [Pg] |
Model Period Mean (complement) [Pg] |
Benchmark Period Mean (complement) [Pg] |
Bias [kg m-2] |
Bias Score [1] |
Spatial Distribution Score [1] |
Overall Score [1] |
|||
|---|---|---|---|---|---|---|---|---|---|---|---|---|
| Benchmark | [-] | 24.6 | ||||||||||
| CESM3_092H | [-] | 14.5 | 13.8 | 24.6 | 0.335 | 0.00368 | -1.02 | 0.497 | 0.789 | 0.643 | ||
| CMIP6_001 | [-] | 20.9 | 20.2 | 24.5 | 0.348 | 0.0612 | -0.330 | 0.503 | 0.682 | 0.593 | ||
| LE2_001 | [-] | 20.1 | 19.4 | 24.5 | 0.345 | 0.0612 | -0.414 | 0.505 | 0.699 | 0.602 |
Download Data |
Period Mean (original grids) [Pg] |
Model Period Mean (intersection) [Pg] |
Benchmark Period Mean (intersection) [Pg] |
Model Period Mean (complement) [Pg] |
Benchmark Period Mean (complement) [Pg] |
Bias [kg m-2] |
Bias Score [1] |
Spatial Distribution Score [1] |
Overall Score [1] |
|||
|---|---|---|---|---|---|---|---|---|---|---|---|---|
| Benchmark | [-] | 36.8 | ||||||||||
| CESM3_092H | [-] | 57.2 | 53.2 | 36.7 | 3.61 | 0.0600 | 11.4 | 0.366 | 0.856 | 0.611 | ||
| CMIP6_001 | [-] | 45.7 | 43.5 | 35.7 | 2.02 | 1.10 | 7.14 | 0.482 | 0.935 | 0.709 | ||
| LE2_001 | [-] | 45.2 | 43.0 | 35.7 | 1.99 | 1.10 | 6.93 | 0.486 | 0.932 | 0.709 |
Download Data |
Period Mean (original grids) [Pg] |
Model Period Mean (intersection) [Pg] |
Benchmark Period Mean (intersection) [Pg] |
Model Period Mean (complement) [Pg] |
Benchmark Period Mean (complement) [Pg] |
Bias [kg m-2] |
Bias Score [1] |
Spatial Distribution Score [1] |
Overall Score [1] |
|||
|---|---|---|---|---|---|---|---|---|---|---|---|---|
| Benchmark | [-] | 38.4 | ||||||||||
| CESM3_092H | [-] | 47.8 | 33.3 | 38.4 | 15.5 | 0.00403 | -0.0592 | 0.576 | 0.771 | 0.674 | ||
| CMIP6_001 | [-] | 34.3 | 23.3 | 38.3 | 11.8 | 0.0891 | -1.52 | 0.553 | 0.851 | 0.702 | ||
| LE2_001 | [-] | 34.2 | 23.0 | 38.3 | 12.0 | 0.0891 | -1.56 | 0.550 | 0.850 | 0.700 |
Download Data |
Period Mean (original grids) [Pg] |
Model Period Mean (intersection) [Pg] |
Benchmark Period Mean (intersection) [Pg] |
Model Period Mean (complement) [Pg] |
Benchmark Period Mean (complement) [Pg] |
Bias [kg m-2] |
Bias Score [1] |
Spatial Distribution Score [1] |
Overall Score [1] |
|||
|---|---|---|---|---|---|---|---|---|---|---|---|---|
| Benchmark | [-] | 43.7 | ||||||||||
| CESM3_092H | [-] | 27.7 | 26.2 | 43.7 | 0.861 | 0.0121 | -1.39 | 0.504 | 0.890 | 0.697 | ||
| CMIP6_001 | [-] | 24.7 | 23.2 | 43.4 | 0.675 | 0.257 | -1.94 | 0.484 | 0.878 | 0.681 | ||
| LE2_001 | [-] | 24.5 | 23.0 | 43.4 | 0.666 | 0.257 | -1.98 | 0.484 | 0.879 | 0.682 |
Download Data |
Period Mean (original grids) [Pg] |
Model Period Mean (intersection) [Pg] |
Benchmark Period Mean (intersection) [Pg] |
Model Period Mean (complement) [Pg] |
Benchmark Period Mean (complement) [Pg] |
Bias [kg m-2] |
Bias Score [1] |
Spatial Distribution Score [1] |
Overall Score [1] |
|||
|---|---|---|---|---|---|---|---|---|---|---|---|---|
| Benchmark | [-] | 13.7 | ||||||||||
| CESM3_092H | [-] | 12.6 | 4.92 | 13.6 | 7.53 | 0.0119 | -1.09 | 0.456 | 0.611 | 0.534 | ||
| CMIP6_001 | [-] | 11.7 | 4.30 | 13.5 | 7.27 | 0.139 | -1.28 | 0.448 | 0.598 | 0.523 | ||
| LE2_001 | [-] | 11.5 | 4.10 | 13.5 | 7.29 | 0.139 | -1.32 | 0.443 | 0.600 | 0.522 |
Download Data |
Period Mean (original grids) [Pg] |
Model Period Mean (intersection) [Pg] |
Benchmark Period Mean (intersection) [Pg] |
Model Period Mean (complement) [Pg] |
Benchmark Period Mean (complement) [Pg] |
Bias [kg m-2] |
Bias Score [1] |
Spatial Distribution Score [1] |
Overall Score [1] |
|||
|---|---|---|---|---|---|---|---|---|---|---|---|---|
| Benchmark | [-] | 349. | ||||||||||
| CESM3_092H | [-] | 634. | 379. | 349. | 253. | 0.130 | 1.21 | 0.505 | 0.717 | 0.611 | ||
| CMIP6_001 | [-] | 485. | 327. | 347. | 156. | 2.11 | 0.293 | 0.527 | 0.821 | 0.674 | ||
| LE2_001 | [-] | 483. | 325. | 347. | 157. | 2.11 | 0.249 | 0.526 | 0.822 | 0.674 |
Download Data |
Period Mean (original grids) [Pg] |
Model Period Mean (intersection) [Pg] |
Benchmark Period Mean (intersection) [Pg] |
Model Period Mean (complement) [Pg] |
Benchmark Period Mean (complement) [Pg] |
Bias [kg m-2] |
Bias Score [1] |
Spatial Distribution Score [1] |
Overall Score [1] |
|||
|---|---|---|---|---|---|---|---|---|---|---|---|---|
| Benchmark | [-] | 2.53 | ||||||||||
| CESM3_092H | [-] | 1.91 | 0.290 | 2.53 | 1.64 | 4.44e-06 | -0.972 | 0.463 | 0.0470 | 0.255 | ||
| CMIP6_001 | [-] | 1.16 | 0.220 | 2.53 | 0.955 | 0.00250 | -1.04 | 0.484 | 0.0286 | 0.256 | ||
| LE2_001 | [-] | 1.23 | 0.239 | 2.53 | 1.01 | 0.00250 | -1.03 | 0.487 | 0.0344 | 0.261 |
Download Data |
Period Mean (original grids) [Pg] |
Model Period Mean (intersection) [Pg] |
Benchmark Period Mean (intersection) [Pg] |
Model Period Mean (complement) [Pg] |
Benchmark Period Mean (complement) [Pg] |
Bias [kg m-2] |
Bias Score [1] |
Spatial Distribution Score [1] |
Overall Score [1] |
|||
|---|---|---|---|---|---|---|---|---|---|---|---|---|
| Benchmark | [-] | 11.1 | ||||||||||
| CESM3_092H | [-] | 11.8 | 10.8 | 11.0 | 0.696 | 0.0275 | 1.34 | 0.503 | 0.838 | 0.671 | ||
| CMIP6_001 | [-] | 9.83 | 9.15 | 10.9 | 0.448 | 0.149 | 0.516 | 0.508 | 0.832 | 0.670 | ||
| LE2_001 | [-] | 9.96 | 9.28 | 10.9 | 0.449 | 0.149 | 0.563 | 0.509 | 0.832 | 0.670 |
Download Data |
Period Mean (original grids) [Pg] |
Model Period Mean (intersection) [Pg] |
Benchmark Period Mean (intersection) [Pg] |
Model Period Mean (complement) [Pg] |
Benchmark Period Mean (complement) [Pg] |
Bias [kg m-2] |
Bias Score [1] |
Spatial Distribution Score [1] |
Overall Score [1] |
|||
|---|---|---|---|---|---|---|---|---|---|---|---|---|
| Benchmark | [-] | 1.55 | ||||||||||
| CESM3_092H | [-] | 13.3 | 3.37 | 1.55 | 9.85 | 4.74e-05 | 3.33 | 0.364 | 0.457 | 0.411 | ||
| CMIP6_001 | [-] | 9.51 | 1.37 | 1.52 | 8.06 | 0.0247 | 0.411 | 0.471 | 0.583 | 0.527 | ||
| LE2_001 | [-] | 9.31 | 1.31 | 1.52 | 7.91 | 0.0247 | 0.335 | 0.477 | 0.606 | 0.541 |
Download Data |
Period Mean (original grids) [Pg] |
Model Period Mean (intersection) [Pg] |
Benchmark Period Mean (intersection) [Pg] |
Model Period Mean (complement) [Pg] |
Benchmark Period Mean (complement) [Pg] |
Bias [kg m-2] |
Bias Score [1] |
Spatial Distribution Score [1] |
Overall Score [1] |
|||
|---|---|---|---|---|---|---|---|---|---|---|---|---|
| Benchmark | [-] | 0.219 | ||||||||||
| CESM3_092H | [-] | 8.77 | 0.231 | 0.219 | 8.63 | 0.0398 | 0.591 | 0.625 | 0.608 | |||
| CMIP6_001 | [-] | 1.65 | 0.0965 | 0.219 | 1.57 | -0.393 | 0.617 | 0.205 | 0.411 | |||
| LE2_001 | [-] | 1.67 | 0.0959 | 0.219 | 1.60 | -0.394 | 0.626 | 0.204 | 0.415 |
Download Data |
Period Mean (original grids) [Pg] |
Model Period Mean (intersection) [Pg] |
Benchmark Period Mean (intersection) [Pg] |
Model Period Mean (complement) [Pg] |
Benchmark Period Mean (complement) [Pg] |
Bias [kg m-2] |
Bias Score [1] |
Spatial Distribution Score [1] |
Overall Score [1] |
|||
|---|---|---|---|---|---|---|---|---|---|---|---|---|
| Benchmark | [-] | 100. | ||||||||||
| CESM3_092H | [-] | 141. | 140. | 100. | 0.554 | 0.000737 | 4.89 | 0.570 | 0.691 | 0.630 | ||
| CMIP6_001 | [-] | 130. | 129. | 100. | 0.323 | 0.0690 | 3.73 | 0.601 | 0.848 | 0.724 | ||
| LE2_001 | [-] | 129. | 128. | 100. | 0.320 | 0.0690 | 3.68 | 0.602 | 0.848 | 0.725 |
Download Data |
Period Mean (original grids) [Pg] |
Model Period Mean (intersection) [Pg] |
Benchmark Period Mean (intersection) [Pg] |
Model Period Mean (complement) [Pg] |
Benchmark Period Mean (complement) [Pg] |
Bias [kg m-2] |
Bias Score [1] |
Spatial Distribution Score [1] |
Overall Score [1] |
|||
|---|---|---|---|---|---|---|---|---|---|---|---|---|
| Benchmark | [-] | 18.4 | ||||||||||
| CESM3_092H | [-] | 17.2 | 17.3 | 18.4 | 0.373 | 0.00509 | 0.00563 | 0.574 | 0.712 | 0.643 | ||
| CMIP6_001 | [-] | 13.6 | 13.7 | 18.4 | 0.250 | 0.0281 | -0.496 | 0.603 | 0.779 | 0.691 | ||
| LE2_001 | [-] | 13.3 | 13.4 | 18.4 | 0.235 | 0.0281 | -0.557 | 0.598 | 0.778 | 0.688 |
Download Data |
Period Mean (original grids) [Pg] |
Model Period Mean (intersection) [Pg] |
Benchmark Period Mean (intersection) [Pg] |
Model Period Mean (complement) [Pg] |
Benchmark Period Mean (complement) [Pg] |
Bias [kg m-2] |
Bias Score [1] |
Spatial Distribution Score [1] |
Overall Score [1] |
|||
|---|---|---|---|---|---|---|---|---|---|---|---|---|
| Benchmark | [-] | 7.28 | ||||||||||
| CESM3_092H | [-] | 11.9 | 11.6 | 7.28 | 0.219 | 0.00117 | 1.98 | 0.432 | 0.550 | 0.491 | ||
| CMIP6_001 | [-] | 7.17 | 7.07 | 7.15 | 0.125 | 0.128 | 0.452 | 0.570 | 0.653 | 0.612 | ||
| LE2_001 | [-] | 7.12 | 7.02 | 7.15 | 0.125 | 0.128 | 0.439 | 0.571 | 0.655 | 0.613 |
Temporally integrated period mean