Mean State
Download Data |
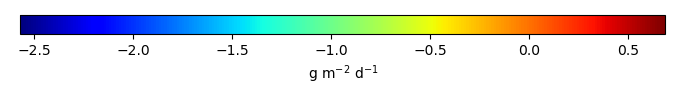
Period Mean (original grids) [g m-2 d-1] |
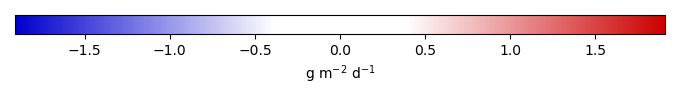
Bias [g m-2 d-1] |
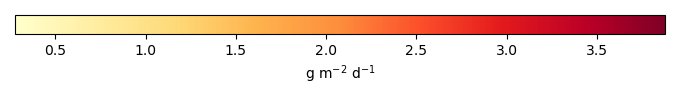
RMSE [g m-2 d-1] |
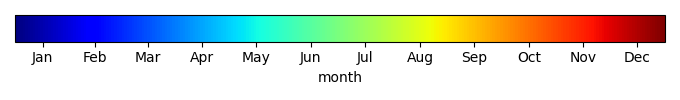
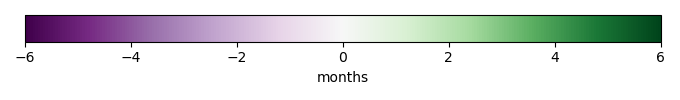
Phase Shift [months] |
Bias Score [1] |
RMSE Score [1] |
Seasonal Cycle Score [1] |
Overall Score [1] |
|||
|---|---|---|---|---|---|---|---|---|---|---|---|
| Benchmark | [-] | -1.08 | |||||||||
| CESM3_092H | [-] | -0.247 | 0.836 | 1.53 | 5.10 | 0.294 | 0.335 | 0.0631 | 0.257 | ||
| CMIP6_001 | [-] | -0.140 | 0.943 | 1.68 | 3.06 | 0.288 | 0.320 | 0.821 | 0.437 | ||
| LE2_001 | [-] | -0.146 | 0.937 | 1.61 | 3.06 | 0.290 | 0.361 | 0.821 | 0.458 |
Download Data |
Period Mean (original grids) [g m-2 d-1] |
Bias [g m-2 d-1] |
RMSE [g m-2 d-1] |
Phase Shift [months] |
Bias Score [1] |
RMSE Score [1] |
Seasonal Cycle Score [1] |
Overall Score [1] |
|||
|---|---|---|---|---|---|---|---|---|---|---|---|
| Benchmark | [-] | -1.20 | |||||||||
| CESM3_092H | [-] | -0.00787 | 1.19 | 2.60 | 5.03 | 0.591 | 0.362 | 0.0985 | 0.353 | ||
| CMIP6_001 | [-] | -0.00447 | 1.20 | 2.56 | 4.05 | 0.590 | 0.369 | 0.230 | 0.390 | ||
| LE2_001 | [-] | -0.0150 | 1.19 | 2.54 | 2.05 | 0.593 | 0.373 | 0.767 | 0.526 |
Download Data |
Period Mean (original grids) [g m-2 d-1] |
Bias [g m-2 d-1] |
RMSE [g m-2 d-1] |
Phase Shift [months] |
Bias Score [1] |
RMSE Score [1] |
Seasonal Cycle Score [1] |
Overall Score [1] |
|||
|---|---|---|---|---|---|---|---|---|---|---|---|
| Benchmark | [-] | 0.492 | |||||||||
| CESM3_092H | [-] | -0.0254 | -0.517 | 1.07 | 0.00 | 0.611 | 0.406 | 1.00 | 0.606 | ||
| CMIP6_001 | [-] | -0.0121 | -0.504 | 1.07 | 0.00 | 0.619 | 0.401 | 1.00 | 0.605 | ||
| LE2_001 | [-] | -0.0157 | -0.508 | 1.06 | 0.00 | 0.617 | 0.407 | 1.00 | 0.608 |
Download Data |
Period Mean (original grids) [g m-2 d-1] |
Bias [g m-2 d-1] |
RMSE [g m-2 d-1] |
Phase Shift [months] |
Bias Score [1] |
RMSE Score [1] |
Seasonal Cycle Score [1] |
Overall Score [1] |
|||
|---|---|---|---|---|---|---|---|---|---|---|---|
| Benchmark | [-] | -0.289 | |||||||||
| CESM3_092H | [-] | -0.0402 | 0.248 | 1.32 | 0.508 | 0.764 | 0.317 | 0.955 | 0.588 | ||
| CMIP6_001 | [-] | -0.0379 | 0.251 | 1.25 | 2.55 | 0.764 | 0.344 | 0.468 | 0.480 | ||
| LE2_001 | [-] | -0.0127 | 0.276 | 0.997 | 1.02 | 0.744 | 0.390 | 0.933 | 0.614 |
Download Data |
Period Mean (original grids) [g m-2 d-1] |
Bias [g m-2 d-1] |
RMSE [g m-2 d-1] |
Phase Shift [months] |
Bias Score [1] |
RMSE Score [1] |
Seasonal Cycle Score [1] |
Overall Score [1] |
|||
|---|---|---|---|---|---|---|---|---|---|---|---|
| Benchmark | [-] | -2.71 | |||||||||
| CESM3_092H | [-] | -0.487 | 2.22 | 2.42 | 5.10 | 0.0220 | 0.173 | 0.0631 | 0.108 | ||
| CMIP6_001 | [-] | -0.328 | 2.38 | 2.51 | 3.05 | 0.0168 | 0.145 | 0.498 | 0.201 | ||
| LE2_001 | [-] | -0.347 | 2.36 | 2.49 | 3.05 | 0.0173 | 0.159 | 0.498 | 0.208 |
Download Data |
Period Mean (original grids) [g m-2 d-1] |
Bias [g m-2 d-1] |
RMSE [g m-2 d-1] |
Phase Shift [months] |
Bias Score [1] |
RMSE Score [1] |
Seasonal Cycle Score [1] |
Overall Score [1] |
|||
|---|---|---|---|---|---|---|---|---|---|---|---|
| Benchmark | [-] | -0.0186 | |||||||||
| CESM3_092H | [-] | -0.201 | -0.181 | 1.05 | 1.52 | 2.80 | -0.813 | -1.09 | 0.0206 | ||
| CMIP6_001 | [-] | -0.106 | -0.0876 | 1.12 | 3.02 | 0.416 | -0.459 | -8.89 | -2.35 | ||
| LE2_001 | [-] | -0.0933 | -0.0748 | 1.09 | 3.02 | 0.182 | 0.332 | -8.89 | -2.01 |
Download Data |
Period Mean (original grids) [g m-2 d-1] |
Bias [g m-2 d-1] |
RMSE [g m-2 d-1] |
Phase Shift [months] |
Bias Score [1] |
RMSE Score [1] |
Seasonal Cycle Score [1] |
Overall Score [1] |
|||
|---|---|---|---|---|---|---|---|---|---|---|---|
| Benchmark | [-] | -0.507 | |||||||||
| CESM3_092H | [-] | -0.217 | 0.290 | 1.33 | 2.86 | 0.517 | 0.332 | 0.632 | 0.453 | ||
| CMIP6_001 | [-] | -0.181 | 0.326 | 1.40 | 3.11 | 0.495 | 0.343 | 0.586 | 0.442 | ||
| LE2_001 | [-] | -0.195 | 0.312 | 1.40 | 3.20 | 0.497 | 0.341 | 0.524 | 0.426 |
Download Data |
Period Mean (original grids) [g m-2 d-1] |
Bias [g m-2 d-1] |
RMSE [g m-2 d-1] |
Phase Shift [months] |
Bias Score [1] |
RMSE Score [1] |
Seasonal Cycle Score [1] |
Overall Score [1] |
|||
|---|---|---|---|---|---|---|---|---|---|---|---|
| Benchmark | [-] | -0.917 | |||||||||
| CESM3_092H | [-] | -0.147 | 0.777 | 1.61 | 2.39 | 0.304 | 0.334 | 0.720 | 0.423 | ||
| CMIP6_001 | [-] | -0.0640 | 0.811 | 1.62 | 2.48 | 0.296 | 0.347 | 0.737 | 0.432 | ||
| LE2_001 | [-] | -0.0563 | 0.819 | 1.71 | 2.57 | 0.294 | 0.314 | 0.735 | 0.414 |
Download Data |
Period Mean (original grids) [g m-2 d-1] |
Bias [g m-2 d-1] |
RMSE [g m-2 d-1] |
Phase Shift [months] |
Bias Score [1] |
RMSE Score [1] |
Seasonal Cycle Score [1] |
Overall Score [1] |
|||
|---|---|---|---|---|---|---|---|---|---|---|---|
| Benchmark | [-] | -0.820 | |||||||||
| CESM3_092H | [-] | -0.360 | 0.474 | 2.00 | 1.33 | 0.605 | 0.455 | 0.903 | 0.605 | ||
| CMIP6_001 | [-] | -0.269 | 0.552 | 1.97 | 1.48 | 0.577 | 0.463 | 0.880 | 0.596 | ||
| LE2_001 | [-] | -0.267 | 0.553 | 1.97 | 1.34 | 0.578 | 0.462 | 0.910 | 0.603 |
Download Data |
Period Mean (original grids) [g m-2 d-1] |
Bias [g m-2 d-1] |
RMSE [g m-2 d-1] |
Phase Shift [months] |
Bias Score [1] |
RMSE Score [1] |
Seasonal Cycle Score [1] |
Overall Score [1] |
|||
|---|---|---|---|---|---|---|---|---|---|---|---|
| Benchmark | [-] | -0.666 | |||||||||
| CESM3_092H | [-] | -0.243 | 0.432 | 1.76 | 1.81 | 0.494 | 0.412 | 0.763 | 0.520 | ||
| CMIP6_001 | [-] | -0.170 | 0.491 | 1.71 | 2.03 | 0.471 | 0.419 | 0.779 | 0.522 | ||
| LE2_001 | [-] | -0.172 | 0.489 | 1.71 | 1.95 | 0.472 | 0.414 | 0.805 | 0.526 |
Download Data |
Period Mean (original grids) [g m-2 d-1] |
Bias [g m-2 d-1] |
RMSE [g m-2 d-1] |
Phase Shift [months] |
Bias Score [1] |
RMSE Score [1] |
Seasonal Cycle Score [1] |
Overall Score [1] |
|||
|---|---|---|---|---|---|---|---|---|---|---|---|
| Benchmark | [-] | -0.102 | |||||||||
| CESM3_092H | [-] | 0.0308 | 0.134 | 1.29 | 0.678 | 0.764 | 0.117 | 0.832 | 0.458 | ||
| CMIP6_001 | [-] | -0.0236 | 0.0779 | 0.754 | 1.36 | 0.838 | 0.265 | 0.883 | 0.562 | ||
| LE2_001 | [-] | -0.0377 | 0.0638 | 0.755 | 1.70 | 0.870 | 0.280 | 0.870 | 0.575 |
Download Data |
Period Mean (original grids) [g m-2 d-1] |
Bias [g m-2 d-1] |
RMSE [g m-2 d-1] |
Phase Shift [months] |
Bias Score [1] |
RMSE Score [1] |
Seasonal Cycle Score [1] |
Overall Score [1] |
|||
|---|---|---|---|---|---|---|---|---|---|---|---|
| Benchmark | [-] | -0.384 | |||||||||
| CESM3_092H | [-] | -0.223 | 0.161 | 2.01 | 1.52 | 0.305 | 0.361 | 1.14 | 0.542 | ||
| CMIP6_001 | [-] | -0.134 | 0.250 | 1.91 | 1.52 | 0.222 | 0.335 | 1.14 | 0.508 | ||
| LE2_001 | [-] | -0.127 | 0.258 | 1.96 | 1.52 | 0.215 | 0.350 | 1.14 | 0.514 |
Download Data |
Period Mean (original grids) [g m-2 d-1] |
Bias [g m-2 d-1] |
RMSE [g m-2 d-1] |
Phase Shift [months] |
Bias Score [1] |
RMSE Score [1] |
Seasonal Cycle Score [1] |
Overall Score [1] |
|||
|---|---|---|---|---|---|---|---|---|---|---|---|
| Benchmark | [-] | -0.800 | |||||||||
| CESM3_092H | [-] | -0.264 | 0.539 | 1.93 | 1.80 | 0.475 | 0.453 | 0.866 | 0.562 | ||
| CMIP6_001 | [-] | -0.198 | 0.602 | 1.90 | 2.10 | 0.458 | 0.454 | 0.725 | 0.523 | ||
| LE2_001 | [-] | -0.207 | 0.592 | 1.90 | 2.10 | 0.461 | 0.446 | 0.729 | 0.520 |
Download Data |
Period Mean (original grids) [g m-2 d-1] |
Bias [g m-2 d-1] |
RMSE [g m-2 d-1] |
Phase Shift [months] |
Bias Score [1] |
RMSE Score [1] |
Seasonal Cycle Score [1] |
Overall Score [1] |
|||
|---|---|---|---|---|---|---|---|---|---|---|---|
| Benchmark | [-] | -0.155 | |||||||||
| CESM3_092H | [-] | -0.116 | 0.0386 | 1.21 | 0.942 | 0.780 | 0.381 | 0.650 | 0.548 | ||
| CMIP6_001 | [-] | -0.113 | 0.0412 | 0.885 | 1.35 | 0.781 | 0.473 | 0.518 | 0.561 | ||
| LE2_001 | [-] | -0.105 | 0.0492 | 0.891 | 1.35 | 0.776 | 0.468 | 0.518 | 0.557 |
Download Data |
Period Mean (original grids) [g m-2 d-1] |
Bias [g m-2 d-1] |
RMSE [g m-2 d-1] |
Phase Shift [months] |
Bias Score [1] |
RMSE Score [1] |
Seasonal Cycle Score [1] |
Overall Score [1] |
|||
|---|---|---|---|---|---|---|---|---|---|---|---|
| Benchmark | [-] | -0.370 | |||||||||
| CESM3_092H | [-] | -0.207 | 0.181 | 1.60 | 2.10 | 0.581 | 0.413 | 0.769 | 0.544 | ||
| CMIP6_001 | [-] | -0.0890 | 0.281 | 1.54 | 2.60 | 0.505 | 0.399 | 0.732 | 0.509 | ||
| LE2_001 | [-] | -0.0929 | 0.277 | 1.54 | 2.53 | 0.508 | 0.401 | 0.906 | 0.554 |
Download Data |
Period Mean (original grids) [g m-2 d-1] |
Bias [g m-2 d-1] |
RMSE [g m-2 d-1] |
Phase Shift [months] |
Bias Score [1] |
RMSE Score [1] |
Seasonal Cycle Score [1] |
Overall Score [1] |
|||
|---|---|---|---|---|---|---|---|---|---|---|---|
| Benchmark | [-] | -0.355 | |||||||||
| CESM3_092H | [-] | -0.112 | 0.243 | 1.45 | 3.74 | 0.723 | 0.255 | 0.349 | 0.396 | ||
| CMIP6_001 | [-] | -0.156 | 0.198 | 1.10 | 2.73 | 0.758 | 0.345 | 0.597 | 0.512 | ||
| LE2_001 | [-] | -0.168 | 0.187 | 1.13 | 3.07 | 0.761 | 0.333 | 0.494 | 0.480 |
Download Data |
Period Mean (original grids) [g m-2 d-1] |
Bias [g m-2 d-1] |
RMSE [g m-2 d-1] |
Phase Shift [months] |
Bias Score [1] |
RMSE Score [1] |
Seasonal Cycle Score [1] |
Overall Score [1] |
|||
|---|---|---|---|---|---|---|---|---|---|---|---|
| Benchmark | [-] | 2.00 | |||||||||
| CESM3_092H | [-] | -0.153 | -2.15 | 3.90 | 0.00 | 0.524 | 0.390 | 1.00 | 0.576 | ||
| CMIP6_001 | [-] | 0.0616 | -1.93 | 4.21 | 3.07 | 0.559 | 0.311 | 0.494 | 0.419 | ||
| LE2_001 | [-] | -0.0510 | -2.05 | 4.08 | 0.00 | 0.540 | 0.352 | 1.00 | 0.561 |
Download Data |
Period Mean (original grids) [g m-2 d-1] |
Bias [g m-2 d-1] |
RMSE [g m-2 d-1] |
Phase Shift [months] |
Bias Score [1] |
RMSE Score [1] |
Seasonal Cycle Score [1] |
Overall Score [1] |
|||
|---|---|---|---|---|---|---|---|---|---|---|---|
| Benchmark | [-] | -4.76 | |||||||||
| CESM3_092H | [-] | -0.0484 | 4.71 | 4.82 | 5.02 | 0.0421 | 0.397 | 0.0740 | 0.227 | ||
| CMIP6_001 | [-] | -0.0235 | 4.73 | 5.02 | 0.00 | 0.0414 | 0.350 | 1.00 | 0.435 | ||
| LE2_001 | [-] | -0.0431 | 4.71 | 4.99 | 0.00 | 0.0420 | 0.367 | 1.00 | 0.444 |
Temporally integrated period mean