Mean State
Download Data |
Period Mean (original grids) [Pg yr-1] |
Model Period Mean (intersection) [Pg yr-1] |
Benchmark Period Mean (intersection) [Pg yr-1] |
Model Period Mean (complement) [Pg yr-1] |
Benchmark Period Mean (complement) [Pg yr-1] |
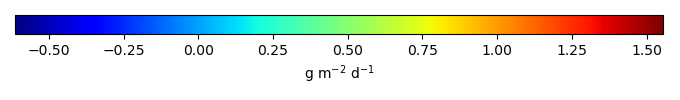
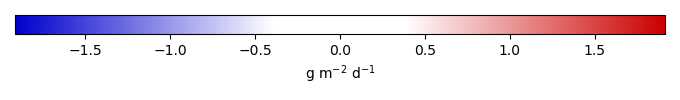
Bias [g m-2 d-1] |
RMSE [g m-2 d-1] |
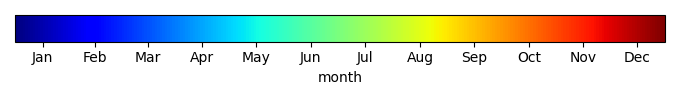
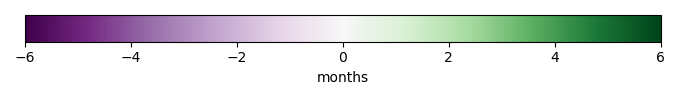
Phase Shift [months] |
Bias Score [1] |
RMSE Score [1] |
Seasonal Cycle Score [1] |
Spatial Distribution Score [1] |
Overall Score [1] |
|||
|---|---|---|---|---|---|---|---|---|---|---|---|---|---|---|---|---|
| Benchmark | [-] | 1.30 | ||||||||||||||
| CESM3_092H | [-] | -0.289 | -0.293 | 1.30 | -0.00713 | -1.01 | 1.31 | 3.07 | 0.0766 | 0.253 | 0.493 | 0.00631 | 0.216 | |||
| CMIP6_001 | [-] | -0.197 | -0.199 | 1.30 | -0.00328 | 0.000524 | -0.950 | 1.25 | 3.15 | 0.0795 | 0.248 | 0.483 | 0.00411 | 0.212 | ||
| LE2_001 | [-] | -0.199 | -0.201 | 1.30 | -0.00321 | 0.000524 | -0.950 | 1.25 | 3.19 | 0.0802 | 0.250 | 0.469 | 0.00522 | 0.211 |
Download Data |
Period Mean (original grids) [Pg yr-1] |
Model Period Mean (intersection) [Pg yr-1] |
Benchmark Period Mean (intersection) [Pg yr-1] |
Model Period Mean (complement) [Pg yr-1] |
Benchmark Period Mean (complement) [Pg yr-1] |
Bias [g m-2 d-1] |
RMSE [g m-2 d-1] |
Phase Shift [months] |
Bias Score [1] |
RMSE Score [1] |
Seasonal Cycle Score [1] |
Spatial Distribution Score [1] |
Overall Score [1] |
|||
|---|---|---|---|---|---|---|---|---|---|---|---|---|---|---|---|---|
| Benchmark | [-] | 0.184 | ||||||||||||||
| CESM3_092H | [-] | -0.160 | -0.148 | 0.184 | -0.000508 | -0.135 | 0.958 | 4.10 | 0.380 | 0.291 | 0.308 | 0.0239 | 0.259 | |||
| CMIP6_001 | [-] | -0.106 | -0.0990 | 0.184 | -0.000242 | 0.000637 | -0.113 | 0.949 | 4.36 | 0.388 | 0.300 | 0.246 | 0.00991 | 0.249 | ||
| LE2_001 | [-] | -0.105 | -0.0990 | 0.184 | -0.000155 | 0.000637 | -0.113 | 0.950 | 4.35 | 0.387 | 0.297 | 0.249 | 0.0110 | 0.248 |
Download Data |
Period Mean (original grids) [Pg yr-1] |
Model Period Mean (intersection) [Pg yr-1] |
Benchmark Period Mean (intersection) [Pg yr-1] |
Model Period Mean (complement) [Pg yr-1] |
Benchmark Period Mean (complement) [Pg yr-1] |
Bias [g m-2 d-1] |
RMSE [g m-2 d-1] |
Phase Shift [months] |
Bias Score [1] |
RMSE Score [1] |
Seasonal Cycle Score [1] |
Spatial Distribution Score [1] |
Overall Score [1] |
|||
|---|---|---|---|---|---|---|---|---|---|---|---|---|---|---|---|---|
| Benchmark | [-] | 2.55 | ||||||||||||||
| CESM3_092H | [-] | -0.166 | -0.159 | 2.55 | -0.00682 | 0.000151 | -0.822 | 1.16 | 3.07 | 0.267 | 0.309 | 0.482 | 0.0135 | 0.276 | ||
| CMIP6_001 | [-] | -0.118 | -0.114 | 2.55 | -0.00441 | 0.00428 | -0.811 | 1.17 | 3.05 | 0.274 | 0.293 | 0.491 | 0.00710 | 0.272 | ||
| LE2_001 | [-] | -0.153 | -0.149 | 2.55 | -0.00460 | 0.00428 | -0.822 | 1.17 | 3.09 | 0.268 | 0.296 | 0.487 | 0.00777 | 0.271 |
Download Data |
Period Mean (original grids) [Pg yr-1] |
Model Period Mean (intersection) [Pg yr-1] |
Benchmark Period Mean (intersection) [Pg yr-1] |
Model Period Mean (complement) [Pg yr-1] |
Benchmark Period Mean (complement) [Pg yr-1] |
Bias [g m-2 d-1] |
RMSE [g m-2 d-1] |
Phase Shift [months] |
Bias Score [1] |
RMSE Score [1] |
Seasonal Cycle Score [1] |
Spatial Distribution Score [1] |
Overall Score [1] |
|||
|---|---|---|---|---|---|---|---|---|---|---|---|---|---|---|---|---|
| Benchmark | [-] | 0.0114 | ||||||||||||||
| CESM3_092H | [-] | 0.00599 | 0.00776 | 0.0114 | -0.00167 | -0.00675 | 1.89 | 2.27 | 0.709 | 0.0147 | 0.692 | 0.310 | 0.348 | |||
| CMIP6_001 | [-] | -0.0146 | -0.0145 | 0.0112 | -0.000178 | 0.000146 | -0.0226 | 0.740 | 2.40 | 0.719 | 0.178 | 0.654 | 0.0189 | 0.350 | ||
| LE2_001 | [-] | 0.000647 | 0.000581 | 0.0112 | -2.16e-05 | 0.000146 | -0.00956 | 0.701 | 2.33 | 0.718 | 0.187 | 0.672 | 0.0283 | 0.358 |
Download Data |
Period Mean (original grids) [Pg yr-1] |
Model Period Mean (intersection) [Pg yr-1] |
Benchmark Period Mean (intersection) [Pg yr-1] |
Model Period Mean (complement) [Pg yr-1] |
Benchmark Period Mean (complement) [Pg yr-1] |
Bias [g m-2 d-1] |
RMSE [g m-2 d-1] |
Phase Shift [months] |
Bias Score [1] |
RMSE Score [1] |
Seasonal Cycle Score [1] |
Spatial Distribution Score [1] |
Overall Score [1] |
|||
|---|---|---|---|---|---|---|---|---|---|---|---|---|---|---|---|---|
| Benchmark | [-] | 1.09 | ||||||||||||||
| CESM3_092H | [-] | -0.273 | -0.228 | 1.09 | -0.0436 | 0.00139 | -1.28 | 1.35 | 3.16 | 0.00627 | 0.175 | 0.473 | 0.00589 | 0.167 | ||
| CMIP6_001 | [-] | -0.178 | -0.156 | 1.06 | -0.0212 | 0.0305 | -1.22 | 1.30 | 3.05 | 0.0122 | 0.170 | 0.490 | 0.0118 | 0.171 | ||
| LE2_001 | [-] | -0.160 | -0.143 | 1.06 | -0.0178 | 0.0305 | -1.20 | 1.28 | 2.91 | 0.0128 | 0.170 | 0.517 | 0.0144 | 0.177 |
Download Data |
Period Mean (original grids) [Pg yr-1] |
Model Period Mean (intersection) [Pg yr-1] |
Benchmark Period Mean (intersection) [Pg yr-1] |
Model Period Mean (complement) [Pg yr-1] |
Benchmark Period Mean (complement) [Pg yr-1] |
Bias [g m-2 d-1] |
RMSE [g m-2 d-1] |
Phase Shift [months] |
Bias Score [1] |
RMSE Score [1] |
Seasonal Cycle Score [1] |
Spatial Distribution Score [1] |
Overall Score [1] |
|||
|---|---|---|---|---|---|---|---|---|---|---|---|---|---|---|---|---|
| Benchmark | [-] | 0.881 | ||||||||||||||
| CESM3_092H | [-] | -0.339 | -0.322 | 0.881 | -0.00326 | 2.77e-07 | -0.371 | 2.13 | 3.75 | 0.654 | 0.0859 | 0.336 | 0.0546 | 0.243 | ||
| CMIP6_001 | [-] | -0.303 | -0.294 | 0.880 | -0.00197 | 0.000520 | -0.361 | 1.60 | 3.26 | 0.660 | 0.142 | 0.444 | 0.0271 | 0.283 | ||
| LE2_001 | [-] | -0.290 | -0.280 | 0.880 | -0.00193 | 0.000520 | -0.357 | 1.62 | 3.28 | 0.662 | 0.139 | 0.438 | 0.0293 | 0.281 |
Download Data |
Period Mean (original grids) [Pg yr-1] |
Model Period Mean (intersection) [Pg yr-1] |
Benchmark Period Mean (intersection) [Pg yr-1] |
Model Period Mean (complement) [Pg yr-1] |
Benchmark Period Mean (complement) [Pg yr-1] |
Bias [g m-2 d-1] |
RMSE [g m-2 d-1] |
Phase Shift [months] |
Bias Score [1] |
RMSE Score [1] |
Seasonal Cycle Score [1] |
Spatial Distribution Score [1] |
Overall Score [1] |
|||
|---|---|---|---|---|---|---|---|---|---|---|---|---|---|---|---|---|
| Benchmark | [-] | 1.44 | ||||||||||||||
| CESM3_092H | [-] | -0.947 | -0.927 | 1.44 | -0.0307 | -0.373 | 1.25 | 3.42 | 0.411 | 0.143 | 0.425 | 0.0599 | 0.237 | |||
| CMIP6_001 | [-] | -0.548 | -0.537 | 1.44 | -0.0159 | 0.00193 | -0.308 | 1.18 | 3.40 | 0.434 | 0.153 | 0.432 | 0.0381 | 0.242 | ||
| LE2_001 | [-] | -0.572 | -0.560 | 1.44 | -0.0164 | 0.00193 | -0.311 | 1.19 | 3.40 | 0.434 | 0.152 | 0.433 | 0.0383 | 0.242 |
Download Data |
Period Mean (original grids) [Pg yr-1] |
Model Period Mean (intersection) [Pg yr-1] |
Benchmark Period Mean (intersection) [Pg yr-1] |
Model Period Mean (complement) [Pg yr-1] |
Benchmark Period Mean (complement) [Pg yr-1] |
Bias [g m-2 d-1] |
RMSE [g m-2 d-1] |
Phase Shift [months] |
Bias Score [1] |
RMSE Score [1] |
Seasonal Cycle Score [1] |
Spatial Distribution Score [1] |
Overall Score [1] |
|||
|---|---|---|---|---|---|---|---|---|---|---|---|---|---|---|---|---|
| Benchmark | [-] | 1.10 | ||||||||||||||
| CESM3_092H | [-] | -0.515 | -0.487 | 1.10 | -0.0264 | 0.000333 | -0.656 | 1.05 | 2.62 | 0.266 | 0.304 | 0.590 | 0.0341 | 0.300 | ||
| CMIP6_001 | [-] | -0.295 | -0.280 | 1.09 | -0.0142 | 0.00674 | -0.563 | 0.992 | 2.60 | 0.291 | 0.298 | 0.596 | 0.0293 | 0.302 | ||
| LE2_001 | [-] | -0.297 | -0.281 | 1.09 | -0.0146 | 0.00674 | -0.564 | 0.999 | 2.55 | 0.291 | 0.296 | 0.605 | 0.0303 | 0.304 |
Download Data |
Period Mean (original grids) [Pg yr-1] |
Model Period Mean (intersection) [Pg yr-1] |
Benchmark Period Mean (intersection) [Pg yr-1] |
Model Period Mean (complement) [Pg yr-1] |
Benchmark Period Mean (complement) [Pg yr-1] |
Bias [g m-2 d-1] |
RMSE [g m-2 d-1] |
Phase Shift [months] |
Bias Score [1] |
RMSE Score [1] |
Seasonal Cycle Score [1] |
Spatial Distribution Score [1] |
Overall Score [1] |
|||
|---|---|---|---|---|---|---|---|---|---|---|---|---|---|---|---|---|
| Benchmark | [-] | -0.0283 | ||||||||||||||
| CESM3_092H | [-] | 0.0104 | 0.00928 | -0.0283 | -0.000207 | -1.04e-07 | 0.0264 | 2.12 | 2.28 | 0.676 | 0.0103 | 0.690 | 0.301 | 0.337 | ||
| CMIP6_001 | [-] | -0.00429 | -0.00463 | -0.0281 | -7.34e-05 | -0.000156 | 0.0162 | 0.635 | 2.42 | 0.697 | 0.266 | 0.647 | 0.0213 | 0.379 | ||
| LE2_001 | [-] | 0.00567 | 0.00470 | -0.0281 | -0.000108 | -0.000156 | 0.0232 | 0.643 | 2.48 | 0.691 | 0.259 | 0.632 | 0.0583 | 0.380 |
Download Data |
Period Mean (original grids) [Pg yr-1] |
Model Period Mean (intersection) [Pg yr-1] |
Benchmark Period Mean (intersection) [Pg yr-1] |
Model Period Mean (complement) [Pg yr-1] |
Benchmark Period Mean (complement) [Pg yr-1] |
Bias [g m-2 d-1] |
RMSE [g m-2 d-1] |
Phase Shift [months] |
Bias Score [1] |
RMSE Score [1] |
Seasonal Cycle Score [1] |
Spatial Distribution Score [1] |
Overall Score [1] |
|||
|---|---|---|---|---|---|---|---|---|---|---|---|---|---|---|---|---|
| Benchmark | [-] | -0.545 | ||||||||||||||
| CESM3_092H | [-] | -0.142 | -0.124 | -0.545 | -0.0179 | 0.000398 | 0.135 | 0.709 | 3.96 | 0.223 | 0.254 | 0.319 | 0.0380 | 0.218 | ||
| CMIP6_001 | [-] | -0.0758 | -0.0671 | -0.550 | -0.00789 | 0.00575 | 0.162 | 0.693 | 3.80 | 0.235 | 0.249 | 0.352 | 0.0102 | 0.219 | ||
| LE2_001 | [-] | -0.0653 | -0.0564 | -0.550 | -0.00813 | 0.00575 | 0.166 | 0.700 | 3.67 | 0.234 | 0.258 | 0.368 | 0.0108 | 0.226 |
Download Data |
Period Mean (original grids) [Pg yr-1] |
Model Period Mean (intersection) [Pg yr-1] |
Benchmark Period Mean (intersection) [Pg yr-1] |
Model Period Mean (complement) [Pg yr-1] |
Benchmark Period Mean (complement) [Pg yr-1] |
Bias [g m-2 d-1] |
RMSE [g m-2 d-1] |
Phase Shift [months] |
Bias Score [1] |
RMSE Score [1] |
Seasonal Cycle Score [1] |
Spatial Distribution Score [1] |
Overall Score [1] |
|||
|---|---|---|---|---|---|---|---|---|---|---|---|---|---|---|---|---|
| Benchmark | [-] | 1.00 | ||||||||||||||
| CESM3_092H | [-] | -0.562 | -0.536 | 1.00 | -0.0258 | 0.000537 | -0.801 | 2.59 | 5.15 | 0.470 | 0.0972 | 0.105 | 0.0397 | 0.162 | ||
| CMIP6_001 | [-] | -0.380 | -0.366 | 0.994 | -0.0105 | 0.00608 | -0.708 | 2.48 | 5.01 | 0.521 | 0.105 | 0.116 | 0.0393 | 0.177 | ||
| LE2_001 | [-] | -0.369 | -0.356 | 0.994 | -0.00986 | 0.00608 | -0.701 | 2.48 | 5.14 | 0.526 | 0.105 | 0.102 | 0.0355 | 0.175 |
Download Data |
Period Mean (original grids) [Pg yr-1] |
Model Period Mean (intersection) [Pg yr-1] |
Benchmark Period Mean (intersection) [Pg yr-1] |
Model Period Mean (complement) [Pg yr-1] |
Benchmark Period Mean (complement) [Pg yr-1] |
Bias [g m-2 d-1] |
RMSE [g m-2 d-1] |
Phase Shift [months] |
Bias Score [1] |
RMSE Score [1] |
Seasonal Cycle Score [1] |
Spatial Distribution Score [1] |
Overall Score [1] |
|||
|---|---|---|---|---|---|---|---|---|---|---|---|---|---|---|---|---|
| Benchmark | [-] | 17.0 | ||||||||||||||
| CESM3_092H | [-] | -5.09 | -4.86 | 17.0 | -0.225 | 0.00422 | -0.482 | 1.37 | 3.47 | 0.355 | 0.178 | 0.417 | 0.0476 | 0.235 | ||
| CMIP6_001 | [-] | -3.66 | -3.54 | 17.0 | -0.114 | 0.0708 | -0.451 | 1.18 | 3.41 | 0.368 | 0.207 | 0.428 | 0.0233 | 0.246 | ||
| LE2_001 | [-] | -3.68 | -3.56 | 17.0 | -0.112 | 0.0708 | -0.451 | 1.18 | 3.41 | 0.367 | 0.206 | 0.427 | 0.0237 | 0.246 |
Download Data |
Period Mean (original grids) [Pg yr-1] |
Model Period Mean (intersection) [Pg yr-1] |
Benchmark Period Mean (intersection) [Pg yr-1] |
Model Period Mean (complement) [Pg yr-1] |
Benchmark Period Mean (complement) [Pg yr-1] |
Bias [g m-2 d-1] |
RMSE [g m-2 d-1] |
Phase Shift [months] |
Bias Score [1] |
RMSE Score [1] |
Seasonal Cycle Score [1] |
Spatial Distribution Score [1] |
Overall Score [1] |
|||
|---|---|---|---|---|---|---|---|---|---|---|---|---|---|---|---|---|
| Benchmark | [-] | -0.413 | ||||||||||||||
| CESM3_092H | [-] | -0.161 | -0.153 | -0.413 | -0.0107 | 3.52e-05 | 0.0775 | 0.455 | 4.30 | 0.279 | 0.137 | 0.254 | 0.206 | 0.202 | ||
| CMIP6_001 | [-] | -0.0824 | -0.0792 | -0.410 | -0.00420 | -0.00286 | 0.107 | 0.427 | 3.49 | 0.279 | 0.169 | 0.411 | 0.0643 | 0.218 | ||
| LE2_001 | [-] | -0.0836 | -0.0807 | -0.410 | -0.00414 | -0.00286 | 0.106 | 0.436 | 3.64 | 0.281 | 0.165 | 0.382 | 0.0653 | 0.211 |
Download Data |
Period Mean (original grids) [Pg yr-1] |
Model Period Mean (intersection) [Pg yr-1] |
Benchmark Period Mean (intersection) [Pg yr-1] |
Model Period Mean (complement) [Pg yr-1] |
Benchmark Period Mean (complement) [Pg yr-1] |
Bias [g m-2 d-1] |
RMSE [g m-2 d-1] |
Phase Shift [months] |
Bias Score [1] |
RMSE Score [1] |
Seasonal Cycle Score [1] |
Spatial Distribution Score [1] |
Overall Score [1] |
|||
|---|---|---|---|---|---|---|---|---|---|---|---|---|---|---|---|---|
| Benchmark | [-] | -0.223 | ||||||||||||||
| CESM3_092H | [-] | 0.00761 | 0.00982 | -0.223 | -0.00142 | 0.0961 | 1.37 | 2.99 | 0.474 | 0.0721 | 0.526 | 0.375 | 0.304 | |||
| CMIP6_001 | [-] | -0.0250 | -0.0247 | -0.223 | -0.000456 | -0.000381 | 0.0832 | 0.607 | 3.05 | 0.477 | 0.232 | 0.508 | 0.0219 | 0.294 | ||
| LE2_001 | [-] | -0.0246 | -0.0244 | -0.223 | -0.000267 | -0.000381 | 0.0833 | 0.626 | 3.14 | 0.474 | 0.227 | 0.489 | 0.0255 | 0.289 |
Download Data |
Period Mean (original grids) [Pg yr-1] |
Model Period Mean (intersection) [Pg yr-1] |
Benchmark Period Mean (intersection) [Pg yr-1] |
Model Period Mean (complement) [Pg yr-1] |
Benchmark Period Mean (complement) [Pg yr-1] |
Bias [g m-2 d-1] |
RMSE [g m-2 d-1] |
Phase Shift [months] |
Bias Score [1] |
RMSE Score [1] |
Seasonal Cycle Score [1] |
Spatial Distribution Score [1] |
Overall Score [1] |
|||
|---|---|---|---|---|---|---|---|---|---|---|---|---|---|---|---|---|
| Benchmark | [-] | 0.603 | ||||||||||||||
| CESM3_092H | [-] | -0.132 | -0.115 | 0.602 | -0.0146 | 0.00122 | -0.705 | 1.01 | 2.82 | 0.189 | 0.255 | 0.546 | 0.0168 | 0.253 | ||
| CMIP6_001 | [-] | -0.104 | -0.0917 | 0.600 | -0.0104 | 0.00308 | -0.684 | 0.994 | 2.64 | 0.198 | 0.273 | 0.580 | 0.0202 | 0.269 | ||
| LE2_001 | [-] | -0.112 | -0.0994 | 0.600 | -0.0107 | 0.00308 | -0.692 | 1.00 | 2.66 | 0.198 | 0.265 | 0.574 | 0.0186 | 0.264 |
Download Data |
Period Mean (original grids) [Pg yr-1] |
Model Period Mean (intersection) [Pg yr-1] |
Benchmark Period Mean (intersection) [Pg yr-1] |
Model Period Mean (complement) [Pg yr-1] |
Benchmark Period Mean (complement) [Pg yr-1] |
Bias [g m-2 d-1] |
RMSE [g m-2 d-1] |
Phase Shift [months] |
Bias Score [1] |
RMSE Score [1] |
Seasonal Cycle Score [1] |
Spatial Distribution Score [1] |
Overall Score [1] |
|||
|---|---|---|---|---|---|---|---|---|---|---|---|---|---|---|---|---|
| Benchmark | [-] | 1.18 | ||||||||||||||
| CESM3_092H | [-] | -0.464 | -0.443 | 1.18 | -0.0107 | 1.12e-06 | -1.13 | 2.51 | 4.47 | 0.407 | 0.179 | 0.230 | 0.0180 | 0.203 | ||
| CMIP6_001 | [-] | -0.337 | -0.325 | 1.18 | -0.00593 | 0.000875 | -1.04 | 2.60 | 4.25 | 0.436 | 0.168 | 0.269 | 0.0288 | 0.214 | ||
| LE2_001 | [-] | -0.343 | -0.331 | 1.18 | -0.00603 | 0.000875 | -1.05 | 2.61 | 4.17 | 0.434 | 0.167 | 0.283 | 0.0288 | 0.216 |
Download Data |
Period Mean (original grids) [Pg yr-1] |
Model Period Mean (intersection) [Pg yr-1] |
Benchmark Period Mean (intersection) [Pg yr-1] |
Model Period Mean (complement) [Pg yr-1] |
Benchmark Period Mean (complement) [Pg yr-1] |
Bias [g m-2 d-1] |
RMSE [g m-2 d-1] |
Phase Shift [months] |
Bias Score [1] |
RMSE Score [1] |
Seasonal Cycle Score [1] |
Spatial Distribution Score [1] |
Overall Score [1] |
|||
|---|---|---|---|---|---|---|---|---|---|---|---|---|---|---|---|---|
| Benchmark | [-] | 0.411 | ||||||||||||||
| CESM3_092H | [-] | -0.205 | -0.204 | 0.411 | -0.00384 | -0.323 | 1.87 | 4.48 | 0.641 | 0.0592 | 0.191 | 0.130 | 0.216 | |||
| CMIP6_001 | [-] | -0.168 | -0.167 | 0.406 | -0.00191 | 0.00483 | -0.302 | 1.42 | 4.47 | 0.667 | 0.117 | 0.195 | 0.0442 | 0.228 | ||
| LE2_001 | [-] | -0.192 | -0.190 | 0.406 | -0.00201 | 0.00483 | -0.314 | 1.42 | 4.43 | 0.654 | 0.117 | 0.204 | 0.0479 | 0.228 |
Download Data |
Period Mean (original grids) [Pg yr-1] |
Model Period Mean (intersection) [Pg yr-1] |
Benchmark Period Mean (intersection) [Pg yr-1] |
Model Period Mean (complement) [Pg yr-1] |
Benchmark Period Mean (complement) [Pg yr-1] |
Bias [g m-2 d-1] |
RMSE [g m-2 d-1] |
Phase Shift [months] |
Bias Score [1] |
RMSE Score [1] |
Seasonal Cycle Score [1] |
Spatial Distribution Score [1] |
Overall Score [1] |
|||
|---|---|---|---|---|---|---|---|---|---|---|---|---|---|---|---|---|
| Benchmark | [-] | 0.179 | ||||||||||||||
| CESM3_092H | [-] | -0.152 | -0.158 | 0.179 | -0.00124 | -0.234 | 0.985 | 3.79 | 0.433 | 0.159 | 0.357 | 0.0475 | 0.231 | |||
| CMIP6_001 | [-] | -0.0781 | -0.0828 | 0.178 | -0.000532 | 0.00105 | -0.180 | 0.842 | 3.18 | 0.468 | 0.216 | 0.484 | 0.0304 | 0.283 | ||
| LE2_001 | [-] | -0.0797 | -0.0846 | 0.178 | -0.000554 | 0.00105 | -0.181 | 0.844 | 3.28 | 0.466 | 0.217 | 0.463 | 0.0315 | 0.279 |
Download Data |
Period Mean (original grids) [Pg yr-1] |
Model Period Mean (intersection) [Pg yr-1] |
Benchmark Period Mean (intersection) [Pg yr-1] |
Model Period Mean (complement) [Pg yr-1] |
Benchmark Period Mean (complement) [Pg yr-1] |
Bias [g m-2 d-1] |
RMSE [g m-2 d-1] |
Phase Shift [months] |
Bias Score [1] |
RMSE Score [1] |
Seasonal Cycle Score [1] |
Spatial Distribution Score [1] |
Overall Score [1] |
|||
|---|---|---|---|---|---|---|---|---|---|---|---|---|---|---|---|---|
| Benchmark | [-] | 3.99 | ||||||||||||||
| CESM3_092H | [-] | -0.466 | -0.464 | 3.99 | -0.00384 | -1.45 | 1.55 | 2.26 | 0.0188 | 0.230 | 0.653 | 0.0382 | 0.234 | |||
| CMIP6_001 | [-] | -0.465 | -0.461 | 3.99 | -0.00208 | 0.00401 | -1.45 | 1.56 | 2.53 | 0.0176 | 0.216 | 0.594 | 0.0314 | 0.215 | ||
| LE2_001 | [-] | -0.471 | -0.468 | 3.99 | -0.00230 | 0.00401 | -1.45 | 1.56 | 2.46 | 0.0172 | 0.213 | 0.609 | 0.0304 | 0.217 |
Download Data |
Period Mean (original grids) [Pg yr-1] |
Model Period Mean (intersection) [Pg yr-1] |
Benchmark Period Mean (intersection) [Pg yr-1] |
Model Period Mean (complement) [Pg yr-1] |
Benchmark Period Mean (complement) [Pg yr-1] |
Bias [g m-2 d-1] |
RMSE [g m-2 d-1] |
Phase Shift [months] |
Bias Score [1] |
RMSE Score [1] |
Seasonal Cycle Score [1] |
Spatial Distribution Score [1] |
Overall Score [1] |
|||
|---|---|---|---|---|---|---|---|---|---|---|---|---|---|---|---|---|
| Benchmark | [-] | 2.26 | ||||||||||||||
| CESM3_092H | [-] | -0.0846 | -0.0723 | 2.26 | -0.0108 | 0.000107 | -0.984 | 1.41 | 3.21 | 0.267 | 0.272 | 0.473 | 0.151 | 0.287 | ||
| CMIP6_001 | [-] | -0.142 | -0.138 | 2.26 | -0.00688 | 0.000612 | -1.01 | 1.49 | 3.71 | 0.255 | 0.246 | 0.360 | 0.0423 | 0.230 | ||
| LE2_001 | [-] | -0.123 | -0.117 | 2.26 | -0.00677 | 0.000612 | -1.00 | 1.48 | 3.71 | 0.258 | 0.247 | 0.361 | 0.0499 | 0.233 |
Download Data |
Period Mean (original grids) [Pg yr-1] |
Model Period Mean (intersection) [Pg yr-1] |
Benchmark Period Mean (intersection) [Pg yr-1] |
Model Period Mean (complement) [Pg yr-1] |
Benchmark Period Mean (complement) [Pg yr-1] |
Bias [g m-2 d-1] |
RMSE [g m-2 d-1] |
Phase Shift [months] |
Bias Score [1] |
RMSE Score [1] |
Seasonal Cycle Score [1] |
Spatial Distribution Score [1] |
Overall Score [1] |
|||
|---|---|---|---|---|---|---|---|---|---|---|---|---|---|---|---|---|
| Benchmark | [-] | 0.0847 | ||||||||||||||
| CESM3_092H | [-] | -0.0571 | -0.0518 | 0.0846 | -0.00345 | 4.52e-05 | -0.129 | 0.920 | 3.73 | 0.260 | 0.0932 | 0.359 | 0.0140 | 0.164 | ||
| CMIP6_001 | [-] | -0.0422 | -0.0396 | 0.0819 | -0.00175 | 0.00275 | -0.116 | 0.796 | 4.17 | 0.246 | 0.111 | 0.276 | 0.00783 | 0.150 | ||
| LE2_001 | [-] | -0.0440 | -0.0413 | 0.0819 | -0.00188 | 0.00275 | -0.118 | 0.801 | 4.01 | 0.246 | 0.108 | 0.304 | 0.00734 | 0.155 |
Temporally integrated period mean