Mean State
Download Data |
Period Mean (original grids) [K] |
Model Period Mean (intersection) [K] |
Benchmark Period Mean (intersection) [K] |
Model Period Mean (complement) [K] |
Benchmark Period Mean (complement) [K] |
Bias [K] |
RMSE [K] |
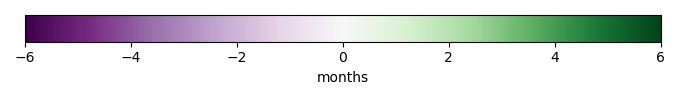
Phase Shift [months] |
Bias Score [1] |
RMSE Score [1] |
Seasonal Cycle Score [1] |
Spatial Distribution Score [1] |
Overall Score [1] |
|||
|---|---|---|---|---|---|---|---|---|---|---|---|---|---|---|---|---|
| Benchmark | [-] | 304. | ||||||||||||||
| CESM3_092H | [-] | 302. | 302. | 304. | 303. | 303. | -1.47 | 1.91 | 0.893 | 0.367 | 0.521 | 0.904 | 0.979 | 0.658 | ||
| CMIP6_001 | [-] | 303. | 303. | 304. | 303. | 304. | -0.758 | 1.49 | 1.06 | 0.538 | 0.517 | 0.863 | 0.976 | 0.683 | ||
| LE2_001 | [-] | 303. | 303. | 304. | 303. | 304. | -0.738 | 1.50 | 1.15 | 0.540 | 0.511 | 0.855 | 0.976 | 0.679 |
Download Data |
Period Mean (original grids) [K] |
Model Period Mean (intersection) [K] |
Benchmark Period Mean (intersection) [K] |
Model Period Mean (complement) [K] |
Benchmark Period Mean (complement) [K] |
Bias [K] |
RMSE [K] |
Phase Shift [months] |
Bias Score [1] |
RMSE Score [1] |
Seasonal Cycle Score [1] |
Spatial Distribution Score [1] |
Overall Score [1] |
|||
|---|---|---|---|---|---|---|---|---|---|---|---|---|---|---|---|---|
| Benchmark | [-] | 307. | ||||||||||||||
| CESM3_092H | [-] | 305. | 305. | 307. | 304. | 304. | -1.79 | 2.33 | 0.465 | 0.525 | 0.656 | 0.967 | 0.981 | 0.757 | ||
| CMIP6_001 | [-] | 306. | 306. | 307. | 305. | 306. | -0.836 | 1.94 | 0.441 | 0.681 | 0.612 | 0.966 | 0.999 | 0.774 | ||
| LE2_001 | [-] | 306. | 306. | 307. | 305. | 306. | -0.824 | 1.91 | 0.476 | 0.683 | 0.617 | 0.963 | 0.999 | 0.776 |
Download Data |
Period Mean (original grids) [K] |
Model Period Mean (intersection) [K] |
Benchmark Period Mean (intersection) [K] |
Model Period Mean (complement) [K] |
Benchmark Period Mean (complement) [K] |
Bias [K] |
RMSE [K] |
Phase Shift [months] |
Bias Score [1] |
RMSE Score [1] |
Seasonal Cycle Score [1] |
Spatial Distribution Score [1] |
Overall Score [1] |
|||
|---|---|---|---|---|---|---|---|---|---|---|---|---|---|---|---|---|
| Benchmark | [-] | 301. | ||||||||||||||
| CESM3_092H | [-] | 301. | 301. | 301. | 301. | 303. | -0.815 | 1.92 | 0.944 | 0.538 | 0.610 | 0.883 | 0.998 | 0.728 | ||
| CMIP6_001 | [-] | 300. | 300. | 301. | 301. | 302. | -0.907 | 2.23 | 0.968 | 0.493 | 0.591 | 0.883 | 0.998 | 0.711 | ||
| LE2_001 | [-] | 301. | 301. | 301. | 301. | 302. | -0.781 | 2.15 | 0.967 | 0.509 | 0.597 | 0.888 | 0.997 | 0.718 |
Download Data |
Period Mean (original grids) [K] |
Model Period Mean (intersection) [K] |
Benchmark Period Mean (intersection) [K] |
Model Period Mean (complement) [K] |
Benchmark Period Mean (complement) [K] |
Bias [K] |
RMSE [K] |
Phase Shift [months] |
Bias Score [1] |
RMSE Score [1] |
Seasonal Cycle Score [1] |
Spatial Distribution Score [1] |
Overall Score [1] |
|||
|---|---|---|---|---|---|---|---|---|---|---|---|---|---|---|---|---|
| Benchmark | [-] | 266. | ||||||||||||||
| CESM3_092H | [-] | 266. | 266. | 266. | 269. | 0.468 | 3.24 | 0.0702 | 0.919 | 0.849 | 0.995 | 0.998 | 0.922 | |||
| CMIP6_001 | [-] | 267. | 267. | 266. | 269. | 269. | 1.19 | 4.55 | 0.155 | 0.903 | 0.796 | 0.990 | 0.900 | 0.877 | ||
| LE2_001 | [-] | 267. | 267. | 266. | 269. | 269. | 1.25 | 4.64 | 0.237 | 0.899 | 0.795 | 0.984 | 0.882 | 0.871 |
Download Data |
Period Mean (original grids) [K] |
Model Period Mean (intersection) [K] |
Benchmark Period Mean (intersection) [K] |
Model Period Mean (complement) [K] |
Benchmark Period Mean (complement) [K] |
Bias [K] |
RMSE [K] |
Phase Shift [months] |
Bias Score [1] |
RMSE Score [1] |
Seasonal Cycle Score [1] |
Spatial Distribution Score [1] |
Overall Score [1] |
|||
|---|---|---|---|---|---|---|---|---|---|---|---|---|---|---|---|---|
| Benchmark | [-] | 304. | ||||||||||||||
| CESM3_092H | [-] | 302. | 302. | 304. | 303. | 304. | -1.15 | 1.60 | 1.88 | 0.248 | 0.465 | 0.724 | 0.970 | 0.574 | ||
| CMIP6_001 | [-] | 303. | 302. | 304. | 303. | 303. | -1.23 | 1.67 | 1.87 | 0.261 | 0.439 | 0.741 | 0.893 | 0.555 | ||
| LE2_001 | [-] | 303. | 303. | 304. | 303. | 303. | -1.21 | 1.67 | 1.85 | 0.264 | 0.431 | 0.740 | 0.890 | 0.551 |
Download Data |
Period Mean (original grids) [K] |
Model Period Mean (intersection) [K] |
Benchmark Period Mean (intersection) [K] |
Model Period Mean (complement) [K] |
Benchmark Period Mean (complement) [K] |
Bias [K] |
RMSE [K] |
Phase Shift [months] |
Bias Score [1] |
RMSE Score [1] |
Seasonal Cycle Score [1] |
Spatial Distribution Score [1] |
Overall Score [1] |
|||
|---|---|---|---|---|---|---|---|---|---|---|---|---|---|---|---|---|
| Benchmark | [-] | 276. | ||||||||||||||
| CESM3_092H | [-] | 277. | 277. | 276. | 280. | 278. | 0.863 | 2.44 | 0.0427 | 0.917 | 0.877 | 0.997 | 0.976 | 0.929 | ||
| CMIP6_001 | [-] | 276. | 276. | 276. | 278. | 278. | -0.125 | 2.96 | 0.0492 | 0.944 | 0.832 | 0.997 | 0.989 | 0.919 | ||
| LE2_001 | [-] | 276. | 276. | 276. | 278. | 278. | 0.218 | 2.81 | 0.0439 | 0.949 | 0.841 | 0.997 | 0.988 | 0.923 |
Download Data |
Period Mean (original grids) [K] |
Model Period Mean (intersection) [K] |
Benchmark Period Mean (intersection) [K] |
Model Period Mean (complement) [K] |
Benchmark Period Mean (complement) [K] |
Bias [K] |
RMSE [K] |
Phase Shift [months] |
Bias Score [1] |
RMSE Score [1] |
Seasonal Cycle Score [1] |
Spatial Distribution Score [1] |
Overall Score [1] |
|||
|---|---|---|---|---|---|---|---|---|---|---|---|---|---|---|---|---|
| Benchmark | [-] | 286. | ||||||||||||||
| CESM3_092H | [-] | 287. | 287. | 286. | 293. | 291. | 0.881 | 2.89 | 0.244 | 0.797 | 0.863 | 0.982 | 0.991 | 0.899 | ||
| CMIP6_001 | [-] | 286. | 286. | 286. | 291. | 292. | -0.0705 | 2.13 | 0.168 | 0.860 | 0.876 | 0.988 | 0.998 | 0.920 | ||
| LE2_001 | [-] | 286. | 286. | 286. | 291. | 292. | 0.0657 | 2.14 | 0.191 | 0.859 | 0.876 | 0.986 | 0.999 | 0.919 |
Download Data |
Period Mean (original grids) [K] |
Model Period Mean (intersection) [K] |
Benchmark Period Mean (intersection) [K] |
Model Period Mean (complement) [K] |
Benchmark Period Mean (complement) [K] |
Bias [K] |
RMSE [K] |
Phase Shift [months] |
Bias Score [1] |
RMSE Score [1] |
Seasonal Cycle Score [1] |
Spatial Distribution Score [1] |
Overall Score [1] |
|||
|---|---|---|---|---|---|---|---|---|---|---|---|---|---|---|---|---|
| Benchmark | [-] | 303. | ||||||||||||||
| CESM3_092H | [-] | 302. | 302. | 303. | 303. | 303. | -0.753 | 2.34 | 0.548 | 0.644 | 0.646 | 0.948 | 0.982 | 0.773 | ||
| CMIP6_001 | [-] | 302. | 302. | 303. | 303. | 304. | -0.520 | 2.42 | 0.605 | 0.631 | 0.641 | 0.948 | 0.979 | 0.768 | ||
| LE2_001 | [-] | 302. | 302. | 303. | 303. | 304. | -0.523 | 2.42 | 0.629 | 0.633 | 0.637 | 0.945 | 0.979 | 0.766 |
Download Data |
Period Mean (original grids) [K] |
Model Period Mean (intersection) [K] |
Benchmark Period Mean (intersection) [K] |
Model Period Mean (complement) [K] |
Benchmark Period Mean (complement) [K] |
Bias [K] |
RMSE [K] |
Phase Shift [months] |
Bias Score [1] |
RMSE Score [1] |
Seasonal Cycle Score [1] |
Spatial Distribution Score [1] |
Overall Score [1] |
|||
|---|---|---|---|---|---|---|---|---|---|---|---|---|---|---|---|---|
| Benchmark | [-] | 268. | ||||||||||||||
| CESM3_092H | [-] | 268. | 268. | 268. | 270. | 272. | 0.586 | 2.89 | 0.0719 | 0.939 | 0.842 | 0.995 | 1.00 | 0.924 | ||
| CMIP6_001 | [-] | 268. | 268. | 268. | 268. | 268. | 0.186 | 5.03 | 0.534 | 0.923 | 0.733 | 0.964 | 0.905 | 0.852 | ||
| LE2_001 | [-] | 268. | 268. | 268. | 268. | 268. | 0.692 | 4.92 | 0.351 | 0.923 | 0.740 | 0.976 | 0.909 | 0.858 |
Download Data |
Period Mean (original grids) [K] |
Model Period Mean (intersection) [K] |
Benchmark Period Mean (intersection) [K] |
Model Period Mean (complement) [K] |
Benchmark Period Mean (complement) [K] |
Bias [K] |
RMSE [K] |
Phase Shift [months] |
Bias Score [1] |
RMSE Score [1] |
Seasonal Cycle Score [1] |
Spatial Distribution Score [1] |
Overall Score [1] |
|||
|---|---|---|---|---|---|---|---|---|---|---|---|---|---|---|---|---|
| Benchmark | [-] | 301. | ||||||||||||||
| CESM3_092H | [-] | 300. | 300. | 301. | 295. | 299. | -1.47 | 1.83 | 0.306 | 0.714 | 0.844 | 0.978 | 1.00 | 0.876 | ||
| CMIP6_001 | [-] | 300. | 300. | 301. | 297. | 299. | -1.50 | 1.88 | 0.349 | 0.710 | 0.851 | 0.973 | 1.00 | 0.877 | ||
| LE2_001 | [-] | 300. | 300. | 301. | 297. | 299. | -1.43 | 1.82 | 0.239 | 0.717 | 0.856 | 0.982 | 1.00 | 0.882 |
Download Data |
Period Mean (original grids) [K] |
Model Period Mean (intersection) [K] |
Benchmark Period Mean (intersection) [K] |
Model Period Mean (complement) [K] |
Benchmark Period Mean (complement) [K] |
Bias [K] |
RMSE [K] |
Phase Shift [months] |
Bias Score [1] |
RMSE Score [1] |
Seasonal Cycle Score [1] |
Spatial Distribution Score [1] |
Overall Score [1] |
|||
|---|---|---|---|---|---|---|---|---|---|---|---|---|---|---|---|---|
| Benchmark | [-] | 286. | ||||||||||||||
| CESM3_092H | [-] | 288. | 288. | 286. | 290. | 293. | 1.97 | 2.48 | 0.579 | 0.758 | 0.867 | 0.961 | 0.999 | 0.890 | ||
| CMIP6_001 | [-] | 286. | 286. | 286. | 288. | 289. | 0.593 | 1.80 | 0.552 | 0.854 | 0.862 | 0.963 | 0.995 | 0.907 | ||
| LE2_001 | [-] | 287. | 287. | 286. | 288. | 289. | 0.778 | 1.88 | 0.458 | 0.843 | 0.862 | 0.969 | 0.995 | 0.906 |
Download Data |
Period Mean (original grids) [K] |
Model Period Mean (intersection) [K] |
Benchmark Period Mean (intersection) [K] |
Model Period Mean (complement) [K] |
Benchmark Period Mean (complement) [K] |
Bias [K] |
RMSE [K] |
Phase Shift [months] |
Bias Score [1] |
RMSE Score [1] |
Seasonal Cycle Score [1] |
Spatial Distribution Score [1] |
Overall Score [1] |
|||
|---|---|---|---|---|---|---|---|---|---|---|---|---|---|---|---|---|
| Benchmark | [-] | 292. | ||||||||||||||
| CESM3_092H | [-] | 287. | 292. | 292. | 248. | 300. | -0.294 | 2.54 | 0.581 | 0.691 | 0.736 | 0.940 | 1.00 | 0.820 | ||
| CMIP6_001 | [-] | 287. | 292. | 292. | 248. | 295. | -0.567 | 2.51 | 0.540 | 0.711 | 0.730 | 0.945 | 1.00 | 0.823 | ||
| LE2_001 | [-] | 287. | 292. | 292. | 248. | 295. | -0.458 | 2.49 | 0.536 | 0.714 | 0.731 | 0.946 | 1.00 | 0.824 |
Download Data |
Period Mean (original grids) [K] |
Model Period Mean (intersection) [K] |
Benchmark Period Mean (intersection) [K] |
Model Period Mean (complement) [K] |
Benchmark Period Mean (complement) [K] |
Bias [K] |
RMSE [K] |
Phase Shift [months] |
Bias Score [1] |
RMSE Score [1] |
Seasonal Cycle Score [1] |
Spatial Distribution Score [1] |
Overall Score [1] |
|||
|---|---|---|---|---|---|---|---|---|---|---|---|---|---|---|---|---|
| Benchmark | [-] | 303. | ||||||||||||||
| CESM3_092H | [-] | 301. | 301. | 303. | 300. | 296. | -1.49 | 2.83 | 0.496 | 0.695 | 0.813 | 0.954 | 0.979 | 0.851 | ||
| CMIP6_001 | [-] | 301. | 301. | 303. | 300. | 303. | -1.54 | 2.96 | 0.340 | 0.687 | 0.797 | 0.974 | 0.998 | 0.850 | ||
| LE2_001 | [-] | 301. | 301. | 303. | 300. | 303. | -1.51 | 2.94 | 0.368 | 0.689 | 0.799 | 0.971 | 0.998 | 0.851 |
Download Data |
Period Mean (original grids) [K] |
Model Period Mean (intersection) [K] |
Benchmark Period Mean (intersection) [K] |
Model Period Mean (complement) [K] |
Benchmark Period Mean (complement) [K] |
Bias [K] |
RMSE [K] |
Phase Shift [months] |
Bias Score [1] |
RMSE Score [1] |
Seasonal Cycle Score [1] |
Spatial Distribution Score [1] |
Overall Score [1] |
|||
|---|---|---|---|---|---|---|---|---|---|---|---|---|---|---|---|---|
| Benchmark | [-] | 269. | ||||||||||||||
| CESM3_092H | [-] | 269. | 269. | 269. | 267. | 0.294 | 3.01 | 0.342 | 0.920 | 0.815 | 0.977 | 1.00 | 0.905 | |||
| CMIP6_001 | [-] | 269. | 269. | 269. | 266. | 270. | -0.121 | 3.37 | 0.457 | 0.885 | 0.808 | 0.969 | 0.998 | 0.894 | ||
| LE2_001 | [-] | 269. | 269. | 269. | 266. | 270. | 0.226 | 3.36 | 0.517 | 0.889 | 0.807 | 0.965 | 0.999 | 0.893 |
Download Data |
Period Mean (original grids) [K] |
Model Period Mean (intersection) [K] |
Benchmark Period Mean (intersection) [K] |
Model Period Mean (complement) [K] |
Benchmark Period Mean (complement) [K] |
Bias [K] |
RMSE [K] |
Phase Shift [months] |
Bias Score [1] |
RMSE Score [1] |
Seasonal Cycle Score [1] |
Spatial Distribution Score [1] |
Overall Score [1] |
|||
|---|---|---|---|---|---|---|---|---|---|---|---|---|---|---|---|---|
| Benchmark | [-] | 302. | ||||||||||||||
| CESM3_092H | [-] | 300. | 300. | 302. | 303. | 304. | -1.71 | 2.58 | 0.813 | 0.512 | 0.684 | 0.895 | 0.991 | 0.753 | ||
| CMIP6_001 | [-] | 300. | 300. | 302. | 303. | 303. | -1.58 | 2.67 | 0.767 | 0.498 | 0.666 | 0.928 | 0.978 | 0.747 | ||
| LE2_001 | [-] | 300. | 300. | 302. | 303. | 303. | -1.56 | 2.63 | 0.726 | 0.501 | 0.673 | 0.929 | 0.982 | 0.751 |
Download Data |
Period Mean (original grids) [K] |
Model Period Mean (intersection) [K] |
Benchmark Period Mean (intersection) [K] |
Model Period Mean (complement) [K] |
Benchmark Period Mean (complement) [K] |
Bias [K] |
RMSE [K] |
Phase Shift [months] |
Bias Score [1] |
RMSE Score [1] |
Seasonal Cycle Score [1] |
Spatial Distribution Score [1] |
Overall Score [1] |
|||
|---|---|---|---|---|---|---|---|---|---|---|---|---|---|---|---|---|
| Benchmark | [-] | 292. | ||||||||||||||
| CESM3_092H | [-] | 293. | 293. | 292. | 298. | 300. | 1.51 | 2.36 | 0.893 | 0.848 | 0.846 | 0.940 | 0.997 | 0.895 | ||
| CMIP6_001 | [-] | 292. | 292. | 292. | 298. | 297. | 0.433 | 1.77 | 0.509 | 0.906 | 0.863 | 0.966 | 1.00 | 0.919 | ||
| LE2_001 | [-] | 293. | 292. | 292. | 298. | 297. | 0.558 | 1.81 | 0.607 | 0.903 | 0.863 | 0.959 | 1.00 | 0.918 |
Download Data |
Period Mean (original grids) [K] |
Model Period Mean (intersection) [K] |
Benchmark Period Mean (intersection) [K] |
Model Period Mean (complement) [K] |
Benchmark Period Mean (complement) [K] |
Bias [K] |
RMSE [K] |
Phase Shift [months] |
Bias Score [1] |
RMSE Score [1] |
Seasonal Cycle Score [1] |
Spatial Distribution Score [1] |
Overall Score [1] |
|||
|---|---|---|---|---|---|---|---|---|---|---|---|---|---|---|---|---|
| Benchmark | [-] | 280. | ||||||||||||||
| CESM3_092H | [-] | 281. | 281. | 280. | 284. | 1.43 | 2.78 | 0.563 | 0.862 | 0.825 | 0.962 | 0.988 | 0.893 | |||
| CMIP6_001 | [-] | 280. | 280. | 280. | 282. | 282. | 0.587 | 2.20 | 0.371 | 0.910 | 0.856 | 0.975 | 0.998 | 0.919 | ||
| LE2_001 | [-] | 280. | 280. | 280. | 282. | 282. | 0.713 | 2.17 | 0.240 | 0.905 | 0.861 | 0.984 | 1.00 | 0.922 |
Download Data |
Period Mean (original grids) [K] |
Model Period Mean (intersection) [K] |
Benchmark Period Mean (intersection) [K] |
Model Period Mean (complement) [K] |
Benchmark Period Mean (complement) [K] |
Bias [K] |
RMSE [K] |
Phase Shift [months] |
Bias Score [1] |
RMSE Score [1] |
Seasonal Cycle Score [1] |
Spatial Distribution Score [1] |
Overall Score [1] |
|||
|---|---|---|---|---|---|---|---|---|---|---|---|---|---|---|---|---|
| Benchmark | [-] | 291. | ||||||||||||||
| CESM3_092H | [-] | 291. | 291. | 291. | 293. | 290. | 0.0117 | 2.45 | 0.527 | 0.828 | 0.834 | 0.965 | 0.989 | 0.890 | ||
| CMIP6_001 | [-] | 291. | 291. | 291. | 293. | 292. | -0.255 | 2.22 | 0.497 | 0.848 | 0.845 | 0.967 | 0.996 | 0.900 | ||
| LE2_001 | [-] | 290. | 291. | 291. | 293. | 292. | -0.424 | 2.36 | 0.488 | 0.847 | 0.832 | 0.967 | 0.997 | 0.895 |
Download Data |
Period Mean (original grids) [K] |
Model Period Mean (intersection) [K] |
Benchmark Period Mean (intersection) [K] |
Model Period Mean (complement) [K] |
Benchmark Period Mean (complement) [K] |
Bias [K] |
RMSE [K] |
Phase Shift [months] |
Bias Score [1] |
RMSE Score [1] |
Seasonal Cycle Score [1] |
Spatial Distribution Score [1] |
Overall Score [1] |
|||
|---|---|---|---|---|---|---|---|---|---|---|---|---|---|---|---|---|
| Benchmark | [-] | 304. | ||||||||||||||
| CESM3_092H | [-] | 304. | 304. | 304. | 303. | 305. | 0.0215 | 1.83 | 1.37 | 0.482 | 0.355 | 0.810 | 0.977 | 0.596 | ||
| CMIP6_001 | [-] | 304. | 304. | 304. | 303. | 304. | -0.0996 | 1.73 | 1.13 | 0.477 | 0.389 | 0.859 | 0.982 | 0.619 | ||
| LE2_001 | [-] | 304. | 304. | 304. | 303. | 304. | -0.0622 | 1.75 | 1.17 | 0.478 | 0.382 | 0.854 | 0.981 | 0.615 |
Download Data |
Period Mean (original grids) [K] |
Model Period Mean (intersection) [K] |
Benchmark Period Mean (intersection) [K] |
Model Period Mean (complement) [K] |
Benchmark Period Mean (complement) [K] |
Bias [K] |
RMSE [K] |
Phase Shift [months] |
Bias Score [1] |
RMSE Score [1] |
Seasonal Cycle Score [1] |
Spatial Distribution Score [1] |
Overall Score [1] |
|||
|---|---|---|---|---|---|---|---|---|---|---|---|---|---|---|---|---|
| Benchmark | [-] | 301. | ||||||||||||||
| CESM3_092H | [-] | 302. | 302. | 301. | 299. | 293. | 0.101 | 2.00 | 1.01 | 0.587 | 0.583 | 0.882 | 1.00 | 0.727 | ||
| CMIP6_001 | [-] | 301. | 301. | 301. | 299. | 297. | -0.362 | 2.03 | 1.04 | 0.529 | 0.606 | 0.881 | 1.00 | 0.724 | ||
| LE2_001 | [-] | 301. | 301. | 301. | 299. | 297. | -0.238 | 1.95 | 0.898 | 0.548 | 0.611 | 0.896 | 0.999 | 0.733 |
Download Data |
Period Mean (original grids) [K] |
Model Period Mean (intersection) [K] |
Benchmark Period Mean (intersection) [K] |
Model Period Mean (complement) [K] |
Benchmark Period Mean (complement) [K] |
Bias [K] |
RMSE [K] |
Phase Shift [months] |
Bias Score [1] |
RMSE Score [1] |
Seasonal Cycle Score [1] |
Spatial Distribution Score [1] |
Overall Score [1] |
|||
|---|---|---|---|---|---|---|---|---|---|---|---|---|---|---|---|---|
| Benchmark | [-] | 290. | ||||||||||||||
| CESM3_092H | [-] | 289. | 289. | 290. | 293. | 291. | -1.12 | 2.92 | 1.06 | 0.519 | 0.715 | 0.888 | 1.00 | 0.767 | ||
| CMIP6_001 | [-] | 290. | 290. | 290. | 293. | 289. | -0.415 | 3.21 | 0.876 | 0.495 | 0.683 | 0.876 | 0.992 | 0.746 | ||
| LE2_001 | [-] | 290. | 290. | 290. | 293. | 289. | -0.439 | 3.20 | 1.02 | 0.498 | 0.679 | 0.869 | 0.994 | 0.744 |
Temporally integrated period mean