Mean State
Download Data |
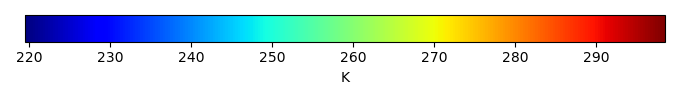
Period Mean (original grids) [K] |
Model Period Mean (intersection) [K] |
Benchmark Period Mean (intersection) [K] |
Model Period Mean (complement) [K] |
Benchmark Period Mean (complement) [K] |
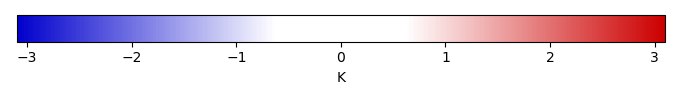
Bias [K] |
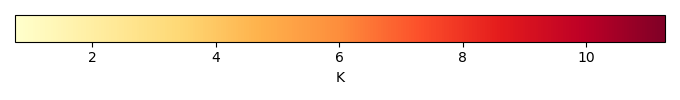
RMSE [K] |
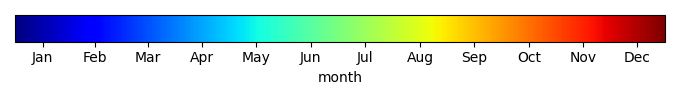
Phase Shift [months] |
Bias Score [1] |
RMSE Score [1] |
Seasonal Cycle Score [1] |
Spatial Distribution Score [1] |
Overall Score [1] |
|||
|---|---|---|---|---|---|---|---|---|---|---|---|---|---|---|---|---|
| Benchmark | [-] | 293. | ||||||||||||||
| CESM3_092H | [-] | 295. | 295. | 293. | 298. | 296. | 2.59 | 2.67 | 0.690 | 0.122 | 0.541 | 0.931 | 0.961 | 0.619 | ||
| CMIP6_001 | [-] | 295. | 295. | 293. | 298. | 296. | 2.17 | 2.34 | 0.742 | 0.172 | 0.475 | 0.920 | 0.984 | 0.605 | ||
| LE2_001 | [-] | 295. | 295. | 293. | 298. | 296. | 2.23 | 2.38 | 0.773 | 0.164 | 0.490 | 0.916 | 0.984 | 0.609 |
Download Data |
Period Mean (original grids) [K] |
Model Period Mean (intersection) [K] |
Benchmark Period Mean (intersection) [K] |
Model Period Mean (complement) [K] |
Benchmark Period Mean (complement) [K] |
Bias [K] |
RMSE [K] |
Phase Shift [months] |
Bias Score [1] |
RMSE Score [1] |
Seasonal Cycle Score [1] |
Spatial Distribution Score [1] |
Overall Score [1] |
|||
|---|---|---|---|---|---|---|---|---|---|---|---|---|---|---|---|---|
| Benchmark | [-] | 293. | ||||||||||||||
| CESM3_092H | [-] | 296. | 296. | 293. | 298. | 294. | 3.17 | 3.38 | 0.398 | 0.333 | 0.698 | 0.963 | 0.927 | 0.724 | ||
| CMIP6_001 | [-] | 296. | 296. | 293. | 298. | 295. | 2.88 | 3.42 | 0.469 | 0.374 | 0.622 | 0.957 | 0.940 | 0.703 | ||
| LE2_001 | [-] | 296. | 296. | 293. | 298. | 295. | 2.95 | 3.46 | 0.466 | 0.367 | 0.628 | 0.959 | 0.936 | 0.704 |
Download Data |
Period Mean (original grids) [K] |
Model Period Mean (intersection) [K] |
Benchmark Period Mean (intersection) [K] |
Model Period Mean (complement) [K] |
Benchmark Period Mean (complement) [K] |
Bias [K] |
RMSE [K] |
Phase Shift [months] |
Bias Score [1] |
RMSE Score [1] |
Seasonal Cycle Score [1] |
Spatial Distribution Score [1] |
Overall Score [1] |
|||
|---|---|---|---|---|---|---|---|---|---|---|---|---|---|---|---|---|
| Benchmark | [-] | 289. | ||||||||||||||
| CESM3_092H | [-] | 292. | 292. | 289. | 295. | 294. | 3.96 | 4.09 | 1.25 | 0.285 | 0.718 | 0.831 | 0.991 | 0.709 | ||
| CMIP6_001 | [-] | 292. | 292. | 289. | 295. | 293. | 3.35 | 3.50 | 1.09 | 0.349 | 0.738 | 0.855 | 0.998 | 0.736 | ||
| LE2_001 | [-] | 292. | 292. | 289. | 295. | 293. | 3.48 | 3.61 | 1.21 | 0.336 | 0.741 | 0.846 | 0.998 | 0.732 |
Download Data |
Period Mean (original grids) [K] |
Model Period Mean (intersection) [K] |
Benchmark Period Mean (intersection) [K] |
Model Period Mean (complement) [K] |
Benchmark Period Mean (complement) [K] |
Bias [K] |
RMSE [K] |
Phase Shift [months] |
Bias Score [1] |
RMSE Score [1] |
Seasonal Cycle Score [1] |
Spatial Distribution Score [1] |
Overall Score [1] |
|||
|---|---|---|---|---|---|---|---|---|---|---|---|---|---|---|---|---|
| Benchmark | [-] | 257. | ||||||||||||||
| CESM3_092H | [-] | 261. | 260. | 257. | 265. | 4.06 | 4.93 | 0.0705 | 0.784 | 0.860 | 0.995 | 0.918 | 0.883 | |||
| CMIP6_001 | [-] | 262. | 262. | 257. | 265. | 262. | 5.16 | 6.31 | 0.105 | 0.741 | 0.817 | 0.993 | 0.733 | 0.820 | ||
| LE2_001 | [-] | 262. | 262. | 257. | 265. | 262. | 5.21 | 6.36 | 0.197 | 0.740 | 0.817 | 0.987 | 0.708 | 0.814 |
Download Data |
Period Mean (original grids) [K] |
Model Period Mean (intersection) [K] |
Benchmark Period Mean (intersection) [K] |
Model Period Mean (complement) [K] |
Benchmark Period Mean (complement) [K] |
Bias [K] |
RMSE [K] |
Phase Shift [months] |
Bias Score [1] |
RMSE Score [1] |
Seasonal Cycle Score [1] |
Spatial Distribution Score [1] |
Overall Score [1] |
|||
|---|---|---|---|---|---|---|---|---|---|---|---|---|---|---|---|---|
| Benchmark | [-] | 294. | ||||||||||||||
| CESM3_092H | [-] | 297. | 297. | 294. | 299. | 295. | 3.50 | 3.60 | 1.59 | 0.0531 | 0.588 | 0.755 | 0.888 | 0.575 | ||
| CMIP6_001 | [-] | 296. | 296. | 294. | 298. | 295. | 2.55 | 2.77 | 1.78 | 0.108 | 0.573 | 0.750 | 0.900 | 0.581 | ||
| LE2_001 | [-] | 296. | 296. | 294. | 298. | 295. | 2.58 | 2.78 | 1.77 | 0.106 | 0.577 | 0.754 | 0.898 | 0.583 |
Download Data |
Period Mean (original grids) [K] |
Model Period Mean (intersection) [K] |
Benchmark Period Mean (intersection) [K] |
Model Period Mean (complement) [K] |
Benchmark Period Mean (complement) [K] |
Bias [K] |
RMSE [K] |
Phase Shift [months] |
Bias Score [1] |
RMSE Score [1] |
Seasonal Cycle Score [1] |
Spatial Distribution Score [1] |
Overall Score [1] |
|||
|---|---|---|---|---|---|---|---|---|---|---|---|---|---|---|---|---|
| Benchmark | [-] | 266. | ||||||||||||||
| CESM3_092H | [-] | 269. | 269. | 266. | 274. | 271. | 3.90 | 4.34 | 0.0689 | 0.755 | 0.881 | 0.995 | 0.989 | 0.900 | ||
| CMIP6_001 | [-] | 268. | 268. | 266. | 271. | 270. | 2.43 | 3.81 | 0.0469 | 0.854 | 0.827 | 0.997 | 0.894 | 0.880 | ||
| LE2_001 | [-] | 268. | 268. | 266. | 272. | 270. | 2.73 | 3.98 | 0.0471 | 0.836 | 0.828 | 0.997 | 0.893 | 0.876 |
Download Data |
Period Mean (original grids) [K] |
Model Period Mean (intersection) [K] |
Benchmark Period Mean (intersection) [K] |
Model Period Mean (complement) [K] |
Benchmark Period Mean (complement) [K] |
Bias [K] |
RMSE [K] |
Phase Shift [months] |
Bias Score [1] |
RMSE Score [1] |
Seasonal Cycle Score [1] |
Spatial Distribution Score [1] |
Overall Score [1] |
|||
|---|---|---|---|---|---|---|---|---|---|---|---|---|---|---|---|---|
| Benchmark | [-] | 274. | ||||||||||||||
| CESM3_092H | [-] | 278. | 278. | 274. | 288. | 284. | 3.65 | 4.44 | 0.251 | 0.687 | 0.868 | 0.983 | 1.00 | 0.881 | ||
| CMIP6_001 | [-] | 277. | 277. | 274. | 286. | 284. | 2.76 | 3.34 | 0.127 | 0.756 | 0.884 | 0.991 | 0.997 | 0.902 | ||
| LE2_001 | [-] | 277. | 277. | 274. | 286. | 284. | 2.94 | 3.50 | 0.206 | 0.744 | 0.880 | 0.986 | 0.996 | 0.897 |
Download Data |
Period Mean (original grids) [K] |
Model Period Mean (intersection) [K] |
Benchmark Period Mean (intersection) [K] |
Model Period Mean (complement) [K] |
Benchmark Period Mean (complement) [K] |
Bias [K] |
RMSE [K] |
Phase Shift [months] |
Bias Score [1] |
RMSE Score [1] |
Seasonal Cycle Score [1] |
Spatial Distribution Score [1] |
Overall Score [1] |
|||
|---|---|---|---|---|---|---|---|---|---|---|---|---|---|---|---|---|
| Benchmark | [-] | 291. | ||||||||||||||
| CESM3_092H | [-] | 293. | 293. | 291. | 298. | 295. | 1.82 | 2.97 | 0.549 | 0.544 | 0.746 | 0.956 | 0.977 | 0.794 | ||
| CMIP6_001 | [-] | 293. | 293. | 291. | 298. | 296. | 2.10 | 3.13 | 0.607 | 0.544 | 0.745 | 0.946 | 0.988 | 0.794 | ||
| LE2_001 | [-] | 293. | 293. | 291. | 298. | 296. | 2.16 | 3.19 | 0.610 | 0.539 | 0.736 | 0.947 | 0.988 | 0.789 |
Download Data |
Period Mean (original grids) [K] |
Model Period Mean (intersection) [K] |
Benchmark Period Mean (intersection) [K] |
Model Period Mean (complement) [K] |
Benchmark Period Mean (complement) [K] |
Bias [K] |
RMSE [K] |
Phase Shift [months] |
Bias Score [1] |
RMSE Score [1] |
Seasonal Cycle Score [1] |
Spatial Distribution Score [1] |
Overall Score [1] |
|||
|---|---|---|---|---|---|---|---|---|---|---|---|---|---|---|---|---|
| Benchmark | [-] | 259. | ||||||||||||||
| CESM3_092H | [-] | 262. | 262. | 259. | 265. | 264. | 3.16 | 4.13 | 0.0819 | 0.812 | 0.844 | 0.994 | 0.997 | 0.898 | ||
| CMIP6_001 | [-] | 263. | 263. | 259. | 264. | 260. | 3.42 | 5.35 | 0.337 | 0.812 | 0.773 | 0.977 | 0.840 | 0.835 | ||
| LE2_001 | [-] | 263. | 263. | 259. | 264. | 260. | 3.87 | 5.61 | 0.288 | 0.788 | 0.774 | 0.981 | 0.850 | 0.833 |
Download Data |
Period Mean (original grids) [K] |
Model Period Mean (intersection) [K] |
Benchmark Period Mean (intersection) [K] |
Model Period Mean (complement) [K] |
Benchmark Period Mean (complement) [K] |
Bias [K] |
RMSE [K] |
Phase Shift [months] |
Bias Score [1] |
RMSE Score [1] |
Seasonal Cycle Score [1] |
Spatial Distribution Score [1] |
Overall Score [1] |
|||
|---|---|---|---|---|---|---|---|---|---|---|---|---|---|---|---|---|
| Benchmark | [-] | 288. | ||||||||||||||
| CESM3_092H | [-] | 291. | 291. | 288. | 290. | 289. | 3.16 | 3.24 | 0.290 | 0.519 | 0.862 | 0.980 | 0.999 | 0.844 | ||
| CMIP6_001 | [-] | 291. | 291. | 288. | 291. | 289. | 2.89 | 2.98 | 0.335 | 0.552 | 0.874 | 0.977 | 0.997 | 0.855 | ||
| LE2_001 | [-] | 291. | 291. | 288. | 291. | 289. | 2.92 | 3.00 | 0.231 | 0.549 | 0.873 | 0.984 | 0.998 | 0.855 |
Download Data |
Period Mean (original grids) [K] |
Model Period Mean (intersection) [K] |
Benchmark Period Mean (intersection) [K] |
Model Period Mean (complement) [K] |
Benchmark Period Mean (complement) [K] |
Bias [K] |
RMSE [K] |
Phase Shift [months] |
Bias Score [1] |
RMSE Score [1] |
Seasonal Cycle Score [1] |
Spatial Distribution Score [1] |
Overall Score [1] |
|||
|---|---|---|---|---|---|---|---|---|---|---|---|---|---|---|---|---|
| Benchmark | [-] | 278. | ||||||||||||||
| CESM3_092H | [-] | 281. | 281. | 278. | 285. | 284. | 4.13 | 4.34 | 0.585 | 0.512 | 0.834 | 0.961 | 0.997 | 0.828 | ||
| CMIP6_001 | [-] | 280. | 279. | 278. | 282. | 282. | 2.48 | 2.88 | 0.437 | 0.658 | 0.853 | 0.971 | 0.994 | 0.866 | ||
| LE2_001 | [-] | 280. | 280. | 278. | 282. | 282. | 2.64 | 3.04 | 0.446 | 0.643 | 0.847 | 0.970 | 0.994 | 0.860 |
Download Data |
Period Mean (original grids) [K] |
Model Period Mean (intersection) [K] |
Benchmark Period Mean (intersection) [K] |
Model Period Mean (complement) [K] |
Benchmark Period Mean (complement) [K] |
Bias [K] |
RMSE [K] |
Phase Shift [months] |
Bias Score [1] |
RMSE Score [1] |
Seasonal Cycle Score [1] |
Spatial Distribution Score [1] |
Overall Score [1] |
|||
|---|---|---|---|---|---|---|---|---|---|---|---|---|---|---|---|---|
| Benchmark | [-] | 281. | ||||||||||||||
| CESM3_092H | [-] | 279. | 284. | 281. | 242. | 291. | 3.25 | 3.83 | 0.691 | 0.527 | 0.772 | 0.920 | 1.00 | 0.798 | ||
| CMIP6_001 | [-] | 279. | 283. | 281. | 243. | 286. | 2.68 | 3.36 | 0.623 | 0.587 | 0.768 | 0.927 | 0.998 | 0.810 | ||
| LE2_001 | [-] | 279. | 283. | 281. | 243. | 286. | 2.80 | 3.44 | 0.656 | 0.578 | 0.767 | 0.924 | 0.998 | 0.807 |
Download Data |
Period Mean (original grids) [K] |
Model Period Mean (intersection) [K] |
Benchmark Period Mean (intersection) [K] |
Model Period Mean (complement) [K] |
Benchmark Period Mean (complement) [K] |
Bias [K] |
RMSE [K] |
Phase Shift [months] |
Bias Score [1] |
RMSE Score [1] |
Seasonal Cycle Score [1] |
Spatial Distribution Score [1] |
Overall Score [1] |
|||
|---|---|---|---|---|---|---|---|---|---|---|---|---|---|---|---|---|
| Benchmark | [-] | 289. | ||||||||||||||
| CESM3_092H | [-] | 291. | 291. | 289. | 293. | 286. | 2.30 | 3.06 | 0.492 | 0.670 | 0.796 | 0.959 | 0.994 | 0.843 | ||
| CMIP6_001 | [-] | 290. | 290. | 289. | 293. | 292. | 1.31 | 2.25 | 0.524 | 0.769 | 0.815 | 0.954 | 0.991 | 0.869 | ||
| LE2_001 | [-] | 290. | 290. | 289. | 293. | 292. | 1.41 | 2.30 | 0.564 | 0.763 | 0.813 | 0.949 | 0.992 | 0.866 |
Download Data |
Period Mean (original grids) [K] |
Model Period Mean (intersection) [K] |
Benchmark Period Mean (intersection) [K] |
Model Period Mean (complement) [K] |
Benchmark Period Mean (complement) [K] |
Bias [K] |
RMSE [K] |
Phase Shift [months] |
Bias Score [1] |
RMSE Score [1] |
Seasonal Cycle Score [1] |
Spatial Distribution Score [1] |
Overall Score [1] |
|||
|---|---|---|---|---|---|---|---|---|---|---|---|---|---|---|---|---|
| Benchmark | [-] | 260. | ||||||||||||||
| CESM3_092H | [-] | 263. | 263. | 260. | 262. | 2.68 | 4.10 | 0.314 | 0.814 | 0.814 | 0.979 | 0.996 | 0.884 | |||
| CMIP6_001 | [-] | 263. | 263. | 260. | 261. | 262. | 2.96 | 4.15 | 0.282 | 0.798 | 0.826 | 0.981 | 0.991 | 0.884 | ||
| LE2_001 | [-] | 264. | 264. | 260. | 262. | 262. | 3.30 | 4.38 | 0.321 | 0.781 | 0.823 | 0.978 | 0.994 | 0.880 |
Download Data |
Period Mean (original grids) [K] |
Model Period Mean (intersection) [K] |
Benchmark Period Mean (intersection) [K] |
Model Period Mean (complement) [K] |
Benchmark Period Mean (complement) [K] |
Bias [K] |
RMSE [K] |
Phase Shift [months] |
Bias Score [1] |
RMSE Score [1] |
Seasonal Cycle Score [1] |
Spatial Distribution Score [1] |
Overall Score [1] |
|||
|---|---|---|---|---|---|---|---|---|---|---|---|---|---|---|---|---|
| Benchmark | [-] | 289. | ||||||||||||||
| CESM3_092H | [-] | 292. | 292. | 289. | 297. | 295. | 3.93 | 4.13 | 1.34 | 0.319 | 0.758 | 0.827 | 0.999 | 0.732 | ||
| CMIP6_001 | [-] | 292. | 291. | 289. | 296. | 293. | 3.66 | 3.93 | 1.03 | 0.332 | 0.760 | 0.874 | 0.989 | 0.743 | ||
| LE2_001 | [-] | 292. | 292. | 289. | 296. | 293. | 3.72 | 3.98 | 1.00 | 0.327 | 0.757 | 0.878 | 0.987 | 0.742 |
Download Data |
Period Mean (original grids) [K] |
Model Period Mean (intersection) [K] |
Benchmark Period Mean (intersection) [K] |
Model Period Mean (complement) [K] |
Benchmark Period Mean (complement) [K] |
Bias [K] |
RMSE [K] |
Phase Shift [months] |
Bias Score [1] |
RMSE Score [1] |
Seasonal Cycle Score [1] |
Spatial Distribution Score [1] |
Overall Score [1] |
|||
|---|---|---|---|---|---|---|---|---|---|---|---|---|---|---|---|---|
| Benchmark | [-] | 280. | ||||||||||||||
| CESM3_092H | [-] | 285. | 284. | 280. | 291. | 289. | 4.70 | 4.98 | 0.909 | 0.577 | 0.842 | 0.939 | 1.00 | 0.840 | ||
| CMIP6_001 | [-] | 284. | 284. | 280. | 292. | 287. | 3.91 | 4.16 | 0.475 | 0.636 | 0.860 | 0.968 | 0.998 | 0.865 | ||
| LE2_001 | [-] | 284. | 284. | 280. | 292. | 287. | 3.99 | 4.22 | 0.571 | 0.630 | 0.867 | 0.962 | 0.999 | 0.865 |
Download Data |
Period Mean (original grids) [K] |
Model Period Mean (intersection) [K] |
Benchmark Period Mean (intersection) [K] |
Model Period Mean (complement) [K] |
Benchmark Period Mean (complement) [K] |
Bias [K] |
RMSE [K] |
Phase Shift [months] |
Bias Score [1] |
RMSE Score [1] |
Seasonal Cycle Score [1] |
Spatial Distribution Score [1] |
Overall Score [1] |
|||
|---|---|---|---|---|---|---|---|---|---|---|---|---|---|---|---|---|
| Benchmark | [-] | 269. | ||||||||||||||
| CESM3_092H | [-] | 272. | 272. | 269. | 278. | 3.85 | 4.46 | 0.367 | 0.699 | 0.815 | 0.975 | 0.998 | 0.860 | |||
| CMIP6_001 | [-] | 271. | 271. | 269. | 275. | 275. | 2.93 | 3.66 | 0.174 | 0.761 | 0.840 | 0.988 | 0.998 | 0.885 | ||
| LE2_001 | [-] | 271. | 271. | 269. | 276. | 275. | 3.02 | 3.75 | 0.159 | 0.755 | 0.837 | 0.989 | 0.996 | 0.883 |
Download Data |
Period Mean (original grids) [K] |
Model Period Mean (intersection) [K] |
Benchmark Period Mean (intersection) [K] |
Model Period Mean (complement) [K] |
Benchmark Period Mean (complement) [K] |
Bias [K] |
RMSE [K] |
Phase Shift [months] |
Bias Score [1] |
RMSE Score [1] |
Seasonal Cycle Score [1] |
Spatial Distribution Score [1] |
Overall Score [1] |
|||
|---|---|---|---|---|---|---|---|---|---|---|---|---|---|---|---|---|
| Benchmark | [-] | 276. | ||||||||||||||
| CESM3_092H | [-] | 281. | 281. | 276. | 286. | 279. | 5.02 | 5.40 | 0.757 | 0.525 | 0.798 | 0.949 | 0.988 | 0.812 | ||
| CMIP6_001 | [-] | 281. | 281. | 276. | 285. | 281. | 5.20 | 5.40 | 0.583 | 0.515 | 0.849 | 0.961 | 0.983 | 0.831 | ||
| LE2_001 | [-] | 281. | 281. | 276. | 285. | 281. | 5.09 | 5.35 | 0.671 | 0.523 | 0.833 | 0.955 | 0.986 | 0.826 |
Download Data |
Period Mean (original grids) [K] |
Model Period Mean (intersection) [K] |
Benchmark Period Mean (intersection) [K] |
Model Period Mean (complement) [K] |
Benchmark Period Mean (complement) [K] |
Bias [K] |
RMSE [K] |
Phase Shift [months] |
Bias Score [1] |
RMSE Score [1] |
Seasonal Cycle Score [1] |
Spatial Distribution Score [1] |
Overall Score [1] |
|||
|---|---|---|---|---|---|---|---|---|---|---|---|---|---|---|---|---|
| Benchmark | [-] | 294. | ||||||||||||||
| CESM3_092H | [-] | 296. | 296. | 294. | 298. | 296. | 2.59 | 2.87 | 2.96 | 0.0929 | 0.509 | 0.516 | 0.983 | 0.522 | ||
| CMIP6_001 | [-] | 295. | 295. | 294. | 298. | 295. | 1.50 | 2.04 | 2.73 | 0.267 | 0.430 | 0.558 | 0.959 | 0.529 | ||
| LE2_001 | [-] | 295. | 295. | 294. | 298. | 295. | 1.55 | 2.06 | 2.88 | 0.258 | 0.440 | 0.529 | 0.958 | 0.525 |
Download Data |
Period Mean (original grids) [K] |
Model Period Mean (intersection) [K] |
Benchmark Period Mean (intersection) [K] |
Model Period Mean (complement) [K] |
Benchmark Period Mean (complement) [K] |
Bias [K] |
RMSE [K] |
Phase Shift [months] |
Bias Score [1] |
RMSE Score [1] |
Seasonal Cycle Score [1] |
Spatial Distribution Score [1] |
Overall Score [1] |
|||
|---|---|---|---|---|---|---|---|---|---|---|---|---|---|---|---|---|
| Benchmark | [-] | 290. | ||||||||||||||
| CESM3_092H | [-] | 293. | 293. | 290. | 294. | 283. | 2.93 | 3.15 | 1.17 | 0.348 | 0.694 | 0.858 | 0.999 | 0.719 | ||
| CMIP6_001 | [-] | 293. | 293. | 290. | 293. | 288. | 2.69 | 2.90 | 1.03 | 0.391 | 0.713 | 0.876 | 1.00 | 0.739 | ||
| LE2_001 | [-] | 293. | 293. | 290. | 294. | 288. | 2.77 | 2.98 | 0.983 | 0.377 | 0.713 | 0.880 | 1.00 | 0.737 |
Download Data |
Period Mean (original grids) [K] |
Model Period Mean (intersection) [K] |
Benchmark Period Mean (intersection) [K] |
Model Period Mean (complement) [K] |
Benchmark Period Mean (complement) [K] |
Bias [K] |
RMSE [K] |
Phase Shift [months] |
Bias Score [1] |
RMSE Score [1] |
Seasonal Cycle Score [1] |
Spatial Distribution Score [1] |
Overall Score [1] |
|||
|---|---|---|---|---|---|---|---|---|---|---|---|---|---|---|---|---|
| Benchmark | [-] | 278. | ||||||||||||||
| CESM3_092H | [-] | 281. | 280. | 278. | 287. | 282. | 3.15 | 3.66 | 0.824 | 0.442 | 0.757 | 0.938 | 1.00 | 0.779 | ||
| CMIP6_001 | [-] | 281. | 281. | 278. | 286. | 281. | 3.26 | 3.71 | 0.625 | 0.452 | 0.763 | 0.939 | 0.999 | 0.783 | ||
| LE2_001 | [-] | 281. | 281. | 278. | 286. | 281. | 3.29 | 3.73 | 0.693 | 0.450 | 0.762 | 0.936 | 0.999 | 0.782 |
Temporally integrated period mean