Mean State
Download Data |
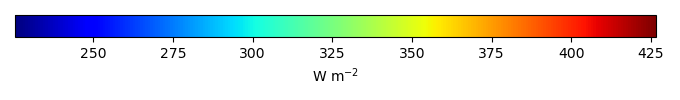
Period Mean (original grids) [W m-2] |
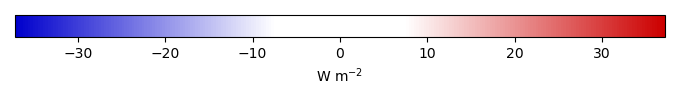
Bias [W m-2] |
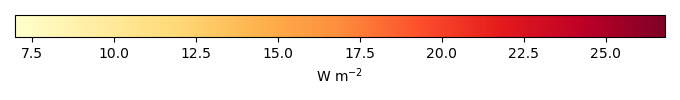
RMSE [W m-2] |
Phase Shift [months] |
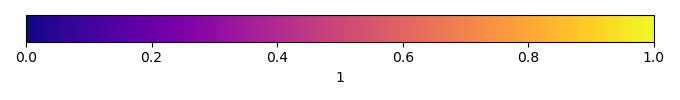
Bias Score [1] |
RMSE Score [1] |
Seasonal Cycle Score [1] |
Overall Score [1] |
|||
|---|---|---|---|---|---|---|---|---|---|---|---|
| Benchmark | [-] | 409. | |||||||||
| CESM3_092H | [-] | 427. | 18.3 | 20.6 | 5.57 | 0.115 | 0.376 | 0.0316 | 0.225 | ||
| CMIP6_001 | [-] | 427. | 18.1 | 20.7 | 5.57 | 0.105 | 0.380 | 0.0316 | 0.224 | ||
| LE2_001 | [-] | 427. | 18.2 | 20.8 | 5.07 | 0.105 | 0.394 | 0.122 | 0.253 |
Download Data |
Period Mean (original grids) [W m-2] |
Bias [W m-2] |
RMSE [W m-2] |
Phase Shift [months] |
Bias Score [1] |
RMSE Score [1] |
Seasonal Cycle Score [1] |
Overall Score [1] |
|||
|---|---|---|---|---|---|---|---|---|---|---|---|
| Benchmark | [-] | 377. | |||||||||
| CESM3_092H | [-] | 387. | 10.8 | 20.9 | 1.03 | 0.734 | 0.627 | 0.930 | 0.729 | ||
| CMIP6_001 | [-] | 390. | 14.0 | 23.2 | 1.02 | 0.686 | 0.635 | 0.932 | 0.722 | ||
| LE2_001 | [-] | 392. | 15.4 | 21.7 | 1.02 | 0.658 | 0.676 | 0.932 | 0.735 |
Download Data |
Period Mean (original grids) [W m-2] |
Bias [W m-2] |
RMSE [W m-2] |
Phase Shift [months] |
Bias Score [1] |
RMSE Score [1] |
Seasonal Cycle Score [1] |
Overall Score [1] |
|||
|---|---|---|---|---|---|---|---|---|---|---|---|
| Benchmark | [-] | 358. | |||||||||
| CESM3_092H | [-] | 363. | 5.05 | 13.4 | 0.00 | 0.844 | 0.658 | 1.00 | 0.790 | ||
| CMIP6_001 | [-] | 370. | 11.5 | 18.6 | 0.00 | 0.680 | 0.626 | 1.00 | 0.733 | ||
| LE2_001 | [-] | 371. | 13.3 | 19.0 | 0.00 | 0.640 | 0.630 | 1.00 | 0.725 |
Download Data |
Period Mean (original grids) [W m-2] |
Bias [W m-2] |
RMSE [W m-2] |
Phase Shift [months] |
Bias Score [1] |
RMSE Score [1] |
Seasonal Cycle Score [1] |
Overall Score [1] |
|||
|---|---|---|---|---|---|---|---|---|---|---|---|
| Benchmark | [-] | 247. | |||||||||
| CESM3_092H | [-] | 238. | -8.51 | 25.8 | 0.517 | 0.846 | 0.633 | 0.965 | 0.769 | ||
| CMIP6_001 | [-] | 248. | 1.35 | 19.7 | 0.00 | 0.874 | 0.712 | 1.00 | 0.825 | ||
| LE2_001 | [-] | 250. | 3.77 | 20.9 | 0.00 | 0.881 | 0.696 | 1.00 | 0.818 |
Download Data |
Period Mean (original grids) [W m-2] |
Bias [W m-2] |
RMSE [W m-2] |
Phase Shift [months] |
Bias Score [1] |
RMSE Score [1] |
Seasonal Cycle Score [1] |
Overall Score [1] |
|||
|---|---|---|---|---|---|---|---|---|---|---|---|
| Benchmark | [-] | 419. | |||||||||
| CESM3_092H | [-] | 428. | 8.73 | 12.4 | 6.05 | 0.136 | 0.156 | 7.41e-05 | 0.112 | ||
| CMIP6_001 | [-] | 427. | 8.63 | 13.2 | 5.10 | 0.139 | 0.103 | 0.0631 | 0.102 | ||
| LE2_001 | [-] | 427. | 8.33 | 13.7 | 5.10 | 0.149 | 0.103 | 0.0631 | 0.104 |
Download Data |
Period Mean (original grids) [W m-2] |
Bias [W m-2] |
RMSE [W m-2] |
Phase Shift [months] |
Bias Score [1] |
RMSE Score [1] |
Seasonal Cycle Score [1] |
Overall Score [1] |
|||
|---|---|---|---|---|---|---|---|---|---|---|---|
| Benchmark | [-] | 282. | |||||||||
| CESM3_092H | [-] | 291. | 8.48 | 20.9 | 0.00 | 0.816 | 0.642 | 1.00 | 0.775 | ||
| CMIP6_001 | [-] | 288. | 5.77 | 21.2 | 0.00 | 0.879 | 0.609 | 1.00 | 0.774 | ||
| LE2_001 | [-] | 290. | 8.01 | 19.7 | 0.00 | 0.830 | 0.646 | 1.00 | 0.780 |
Download Data |
Period Mean (original grids) [W m-2] |
Bias [W m-2] |
RMSE [W m-2] |
Phase Shift [months] |
Bias Score [1] |
RMSE Score [1] |
Seasonal Cycle Score [1] |
Overall Score [1] |
|||
|---|---|---|---|---|---|---|---|---|---|---|---|
| Benchmark | [-] | 279. | |||||||||
| CESM3_092H | [-] | 294. | 15.3 | 26.3 | 0.344 | 0.726 | 0.712 | 0.977 | 0.782 | ||
| CMIP6_001 | [-] | 290. | 11.4 | 22.1 | 0.172 | 0.763 | 0.748 | 0.988 | 0.812 | ||
| LE2_001 | [-] | 292. | 12.9 | 22.7 | 0.258 | 0.748 | 0.741 | 0.983 | 0.803 |
Download Data |
Period Mean (original grids) [W m-2] |
Bias [W m-2] |
RMSE [W m-2] |
Phase Shift [months] |
Bias Score [1] |
RMSE Score [1] |
Seasonal Cycle Score [1] |
Overall Score [1] |
|||
|---|---|---|---|---|---|---|---|---|---|---|---|
| Benchmark | [-] | 359. | |||||||||
| CESM3_092H | [-] | 362. | 2.58 | 21.1 | 0.407 | 0.646 | 0.550 | 0.969 | 0.678 | ||
| CMIP6_001 | [-] | 362. | 3.96 | 21.5 | 0.498 | 0.667 | 0.550 | 0.963 | 0.683 | ||
| LE2_001 | [-] | 361. | 2.23 | 20.0 | 0.548 | 0.682 | 0.558 | 0.959 | 0.689 |
Download Data |
Period Mean (original grids) [W m-2] |
Bias [W m-2] |
RMSE [W m-2] |
Phase Shift [months] |
Bias Score [1] |
RMSE Score [1] |
Seasonal Cycle Score [1] |
Overall Score [1] |
|||
|---|---|---|---|---|---|---|---|---|---|---|---|
| Benchmark | [-] | 311. | |||||||||
| CESM3_092H | [-] | 322. | 10.6 | 22.7 | 0.532 | 0.656 | 0.576 | 0.964 | 0.693 | ||
| CMIP6_001 | [-] | 316. | 4.83 | 20.8 | 0.358 | 0.706 | 0.587 | 0.969 | 0.712 | ||
| LE2_001 | [-] | 317. | 5.48 | 20.6 | 0.407 | 0.703 | 0.580 | 0.973 | 0.709 |
Download Data |
Period Mean (original grids) [W m-2] |
Bias [W m-2] |
RMSE [W m-2] |
Phase Shift [months] |
Bias Score [1] |
RMSE Score [1] |
Seasonal Cycle Score [1] |
Overall Score [1] |
|||
|---|---|---|---|---|---|---|---|---|---|---|---|
| Benchmark | [-] | 312. | |||||||||
| CESM3_092H | [-] | 320. | 7.54 | 22.9 | 0.535 | 0.698 | 0.577 | 0.951 | 0.701 | ||
| CMIP6_001 | [-] | 318. | 5.87 | 21.4 | 0.524 | 0.716 | 0.597 | 0.949 | 0.715 | ||
| LE2_001 | [-] | 318. | 6.29 | 21.3 | 0.495 | 0.712 | 0.597 | 0.954 | 0.715 |
Download Data |
Period Mean (original grids) [W m-2] |
Bias [W m-2] |
RMSE [W m-2] |
Phase Shift [months] |
Bias Score [1] |
RMSE Score [1] |
Seasonal Cycle Score [1] |
Overall Score [1] |
|||
|---|---|---|---|---|---|---|---|---|---|---|---|
| Benchmark | [-] | 249. | |||||||||
| CESM3_092H | [-] | 255. | 6.00 | 24.2 | 0.00 | 0.826 | 0.651 | 1.00 | 0.782 | ||
| CMIP6_001 | [-] | 264. | 14.8 | 26.6 | 0.00 | 0.764 | 0.679 | 1.00 | 0.781 | ||
| LE2_001 | [-] | 268. | 18.3 | 29.6 | 0.00 | 0.715 | 0.685 | 1.00 | 0.771 |
Download Data |
Period Mean (original grids) [W m-2] |
Bias [W m-2] |
RMSE [W m-2] |
Phase Shift [months] |
Bias Score [1] |
RMSE Score [1] |
Seasonal Cycle Score [1] |
Overall Score [1] |
|||
|---|---|---|---|---|---|---|---|---|---|---|---|
| Benchmark | [-] | 409. | |||||||||
| CESM3_092H | [-] | 429. | 20.3 | 21.4 | 2.05 | 0.0539 | 0.367 | 0.745 | 0.383 | ||
| CMIP6_001 | [-] | 424. | 15.0 | 18.1 | 2.05 | 0.115 | 0.327 | 0.745 | 0.379 | ||
| LE2_001 | [-] | 424. | 15.6 | 18.8 | 2.05 | 0.105 | 0.291 | 0.745 | 0.358 |
Download Data |
Period Mean (original grids) [W m-2] |
Bias [W m-2] |
RMSE [W m-2] |
Phase Shift [months] |
Bias Score [1] |
RMSE Score [1] |
Seasonal Cycle Score [1] |
Overall Score [1] |
|||
|---|---|---|---|---|---|---|---|---|---|---|---|
| Benchmark | [-] | 312. | |||||||||
| CESM3_092H | [-] | 315. | 2.67 | 23.6 | 0.251 | 0.818 | 0.648 | 0.983 | 0.774 | ||
| CMIP6_001 | [-] | 314. | 2.11 | 22.3 | 0.558 | 0.817 | 0.666 | 0.959 | 0.777 | ||
| LE2_001 | [-] | 314. | 2.26 | 22.4 | 0.279 | 0.816 | 0.661 | 0.978 | 0.779 |
Download Data |
Period Mean (original grids) [W m-2] |
Bias [W m-2] |
RMSE [W m-2] |
Phase Shift [months] |
Bias Score [1] |
RMSE Score [1] |
Seasonal Cycle Score [1] |
Overall Score [1] |
|||
|---|---|---|---|---|---|---|---|---|---|---|---|
| Benchmark | [-] | 266. | |||||||||
| CESM3_092H | [-] | 274. | 8.33 | 26.1 | 0.00 | 0.848 | 0.601 | 1.00 | 0.762 | ||
| CMIP6_001 | [-] | 277. | 11.1 | 21.7 | 0.00 | 0.803 | 0.704 | 1.00 | 0.803 | ||
| LE2_001 | [-] | 278. | 11.8 | 21.4 | 0.00 | 0.795 | 0.697 | 1.00 | 0.797 |
Download Data |
Period Mean (original grids) [W m-2] |
Bias [W m-2] |
RMSE [W m-2] |
Phase Shift [months] |
Bias Score [1] |
RMSE Score [1] |
Seasonal Cycle Score [1] |
Overall Score [1] |
|||
|---|---|---|---|---|---|---|---|---|---|---|---|
| Benchmark | [-] | 302. | |||||||||
| CESM3_092H | [-] | 308. | 6.13 | 23.2 | 0.812 | 0.652 | 0.485 | 0.945 | 0.642 | ||
| CMIP6_001 | [-] | 308. | 6.15 | 22.4 | 0.812 | 0.661 | 0.512 | 0.945 | 0.658 | ||
| LE2_001 | [-] | 309. | 6.95 | 22.7 | 0.812 | 0.656 | 0.527 | 0.945 | 0.664 |
Download Data |
Period Mean (original grids) [W m-2] |
Bias [W m-2] |
RMSE [W m-2] |
Phase Shift [months] |
Bias Score [1] |
RMSE Score [1] |
Seasonal Cycle Score [1] |
Overall Score [1] |
|||
|---|---|---|---|---|---|---|---|---|---|---|---|
| Benchmark | [-] | 415. | |||||||||
| CESM3_092H | [-] | 418. | 3.25 | 8.34 | 1.34 | 0.614 | 0.303 | 0.752 | 0.493 | ||
| CMIP6_001 | [-] | 418. | 2.72 | 10.4 | 1.34 | 0.575 | 0.222 | 0.752 | 0.442 | ||
| LE2_001 | [-] | 418. | 3.06 | 10.2 | 1.34 | 0.569 | 0.231 | 0.752 | 0.446 |
Download Data |
Period Mean (original grids) [W m-2] |
Bias [W m-2] |
RMSE [W m-2] |
Phase Shift [months] |
Bias Score [1] |
RMSE Score [1] |
Seasonal Cycle Score [1] |
Overall Score [1] |
|||
|---|---|---|---|---|---|---|---|---|---|---|---|
| Benchmark | [-] | 365. | |||||||||
| CESM3_092H | [-] | 371. | 6.81 | 21.0 | 0.00 | 0.785 | 0.503 | 1.00 | 0.698 | ||
| CMIP6_001 | [-] | 373. | 8.34 | 19.4 | 0.00 | 0.744 | 0.551 | 1.00 | 0.711 | ||
| LE2_001 | [-] | 374. | 9.17 | 19.7 | 0.00 | 0.722 | 0.514 | 1.00 | 0.688 |
Download Data |
Period Mean (original grids) [W m-2] |
Bias [W m-2] |
RMSE [W m-2] |
Phase Shift [months] |
Bias Score [1] |
RMSE Score [1] |
Seasonal Cycle Score [1] |
Overall Score [1] |
|||
|---|---|---|---|---|---|---|---|---|---|---|---|
| Benchmark | [-] | 318. | |||||||||
| CESM3_092H | [-] | 322. | 3.48 | 15.3 | 0.00 | 0.909 | 0.682 | 1.00 | 0.818 | ||
| CMIP6_001 | [-] | 327. | 9.03 | 16.6 | 0.00 | 0.780 | 0.680 | 1.00 | 0.785 | ||
| LE2_001 | [-] | 327. | 8.91 | 15.3 | 0.00 | 0.782 | 0.710 | 1.00 | 0.801 |
Temporally integrated period mean