Mean State
Download Data |
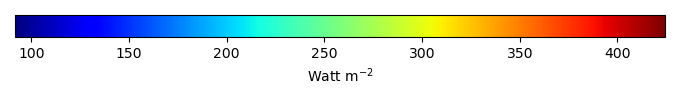
Period Mean (original grids) [Watt m-2] |
Model Period Mean (intersection) [Watt m-2] |
Benchmark Period Mean (intersection) [Watt m-2] |
Model Period Mean (complement) [Watt m-2] |
Benchmark Period Mean (complement) [Watt m-2] |
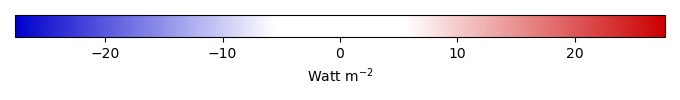
Bias [Watt m-2] |
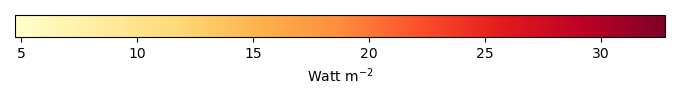
RMSE [Watt m-2] |
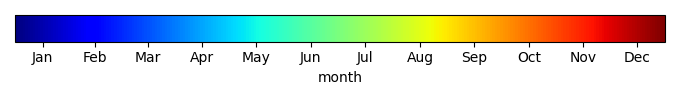
Phase Shift [months] |
Bias Score [1] |
RMSE Score [1] |
Seasonal Cycle Score [1] |
Spatial Distribution Score [1] |
Overall Score [1] |
|||
|---|---|---|---|---|---|---|---|---|---|---|---|---|---|---|---|---|
| Benchmark | [-] | 397. | ||||||||||||||
| CESM3_092H | [-] | 399. | 399. | 396. | 411. | 4.66 | 10.7 | 1.37 | 0.552 | 0.500 | 0.808 | 0.885 | 0.649 | |||
| CMIP6_001 | [-] | 405. | 405. | 396. | 408. | 9.74 | 12.1 | 0.992 | 0.368 | 0.563 | 0.873 | 0.972 | 0.668 | |||
| LE2_001 | [-] | 405. | 405. | 396. | 408. | 10.0 | 12.5 | 1.28 | 0.357 | 0.557 | 0.826 | 0.976 | 0.655 |
Download Data |
Period Mean (original grids) [Watt m-2] |
Model Period Mean (intersection) [Watt m-2] |
Benchmark Period Mean (intersection) [Watt m-2] |
Model Period Mean (complement) [Watt m-2] |
Benchmark Period Mean (complement) [Watt m-2] |
Bias [Watt m-2] |
RMSE [Watt m-2] |
Phase Shift [months] |
Bias Score [1] |
RMSE Score [1] |
Seasonal Cycle Score [1] |
Spatial Distribution Score [1] |
Overall Score [1] |
|||
|---|---|---|---|---|---|---|---|---|---|---|---|---|---|---|---|---|
| Benchmark | [-] | 384. | ||||||||||||||
| CESM3_092H | [-] | 388. | 388. | 384. | 409. | 4.12 | 14.9 | 1.01 | 0.772 | 0.588 | 0.899 | 0.957 | 0.761 | |||
| CMIP6_001 | [-] | 393. | 392. | 384. | 397. | 8.17 | 16.1 | 0.735 | 0.656 | 0.636 | 0.929 | 0.959 | 0.763 | |||
| LE2_001 | [-] | 393. | 392. | 384. | 397. | 8.46 | 16.4 | 0.724 | 0.650 | 0.637 | 0.928 | 0.961 | 0.762 |
Download Data |
Period Mean (original grids) [Watt m-2] |
Model Period Mean (intersection) [Watt m-2] |
Benchmark Period Mean (intersection) [Watt m-2] |
Model Period Mean (complement) [Watt m-2] |
Benchmark Period Mean (complement) [Watt m-2] |
Bias [Watt m-2] |
RMSE [Watt m-2] |
Phase Shift [months] |
Bias Score [1] |
RMSE Score [1] |
Seasonal Cycle Score [1] |
Spatial Distribution Score [1] |
Overall Score [1] |
|||
|---|---|---|---|---|---|---|---|---|---|---|---|---|---|---|---|---|
| Benchmark | [-] | 362. | ||||||||||||||
| CESM3_092H | [-] | 365. | 365. | 362. | 381. | 6.17 | 11.3 | 0.915 | 0.739 | 0.709 | 0.879 | 0.997 | 0.806 | |||
| CMIP6_001 | [-] | 371. | 371. | 361. | 382. | 11.6 | 14.8 | 1.00 | 0.620 | 0.719 | 0.871 | 1.00 | 0.786 | |||
| LE2_001 | [-] | 372. | 372. | 361. | 382. | 12.7 | 15.7 | 1.08 | 0.598 | 0.713 | 0.868 | 1.00 | 0.779 |
Download Data |
Period Mean (original grids) [Watt m-2] |
Model Period Mean (intersection) [Watt m-2] |
Benchmark Period Mean (intersection) [Watt m-2] |
Model Period Mean (complement) [Watt m-2] |
Benchmark Period Mean (complement) [Watt m-2] |
Bias [Watt m-2] |
RMSE [Watt m-2] |
Phase Shift [months] |
Bias Score [1] |
RMSE Score [1] |
Seasonal Cycle Score [1] |
Spatial Distribution Score [1] |
Overall Score [1] |
|||
|---|---|---|---|---|---|---|---|---|---|---|---|---|---|---|---|---|
| Benchmark | [-] | 239. | ||||||||||||||
| CESM3_092H | [-] | 243. | 243. | 239. | 248. | 7.39 | 18.3 | 0.116 | 0.861 | 0.732 | 0.992 | 0.990 | 0.862 | |||
| CMIP6_001 | [-] | 249. | 249. | 238. | 251. | 13.8 | 17.3 | 0.100 | 0.763 | 0.822 | 0.993 | 1.00 | 0.880 | |||
| LE2_001 | [-] | 251. | 251. | 238. | 251. | 15.4 | 18.1 | 0.0782 | 0.741 | 0.838 | 0.995 | 1.00 | 0.882 |
Download Data |
Period Mean (original grids) [Watt m-2] |
Model Period Mean (intersection) [Watt m-2] |
Benchmark Period Mean (intersection) [Watt m-2] |
Model Period Mean (complement) [Watt m-2] |
Benchmark Period Mean (complement) [Watt m-2] |
Bias [Watt m-2] |
RMSE [Watt m-2] |
Phase Shift [months] |
Bias Score [1] |
RMSE Score [1] |
Seasonal Cycle Score [1] |
Spatial Distribution Score [1] |
Overall Score [1] |
|||
|---|---|---|---|---|---|---|---|---|---|---|---|---|---|---|---|---|
| Benchmark | [-] | 411. | ||||||||||||||
| CESM3_092H | [-] | 422. | 422. | 411. | 416. | 14.1 | 14.7 | 1.66 | 0.113 | 0.591 | 0.741 | 1.00 | 0.607 | |||
| CMIP6_001 | [-] | 421. | 421. | 410. | 415. | 13.6 | 14.5 | 1.64 | 0.121 | 0.491 | 0.767 | 0.998 | 0.574 | |||
| LE2_001 | [-] | 421. | 421. | 410. | 415. | 13.4 | 14.3 | 1.76 | 0.127 | 0.499 | 0.742 | 0.998 | 0.573 |
Download Data |
Period Mean (original grids) [Watt m-2] |
Model Period Mean (intersection) [Watt m-2] |
Benchmark Period Mean (intersection) [Watt m-2] |
Model Period Mean (complement) [Watt m-2] |
Benchmark Period Mean (complement) [Watt m-2] |
Bias [Watt m-2] |
RMSE [Watt m-2] |
Phase Shift [months] |
Bias Score [1] |
RMSE Score [1] |
Seasonal Cycle Score [1] |
Spatial Distribution Score [1] |
Overall Score [1] |
|||
|---|---|---|---|---|---|---|---|---|---|---|---|---|---|---|---|---|
| Benchmark | [-] | 264. | ||||||||||||||
| CESM3_092H | [-] | 269. | 269. | 264. | 278. | 5.84 | 14.4 | 0.0400 | 0.879 | 0.810 | 0.997 | 0.944 | 0.888 | |||
| CMIP6_001 | [-] | 270. | 270. | 264. | 277. | 6.75 | 13.8 | 0.0257 | 0.863 | 0.822 | 0.998 | 0.997 | 0.900 | |||
| LE2_001 | [-] | 271. | 271. | 264. | 277. | 7.66 | 14.6 | 0.0336 | 0.853 | 0.814 | 0.998 | 0.994 | 0.895 |
Download Data |
Period Mean (original grids) [Watt m-2] |
Model Period Mean (intersection) [Watt m-2] |
Benchmark Period Mean (intersection) [Watt m-2] |
Model Period Mean (complement) [Watt m-2] |
Benchmark Period Mean (complement) [Watt m-2] |
Bias [Watt m-2] |
RMSE [Watt m-2] |
Phase Shift [months] |
Bias Score [1] |
RMSE Score [1] |
Seasonal Cycle Score [1] |
Spatial Distribution Score [1] |
Overall Score [1] |
|||
|---|---|---|---|---|---|---|---|---|---|---|---|---|---|---|---|---|
| Benchmark | [-] | 294. | ||||||||||||||
| CESM3_092H | [-] | 290. | 289. | 294. | 362. | -0.607 | 14.2 | 0.111 | 0.841 | 0.810 | 0.992 | 0.979 | 0.886 | |||
| CMIP6_001 | [-] | 289. | 288. | 294. | 349. | -2.17 | 13.1 | 0.126 | 0.846 | 0.830 | 0.990 | 0.986 | 0.897 | |||
| LE2_001 | [-] | 290. | 289. | 294. | 349. | -1.27 | 13.1 | 0.101 | 0.846 | 0.828 | 0.992 | 0.986 | 0.896 |
Download Data |
Period Mean (original grids) [Watt m-2] |
Model Period Mean (intersection) [Watt m-2] |
Benchmark Period Mean (intersection) [Watt m-2] |
Model Period Mean (complement) [Watt m-2] |
Benchmark Period Mean (complement) [Watt m-2] |
Bias [Watt m-2] |
RMSE [Watt m-2] |
Phase Shift [months] |
Bias Score [1] |
RMSE Score [1] |
Seasonal Cycle Score [1] |
Spatial Distribution Score [1] |
Overall Score [1] |
|||
|---|---|---|---|---|---|---|---|---|---|---|---|---|---|---|---|---|
| Benchmark | [-] | 379. | ||||||||||||||
| CESM3_092H | [-] | 375. | 375. | 379. | 409. | 3.89 | 15.9 | 0.611 | 0.693 | 0.674 | 0.947 | 0.963 | 0.790 | |||
| CMIP6_001 | [-] | 377. | 377. | 377. | 410. | 5.50 | 14.6 | 0.587 | 0.726 | 0.682 | 0.946 | 0.982 | 0.804 | |||
| LE2_001 | [-] | 377. | 378. | 377. | 410. | 5.81 | 14.7 | 0.586 | 0.722 | 0.681 | 0.951 | 0.983 | 0.804 |
Download Data |
Period Mean (original grids) [Watt m-2] |
Model Period Mean (intersection) [Watt m-2] |
Benchmark Period Mean (intersection) [Watt m-2] |
Model Period Mean (complement) [Watt m-2] |
Benchmark Period Mean (complement) [Watt m-2] |
Bias [Watt m-2] |
RMSE [Watt m-2] |
Phase Shift [months] |
Bias Score [1] |
RMSE Score [1] |
Seasonal Cycle Score [1] |
Spatial Distribution Score [1] |
Overall Score [1] |
|||
|---|---|---|---|---|---|---|---|---|---|---|---|---|---|---|---|---|
| Benchmark | [-] | 244. | ||||||||||||||
| CESM3_092H | [-] | 252. | 252. | 244. | 253. | 9.63 | 20.8 | 0.153 | 0.816 | 0.699 | 0.990 | 0.980 | 0.837 | |||
| CMIP6_001 | [-] | 259. | 259. | 244. | 248. | 16.1 | 19.5 | 0.220 | 0.721 | 0.805 | 0.985 | 0.988 | 0.861 | |||
| LE2_001 | [-] | 261. | 261. | 244. | 248. | 17.8 | 20.9 | 0.312 | 0.696 | 0.807 | 0.979 | 0.993 | 0.856 |
Download Data |
Period Mean (original grids) [Watt m-2] |
Model Period Mean (intersection) [Watt m-2] |
Benchmark Period Mean (intersection) [Watt m-2] |
Model Period Mean (complement) [Watt m-2] |
Benchmark Period Mean (complement) [Watt m-2] |
Bias [Watt m-2] |
RMSE [Watt m-2] |
Phase Shift [months] |
Bias Score [1] |
RMSE Score [1] |
Seasonal Cycle Score [1] |
Spatial Distribution Score [1] |
Overall Score [1] |
|||
|---|---|---|---|---|---|---|---|---|---|---|---|---|---|---|---|---|
| Benchmark | [-] | 351. | ||||||||||||||
| CESM3_092H | [-] | 354. | 354. | 351. | 371. | 4.49 | 9.63 | 0.385 | 0.811 | 0.807 | 0.975 | 0.977 | 0.875 | |||
| CMIP6_001 | [-] | 356. | 356. | 350. | 359. | 5.77 | 9.72 | 0.315 | 0.799 | 0.824 | 0.978 | 0.981 | 0.881 | |||
| LE2_001 | [-] | 354. | 354. | 350. | 359. | 4.52 | 9.53 | 0.483 | 0.818 | 0.803 | 0.968 | 0.988 | 0.876 |
Download Data |
Period Mean (original grids) [Watt m-2] |
Model Period Mean (intersection) [Watt m-2] |
Benchmark Period Mean (intersection) [Watt m-2] |
Model Period Mean (complement) [Watt m-2] |
Benchmark Period Mean (complement) [Watt m-2] |
Bias [Watt m-2] |
RMSE [Watt m-2] |
Phase Shift [months] |
Bias Score [1] |
RMSE Score [1] |
Seasonal Cycle Score [1] |
Spatial Distribution Score [1] |
Overall Score [1] |
|||
|---|---|---|---|---|---|---|---|---|---|---|---|---|---|---|---|---|
| Benchmark | [-] | 308. | ||||||||||||||
| CESM3_092H | [-] | 318. | 318. | 308. | 328. | 12.4 | 15.2 | 0.277 | 0.673 | 0.770 | 0.981 | 0.981 | 0.835 | |||
| CMIP6_001 | [-] | 313. | 313. | 307. | 324. | 8.17 | 13.0 | 0.320 | 0.755 | 0.768 | 0.977 | 0.963 | 0.846 | |||
| LE2_001 | [-] | 313. | 313. | 307. | 324. | 8.44 | 13.6 | 0.295 | 0.747 | 0.760 | 0.980 | 0.960 | 0.842 |
Download Data |
Period Mean (original grids) [Watt m-2] |
Model Period Mean (intersection) [Watt m-2] |
Benchmark Period Mean (intersection) [Watt m-2] |
Model Period Mean (complement) [Watt m-2] |
Benchmark Period Mean (complement) [Watt m-2] |
Bias [Watt m-2] |
RMSE [Watt m-2] |
Phase Shift [months] |
Bias Score [1] |
RMSE Score [1] |
Seasonal Cycle Score [1] |
Spatial Distribution Score [1] |
Overall Score [1] |
|||
|---|---|---|---|---|---|---|---|---|---|---|---|---|---|---|---|---|
| Benchmark | [-] | 313. | ||||||||||||||
| CESM3_092H | [-] | 310. | 310. | 313. | 371. | 2.15 | 14.5 | 0.631 | 0.726 | 0.686 | 0.921 | 0.995 | 0.803 | |||
| CMIP6_001 | [-] | 311. | 311. | 311. | 354. | 3.53 | 13.7 | 0.622 | 0.709 | 0.711 | 0.924 | 0.997 | 0.811 | |||
| LE2_001 | [-] | 312. | 312. | 311. | 354. | 3.92 | 14.0 | 0.651 | 0.706 | 0.709 | 0.922 | 0.997 | 0.809 |
Download Data |
Period Mean (original grids) [Watt m-2] |
Model Period Mean (intersection) [Watt m-2] |
Benchmark Period Mean (intersection) [Watt m-2] |
Model Period Mean (complement) [Watt m-2] |
Benchmark Period Mean (complement) [Watt m-2] |
Bias [Watt m-2] |
RMSE [Watt m-2] |
Phase Shift [months] |
Bias Score [1] |
RMSE Score [1] |
Seasonal Cycle Score [1] |
Spatial Distribution Score [1] |
Overall Score [1] |
|||
|---|---|---|---|---|---|---|---|---|---|---|---|---|---|---|---|---|
| Benchmark | [-] | 343. | ||||||||||||||
| CESM3_092H | [-] | 339. | 338. | 343. | 366. | -3.14 | 15.0 | 0.396 | 0.801 | 0.692 | 0.958 | 0.996 | 0.828 | |||
| CMIP6_001 | [-] | 335. | 335. | 343. | 361. | -6.63 | 13.6 | 0.924 | 0.775 | 0.746 | 0.902 | 0.999 | 0.834 | |||
| LE2_001 | [-] | 335. | 335. | 343. | 361. | -6.76 | 13.9 | 0.990 | 0.771 | 0.742 | 0.895 | 0.999 | 0.830 |
Download Data |
Period Mean (original grids) [Watt m-2] |
Model Period Mean (intersection) [Watt m-2] |
Benchmark Period Mean (intersection) [Watt m-2] |
Model Period Mean (complement) [Watt m-2] |
Benchmark Period Mean (complement) [Watt m-2] |
Bias [Watt m-2] |
RMSE [Watt m-2] |
Phase Shift [months] |
Bias Score [1] |
RMSE Score [1] |
Seasonal Cycle Score [1] |
Spatial Distribution Score [1] |
Overall Score [1] |
|||
|---|---|---|---|---|---|---|---|---|---|---|---|---|---|---|---|---|
| Benchmark | [-] | 244. | ||||||||||||||
| CESM3_092H | [-] | 252. | 252. | 244. | 248. | 7.76 | 22.6 | 0.236 | 0.841 | 0.646 | 0.984 | 1.00 | 0.823 | |||
| CMIP6_001 | [-] | 259. | 258. | 243. | 253. | 15.3 | 19.6 | 0.191 | 0.720 | 0.784 | 0.987 | 0.991 | 0.853 | |||
| LE2_001 | [-] | 260. | 260. | 243. | 253. | 17.0 | 20.7 | 0.313 | 0.695 | 0.790 | 0.979 | 0.989 | 0.849 |
Download Data |
Period Mean (original grids) [Watt m-2] |
Model Period Mean (intersection) [Watt m-2] |
Benchmark Period Mean (intersection) [Watt m-2] |
Model Period Mean (complement) [Watt m-2] |
Benchmark Period Mean (complement) [Watt m-2] |
Bias [Watt m-2] |
RMSE [Watt m-2] |
Phase Shift [months] |
Bias Score [1] |
RMSE Score [1] |
Seasonal Cycle Score [1] |
Spatial Distribution Score [1] |
Overall Score [1] |
|||
|---|---|---|---|---|---|---|---|---|---|---|---|---|---|---|---|---|
| Benchmark | [-] | 374. | ||||||||||||||
| CESM3_092H | [-] | 368. | 368. | 373. | 402. | 6.81 | 12.0 | 1.26 | 0.615 | 0.685 | 0.819 | 0.988 | 0.758 | |||
| CMIP6_001 | [-] | 369. | 369. | 369. | 398. | 7.66 | 12.1 | 1.34 | 0.633 | 0.709 | 0.803 | 0.999 | 0.771 | |||
| LE2_001 | [-] | 370. | 370. | 369. | 398. | 8.77 | 12.7 | 1.27 | 0.617 | 0.711 | 0.805 | 1.00 | 0.769 |
Download Data |
Period Mean (original grids) [Watt m-2] |
Model Period Mean (intersection) [Watt m-2] |
Benchmark Period Mean (intersection) [Watt m-2] |
Model Period Mean (complement) [Watt m-2] |
Benchmark Period Mean (complement) [Watt m-2] |
Bias [Watt m-2] |
RMSE [Watt m-2] |
Phase Shift [months] |
Bias Score [1] |
RMSE Score [1] |
Seasonal Cycle Score [1] |
Spatial Distribution Score [1] |
Overall Score [1] |
|||
|---|---|---|---|---|---|---|---|---|---|---|---|---|---|---|---|---|
| Benchmark | [-] | 332. | ||||||||||||||
| CESM3_092H | [-] | 330. | 330. | 332. | 381. | 2.08 | 15.1 | 0.471 | 0.915 | 0.709 | 0.968 | 0.997 | 0.860 | |||
| CMIP6_001 | [-] | 330. | 330. | 331. | 370. | 2.48 | 11.6 | 0.0956 | 0.908 | 0.779 | 0.994 | 0.993 | 0.891 | |||
| LE2_001 | [-] | 330. | 330. | 331. | 370. | 2.35 | 11.6 | 0.219 | 0.905 | 0.783 | 0.985 | 0.989 | 0.889 |
Download Data |
Period Mean (original grids) [Watt m-2] |
Model Period Mean (intersection) [Watt m-2] |
Benchmark Period Mean (intersection) [Watt m-2] |
Model Period Mean (complement) [Watt m-2] |
Benchmark Period Mean (complement) [Watt m-2] |
Bias [Watt m-2] |
RMSE [Watt m-2] |
Phase Shift [months] |
Bias Score [1] |
RMSE Score [1] |
Seasonal Cycle Score [1] |
Spatial Distribution Score [1] |
Overall Score [1] |
|||
|---|---|---|---|---|---|---|---|---|---|---|---|---|---|---|---|---|
| Benchmark | [-] | 277. | ||||||||||||||
| CESM3_092H | [-] | 279. | 279. | 277. | 308. | 4.82 | 15.9 | 0.132 | 0.858 | 0.729 | 0.991 | 0.986 | 0.858 | |||
| CMIP6_001 | [-] | 281. | 282. | 276. | 298. | 7.05 | 12.4 | 0.0963 | 0.835 | 0.820 | 0.994 | 0.998 | 0.893 | |||
| LE2_001 | [-] | 280. | 281. | 276. | 298. | 6.15 | 12.4 | 0.0624 | 0.848 | 0.807 | 0.996 | 0.995 | 0.890 |
Download Data |
Period Mean (original grids) [Watt m-2] |
Model Period Mean (intersection) [Watt m-2] |
Benchmark Period Mean (intersection) [Watt m-2] |
Model Period Mean (complement) [Watt m-2] |
Benchmark Period Mean (complement) [Watt m-2] |
Bias [Watt m-2] |
RMSE [Watt m-2] |
Phase Shift [months] |
Bias Score [1] |
RMSE Score [1] |
Seasonal Cycle Score [1] |
Spatial Distribution Score [1] |
Overall Score [1] |
|||
|---|---|---|---|---|---|---|---|---|---|---|---|---|---|---|---|---|
| Benchmark | [-] | 296. | ||||||||||||||
| CESM3_092H | [-] | 294. | 295. | 296. | 324. | 0.0447 | 11.5 | 0.544 | 0.868 | 0.758 | 0.963 | 1.00 | 0.869 | |||
| CMIP6_001 | [-] | 295. | 296. | 295. | 324. | 1.51 | 9.70 | 0.535 | 0.866 | 0.807 | 0.964 | 1.00 | 0.889 | |||
| LE2_001 | [-] | 296. | 297. | 295. | 324. | 2.38 | 10.6 | 0.452 | 0.862 | 0.784 | 0.970 | 1.00 | 0.880 |
Download Data |
Period Mean (original grids) [Watt m-2] |
Model Period Mean (intersection) [Watt m-2] |
Benchmark Period Mean (intersection) [Watt m-2] |
Model Period Mean (complement) [Watt m-2] |
Benchmark Period Mean (complement) [Watt m-2] |
Bias [Watt m-2] |
RMSE [Watt m-2] |
Phase Shift [months] |
Bias Score [1] |
RMSE Score [1] |
Seasonal Cycle Score [1] |
Spatial Distribution Score [1] |
Overall Score [1] |
|||
|---|---|---|---|---|---|---|---|---|---|---|---|---|---|---|---|---|
| Benchmark | [-] | 406. | ||||||||||||||
| CESM3_092H | [-] | 409. | 409. | 406. | 411. | 3.75 | 8.91 | 2.91 | 0.548 | 0.489 | 0.518 | 0.994 | 0.607 | |||
| CMIP6_001 | [-] | 409. | 410. | 405. | 410. | 4.59 | 11.1 | 2.93 | 0.509 | 0.412 | 0.515 | 1.00 | 0.570 | |||
| LE2_001 | [-] | 409. | 410. | 405. | 410. | 4.59 | 11.1 | 2.85 | 0.507 | 0.418 | 0.537 | 0.999 | 0.576 |
Download Data |
Period Mean (original grids) [Watt m-2] |
Model Period Mean (intersection) [Watt m-2] |
Benchmark Period Mean (intersection) [Watt m-2] |
Model Period Mean (complement) [Watt m-2] |
Benchmark Period Mean (complement) [Watt m-2] |
Bias [Watt m-2] |
RMSE [Watt m-2] |
Phase Shift [months] |
Bias Score [1] |
RMSE Score [1] |
Seasonal Cycle Score [1] |
Spatial Distribution Score [1] |
Overall Score [1] |
|||
|---|---|---|---|---|---|---|---|---|---|---|---|---|---|---|---|---|
| Benchmark | [-] | 376. | ||||||||||||||
| CESM3_092H | [-] | 375. | 374. | 376. | 372. | -0.980 | 11.7 | 1.51 | 0.807 | 0.607 | 0.794 | 0.992 | 0.762 | |||
| CMIP6_001 | [-] | 377. | 376. | 376. | 374. | 1.01 | 11.5 | 0.899 | 0.790 | 0.625 | 0.897 | 0.994 | 0.786 | |||
| LE2_001 | [-] | 377. | 376. | 376. | 374. | 0.893 | 11.4 | 0.887 | 0.789 | 0.631 | 0.904 | 0.994 | 0.790 |
Download Data |
Period Mean (original grids) [Watt m-2] |
Model Period Mean (intersection) [Watt m-2] |
Benchmark Period Mean (intersection) [Watt m-2] |
Model Period Mean (complement) [Watt m-2] |
Benchmark Period Mean (complement) [Watt m-2] |
Bias [Watt m-2] |
RMSE [Watt m-2] |
Phase Shift [months] |
Bias Score [1] |
RMSE Score [1] |
Seasonal Cycle Score [1] |
Spatial Distribution Score [1] |
Overall Score [1] |
|||
|---|---|---|---|---|---|---|---|---|---|---|---|---|---|---|---|---|
| Benchmark | [-] | 307. | ||||||||||||||
| CESM3_092H | [-] | 301. | 300. | 306. | 347. | 0.156 | 18.8 | 0.791 | 0.503 | 0.624 | 0.931 | 0.988 | 0.734 | |||
| CMIP6_001 | [-] | 300. | 300. | 303. | 340. | 1.47 | 17.7 | 0.567 | 0.528 | 0.659 | 0.959 | 0.964 | 0.754 | |||
| LE2_001 | [-] | 301. | 300. | 303. | 340. | 1.72 | 17.9 | 0.676 | 0.524 | 0.660 | 0.951 | 0.965 | 0.752 |
Temporally integrated period mean