Mean State
Download Data |
Period Mean (original grids) [mm d-1] |
Model Period Mean (intersection) [mm d-1] |
Benchmark Period Mean (intersection) [mm d-1] |
Model Period Mean (complement) [mm d-1] |
Benchmark Period Mean (complement) [mm d-1] |
Bias [mm d-1] |
RMSE [mm d-1] |
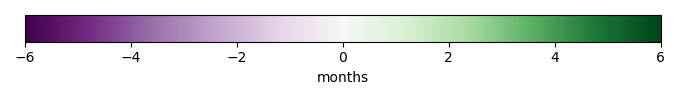
Phase Shift [months] |
Bias Score [1] |
RMSE Score [1] |
Seasonal Cycle Score [1] |
Spatial Distribution Score [1] |
Overall Score [1] |
|||
|---|---|---|---|---|---|---|---|---|---|---|---|---|---|---|---|---|
| Benchmark | [-] | 2.78 | ||||||||||||||
| CESM3_092H | [-] | 2.61 | 2.62 | 2.78 | 2.71 | 5.05 | -0.190 | 0.591 | 2.61 | 0.596 | 0.733 | 0.575 | 0.927 | 0.713 | ||
| CMIP6_001 | [-] | 2.56 | 2.57 | 2.78 | 2.81 | 3.97 | -0.214 | 0.629 | 2.95 | 0.579 | 0.694 | 0.509 | 0.940 | 0.683 | ||
| LE2_001 | [-] | 2.58 | 2.59 | 2.78 | 2.82 | 3.97 | -0.195 | 0.654 | 3.31 | 0.555 | 0.679 | 0.443 | 0.922 | 0.656 |
Download Data |
Period Mean (original grids) [mm d-1] |
Model Period Mean (intersection) [mm d-1] |
Benchmark Period Mean (intersection) [mm d-1] |
Model Period Mean (complement) [mm d-1] |
Benchmark Period Mean (complement) [mm d-1] |
Bias [mm d-1] |
RMSE [mm d-1] |
Phase Shift [months] |
Bias Score [1] |
RMSE Score [1] |
Seasonal Cycle Score [1] |
Spatial Distribution Score [1] |
Overall Score [1] |
|||
|---|---|---|---|---|---|---|---|---|---|---|---|---|---|---|---|---|
| Benchmark | [-] | 1.69 | ||||||||||||||
| CESM3_092H | [-] | 2.05 | 2.03 | 1.69 | 1.82 | 4.50 | 0.331 | 0.767 | 1.19 | 0.490 | 0.563 | 0.835 | 0.840 | 0.658 | ||
| CMIP6_001 | [-] | 1.70 | 1.68 | 1.69 | 1.76 | 4.49 | -0.0129 | 0.581 | 1.52 | 0.740 | 0.602 | 0.787 | 0.980 | 0.742 | ||
| LE2_001 | [-] | 1.72 | 1.69 | 1.69 | 1.76 | 4.49 | 0.00473 | 0.589 | 1.52 | 0.735 | 0.597 | 0.789 | 0.980 | 0.739 |
Download Data |
Period Mean (original grids) [mm d-1] |
Model Period Mean (intersection) [mm d-1] |
Benchmark Period Mean (intersection) [mm d-1] |
Model Period Mean (complement) [mm d-1] |
Benchmark Period Mean (complement) [mm d-1] |
Bias [mm d-1] |
RMSE [mm d-1] |
Phase Shift [months] |
Bias Score [1] |
RMSE Score [1] |
Seasonal Cycle Score [1] |
Spatial Distribution Score [1] |
Overall Score [1] |
|||
|---|---|---|---|---|---|---|---|---|---|---|---|---|---|---|---|---|
| Benchmark | [-] | 1.93 | ||||||||||||||
| CESM3_092H | [-] | 1.92 | 1.91 | 1.92 | 2.00 | 4.30 | -0.0178 | 0.699 | 1.13 | 0.577 | 0.643 | 0.860 | 0.897 | 0.724 | ||
| CMIP6_001 | [-] | 2.06 | 2.05 | 1.92 | 2.24 | 3.54 | 0.130 | 0.760 | 1.15 | 0.545 | 0.593 | 0.853 | 0.943 | 0.705 | ||
| LE2_001 | [-] | 2.08 | 2.07 | 1.92 | 2.24 | 3.54 | 0.150 | 0.777 | 1.07 | 0.522 | 0.595 | 0.860 | 0.930 | 0.700 |
Download Data |
Period Mean (original grids) [mm d-1] |
Model Period Mean (intersection) [mm d-1] |
Benchmark Period Mean (intersection) [mm d-1] |
Model Period Mean (complement) [mm d-1] |
Benchmark Period Mean (complement) [mm d-1] |
Bias [mm d-1] |
RMSE [mm d-1] |
Phase Shift [months] |
Bias Score [1] |
RMSE Score [1] |
Seasonal Cycle Score [1] |
Spatial Distribution Score [1] |
Overall Score [1] |
|||
|---|---|---|---|---|---|---|---|---|---|---|---|---|---|---|---|---|
| Benchmark | [-] | 0.676 | ||||||||||||||
| CESM3_092H | [-] | 0.635 | 0.637 | 0.678 | 0.619 | -0.0483 | 0.227 | 0.372 | 0.700 | 0.584 | 0.975 | 0.991 | 0.767 | |||
| CMIP6_001 | [-] | 0.475 | 0.480 | 0.676 | 0.414 | 0.670 | -0.203 | 0.417 | 0.303 | 0.333 | 0.307 | 0.980 | 0.982 | 0.582 | ||
| LE2_001 | [-] | 0.466 | 0.471 | 0.676 | 0.406 | 0.670 | -0.212 | 0.429 | 0.263 | 0.311 | 0.289 | 0.983 | 0.981 | 0.571 |
Download Data |
Period Mean (original grids) [mm d-1] |
Model Period Mean (intersection) [mm d-1] |
Benchmark Period Mean (intersection) [mm d-1] |
Model Period Mean (complement) [mm d-1] |
Benchmark Period Mean (complement) [mm d-1] |
Bias [mm d-1] |
RMSE [mm d-1] |
Phase Shift [months] |
Bias Score [1] |
RMSE Score [1] |
Seasonal Cycle Score [1] |
Spatial Distribution Score [1] |
Overall Score [1] |
|||
|---|---|---|---|---|---|---|---|---|---|---|---|---|---|---|---|---|
| Benchmark | [-] | 4.09 | ||||||||||||||
| CESM3_092H | [-] | 3.44 | 3.40 | 4.09 | 3.60 | 4.81 | -0.628 | 0.751 | 2.09 | 0.332 | 0.752 | 0.674 | 0.788 | 0.660 | ||
| CMIP6_001 | [-] | 3.32 | 3.28 | 4.05 | 3.53 | 4.58 | -0.706 | 0.817 | 2.45 | 0.280 | 0.762 | 0.604 | 0.835 | 0.648 | ||
| LE2_001 | [-] | 3.27 | 3.24 | 4.05 | 3.49 | 4.58 | -0.754 | 0.852 | 2.23 | 0.261 | 0.761 | 0.640 | 0.906 | 0.666 |
Download Data |
Period Mean (original grids) [mm d-1] |
Model Period Mean (intersection) [mm d-1] |
Benchmark Period Mean (intersection) [mm d-1] |
Model Period Mean (complement) [mm d-1] |
Benchmark Period Mean (complement) [mm d-1] |
Bias [mm d-1] |
RMSE [mm d-1] |
Phase Shift [months] |
Bias Score [1] |
RMSE Score [1] |
Seasonal Cycle Score [1] |
Spatial Distribution Score [1] |
Overall Score [1] |
|||
|---|---|---|---|---|---|---|---|---|---|---|---|---|---|---|---|---|
| Benchmark | [-] | 1.12 | ||||||||||||||
| CESM3_092H | [-] | 1.17 | 1.17 | 1.12 | 1.25 | 1.41 | 0.0508 | 0.254 | 0.357 | 0.652 | 0.624 | 0.976 | 0.993 | 0.774 | ||
| CMIP6_001 | [-] | 0.975 | 0.973 | 1.12 | 1.04 | 1.54 | -0.147 | 0.385 | 0.421 | 0.440 | 0.414 | 0.972 | 0.992 | 0.647 | ||
| LE2_001 | [-] | 0.987 | 0.984 | 1.12 | 1.05 | 1.54 | -0.135 | 0.366 | 0.402 | 0.468 | 0.442 | 0.973 | 0.995 | 0.664 |
Download Data |
Period Mean (original grids) [mm d-1] |
Model Period Mean (intersection) [mm d-1] |
Benchmark Period Mean (intersection) [mm d-1] |
Model Period Mean (complement) [mm d-1] |
Benchmark Period Mean (complement) [mm d-1] |
Bias [mm d-1] |
RMSE [mm d-1] |
Phase Shift [months] |
Bias Score [1] |
RMSE Score [1] |
Seasonal Cycle Score [1] |
Spatial Distribution Score [1] |
Overall Score [1] |
|||
|---|---|---|---|---|---|---|---|---|---|---|---|---|---|---|---|---|
| Benchmark | [-] | 1.04 | ||||||||||||||
| CESM3_092H | [-] | 1.26 | 1.24 | 1.04 | 2.10 | 2.44 | 0.222 | 0.529 | 0.730 | 0.472 | 0.522 | 0.925 | 0.964 | 0.681 | ||
| CMIP6_001 | [-] | 1.16 | 1.14 | 1.04 | 1.86 | 2.44 | 0.123 | 0.513 | 0.697 | 0.486 | 0.543 | 0.933 | 0.936 | 0.688 | ||
| LE2_001 | [-] | 1.17 | 1.15 | 1.04 | 1.87 | 2.44 | 0.134 | 0.524 | 0.733 | 0.472 | 0.536 | 0.930 | 0.936 | 0.682 |
Download Data |
Period Mean (original grids) [mm d-1] |
Model Period Mean (intersection) [mm d-1] |
Benchmark Period Mean (intersection) [mm d-1] |
Model Period Mean (complement) [mm d-1] |
Benchmark Period Mean (complement) [mm d-1] |
Bias [mm d-1] |
RMSE [mm d-1] |
Phase Shift [months] |
Bias Score [1] |
RMSE Score [1] |
Seasonal Cycle Score [1] |
Spatial Distribution Score [1] |
Overall Score [1] |
|||
|---|---|---|---|---|---|---|---|---|---|---|---|---|---|---|---|---|
| Benchmark | [-] | 2.01 | ||||||||||||||
| CESM3_092H | [-] | 1.99 | 1.96 | 2.02 | 2.64 | 4.52 | 0.0362 | 0.728 | 1.72 | 0.546 | 0.561 | 0.745 | 0.923 | 0.667 | ||
| CMIP6_001 | [-] | 1.99 | 1.95 | 1.99 | 2.65 | 4.28 | 0.0470 | 0.737 | 1.87 | 0.535 | 0.554 | 0.722 | 0.928 | 0.659 | ||
| LE2_001 | [-] | 1.98 | 1.95 | 1.99 | 2.63 | 4.28 | 0.0406 | 0.752 | 1.89 | 0.536 | 0.539 | 0.716 | 0.932 | 0.653 |
Download Data |
Period Mean (original grids) [mm d-1] |
Model Period Mean (intersection) [mm d-1] |
Benchmark Period Mean (intersection) [mm d-1] |
Model Period Mean (complement) [mm d-1] |
Benchmark Period Mean (complement) [mm d-1] |
Bias [mm d-1] |
RMSE [mm d-1] |
Phase Shift [months] |
Bias Score [1] |
RMSE Score [1] |
Seasonal Cycle Score [1] |
Spatial Distribution Score [1] |
Overall Score [1] |
|||
|---|---|---|---|---|---|---|---|---|---|---|---|---|---|---|---|---|
| Benchmark | [-] | 0.591 | ||||||||||||||
| CESM3_092H | [-] | 0.684 | 0.698 | 0.592 | 0.526 | 0.0906 | 0.203 | 0.0698 | 0.582 | 0.668 | 0.995 | 0.972 | 0.777 | |||
| CMIP6_001 | [-] | 0.411 | 0.421 | 0.591 | 0.286 | 0.481 | -0.177 | 0.449 | 0.302 | 0.349 | 0.219 | 0.979 | 0.987 | 0.551 | ||
| LE2_001 | [-] | 0.431 | 0.442 | 0.591 | 0.305 | 0.481 | -0.155 | 0.416 | 0.250 | 0.415 | 0.249 | 0.983 | 0.990 | 0.577 |
Download Data |
Period Mean (original grids) [mm d-1] |
Model Period Mean (intersection) [mm d-1] |
Benchmark Period Mean (intersection) [mm d-1] |
Model Period Mean (complement) [mm d-1] |
Benchmark Period Mean (complement) [mm d-1] |
Bias [mm d-1] |
RMSE [mm d-1] |
Phase Shift [months] |
Bias Score [1] |
RMSE Score [1] |
Seasonal Cycle Score [1] |
Spatial Distribution Score [1] |
Overall Score [1] |
|||
|---|---|---|---|---|---|---|---|---|---|---|---|---|---|---|---|---|
| Benchmark | [-] | 1.21 | ||||||||||||||
| CESM3_092H | [-] | 1.46 | 1.44 | 1.21 | 1.83 | 3.34 | 0.279 | 0.688 | 0.780 | 0.431 | 0.691 | 0.914 | 0.804 | 0.706 | ||
| CMIP6_001 | [-] | 1.27 | 1.25 | 1.18 | 1.83 | 3.66 | 0.108 | 0.553 | 0.819 | 0.576 | 0.714 | 0.910 | 0.794 | 0.742 | ||
| LE2_001 | [-] | 1.23 | 1.20 | 1.18 | 1.82 | 3.66 | 0.0655 | 0.542 | 0.798 | 0.594 | 0.710 | 0.910 | 0.845 | 0.754 |
Download Data |
Period Mean (original grids) [mm d-1] |
Model Period Mean (intersection) [mm d-1] |
Benchmark Period Mean (intersection) [mm d-1] |
Model Period Mean (complement) [mm d-1] |
Benchmark Period Mean (complement) [mm d-1] |
Bias [mm d-1] |
RMSE [mm d-1] |
Phase Shift [months] |
Bias Score [1] |
RMSE Score [1] |
Seasonal Cycle Score [1] |
Spatial Distribution Score [1] |
Overall Score [1] |
|||
|---|---|---|---|---|---|---|---|---|---|---|---|---|---|---|---|---|
| Benchmark | [-] | 1.37 | ||||||||||||||
| CESM3_092H | [-] | 1.35 | 1.35 | 1.37 | 1.31 | 1.93 | -0.0249 | 0.467 | 0.575 | 0.576 | 0.589 | 0.960 | 0.939 | 0.730 | ||
| CMIP6_001 | [-] | 1.21 | 1.21 | 1.36 | 1.19 | 1.84 | -0.143 | 0.496 | 0.560 | 0.554 | 0.547 | 0.960 | 0.957 | 0.713 | ||
| LE2_001 | [-] | 1.21 | 1.21 | 1.36 | 1.18 | 1.84 | -0.146 | 0.498 | 0.580 | 0.561 | 0.545 | 0.959 | 0.953 | 0.712 |
Download Data |
Period Mean (original grids) [mm d-1] |
Model Period Mean (intersection) [mm d-1] |
Benchmark Period Mean (intersection) [mm d-1] |
Model Period Mean (complement) [mm d-1] |
Benchmark Period Mean (complement) [mm d-1] |
Bias [mm d-1] |
RMSE [mm d-1] |
Phase Shift [months] |
Bias Score [1] |
RMSE Score [1] |
Seasonal Cycle Score [1] |
Spatial Distribution Score [1] |
Overall Score [1] |
|||
|---|---|---|---|---|---|---|---|---|---|---|---|---|---|---|---|---|
| Benchmark | [-] | 1.35 | ||||||||||||||
| CESM3_092H | [-] | 1.37 | 1.36 | 1.35 | 1.71 | 3.29 | 0.0285 | 0.510 | 1.02 | 0.544 | 0.611 | 0.873 | 0.958 | 0.720 | ||
| CMIP6_001 | [-] | 1.27 | 1.26 | 1.34 | 1.56 | 2.96 | -0.0576 | 0.509 | 1.06 | 0.527 | 0.573 | 0.865 | 0.963 | 0.700 | ||
| LE2_001 | [-] | 1.27 | 1.26 | 1.34 | 1.56 | 2.96 | -0.0559 | 0.514 | 1.05 | 0.524 | 0.572 | 0.865 | 0.962 | 0.699 |
Download Data |
Period Mean (original grids) [mm d-1] |
Model Period Mean (intersection) [mm d-1] |
Benchmark Period Mean (intersection) [mm d-1] |
Model Period Mean (complement) [mm d-1] |
Benchmark Period Mean (complement) [mm d-1] |
Bias [mm d-1] |
RMSE [mm d-1] |
Phase Shift [months] |
Bias Score [1] |
RMSE Score [1] |
Seasonal Cycle Score [1] |
Spatial Distribution Score [1] |
Overall Score [1] |
|||
|---|---|---|---|---|---|---|---|---|---|---|---|---|---|---|---|---|
| Benchmark | [-] | 0.340 | ||||||||||||||
| CESM3_092H | [-] | 0.431 | 0.429 | 0.341 | 0.703 | 3.87 | 0.0972 | 0.417 | 1.46 | 0.700 | 0.771 | 0.799 | 0.630 | 0.734 | ||
| CMIP6_001 | [-] | 0.335 | 0.332 | 0.329 | 0.680 | 2.70 | 0.0144 | 0.339 | 1.65 | 0.791 | 0.790 | 0.774 | 0.642 | 0.757 | ||
| LE2_001 | [-] | 0.343 | 0.340 | 0.329 | 0.690 | 2.70 | 0.0232 | 0.344 | 1.63 | 0.786 | 0.786 | 0.769 | 0.649 | 0.755 |
Download Data |
Period Mean (original grids) [mm d-1] |
Model Period Mean (intersection) [mm d-1] |
Benchmark Period Mean (intersection) [mm d-1] |
Model Period Mean (complement) [mm d-1] |
Benchmark Period Mean (complement) [mm d-1] |
Bias [mm d-1] |
RMSE [mm d-1] |
Phase Shift [months] |
Bias Score [1] |
RMSE Score [1] |
Seasonal Cycle Score [1] |
Spatial Distribution Score [1] |
Overall Score [1] |
|||
|---|---|---|---|---|---|---|---|---|---|---|---|---|---|---|---|---|
| Benchmark | [-] | 0.694 | ||||||||||||||
| CESM3_092H | [-] | 0.683 | 0.691 | 0.695 | 0.555 | -0.0324 | 0.340 | 0.389 | 0.593 | 0.387 | 0.974 | 0.973 | 0.663 | |||
| CMIP6_001 | [-] | 0.499 | 0.508 | 0.694 | 0.388 | 0.644 | -0.199 | 0.496 | 0.528 | 0.305 | 0.197 | 0.963 | 0.984 | 0.530 | ||
| LE2_001 | [-] | 0.506 | 0.515 | 0.694 | 0.391 | 0.644 | -0.192 | 0.491 | 0.475 | 0.318 | 0.206 | 0.967 | 0.984 | 0.536 |
Download Data |
Period Mean (original grids) [mm d-1] |
Model Period Mean (intersection) [mm d-1] |
Benchmark Period Mean (intersection) [mm d-1] |
Model Period Mean (complement) [mm d-1] |
Benchmark Period Mean (complement) [mm d-1] |
Bias [mm d-1] |
RMSE [mm d-1] |
Phase Shift [months] |
Bias Score [1] |
RMSE Score [1] |
Seasonal Cycle Score [1] |
Spatial Distribution Score [1] |
Overall Score [1] |
|||
|---|---|---|---|---|---|---|---|---|---|---|---|---|---|---|---|---|
| Benchmark | [-] | 2.38 | ||||||||||||||
| CESM3_092H | [-] | 2.24 | 2.24 | 2.36 | 2.31 | 4.47 | -0.0967 | 0.965 | 1.49 | 0.404 | 0.559 | 0.793 | 0.765 | 0.616 | ||
| CMIP6_001 | [-] | 2.08 | 2.10 | 2.33 | 2.01 | 4.12 | -0.166 | 1.01 | 2.00 | 0.394 | 0.504 | 0.705 | 0.864 | 0.594 | ||
| LE2_001 | [-] | 2.09 | 2.11 | 2.33 | 2.03 | 4.12 | -0.153 | 0.996 | 1.91 | 0.397 | 0.510 | 0.720 | 0.863 | 0.600 |
Download Data |
Period Mean (original grids) [mm d-1] |
Model Period Mean (intersection) [mm d-1] |
Benchmark Period Mean (intersection) [mm d-1] |
Model Period Mean (complement) [mm d-1] |
Benchmark Period Mean (complement) [mm d-1] |
Bias [mm d-1] |
RMSE [mm d-1] |
Phase Shift [months] |
Bias Score [1] |
RMSE Score [1] |
Seasonal Cycle Score [1] |
Spatial Distribution Score [1] |
Overall Score [1] |
|||
|---|---|---|---|---|---|---|---|---|---|---|---|---|---|---|---|---|
| Benchmark | [-] | 2.04 | ||||||||||||||
| CESM3_092H | [-] | 1.95 | 1.95 | 2.04 | 2.21 | 3.40 | -0.0649 | 0.478 | 0.731 | 0.644 | 0.517 | 0.948 | 0.931 | 0.711 | ||
| CMIP6_001 | [-] | 1.77 | 1.76 | 2.03 | 2.04 | 3.76 | -0.240 | 0.554 | 0.687 | 0.500 | 0.492 | 0.948 | 0.961 | 0.679 | ||
| LE2_001 | [-] | 1.75 | 1.75 | 2.03 | 2.03 | 3.76 | -0.252 | 0.573 | 0.693 | 0.490 | 0.477 | 0.946 | 0.951 | 0.668 |
Download Data |
Period Mean (original grids) [mm d-1] |
Model Period Mean (intersection) [mm d-1] |
Benchmark Period Mean (intersection) [mm d-1] |
Model Period Mean (complement) [mm d-1] |
Benchmark Period Mean (complement) [mm d-1] |
Bias [mm d-1] |
RMSE [mm d-1] |
Phase Shift [months] |
Bias Score [1] |
RMSE Score [1] |
Seasonal Cycle Score [1] |
Spatial Distribution Score [1] |
Overall Score [1] |
|||
|---|---|---|---|---|---|---|---|---|---|---|---|---|---|---|---|---|
| Benchmark | [-] | 1.38 | ||||||||||||||
| CESM3_092H | [-] | 1.33 | 1.33 | 1.38 | 1.54 | -0.0512 | 0.441 | 0.461 | 0.556 | 0.450 | 0.969 | 0.888 | 0.663 | |||
| CMIP6_001 | [-] | 1.10 | 1.09 | 1.38 | 1.27 | 1.72 | -0.283 | 0.589 | 0.423 | 0.345 | 0.337 | 0.971 | 0.816 | 0.561 | ||
| LE2_001 | [-] | 1.11 | 1.10 | 1.38 | 1.28 | 1.72 | -0.275 | 0.590 | 0.432 | 0.345 | 0.333 | 0.970 | 0.809 | 0.558 |
Download Data |
Period Mean (original grids) [mm d-1] |
Model Period Mean (intersection) [mm d-1] |
Benchmark Period Mean (intersection) [mm d-1] |
Model Period Mean (complement) [mm d-1] |
Benchmark Period Mean (complement) [mm d-1] |
Bias [mm d-1] |
RMSE [mm d-1] |
Phase Shift [months] |
Bias Score [1] |
RMSE Score [1] |
Seasonal Cycle Score [1] |
Spatial Distribution Score [1] |
Overall Score [1] |
|||
|---|---|---|---|---|---|---|---|---|---|---|---|---|---|---|---|---|
| Benchmark | [-] | 1.05 | ||||||||||||||
| CESM3_092H | [-] | 1.19 | 1.20 | 1.05 | 1.43 | 0.148 | 0.586 | 0.978 | 0.466 | 0.552 | 0.899 | 0.568 | 0.608 | |||
| CMIP6_001 | [-] | 0.989 | 0.997 | 1.05 | 1.12 | 2.75 | -0.0468 | 0.545 | 1.01 | 0.573 | 0.582 | 0.895 | 0.491 | 0.624 | ||
| LE2_001 | [-] | 1.01 | 1.02 | 1.05 | 1.16 | 2.75 | -0.0254 | 0.558 | 1.02 | 0.560 | 0.571 | 0.891 | 0.491 | 0.617 |
Download Data |
Period Mean (original grids) [mm d-1] |
Model Period Mean (intersection) [mm d-1] |
Benchmark Period Mean (intersection) [mm d-1] |
Model Period Mean (complement) [mm d-1] |
Benchmark Period Mean (complement) [mm d-1] |
Bias [mm d-1] |
RMSE [mm d-1] |
Phase Shift [months] |
Bias Score [1] |
RMSE Score [1] |
Seasonal Cycle Score [1] |
Spatial Distribution Score [1] |
Overall Score [1] |
|||
|---|---|---|---|---|---|---|---|---|---|---|---|---|---|---|---|---|
| Benchmark | [-] | 3.69 | ||||||||||||||
| CESM3_092H | [-] | 3.09 | 3.10 | 3.69 | 2.80 | 4.90 | -0.614 | 0.864 | 2.02 | 0.386 | 0.634 | 0.693 | 0.984 | 0.666 | ||
| CMIP6_001 | [-] | 3.27 | 3.27 | 3.68 | 3.02 | 4.50 | -0.419 | 0.717 | 2.15 | 0.436 | 0.698 | 0.666 | 0.899 | 0.679 | ||
| LE2_001 | [-] | 3.27 | 3.27 | 3.68 | 3.02 | 4.50 | -0.421 | 0.722 | 2.06 | 0.433 | 0.694 | 0.682 | 0.909 | 0.683 |
Download Data |
Period Mean (original grids) [mm d-1] |
Model Period Mean (intersection) [mm d-1] |
Benchmark Period Mean (intersection) [mm d-1] |
Model Period Mean (complement) [mm d-1] |
Benchmark Period Mean (complement) [mm d-1] |
Bias [mm d-1] |
RMSE [mm d-1] |
Phase Shift [months] |
Bias Score [1] |
RMSE Score [1] |
Seasonal Cycle Score [1] |
Spatial Distribution Score [1] |
Overall Score [1] |
|||
|---|---|---|---|---|---|---|---|---|---|---|---|---|---|---|---|---|
| Benchmark | [-] | 2.31 | ||||||||||||||
| CESM3_092H | [-] | 2.22 | 2.22 | 2.31 | 2.32 | 2.00 | -0.0862 | 0.585 | 0.913 | 0.650 | 0.671 | 0.916 | 0.882 | 0.758 | ||
| CMIP6_001 | [-] | 2.15 | 2.15 | 2.31 | 2.35 | 3.70 | -0.152 | 0.573 | 0.842 | 0.601 | 0.697 | 0.915 | 0.916 | 0.765 | ||
| LE2_001 | [-] | 2.11 | 2.11 | 2.31 | 2.29 | 3.70 | -0.190 | 0.592 | 0.792 | 0.575 | 0.700 | 0.924 | 0.934 | 0.766 |
Download Data |
Period Mean (original grids) [mm d-1] |
Model Period Mean (intersection) [mm d-1] |
Benchmark Period Mean (intersection) [mm d-1] |
Model Period Mean (complement) [mm d-1] |
Benchmark Period Mean (complement) [mm d-1] |
Bias [mm d-1] |
RMSE [mm d-1] |
Phase Shift [months] |
Bias Score [1] |
RMSE Score [1] |
Seasonal Cycle Score [1] |
Spatial Distribution Score [1] |
Overall Score [1] |
|||
|---|---|---|---|---|---|---|---|---|---|---|---|---|---|---|---|---|
| Benchmark | [-] | 0.970 | ||||||||||||||
| CESM3_092H | [-] | 1.49 | 1.49 | 0.969 | 1.20 | 0.515 | 0.900 | 1.18 | 0.182 | 0.553 | 0.851 | 0.833 | 0.594 | |||
| CMIP6_001 | [-] | 1.30 | 1.30 | 0.962 | 0.980 | 1.85 | 0.321 | 0.783 | 1.11 | 0.275 | 0.566 | 0.863 | 0.849 | 0.624 | ||
| LE2_001 | [-] | 1.30 | 1.30 | 0.962 | 1.00 | 1.85 | 0.326 | 0.786 | 1.13 | 0.273 | 0.565 | 0.863 | 0.844 | 0.622 |
Temporally integrated period mean