Mean State
Download Data |
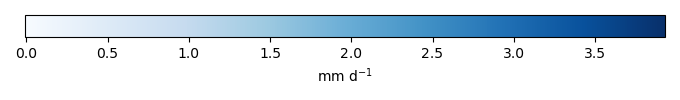
Period Mean (original grids) [mm d-1] |
Model Period Mean (intersection) [mm d-1] |
Benchmark Period Mean (intersection) [mm d-1] |
Model Period Mean (complement) [mm d-1] |
Benchmark Period Mean (complement) [mm d-1] |
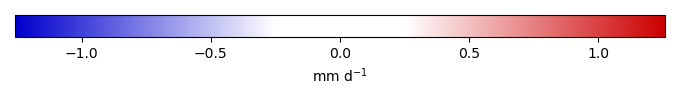
Bias [mm d-1] |
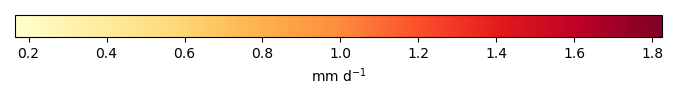
RMSE [mm d-1] |
Phase Shift [months] |
Bias Score [1] |
RMSE Score [1] |
Seasonal Cycle Score [1] |
Spatial Distribution Score [1] |
Overall Score [1] |
|||
|---|---|---|---|---|---|---|---|---|---|---|---|---|---|---|---|---|
| Benchmark | [-] | 2.49 | ||||||||||||||
| CESM3_092H | [-] | 2.61 | 2.64 | 2.49 | 2.06 | 0.142 | 0.700 | 3.00 | 0.547 | 0.628 | 0.495 | 0.968 | 0.653 | |||
| CMIP6_001 | [-] | 2.58 | 2.61 | 2.49 | 1.91 | 2.68 | 0.123 | 0.683 | 2.68 | 0.599 | 0.621 | 0.569 | 0.973 | 0.677 | ||
| LE2_001 | [-] | 2.58 | 2.62 | 2.49 | 1.90 | 2.68 | 0.127 | 0.694 | 2.68 | 0.590 | 0.613 | 0.570 | 0.965 | 0.670 |
Download Data |
Period Mean (original grids) [mm d-1] |
Model Period Mean (intersection) [mm d-1] |
Benchmark Period Mean (intersection) [mm d-1] |
Model Period Mean (complement) [mm d-1] |
Benchmark Period Mean (complement) [mm d-1] |
Bias [mm d-1] |
RMSE [mm d-1] |
Phase Shift [months] |
Bias Score [1] |
RMSE Score [1] |
Seasonal Cycle Score [1] |
Spatial Distribution Score [1] |
Overall Score [1] |
|||
|---|---|---|---|---|---|---|---|---|---|---|---|---|---|---|---|---|
| Benchmark | [-] | 1.21 | ||||||||||||||
| CESM3_092H | [-] | 2.06 | 2.08 | 1.21 | 1.06 | 0.867 | 1.29 | 1.33 | 0.172 | 0.432 | 0.820 | 0.714 | 0.514 | |||
| CMIP6_001 | [-] | 1.73 | 1.75 | 1.20 | 0.547 | 2.59 | 0.542 | 1.01 | 1.21 | 0.323 | 0.475 | 0.836 | 0.916 | 0.605 | ||
| LE2_001 | [-] | 1.75 | 1.77 | 1.20 | 0.562 | 2.59 | 0.565 | 1.03 | 1.21 | 0.304 | 0.464 | 0.831 | 0.908 | 0.594 |
Download Data |
Period Mean (original grids) [mm d-1] |
Model Period Mean (intersection) [mm d-1] |
Benchmark Period Mean (intersection) [mm d-1] |
Model Period Mean (complement) [mm d-1] |
Benchmark Period Mean (complement) [mm d-1] |
Bias [mm d-1] |
RMSE [mm d-1] |
Phase Shift [months] |
Bias Score [1] |
RMSE Score [1] |
Seasonal Cycle Score [1] |
Spatial Distribution Score [1] |
Overall Score [1] |
|||
|---|---|---|---|---|---|---|---|---|---|---|---|---|---|---|---|---|
| Benchmark | [-] | 1.67 | ||||||||||||||
| CESM3_092H | [-] | 1.94 | 1.94 | 1.67 | 1.81 | 2.90 | 0.266 | 0.900 | 1.56 | 0.417 | 0.540 | 0.785 | 0.870 | 0.630 | ||
| CMIP6_001 | [-] | 2.05 | 2.05 | 1.67 | 1.99 | 2.05 | 0.388 | 0.937 | 1.42 | 0.401 | 0.506 | 0.821 | 0.934 | 0.634 | ||
| LE2_001 | [-] | 2.05 | 2.05 | 1.67 | 1.99 | 2.05 | 0.389 | 0.949 | 1.38 | 0.393 | 0.502 | 0.822 | 0.921 | 0.628 |
Download Data |
Period Mean (original grids) [mm d-1] |
Model Period Mean (intersection) [mm d-1] |
Benchmark Period Mean (intersection) [mm d-1] |
Model Period Mean (complement) [mm d-1] |
Benchmark Period Mean (complement) [mm d-1] |
Bias [mm d-1] |
RMSE [mm d-1] |
Phase Shift [months] |
Bias Score [1] |
RMSE Score [1] |
Seasonal Cycle Score [1] |
Spatial Distribution Score [1] |
Overall Score [1] |
|||
|---|---|---|---|---|---|---|---|---|---|---|---|---|---|---|---|---|
| Benchmark | [-] | 0.851 | ||||||||||||||
| CESM3_092H | [-] | 0.648 | 0.655 | 0.851 | 0.570 | -0.197 | 0.332 | 0.444 | 0.322 | 0.493 | 0.970 | 0.992 | 0.654 | |||
| CMIP6_001 | [-] | 0.513 | 0.522 | 0.851 | 0.390 | 1.06 | -0.333 | 0.488 | 0.319 | 0.187 | 0.328 | 0.978 | 0.955 | 0.556 | ||
| LE2_001 | [-] | 0.492 | 0.500 | 0.851 | 0.383 | 1.06 | -0.353 | 0.510 | 0.260 | 0.158 | 0.308 | 0.982 | 0.954 | 0.542 |
Download Data |
Period Mean (original grids) [mm d-1] |
Model Period Mean (intersection) [mm d-1] |
Benchmark Period Mean (intersection) [mm d-1] |
Model Period Mean (complement) [mm d-1] |
Benchmark Period Mean (complement) [mm d-1] |
Bias [mm d-1] |
RMSE [mm d-1] |
Phase Shift [months] |
Bias Score [1] |
RMSE Score [1] |
Seasonal Cycle Score [1] |
Spatial Distribution Score [1] |
Overall Score [1] |
|||
|---|---|---|---|---|---|---|---|---|---|---|---|---|---|---|---|---|
| Benchmark | [-] | 3.76 | ||||||||||||||
| CESM3_092H | [-] | 3.43 | 3.39 | 3.76 | 3.59 | 3.88 | -0.326 | 0.505 | 2.80 | 0.537 | 0.733 | 0.530 | 0.998 | 0.706 | ||
| CMIP6_001 | [-] | 3.30 | 3.26 | 3.75 | 3.50 | 3.91 | -0.432 | 0.574 | 2.68 | 0.443 | 0.736 | 0.555 | 0.987 | 0.691 | ||
| LE2_001 | [-] | 3.27 | 3.23 | 3.75 | 3.47 | 3.91 | -0.469 | 0.609 | 2.77 | 0.413 | 0.725 | 0.541 | 0.963 | 0.673 |
Download Data |
Period Mean (original grids) [mm d-1] |
Model Period Mean (intersection) [mm d-1] |
Benchmark Period Mean (intersection) [mm d-1] |
Model Period Mean (complement) [mm d-1] |
Benchmark Period Mean (complement) [mm d-1] |
Bias [mm d-1] |
RMSE [mm d-1] |
Phase Shift [months] |
Bias Score [1] |
RMSE Score [1] |
Seasonal Cycle Score [1] |
Spatial Distribution Score [1] |
Overall Score [1] |
|||
|---|---|---|---|---|---|---|---|---|---|---|---|---|---|---|---|---|
| Benchmark | [-] | 1.12 | ||||||||||||||
| CESM3_092H | [-] | 1.19 | 1.19 | 1.12 | 1.27 | 1.43 | 0.0733 | 0.352 | 0.164 | 0.612 | 0.442 | 0.989 | 0.966 | 0.690 | ||
| CMIP6_001 | [-] | 1.00 | 1.00 | 1.12 | 1.07 | 1.40 | -0.114 | 0.329 | 0.229 | 0.515 | 0.511 | 0.984 | 0.929 | 0.690 | ||
| LE2_001 | [-] | 1.02 | 1.02 | 1.12 | 1.10 | 1.40 | -0.0946 | 0.330 | 0.200 | 0.561 | 0.495 | 0.986 | 0.936 | 0.695 |
Download Data |
Period Mean (original grids) [mm d-1] |
Model Period Mean (intersection) [mm d-1] |
Benchmark Period Mean (intersection) [mm d-1] |
Model Period Mean (complement) [mm d-1] |
Benchmark Period Mean (complement) [mm d-1] |
Bias [mm d-1] |
RMSE [mm d-1] |
Phase Shift [months] |
Bias Score [1] |
RMSE Score [1] |
Seasonal Cycle Score [1] |
Spatial Distribution Score [1] |
Overall Score [1] |
|||
|---|---|---|---|---|---|---|---|---|---|---|---|---|---|---|---|---|
| Benchmark | [-] | 1.17 | ||||||||||||||
| CESM3_092H | [-] | 1.27 | 1.35 | 1.17 | 0.919 | 0.196 | 0.741 | 1.38 | 0.484 | 0.303 | 0.791 | 0.964 | 0.569 | |||
| CMIP6_001 | [-] | 1.17 | 1.23 | 1.17 | 0.875 | 1.94 | 0.0766 | 0.713 | 1.37 | 0.510 | 0.340 | 0.804 | 0.948 | 0.588 | ||
| LE2_001 | [-] | 1.19 | 1.25 | 1.17 | 0.888 | 1.94 | 0.0948 | 0.729 | 1.40 | 0.499 | 0.333 | 0.799 | 0.949 | 0.582 |
Download Data |
Period Mean (original grids) [mm d-1] |
Model Period Mean (intersection) [mm d-1] |
Benchmark Period Mean (intersection) [mm d-1] |
Model Period Mean (complement) [mm d-1] |
Benchmark Period Mean (complement) [mm d-1] |
Bias [mm d-1] |
RMSE [mm d-1] |
Phase Shift [months] |
Bias Score [1] |
RMSE Score [1] |
Seasonal Cycle Score [1] |
Spatial Distribution Score [1] |
Overall Score [1] |
|||
|---|---|---|---|---|---|---|---|---|---|---|---|---|---|---|---|---|
| Benchmark | [-] | 2.11 | ||||||||||||||
| CESM3_092H | [-] | 2.00 | 2.05 | 2.11 | 1.64 | 4.04 | 0.0123 | 0.940 | 2.15 | 0.485 | 0.401 | 0.679 | 0.884 | 0.570 | ||
| CMIP6_001 | [-] | 1.98 | 2.03 | 2.11 | 1.58 | 3.39 | -0.00620 | 0.946 | 2.10 | 0.500 | 0.399 | 0.688 | 0.888 | 0.575 | ||
| LE2_001 | [-] | 2.00 | 2.05 | 2.11 | 1.58 | 3.39 | 0.00884 | 0.944 | 2.11 | 0.491 | 0.400 | 0.682 | 0.893 | 0.573 |
Download Data |
Period Mean (original grids) [mm d-1] |
Model Period Mean (intersection) [mm d-1] |
Benchmark Period Mean (intersection) [mm d-1] |
Model Period Mean (complement) [mm d-1] |
Benchmark Period Mean (complement) [mm d-1] |
Bias [mm d-1] |
RMSE [mm d-1] |
Phase Shift [months] |
Bias Score [1] |
RMSE Score [1] |
Seasonal Cycle Score [1] |
Spatial Distribution Score [1] |
Overall Score [1] |
|||
|---|---|---|---|---|---|---|---|---|---|---|---|---|---|---|---|---|
| Benchmark | [-] | 0.785 | ||||||||||||||
| CESM3_092H | [-] | 0.698 | 0.733 | 0.785 | 0.424 | -0.0567 | 0.271 | 0.379 | 0.641 | 0.506 | 0.975 | 0.893 | 0.704 | |||
| CMIP6_001 | [-] | 0.433 | 0.463 | 0.785 | 0.219 | 0.741 | -0.324 | 0.497 | 0.410 | 0.120 | 0.262 | 0.967 | 0.921 | 0.506 | ||
| LE2_001 | [-] | 0.448 | 0.479 | 0.785 | 0.227 | 0.741 | -0.308 | 0.478 | 0.451 | 0.124 | 0.278 | 0.960 | 0.909 | 0.510 |
Download Data |
Period Mean (original grids) [mm d-1] |
Model Period Mean (intersection) [mm d-1] |
Benchmark Period Mean (intersection) [mm d-1] |
Model Period Mean (complement) [mm d-1] |
Benchmark Period Mean (complement) [mm d-1] |
Bias [mm d-1] |
RMSE [mm d-1] |
Phase Shift [months] |
Bias Score [1] |
RMSE Score [1] |
Seasonal Cycle Score [1] |
Spatial Distribution Score [1] |
Overall Score [1] |
|||
|---|---|---|---|---|---|---|---|---|---|---|---|---|---|---|---|---|
| Benchmark | [-] | 0.787 | ||||||||||||||
| CESM3_092H | [-] | 1.50 | 1.47 | 0.786 | 1.90 | 1.79 | 0.719 | 0.930 | 2.20 | 0.246 | 0.559 | 0.668 | 0.899 | 0.586 | ||
| CMIP6_001 | [-] | 1.25 | 1.22 | 0.779 | 1.79 | 2.20 | 0.475 | 0.722 | 2.29 | 0.366 | 0.608 | 0.655 | 0.877 | 0.623 | ||
| LE2_001 | [-] | 1.25 | 1.22 | 0.779 | 1.78 | 2.20 | 0.470 | 0.724 | 2.07 | 0.386 | 0.590 | 0.678 | 0.907 | 0.630 |
Download Data |
Period Mean (original grids) [mm d-1] |
Model Period Mean (intersection) [mm d-1] |
Benchmark Period Mean (intersection) [mm d-1] |
Model Period Mean (complement) [mm d-1] |
Benchmark Period Mean (complement) [mm d-1] |
Bias [mm d-1] |
RMSE [mm d-1] |
Phase Shift [months] |
Bias Score [1] |
RMSE Score [1] |
Seasonal Cycle Score [1] |
Spatial Distribution Score [1] |
Overall Score [1] |
|||
|---|---|---|---|---|---|---|---|---|---|---|---|---|---|---|---|---|
| Benchmark | [-] | 1.32 | ||||||||||||||
| CESM3_092H | [-] | 1.37 | 1.38 | 1.32 | 1.30 | 1.05 | 0.0504 | 0.446 | 0.330 | 0.581 | 0.562 | 0.976 | 0.988 | 0.734 | ||
| CMIP6_001 | [-] | 1.23 | 1.24 | 1.31 | 1.18 | 1.43 | -0.0758 | 0.445 | 0.425 | 0.600 | 0.556 | 0.971 | 0.988 | 0.734 | ||
| LE2_001 | [-] | 1.23 | 1.23 | 1.31 | 1.17 | 1.43 | -0.0802 | 0.429 | 0.379 | 0.617 | 0.570 | 0.974 | 0.991 | 0.744 |
Download Data |
Period Mean (original grids) [mm d-1] |
Model Period Mean (intersection) [mm d-1] |
Benchmark Period Mean (intersection) [mm d-1] |
Model Period Mean (complement) [mm d-1] |
Benchmark Period Mean (complement) [mm d-1] |
Bias [mm d-1] |
RMSE [mm d-1] |
Phase Shift [months] |
Bias Score [1] |
RMSE Score [1] |
Seasonal Cycle Score [1] |
Spatial Distribution Score [1] |
Overall Score [1] |
|||
|---|---|---|---|---|---|---|---|---|---|---|---|---|---|---|---|---|
| Benchmark | [-] | 1.56 | ||||||||||||||
| CESM3_092H | [-] | 1.38 | 1.71 | 1.56 | 0.478 | 2.15 | 0.169 | 0.728 | 1.43 | 0.438 | 0.460 | 0.793 | 0.944 | 0.619 | ||
| CMIP6_001 | [-] | 1.28 | 1.60 | 1.56 | 0.392 | 2.43 | 0.0621 | 0.685 | 1.41 | 0.451 | 0.470 | 0.800 | 0.969 | 0.632 | ||
| LE2_001 | [-] | 1.28 | 1.60 | 1.56 | 0.393 | 2.43 | 0.0624 | 0.692 | 1.39 | 0.451 | 0.465 | 0.802 | 0.967 | 0.630 |
Download Data |
Period Mean (original grids) [mm d-1] |
Model Period Mean (intersection) [mm d-1] |
Benchmark Period Mean (intersection) [mm d-1] |
Model Period Mean (complement) [mm d-1] |
Benchmark Period Mean (complement) [mm d-1] |
Bias [mm d-1] |
RMSE [mm d-1] |
Phase Shift [months] |
Bias Score [1] |
RMSE Score [1] |
Seasonal Cycle Score [1] |
Spatial Distribution Score [1] |
Overall Score [1] |
|||
|---|---|---|---|---|---|---|---|---|---|---|---|---|---|---|---|---|
| Benchmark | [-] | 0.603 | ||||||||||||||
| CESM3_092H | [-] | 0.440 | 0.907 | 0.603 | 0.329 | 0.303 | 0.796 | 2.33 | 0.490 | 0.338 | 0.632 | 0.948 | 0.549 | |||
| CMIP6_001 | [-] | 0.356 | 0.846 | 0.603 | 0.238 | 0.429 | 0.240 | 0.795 | 2.36 | 0.514 | 0.324 | 0.625 | 0.945 | 0.546 | ||
| LE2_001 | [-] | 0.349 | 0.818 | 0.603 | 0.237 | 0.429 | 0.215 | 0.772 | 2.34 | 0.544 | 0.330 | 0.627 | 0.944 | 0.555 |
Download Data |
Period Mean (original grids) [mm d-1] |
Model Period Mean (intersection) [mm d-1] |
Benchmark Period Mean (intersection) [mm d-1] |
Model Period Mean (complement) [mm d-1] |
Benchmark Period Mean (complement) [mm d-1] |
Bias [mm d-1] |
RMSE [mm d-1] |
Phase Shift [months] |
Bias Score [1] |
RMSE Score [1] |
Seasonal Cycle Score [1] |
Spatial Distribution Score [1] |
Overall Score [1] |
|||
|---|---|---|---|---|---|---|---|---|---|---|---|---|---|---|---|---|
| Benchmark | [-] | 0.876 | ||||||||||||||
| CESM3_092H | [-] | 0.704 | 0.818 | 0.876 | 0.388 | -0.0663 | 0.417 | 0.475 | 0.446 | 0.315 | 0.965 | 0.857 | 0.580 | |||
| CMIP6_001 | [-] | 0.526 | 0.632 | 0.875 | 0.260 | 1.04 | -0.247 | 0.448 | 0.758 | 0.256 | 0.345 | 0.938 | 0.953 | 0.567 | ||
| LE2_001 | [-] | 0.528 | 0.635 | 0.875 | 0.260 | 1.04 | -0.244 | 0.457 | 0.754 | 0.264 | 0.331 | 0.939 | 0.939 | 0.561 |
Download Data |
Period Mean (original grids) [mm d-1] |
Model Period Mean (intersection) [mm d-1] |
Benchmark Period Mean (intersection) [mm d-1] |
Model Period Mean (complement) [mm d-1] |
Benchmark Period Mean (complement) [mm d-1] |
Bias [mm d-1] |
RMSE [mm d-1] |
Phase Shift [months] |
Bias Score [1] |
RMSE Score [1] |
Seasonal Cycle Score [1] |
Spatial Distribution Score [1] |
Overall Score [1] |
|||
|---|---|---|---|---|---|---|---|---|---|---|---|---|---|---|---|---|
| Benchmark | [-] | 2.12 | ||||||||||||||
| CESM3_092H | [-] | 2.23 | 2.23 | 2.12 | 2.28 | 3.97 | 0.153 | 0.863 | 2.16 | 0.415 | 0.577 | 0.667 | 0.776 | 0.602 | ||
| CMIP6_001 | [-] | 2.10 | 2.13 | 2.12 | 1.97 | 2.78 | 0.0623 | 0.904 | 2.38 | 0.405 | 0.544 | 0.626 | 0.861 | 0.596 | ||
| LE2_001 | [-] | 2.11 | 2.14 | 2.12 | 2.00 | 2.78 | 0.0705 | 0.916 | 2.39 | 0.390 | 0.536 | 0.629 | 0.853 | 0.589 |
Download Data |
Period Mean (original grids) [mm d-1] |
Model Period Mean (intersection) [mm d-1] |
Benchmark Period Mean (intersection) [mm d-1] |
Model Period Mean (complement) [mm d-1] |
Benchmark Period Mean (complement) [mm d-1] |
Bias [mm d-1] |
RMSE [mm d-1] |
Phase Shift [months] |
Bias Score [1] |
RMSE Score [1] |
Seasonal Cycle Score [1] |
Spatial Distribution Score [1] |
Overall Score [1] |
|||
|---|---|---|---|---|---|---|---|---|---|---|---|---|---|---|---|---|
| Benchmark | [-] | 1.88 | ||||||||||||||
| CESM3_092H | [-] | 1.96 | 1.95 | 1.88 | 2.24 | 0.0921 | 0.510 | 0.697 | 0.627 | 0.467 | 0.946 | 0.995 | 0.701 | |||
| CMIP6_001 | [-] | 1.79 | 1.77 | 1.88 | 2.12 | 2.11 | -0.0807 | 0.504 | 0.669 | 0.619 | 0.482 | 0.945 | 0.995 | 0.705 | ||
| LE2_001 | [-] | 1.78 | 1.77 | 1.88 | 2.10 | 2.11 | -0.0879 | 0.526 | 0.618 | 0.620 | 0.461 | 0.948 | 0.994 | 0.697 |
Download Data |
Period Mean (original grids) [mm d-1] |
Model Period Mean (intersection) [mm d-1] |
Benchmark Period Mean (intersection) [mm d-1] |
Model Period Mean (complement) [mm d-1] |
Benchmark Period Mean (complement) [mm d-1] |
Bias [mm d-1] |
RMSE [mm d-1] |
Phase Shift [months] |
Bias Score [1] |
RMSE Score [1] |
Seasonal Cycle Score [1] |
Spatial Distribution Score [1] |
Overall Score [1] |
|||
|---|---|---|---|---|---|---|---|---|---|---|---|---|---|---|---|---|
| Benchmark | [-] | 1.14 | ||||||||||||||
| CESM3_092H | [-] | 1.36 | 1.35 | 1.14 | 1.59 | 0.224 | 0.525 | 0.175 | 0.336 | 0.333 | 0.988 | 0.967 | 0.592 | |||
| CMIP6_001 | [-] | 1.13 | 1.12 | 1.14 | 1.34 | 1.29 | -0.00793 | 0.446 | 0.294 | 0.536 | 0.402 | 0.979 | 0.990 | 0.662 | ||
| LE2_001 | [-] | 1.13 | 1.12 | 1.14 | 1.34 | 1.29 | -0.00967 | 0.440 | 0.309 | 0.553 | 0.410 | 0.978 | 0.991 | 0.669 |
Download Data |
Period Mean (original grids) [mm d-1] |
Model Period Mean (intersection) [mm d-1] |
Benchmark Period Mean (intersection) [mm d-1] |
Model Period Mean (complement) [mm d-1] |
Benchmark Period Mean (complement) [mm d-1] |
Bias [mm d-1] |
RMSE [mm d-1] |
Phase Shift [months] |
Bias Score [1] |
RMSE Score [1] |
Seasonal Cycle Score [1] |
Spatial Distribution Score [1] |
Overall Score [1] |
|||
|---|---|---|---|---|---|---|---|---|---|---|---|---|---|---|---|---|
| Benchmark | [-] | 0.787 | ||||||||||||||
| CESM3_092H | [-] | 1.19 | 1.20 | 0.787 | 1.23 | 0.415 | 0.848 | 1.97 | 0.351 | 0.278 | 0.689 | 0.851 | 0.489 | |||
| CMIP6_001 | [-] | 1.00 | 1.01 | 0.786 | 0.983 | 1.92 | 0.234 | 0.726 | 1.97 | 0.484 | 0.347 | 0.692 | 0.792 | 0.532 | ||
| LE2_001 | [-] | 1.03 | 1.04 | 0.786 | 1.02 | 1.92 | 0.260 | 0.757 | 1.99 | 0.452 | 0.329 | 0.684 | 0.805 | 0.519 |
Download Data |
Period Mean (original grids) [mm d-1] |
Model Period Mean (intersection) [mm d-1] |
Benchmark Period Mean (intersection) [mm d-1] |
Model Period Mean (complement) [mm d-1] |
Benchmark Period Mean (complement) [mm d-1] |
Bias [mm d-1] |
RMSE [mm d-1] |
Phase Shift [months] |
Bias Score [1] |
RMSE Score [1] |
Seasonal Cycle Score [1] |
Spatial Distribution Score [1] |
Overall Score [1] |
|||
|---|---|---|---|---|---|---|---|---|---|---|---|---|---|---|---|---|
| Benchmark | [-] | 3.61 | ||||||||||||||
| CESM3_092H | [-] | 3.09 | 3.10 | 3.61 | 2.60 | -0.530 | 0.836 | 2.32 | 0.450 | 0.575 | 0.647 | 0.976 | 0.645 | |||
| CMIP6_001 | [-] | 3.28 | 3.29 | 3.61 | 2.91 | 3.16 | -0.335 | 0.675 | 2.19 | 0.559 | 0.614 | 0.671 | 0.991 | 0.690 | ||
| LE2_001 | [-] | 3.27 | 3.28 | 3.61 | 2.93 | 3.16 | -0.341 | 0.676 | 2.19 | 0.554 | 0.617 | 0.668 | 0.991 | 0.690 |
Download Data |
Period Mean (original grids) [mm d-1] |
Model Period Mean (intersection) [mm d-1] |
Benchmark Period Mean (intersection) [mm d-1] |
Model Period Mean (complement) [mm d-1] |
Benchmark Period Mean (complement) [mm d-1] |
Bias [mm d-1] |
RMSE [mm d-1] |
Phase Shift [months] |
Bias Score [1] |
RMSE Score [1] |
Seasonal Cycle Score [1] |
Spatial Distribution Score [1] |
Overall Score [1] |
|||
|---|---|---|---|---|---|---|---|---|---|---|---|---|---|---|---|---|
| Benchmark | [-] | 1.96 | ||||||||||||||
| CESM3_092H | [-] | 2.20 | 2.20 | 1.96 | 2.28 | 1.87 | 0.234 | 0.873 | 1.34 | 0.367 | 0.548 | 0.843 | 0.715 | 0.604 | ||
| CMIP6_001 | [-] | 2.11 | 2.11 | 1.96 | 2.29 | 2.09 | 0.156 | 0.830 | 1.42 | 0.411 | 0.545 | 0.820 | 0.757 | 0.616 | ||
| LE2_001 | [-] | 2.04 | 2.04 | 1.96 | 2.21 | 2.09 | 0.0831 | 0.834 | 1.26 | 0.418 | 0.549 | 0.848 | 0.795 | 0.632 |
Download Data |
Period Mean (original grids) [mm d-1] |
Model Period Mean (intersection) [mm d-1] |
Benchmark Period Mean (intersection) [mm d-1] |
Model Period Mean (complement) [mm d-1] |
Benchmark Period Mean (complement) [mm d-1] |
Bias [mm d-1] |
RMSE [mm d-1] |
Phase Shift [months] |
Bias Score [1] |
RMSE Score [1] |
Seasonal Cycle Score [1] |
Spatial Distribution Score [1] |
Overall Score [1] |
|||
|---|---|---|---|---|---|---|---|---|---|---|---|---|---|---|---|---|
| Benchmark | [-] | 1.17 | ||||||||||||||
| CESM3_092H | [-] | 1.51 | 1.62 | 1.17 | 0.994 | 0.447 | 0.832 | 2.10 | 0.262 | 0.421 | 0.684 | 0.880 | 0.533 | |||
| CMIP6_001 | [-] | 1.29 | 1.42 | 1.17 | 0.718 | 1.34 | 0.234 | 0.743 | 1.84 | 0.337 | 0.432 | 0.718 | 0.906 | 0.565 | ||
| LE2_001 | [-] | 1.30 | 1.42 | 1.17 | 0.747 | 1.34 | 0.236 | 0.734 | 1.82 | 0.331 | 0.444 | 0.727 | 0.897 | 0.569 |
Temporally integrated period mean