Mean State
Download Data |
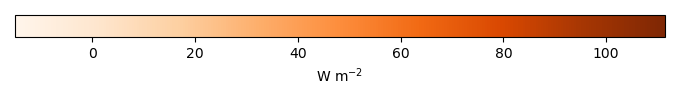
Period Mean (original grids) [W m-2] |
Model Period Mean (intersection) [W m-2] |
Benchmark Period Mean (intersection) [W m-2] |
Model Period Mean (complement) [W m-2] |
Benchmark Period Mean (complement) [W m-2] |
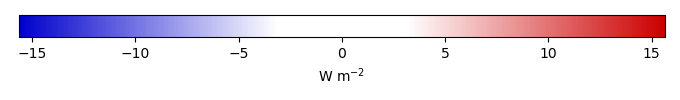
Bias [W m-2] |
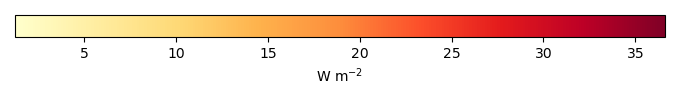
RMSE [W m-2] |
Phase Shift [months] |
Bias Score [1] |
RMSE Score [1] |
Seasonal Cycle Score [1] |
Spatial Distribution Score [1] |
Overall Score [1] |
|||
|---|---|---|---|---|---|---|---|---|---|---|---|---|---|---|---|---|
| Benchmark | [-] | 66.6 | ||||||||||||||
| CESM3_092H | [-] | 74.6 | 75.1 | 66.6 | 72.0 | 8.30 | 13.7 | 2.12 | 0.541 | 0.750 | 0.665 | 0.996 | 0.740 | |||
| CMIP6_001 | [-] | 74.9 | 75.3 | 66.6 | 75.1 | 33.2 | 8.63 | 14.3 | 2.89 | 0.555 | 0.690 | 0.527 | 0.995 | 0.692 | ||
| LE2_001 | [-] | 75.1 | 75.5 | 66.6 | 74.8 | 33.2 | 8.83 | 14.5 | 3.00 | 0.547 | 0.688 | 0.508 | 0.993 | 0.685 |
Download Data |
Period Mean (original grids) [W m-2] |
Model Period Mean (intersection) [W m-2] |
Benchmark Period Mean (intersection) [W m-2] |
Model Period Mean (complement) [W m-2] |
Benchmark Period Mean (complement) [W m-2] |
Bias [W m-2] |
RMSE [W m-2] |
Phase Shift [months] |
Bias Score [1] |
RMSE Score [1] |
Seasonal Cycle Score [1] |
Spatial Distribution Score [1] |
Overall Score [1] |
|||
|---|---|---|---|---|---|---|---|---|---|---|---|---|---|---|---|---|
| Benchmark | [-] | 46.1 | ||||||||||||||
| CESM3_092H | [-] | 59.0 | 58.6 | 46.1 | 55.6 | 12.4 | 22.1 | 1.13 | 0.373 | 0.472 | 0.848 | 0.888 | 0.611 | |||
| CMIP6_001 | [-] | 50.2 | 49.4 | 46.1 | 51.5 | 56.3 | 3.31 | 16.4 | 1.41 | 0.619 | 0.525 | 0.800 | 0.990 | 0.692 | ||
| LE2_001 | [-] | 50.7 | 49.9 | 46.1 | 52.1 | 56.3 | 3.81 | 16.7 | 1.41 | 0.615 | 0.514 | 0.800 | 0.990 | 0.687 |
Download Data |
Period Mean (original grids) [W m-2] |
Model Period Mean (intersection) [W m-2] |
Benchmark Period Mean (intersection) [W m-2] |
Model Period Mean (complement) [W m-2] |
Benchmark Period Mean (complement) [W m-2] |
Bias [W m-2] |
RMSE [W m-2] |
Phase Shift [months] |
Bias Score [1] |
RMSE Score [1] |
Seasonal Cycle Score [1] |
Spatial Distribution Score [1] |
Overall Score [1] |
|||
|---|---|---|---|---|---|---|---|---|---|---|---|---|---|---|---|---|
| Benchmark | [-] | 48.4 | ||||||||||||||
| CESM3_092H | [-] | 56.0 | 55.5 | 48.4 | 61.6 | 6.64 | 15.6 | 1.01 | 0.510 | 0.691 | 0.885 | 0.985 | 0.752 | |||
| CMIP6_001 | [-] | 59.7 | 58.8 | 48.4 | 68.8 | 51.1 | 10.2 | 18.5 | 1.02 | 0.435 | 0.640 | 0.886 | 0.965 | 0.714 | ||
| LE2_001 | [-] | 59.4 | 58.5 | 48.4 | 69.2 | 51.1 | 9.87 | 18.3 | 0.876 | 0.434 | 0.641 | 0.897 | 0.971 | 0.717 |
Download Data |
Period Mean (original grids) [W m-2] |
Model Period Mean (intersection) [W m-2] |
Benchmark Period Mean (intersection) [W m-2] |
Model Period Mean (complement) [W m-2] |
Benchmark Period Mean (complement) [W m-2] |
Bias [W m-2] |
RMSE [W m-2] |
Phase Shift [months] |
Bias Score [1] |
RMSE Score [1] |
Seasonal Cycle Score [1] |
Spatial Distribution Score [1] |
Overall Score [1] |
|||
|---|---|---|---|---|---|---|---|---|---|---|---|---|---|---|---|---|
| Benchmark | [-] | 14.1 | ||||||||||||||
| CESM3_092H | [-] | 18.6 | 18.7 | 14.1 | 17.5 | 4.55 | 7.71 | 0.264 | 0.405 | 0.591 | 0.983 | 0.880 | 0.690 | |||
| CMIP6_001 | [-] | 14.9 | 15.2 | 14.1 | 12.9 | 9.46 | 0.933 | 7.72 | 0.375 | 0.485 | 0.557 | 0.975 | 0.749 | 0.665 | ||
| LE2_001 | [-] | 14.3 | 14.6 | 14.1 | 12.8 | 9.46 | 0.387 | 7.60 | 0.195 | 0.529 | 0.553 | 0.987 | 0.764 | 0.677 |
Download Data |
Period Mean (original grids) [W m-2] |
Model Period Mean (intersection) [W m-2] |
Benchmark Period Mean (intersection) [W m-2] |
Model Period Mean (complement) [W m-2] |
Benchmark Period Mean (complement) [W m-2] |
Bias [W m-2] |
RMSE [W m-2] |
Phase Shift [months] |
Bias Score [1] |
RMSE Score [1] |
Seasonal Cycle Score [1] |
Spatial Distribution Score [1] |
Overall Score [1] |
|||
|---|---|---|---|---|---|---|---|---|---|---|---|---|---|---|---|---|
| Benchmark | [-] | 89.3 | ||||||||||||||
| CESM3_092H | [-] | 99.3 | 97.6 | 89.3 | 103. | 9.18 | 12.4 | 1.74 | 0.636 | 0.830 | 0.744 | 0.857 | 0.780 | |||
| CMIP6_001 | [-] | 95.7 | 93.8 | 89.5 | 100. | 74.6 | 5.71 | 10.7 | 1.96 | 0.713 | 0.822 | 0.697 | 0.971 | 0.805 | ||
| LE2_001 | [-] | 95.0 | 93.0 | 89.5 | 99.7 | 74.6 | 4.97 | 10.8 | 1.99 | 0.719 | 0.813 | 0.703 | 0.985 | 0.807 |
Download Data |
Period Mean (original grids) [W m-2] |
Model Period Mean (intersection) [W m-2] |
Benchmark Period Mean (intersection) [W m-2] |
Model Period Mean (complement) [W m-2] |
Benchmark Period Mean (complement) [W m-2] |
Bias [W m-2] |
RMSE [W m-2] |
Phase Shift [months] |
Bias Score [1] |
RMSE Score [1] |
Seasonal Cycle Score [1] |
Spatial Distribution Score [1] |
Overall Score [1] |
|||
|---|---|---|---|---|---|---|---|---|---|---|---|---|---|---|---|---|
| Benchmark | [-] | 24.4 | ||||||||||||||
| CESM3_092H | [-] | 34.4 | 34.4 | 24.4 | 35.1 | 10.0 | 12.7 | 0.147 | 0.187 | 0.570 | 0.990 | 0.925 | 0.648 | |||
| CMIP6_001 | [-] | 29.2 | 29.1 | 24.4 | 30.0 | 4.77 | 7.39 | 0.190 | 0.560 | 0.711 | 0.987 | 0.888 | 0.771 | |||
| LE2_001 | [-] | 29.8 | 29.7 | 24.4 | 30.7 | 5.37 | 7.90 | 0.186 | 0.517 | 0.700 | 0.988 | 0.889 | 0.759 |
Download Data |
Period Mean (original grids) [W m-2] |
Model Period Mean (intersection) [W m-2] |
Benchmark Period Mean (intersection) [W m-2] |
Model Period Mean (complement) [W m-2] |
Benchmark Period Mean (complement) [W m-2] |
Bias [W m-2] |
RMSE [W m-2] |
Phase Shift [months] |
Bias Score [1] |
RMSE Score [1] |
Seasonal Cycle Score [1] |
Spatial Distribution Score [1] |
Overall Score [1] |
|||
|---|---|---|---|---|---|---|---|---|---|---|---|---|---|---|---|---|
| Benchmark | [-] | 25.8 | ||||||||||||||
| CESM3_092H | [-] | 36.8 | 35.5 | 25.8 | 55.9 | 10.1 | 16.4 | 0.577 | 0.412 | 0.461 | 0.951 | 0.980 | 0.653 | |||
| CMIP6_001 | [-] | 34.0 | 33.0 | 25.8 | 50.2 | 39.7 | 7.41 | 15.2 | 0.614 | 0.474 | 0.494 | 0.951 | 0.973 | 0.677 | ||
| LE2_001 | [-] | 34.4 | 33.4 | 25.8 | 50.2 | 39.7 | 7.83 | 15.8 | 0.671 | 0.453 | 0.478 | 0.945 | 0.971 | 0.665 |
Download Data |
Period Mean (original grids) [W m-2] |
Model Period Mean (intersection) [W m-2] |
Benchmark Period Mean (intersection) [W m-2] |
Model Period Mean (complement) [W m-2] |
Benchmark Period Mean (complement) [W m-2] |
Bias [W m-2] |
RMSE [W m-2] |
Phase Shift [months] |
Bias Score [1] |
RMSE Score [1] |
Seasonal Cycle Score [1] |
Spatial Distribution Score [1] |
Overall Score [1] |
|||
|---|---|---|---|---|---|---|---|---|---|---|---|---|---|---|---|---|
| Benchmark | [-] | 54.7 | ||||||||||||||
| CESM3_092H | [-] | 57.4 | 55.2 | 54.7 | 76.3 | 1.70 | 17.7 | 1.71 | 0.678 | 0.514 | 0.751 | 0.993 | 0.690 | |||
| CMIP6_001 | [-] | 57.8 | 55.5 | 54.6 | 76.8 | 74.5 | 1.98 | 18.1 | 1.62 | 0.647 | 0.507 | 0.771 | 0.991 | 0.685 | ||
| LE2_001 | [-] | 57.8 | 55.5 | 54.6 | 76.6 | 74.5 | 1.94 | 18.2 | 1.69 | 0.650 | 0.501 | 0.757 | 0.992 | 0.680 |
Download Data |
Period Mean (original grids) [W m-2] |
Model Period Mean (intersection) [W m-2] |
Benchmark Period Mean (intersection) [W m-2] |
Model Period Mean (complement) [W m-2] |
Benchmark Period Mean (complement) [W m-2] |
Bias [W m-2] |
RMSE [W m-2] |
Phase Shift [months] |
Bias Score [1] |
RMSE Score [1] |
Seasonal Cycle Score [1] |
Spatial Distribution Score [1] |
Overall Score [1] |
|||
|---|---|---|---|---|---|---|---|---|---|---|---|---|---|---|---|---|
| Benchmark | [-] | 13.7 | ||||||||||||||
| CESM3_092H | [-] | 20.1 | 20.7 | 13.7 | 16.8 | 6.65 | 9.41 | 0.0919 | 0.259 | 0.561 | 0.994 | 0.769 | 0.629 | |||
| CMIP6_001 | [-] | 13.1 | 13.6 | 13.7 | 10.2 | 8.92 | -0.222 | 8.26 | 0.144 | 0.664 | 0.485 | 0.989 | 0.845 | 0.694 | ||
| LE2_001 | [-] | 13.1 | 13.6 | 13.7 | 10.5 | 8.92 | -0.268 | 8.09 | 0.198 | 0.696 | 0.489 | 0.986 | 0.826 | 0.697 |
Download Data |
Period Mean (original grids) [W m-2] |
Model Period Mean (intersection) [W m-2] |
Benchmark Period Mean (intersection) [W m-2] |
Model Period Mean (complement) [W m-2] |
Benchmark Period Mean (complement) [W m-2] |
Bias [W m-2] |
RMSE [W m-2] |
Phase Shift [months] |
Bias Score [1] |
RMSE Score [1] |
Seasonal Cycle Score [1] |
Spatial Distribution Score [1] |
Overall Score [1] |
|||
|---|---|---|---|---|---|---|---|---|---|---|---|---|---|---|---|---|
| Benchmark | [-] | 25.0 | ||||||||||||||
| CESM3_092H | [-] | 43.8 | 42.8 | 25.0 | 55.1 | 29.8 | 18.4 | 21.5 | 0.841 | 0.218 | 0.620 | 0.928 | 0.954 | 0.668 | ||
| CMIP6_001 | [-] | 37.0 | 35.7 | 24.9 | 52.4 | 53.9 | 11.4 | 15.3 | 0.679 | 0.368 | 0.675 | 0.941 | 0.977 | 0.727 | ||
| LE2_001 | [-] | 35.6 | 34.2 | 24.9 | 51.4 | 53.9 | 9.88 | 14.3 | 0.665 | 0.420 | 0.663 | 0.941 | 0.978 | 0.733 |
Download Data |
Period Mean (original grids) [W m-2] |
Model Period Mean (intersection) [W m-2] |
Benchmark Period Mean (intersection) [W m-2] |
Model Period Mean (complement) [W m-2] |
Benchmark Period Mean (complement) [W m-2] |
Bias [W m-2] |
RMSE [W m-2] |
Phase Shift [months] |
Bias Score [1] |
RMSE Score [1] |
Seasonal Cycle Score [1] |
Spatial Distribution Score [1] |
Overall Score [1] |
|||
|---|---|---|---|---|---|---|---|---|---|---|---|---|---|---|---|---|
| Benchmark | [-] | 31.7 | ||||||||||||||
| CESM3_092H | [-] | 39.5 | 40.0 | 31.7 | 37.3 | 27.9 | 7.97 | 13.4 | 0.232 | 0.451 | 0.603 | 0.984 | 0.985 | 0.725 | ||
| CMIP6_001 | [-] | 35.6 | 35.9 | 31.7 | 34.2 | 23.6 | 4.12 | 12.0 | 0.318 | 0.629 | 0.581 | 0.979 | 0.984 | 0.751 | ||
| LE2_001 | [-] | 35.5 | 35.8 | 31.7 | 33.9 | 23.6 | 4.05 | 11.6 | 0.272 | 0.634 | 0.601 | 0.982 | 0.990 | 0.761 |
Download Data |
Period Mean (original grids) [W m-2] |
Model Period Mean (intersection) [W m-2] |
Benchmark Period Mean (intersection) [W m-2] |
Model Period Mean (complement) [W m-2] |
Benchmark Period Mean (complement) [W m-2] |
Bias [W m-2] |
RMSE [W m-2] |
Phase Shift [months] |
Bias Score [1] |
RMSE Score [1] |
Seasonal Cycle Score [1] |
Spatial Distribution Score [1] |
Overall Score [1] |
|||
|---|---|---|---|---|---|---|---|---|---|---|---|---|---|---|---|---|
| Benchmark | [-] | 31.8 | ||||||||||||||
| CESM3_092H | [-] | 40.0 | 39.2 | 31.8 | 48.4 | 31.0 | 7.50 | 14.2 | 0.960 | 0.444 | 0.579 | 0.879 | 0.974 | 0.691 | ||
| CMIP6_001 | [-] | 37.1 | 36.4 | 31.8 | 44.7 | 35.8 | 4.89 | 12.3 | 1.03 | 0.555 | 0.613 | 0.869 | 0.978 | 0.726 | ||
| LE2_001 | [-] | 37.1 | 36.4 | 31.8 | 44.7 | 35.8 | 4.90 | 12.4 | 1.02 | 0.549 | 0.607 | 0.868 | 0.978 | 0.722 |
Download Data |
Period Mean (original grids) [W m-2] |
Model Period Mean (intersection) [W m-2] |
Benchmark Period Mean (intersection) [W m-2] |
Model Period Mean (complement) [W m-2] |
Benchmark Period Mean (complement) [W m-2] |
Bias [W m-2] |
RMSE [W m-2] |
Phase Shift [months] |
Bias Score [1] |
RMSE Score [1] |
Seasonal Cycle Score [1] |
Spatial Distribution Score [1] |
Overall Score [1] |
|||
|---|---|---|---|---|---|---|---|---|---|---|---|---|---|---|---|---|
| Benchmark | [-] | 5.68 | ||||||||||||||
| CESM3_092H | [-] | 12.5 | 12.3 | 5.68 | 19.5 | 32.8 | 6.71 | 10.2 | 1.79 | 0.605 | 0.699 | 0.730 | 0.853 | 0.717 | ||
| CMIP6_001 | [-] | 10.2 | 9.97 | 5.67 | 18.8 | 13.0 | 4.40 | 8.46 | 2.12 | 0.710 | 0.716 | 0.673 | 0.882 | 0.739 | ||
| LE2_001 | [-] | 10.1 | 9.85 | 5.67 | 18.5 | 13.0 | 4.29 | 8.35 | 2.02 | 0.717 | 0.717 | 0.685 | 0.894 | 0.746 |
Download Data |
Period Mean (original grids) [W m-2] |
Model Period Mean (intersection) [W m-2] |
Benchmark Period Mean (intersection) [W m-2] |
Model Period Mean (complement) [W m-2] |
Benchmark Period Mean (complement) [W m-2] |
Bias [W m-2] |
RMSE [W m-2] |
Phase Shift [months] |
Bias Score [1] |
RMSE Score [1] |
Seasonal Cycle Score [1] |
Spatial Distribution Score [1] |
Overall Score [1] |
|||
|---|---|---|---|---|---|---|---|---|---|---|---|---|---|---|---|---|
| Benchmark | [-] | 13.4 | ||||||||||||||
| CESM3_092H | [-] | 20.4 | 21.0 | 13.4 | 17.7 | 6.92 | 11.6 | 0.222 | 0.339 | 0.420 | 0.985 | 0.754 | 0.583 | |||
| CMIP6_001 | [-] | 15.3 | 15.9 | 13.4 | 13.0 | 7.92 | 2.30 | 8.02 | 0.569 | 0.604 | 0.559 | 0.961 | 0.861 | 0.709 | ||
| LE2_001 | [-] | 15.5 | 16.2 | 13.4 | 13.1 | 7.92 | 2.57 | 8.63 | 0.571 | 0.582 | 0.528 | 0.961 | 0.834 | 0.687 |
Download Data |
Period Mean (original grids) [W m-2] |
Model Period Mean (intersection) [W m-2] |
Benchmark Period Mean (intersection) [W m-2] |
Model Period Mean (complement) [W m-2] |
Benchmark Period Mean (complement) [W m-2] |
Bias [W m-2] |
RMSE [W m-2] |
Phase Shift [months] |
Bias Score [1] |
RMSE Score [1] |
Seasonal Cycle Score [1] |
Spatial Distribution Score [1] |
Overall Score [1] |
|||
|---|---|---|---|---|---|---|---|---|---|---|---|---|---|---|---|---|
| Benchmark | [-] | 51.8 | ||||||||||||||
| CESM3_092H | [-] | 63.7 | 62.6 | 51.8 | 69.4 | 52.2 | 11.4 | 19.4 | 1.31 | 0.417 | 0.654 | 0.822 | 0.960 | 0.702 | ||
| CMIP6_001 | [-] | 60.4 | 60.0 | 51.9 | 64.0 | 40.5 | 9.05 | 21.0 | 1.79 | 0.379 | 0.588 | 0.747 | 0.978 | 0.656 | ||
| LE2_001 | [-] | 61.7 | 61.1 | 51.9 | 65.7 | 40.5 | 10.3 | 21.4 | 1.78 | 0.365 | 0.576 | 0.750 | 0.978 | 0.649 |
Download Data |
Period Mean (original grids) [W m-2] |
Model Period Mean (intersection) [W m-2] |
Benchmark Period Mean (intersection) [W m-2] |
Model Period Mean (complement) [W m-2] |
Benchmark Period Mean (complement) [W m-2] |
Bias [W m-2] |
RMSE [W m-2] |
Phase Shift [months] |
Bias Score [1] |
RMSE Score [1] |
Seasonal Cycle Score [1] |
Spatial Distribution Score [1] |
Overall Score [1] |
|||
|---|---|---|---|---|---|---|---|---|---|---|---|---|---|---|---|---|
| Benchmark | [-] | 51.0 | ||||||||||||||
| CESM3_092H | [-] | 56.5 | 56.0 | 51.0 | 62.0 | 5.42 | 16.0 | 0.787 | 0.482 | 0.493 | 0.943 | 0.990 | 0.680 | |||
| CMIP6_001 | [-] | 51.6 | 51.0 | 51.0 | 58.4 | 39.3 | 0.444 | 14.5 | 0.786 | 0.593 | 0.509 | 0.941 | 0.990 | 0.708 | ||
| LE2_001 | [-] | 52.2 | 51.5 | 51.0 | 58.8 | 39.3 | 1.01 | 14.9 | 0.782 | 0.586 | 0.495 | 0.940 | 0.991 | 0.701 |
Download Data |
Period Mean (original grids) [W m-2] |
Model Period Mean (intersection) [W m-2] |
Benchmark Period Mean (intersection) [W m-2] |
Model Period Mean (complement) [W m-2] |
Benchmark Period Mean (complement) [W m-2] |
Bias [W m-2] |
RMSE [W m-2] |
Phase Shift [months] |
Bias Score [1] |
RMSE Score [1] |
Seasonal Cycle Score [1] |
Spatial Distribution Score [1] |
Overall Score [1] |
|||
|---|---|---|---|---|---|---|---|---|---|---|---|---|---|---|---|---|
| Benchmark | [-] | 25.2 | ||||||||||||||
| CESM3_092H | [-] | 39.5 | 38.9 | 25.2 | 44.0 | 13.8 | 18.1 | 0.210 | 0.138 | 0.443 | 0.986 | 0.885 | 0.579 | |||
| CMIP6_001 | [-] | 32.7 | 32.3 | 25.2 | 36.2 | 28.2 | 7.13 | 11.6 | 0.262 | 0.453 | 0.591 | 0.982 | 0.957 | 0.715 | ||
| LE2_001 | [-] | 33.0 | 32.6 | 25.2 | 36.3 | 28.2 | 7.43 | 11.8 | 0.322 | 0.431 | 0.589 | 0.978 | 0.958 | 0.709 |
Download Data |
Period Mean (original grids) [W m-2] |
Model Period Mean (intersection) [W m-2] |
Benchmark Period Mean (intersection) [W m-2] |
Model Period Mean (complement) [W m-2] |
Benchmark Period Mean (complement) [W m-2] |
Bias [W m-2] |
RMSE [W m-2] |
Phase Shift [months] |
Bias Score [1] |
RMSE Score [1] |
Seasonal Cycle Score [1] |
Spatial Distribution Score [1] |
Overall Score [1] |
|||
|---|---|---|---|---|---|---|---|---|---|---|---|---|---|---|---|---|
| Benchmark | [-] | 24.5 | ||||||||||||||
| CESM3_092H | [-] | 33.8 | 33.8 | 24.5 | 36.7 | 9.46 | 14.8 | 0.900 | 0.413 | 0.556 | 0.911 | 0.934 | 0.674 | |||
| CMIP6_001 | [-] | 28.9 | 29.1 | 24.5 | 30.2 | 39.2 | 4.72 | 12.1 | 1.02 | 0.570 | 0.604 | 0.887 | 0.875 | 0.708 | ||
| LE2_001 | [-] | 30.1 | 30.4 | 24.5 | 31.7 | 39.2 | 6.03 | 13.2 | 0.997 | 0.522 | 0.574 | 0.890 | 0.916 | 0.695 |
Download Data |
Period Mean (original grids) [W m-2] |
Model Period Mean (intersection) [W m-2] |
Benchmark Period Mean (intersection) [W m-2] |
Model Period Mean (complement) [W m-2] |
Benchmark Period Mean (complement) [W m-2] |
Bias [W m-2] |
RMSE [W m-2] |
Phase Shift [months] |
Bias Score [1] |
RMSE Score [1] |
Seasonal Cycle Score [1] |
Spatial Distribution Score [1] |
Overall Score [1] |
|||
|---|---|---|---|---|---|---|---|---|---|---|---|---|---|---|---|---|
| Benchmark | [-] | 87.1 | ||||||||||||||
| CESM3_092H | [-] | 89.1 | 89.5 | 87.1 | 82.4 | 2.07 | 19.9 | 2.10 | 0.578 | 0.570 | 0.683 | 0.655 | 0.611 | |||
| CMIP6_001 | [-] | 94.7 | 94.8 | 87.1 | 92.2 | 63.5 | 7.63 | 17.0 | 1.96 | 0.544 | 0.678 | 0.704 | 0.787 | 0.679 | ||
| LE2_001 | [-] | 94.9 | 95.0 | 87.1 | 93.6 | 63.5 | 7.80 | 16.9 | 2.14 | 0.550 | 0.678 | 0.678 | 0.808 | 0.678 |
Download Data |
Period Mean (original grids) [W m-2] |
Model Period Mean (intersection) [W m-2] |
Benchmark Period Mean (intersection) [W m-2] |
Model Period Mean (complement) [W m-2] |
Benchmark Period Mean (complement) [W m-2] |
Bias [W m-2] |
RMSE [W m-2] |
Phase Shift [months] |
Bias Score [1] |
RMSE Score [1] |
Seasonal Cycle Score [1] |
Spatial Distribution Score [1] |
Overall Score [1] |
|||
|---|---|---|---|---|---|---|---|---|---|---|---|---|---|---|---|---|
| Benchmark | [-] | 63.7 | ||||||||||||||
| CESM3_092H | [-] | 65.1 | 65.0 | 63.7 | 66.6 | 1.32 | 16.2 | 0.942 | 0.630 | 0.611 | 0.907 | 0.990 | 0.750 | |||
| CMIP6_001 | [-] | 61.0 | 60.8 | 63.7 | 65.1 | -2.77 | 15.6 | 0.985 | 0.598 | 0.659 | 0.902 | 0.962 | 0.756 | |||
| LE2_001 | [-] | 59.4 | 59.1 | 63.7 | 64.1 | -4.41 | 16.1 | 0.929 | 0.561 | 0.662 | 0.908 | 0.964 | 0.751 |
Download Data |
Period Mean (original grids) [W m-2] |
Model Period Mean (intersection) [W m-2] |
Benchmark Period Mean (intersection) [W m-2] |
Model Period Mean (complement) [W m-2] |
Benchmark Period Mean (complement) [W m-2] |
Bias [W m-2] |
RMSE [W m-2] |
Phase Shift [months] |
Bias Score [1] |
RMSE Score [1] |
Seasonal Cycle Score [1] |
Spatial Distribution Score [1] |
Overall Score [1] |
|||
|---|---|---|---|---|---|---|---|---|---|---|---|---|---|---|---|---|
| Benchmark | [-] | 23.4 | ||||||||||||||
| CESM3_092H | [-] | 43.8 | 44.1 | 23.4 | 38.3 | 20.3 | 23.5 | 0.810 | 0.164 | 0.564 | 0.912 | 0.936 | 0.628 | |||
| CMIP6_001 | [-] | 37.5 | 37.7 | 23.4 | 32.0 | 17.5 | 13.9 | 18.7 | 0.862 | 0.300 | 0.567 | 0.907 | 0.925 | 0.653 | ||
| LE2_001 | [-] | 37.8 | 38.0 | 23.4 | 32.1 | 17.5 | 14.1 | 18.7 | 0.746 | 0.291 | 0.576 | 0.920 | 0.932 | 0.659 |
Temporally integrated period mean