Mean State
Download Data |
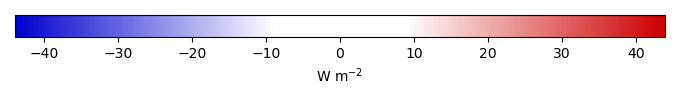
Period Mean (original grids) [W m-2] |
Bias [W m-2] |
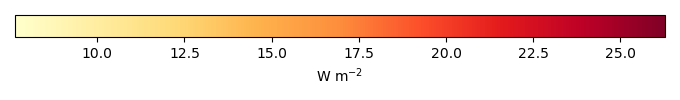
RMSE [W m-2] |
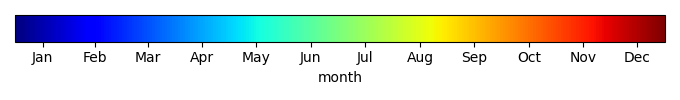
Phase Shift [months] |
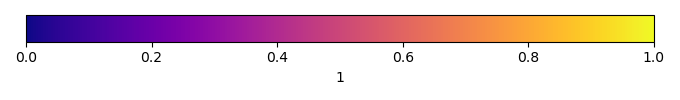
Bias Score [1] |
RMSE Score [1] |
Seasonal Cycle Score [1] |
Overall Score [1] |
|||
|---|---|---|---|---|---|---|---|---|---|---|---|
| Benchmark | [-] | -30.7 | |||||||||
| CESM3_092H | [-] | -40.3 | -10.3 | 13.1 | 0.00 | 0.376 | 0.664 | 1.00 | 0.676 | ||
| CMIP6_001 | [-] | -42.6 | -11.9 | 11.8 | 1.02 | 0.279 | 0.750 | 0.933 | 0.678 | ||
| LE2_001 | [-] | -42.6 | -11.9 | 15.7 | 2.05 | 0.276 | 0.616 | 0.745 | 0.564 |
Download Data |
Period Mean (original grids) [W m-2] |
Bias [W m-2] |
RMSE [W m-2] |
Phase Shift [months] |
Bias Score [1] |
RMSE Score [1] |
Seasonal Cycle Score [1] |
Overall Score [1] |
|||
|---|---|---|---|---|---|---|---|---|---|---|---|
| Benchmark | [-] | -72.1 | |||||||||
| CESM3_092H | [-] | -98.3 | -26.2 | 29.3 | 0.00 | 0.00 | 0.382 | 1.00 | 0.441 | ||
| CMIP6_001 | [-] | -90.3 | -18.2 | 27.2 | 0.00 | 0.00 | 0.153 | 1.00 | 0.326 | ||
| LE2_001 | [-] | -88.7 | -16.6 | 24.9 | 0.983 | 0.00 | 0.174 | 0.937 | 0.321 |
Download Data |
Period Mean (original grids) [W m-2] |
Bias [W m-2] |
RMSE [W m-2] |
Phase Shift [months] |
Bias Score [1] |
RMSE Score [1] |
Seasonal Cycle Score [1] |
Overall Score [1] |
|||
|---|---|---|---|---|---|---|---|---|---|---|---|
| Benchmark | [-] | -32.4 | |||||||||
| CESM3_092H | [-] | -36.0 | -3.32 | 24.4 | 1.01 | 0.683 | 0.00 | 0.934 | 0.404 | ||
| CMIP6_001 | [-] | -34.0 | -1.51 | 23.4 | 1.01 | 0.786 | 0.0576 | 0.934 | 0.459 | ||
| LE2_001 | [-] | -32.0 | 0.470 | 22.7 | 1.01 | 0.827 | 0.0216 | 0.934 | 0.451 |
Download Data |
Period Mean (original grids) [W m-2] |
Bias [W m-2] |
RMSE [W m-2] |
Phase Shift [months] |
Bias Score [1] |
RMSE Score [1] |
Seasonal Cycle Score [1] |
Overall Score [1] |
|||
|---|---|---|---|---|---|---|---|---|---|---|---|
| Benchmark | [-] | -32.8 | |||||||||
| CESM3_092H | [-] | -43.5 | -10.7 | 13.3 | 0.00 | 0.351 | 0.645 | 1.00 | 0.660 | ||
| CMIP6_001 | [-] | -37.1 | -4.28 | 10.2 | 2.03 | 0.740 | 0.555 | 0.749 | 0.650 | ||
| LE2_001 | [-] | -37.4 | -4.58 | 9.84 | 1.02 | 0.722 | 0.546 | 0.933 | 0.687 |
Download Data |
Period Mean (original grids) [W m-2] |
Bias [W m-2] |
RMSE [W m-2] |
Phase Shift [months] |
Bias Score [1] |
RMSE Score [1] |
Seasonal Cycle Score [1] |
Overall Score [1] |
|||
|---|---|---|---|---|---|---|---|---|---|---|---|
| Benchmark | [-] | -38.3 | |||||||||
| CESM3_092H | [-] | -53.2 | -14.8 | 20.4 | 1.03 | 0.00 | 0.213 | 0.930 | 0.339 | ||
| CMIP6_001 | [-] | -45.7 | -7.35 | 14.6 | 1.03 | 0.414 | 0.243 | 0.930 | 0.458 | ||
| LE2_001 | [-] | -45.3 | -6.96 | 14.4 | 0.00 | 0.445 | 0.234 | 1.00 | 0.478 |
Download Data |
Period Mean (original grids) [W m-2] |
Bias [W m-2] |
RMSE [W m-2] |
Phase Shift [months] |
Bias Score [1] |
RMSE Score [1] |
Seasonal Cycle Score [1] |
Overall Score [1] |
|||
|---|---|---|---|---|---|---|---|---|---|---|---|
| Benchmark | [-] | -55.6 | |||||||||
| CESM3_092H | [-] | -62.3 | -6.73 | 18.2 | 0.672 | 0.114 | 0.244 | 0.917 | 0.380 | ||
| CMIP6_001 | [-] | -58.0 | -2.45 | 17.3 | 0.328 | 0.193 | 0.255 | 0.979 | 0.420 | ||
| LE2_001 | [-] | -58.4 | -2.82 | 17.4 | 0.328 | 0.164 | 0.250 | 0.979 | 0.411 |
Download Data |
Period Mean (original grids) [W m-2] |
Bias [W m-2] |
RMSE [W m-2] |
Phase Shift [months] |
Bias Score [1] |
RMSE Score [1] |
Seasonal Cycle Score [1] |
Overall Score [1] |
|||
|---|---|---|---|---|---|---|---|---|---|---|---|
| Benchmark | [-] | -68.9 | |||||||||
| CESM3_092H | [-] | -81.7 | -12.9 | 20.5 | 1.01 | 0.307 | 0.237 | 0.879 | 0.415 | ||
| CMIP6_001 | [-] | -77.8 | -7.20 | 19.4 | 0.821 | 0.528 | 0.206 | 0.933 | 0.468 | ||
| LE2_001 | [-] | -79.8 | -9.22 | 18.2 | 1.00 | 0.449 | 0.286 | 0.880 | 0.475 |
Download Data |
Period Mean (original grids) [W m-2] |
Bias [W m-2] |
RMSE [W m-2] |
Phase Shift [months] |
Bias Score [1] |
RMSE Score [1] |
Seasonal Cycle Score [1] |
Overall Score [1] |
|||
|---|---|---|---|---|---|---|---|---|---|---|---|
| Benchmark | [-] | -47.4 | |||||||||
| CESM3_092H | [-] | -62.8 | -15.3 | 22.9 | 0.997 | 0.160 | 0.193 | 0.883 | 0.357 | ||
| CMIP6_001 | [-] | -58.6 | -11.2 | 21.4 | 0.917 | 0.280 | 0.170 | 0.897 | 0.379 | ||
| LE2_001 | [-] | -59.4 | -12.0 | 21.6 | 0.812 | 0.248 | 0.155 | 0.911 | 0.367 |
Download Data |
Period Mean (original grids) [W m-2] |
Bias [W m-2] |
RMSE [W m-2] |
Phase Shift [months] |
Bias Score [1] |
RMSE Score [1] |
Seasonal Cycle Score [1] |
Overall Score [1] |
|||
|---|---|---|---|---|---|---|---|---|---|---|---|
| Benchmark | [-] | -54.8 | |||||||||
| CESM3_092H | [-] | -70.9 | -16.0 | 23.5 | 1.18 | 0.201 | 0.219 | 0.850 | 0.372 | ||
| CMIP6_001 | [-] | -67.4 | -12.4 | 22.1 | 1.12 | 0.311 | 0.190 | 0.864 | 0.389 | ||
| LE2_001 | [-] | -67.8 | -12.9 | 21.7 | 1.04 | 0.289 | 0.192 | 0.872 | 0.386 |
Download Data |
Period Mean (original grids) [W m-2] |
Bias [W m-2] |
RMSE [W m-2] |
Phase Shift [months] |
Bias Score [1] |
RMSE Score [1] |
Seasonal Cycle Score [1] |
Overall Score [1] |
|||
|---|---|---|---|---|---|---|---|---|---|---|---|
| Benchmark | [-] | -33.6 | |||||||||
| CESM3_092H | [-] | -36.3 | -2.34 | 13.9 | 0.508 | 0.780 | 0.236 | 0.966 | 0.555 | ||
| CMIP6_001 | [-] | -33.7 | -0.0850 | 14.0 | 2.55 | 0.972 | 0.224 | 0.589 | 0.502 | ||
| LE2_001 | [-] | -33.9 | -0.253 | 14.4 | 1.52 | 0.912 | 0.181 | 0.841 | 0.529 |
Download Data |
Period Mean (original grids) [W m-2] |
Bias [W m-2] |
RMSE [W m-2] |
Phase Shift [months] |
Bias Score [1] |
RMSE Score [1] |
Seasonal Cycle Score [1] |
Overall Score [1] |
|||
|---|---|---|---|---|---|---|---|---|---|---|---|
| Benchmark | [-] | -40.8 | |||||||||
| CESM3_092H | [-] | -73.3 | -32.5 | 35.5 | 1.56 | 0.00 | 0.297 | 0.790 | 0.346 | ||
| CMIP6_001 | [-] | -67.1 | -26.4 | 30.5 | 1.40 | 0.0251 | 0.264 | 0.813 | 0.342 | ||
| LE2_001 | [-] | -66.7 | -25.9 | 29.7 | 1.28 | 0.0260 | 0.231 | 0.852 | 0.335 |
Download Data |
Period Mean (original grids) [W m-2] |
Bias [W m-2] |
RMSE [W m-2] |
Phase Shift [months] |
Bias Score [1] |
RMSE Score [1] |
Seasonal Cycle Score [1] |
Overall Score [1] |
|||
|---|---|---|---|---|---|---|---|---|---|---|---|
| Benchmark | [-] | -49.4 | |||||||||
| CESM3_092H | [-] | -61.7 | -12.3 | 17.1 | 0.148 | 0.0478 | 0.225 | 0.990 | 0.372 | ||
| CMIP6_001 | [-] | -54.9 | -5.54 | 14.5 | 0.148 | 0.483 | 0.167 | 0.990 | 0.452 | ||
| LE2_001 | [-] | -55.0 | -5.68 | 14.4 | 0.148 | 0.471 | 0.172 | 0.990 | 0.451 |
Download Data |
Period Mean (original grids) [W m-2] |
Bias [W m-2] |
RMSE [W m-2] |
Phase Shift [months] |
Bias Score [1] |
RMSE Score [1] |
Seasonal Cycle Score [1] |
Overall Score [1] |
|||
|---|---|---|---|---|---|---|---|---|---|---|---|
| Benchmark | [-] | -80.7 | |||||||||
| CESM3_092H | [-] | -94.5 | -13.3 | 23.8 | 2.09 | 0.331 | 0.129 | 0.709 | 0.324 | ||
| CMIP6_001 | [-] | -97.8 | -17.1 | 26.3 | 1.98 | 0.204 | 0.0724 | 0.723 | 0.268 | ||
| LE2_001 | [-] | -96.8 | -16.0 | 25.4 | 1.69 | 0.246 | 0.0735 | 0.743 | 0.284 |
Download Data |
Period Mean (original grids) [W m-2] |
Bias [W m-2] |
RMSE [W m-2] |
Phase Shift [months] |
Bias Score [1] |
RMSE Score [1] |
Seasonal Cycle Score [1] |
Overall Score [1] |
|||
|---|---|---|---|---|---|---|---|---|---|---|---|
| Benchmark | [-] | -35.2 | |||||||||
| CESM3_092H | [-] | -51.6 | -16.4 | 20.2 | 3.52 | 0.108 | 0.468 | 0.381 | 0.356 | ||
| CMIP6_001 | [-] | -47.2 | -12.0 | 15.6 | 3.02 | 0.272 | 0.571 | 0.506 | 0.480 | ||
| LE2_001 | [-] | -46.9 | -11.7 | 15.8 | 3.02 | 0.291 | 0.568 | 0.506 | 0.483 |
Temporally integrated period mean