Mean State
Download Data |
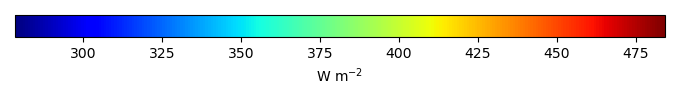
Period Mean (original grids) [W m-2] |
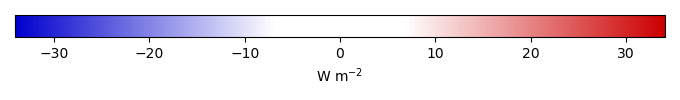
Bias [W m-2] |
RMSE [W m-2] |
Phase Shift [months] |
Bias Score [1] |
RMSE Score [1] |
Seasonal Cycle Score [1] |
Overall Score [1] |
|||
|---|---|---|---|---|---|---|---|---|---|---|---|
| Benchmark | [-] | 436. | |||||||||
| CESM3_092H | [-] | 468. | 32.5 | 33.9 | 1.02 | 0.00 | 0.609 | 0.933 | 0.538 | ||
| CMIP6_001 | [-] | 468. | 32.1 | 36.2 | 1.02 | 0.00 | 0.467 | 0.933 | 0.467 | ||
| LE2_001 | [-] | 468. | 32.3 | 37.4 | 1.02 | 0.00 | 0.527 | 0.933 | 0.497 |
Download Data |
Period Mean (original grids) [W m-2] |
Bias [W m-2] |
RMSE [W m-2] |
Phase Shift [months] |
Bias Score [1] |
RMSE Score [1] |
Seasonal Cycle Score [1] |
Overall Score [1] |
|||
|---|---|---|---|---|---|---|---|---|---|---|---|
| Benchmark | [-] | 429. | |||||||||
| CESM3_092H | [-] | 461. | 32.0 | 35.7 | 0.00 | 0.00 | 0.268 | 1.00 | 0.384 | ||
| CMIP6_001 | [-] | 460. | 30.4 | 36.6 | 1.02 | 0.00 | 0.0210 | 0.933 | 0.244 | ||
| LE2_001 | [-] | 460. | 30.7 | 36.8 | 1.02 | 0.00 | 0.0850 | 0.933 | 0.276 |
Download Data |
Period Mean (original grids) [W m-2] |
Bias [W m-2] |
RMSE [W m-2] |
Phase Shift [months] |
Bias Score [1] |
RMSE Score [1] |
Seasonal Cycle Score [1] |
Overall Score [1] |
|||
|---|---|---|---|---|---|---|---|---|---|---|---|
| Benchmark | [-] | 295. | |||||||||
| CESM3_092H | [-] | 274. | -21.2 | 18.0 | 0.00 | 0.123 | 0.00 | 1.00 | 0.281 | ||
| CMIP6_001 | [-] | 282. | -12.8 | 22.8 | 0.508 | 0.482 | 0.00 | 0.966 | 0.362 | ||
| LE2_001 | [-] | 282. | -12.3 | 24.4 | 0.508 | 0.482 | 0.00 | 0.966 | 0.362 |
Download Data |
Period Mean (original grids) [W m-2] |
Bias [W m-2] |
RMSE [W m-2] |
Phase Shift [months] |
Bias Score [1] |
RMSE Score [1] |
Seasonal Cycle Score [1] |
Overall Score [1] |
|||
|---|---|---|---|---|---|---|---|---|---|---|---|
| Benchmark | [-] | 452. | |||||||||
| CESM3_092H | [-] | 471. | 19.4 | 21.4 | 2.03 | 0.00 | 0.656 | 0.749 | 0.515 | ||
| CMIP6_001 | [-] | 465. | 12.9 | 14.6 | 0.00 | 0.0480 | 0.679 | 1.00 | 0.602 | ||
| LE2_001 | [-] | 465. | 12.9 | 14.1 | 1.02 | 0.0474 | 0.714 | 0.933 | 0.602 |
Download Data |
Period Mean (original grids) [W m-2] |
Bias [W m-2] |
RMSE [W m-2] |
Phase Shift [months] |
Bias Score [1] |
RMSE Score [1] |
Seasonal Cycle Score [1] |
Overall Score [1] |
|||
|---|---|---|---|---|---|---|---|---|---|---|---|
| Benchmark | [-] | 339. | |||||||||
| CESM3_092H | [-] | 361. | 21.5 | 28.7 | 0.00 | 0.00 | 0.0372 | 1.00 | 0.269 | ||
| CMIP6_001 | [-] | 350. | 10.1 | 20.0 | 0.00 | 0.193 | 0.0861 | 1.00 | 0.341 | ||
| LE2_001 | [-] | 352. | 12.2 | 22.0 | 0.00 | 0.0266 | 0.0456 | 1.00 | 0.279 |
Download Data |
Period Mean (original grids) [W m-2] |
Bias [W m-2] |
RMSE [W m-2] |
Phase Shift [months] |
Bias Score [1] |
RMSE Score [1] |
Seasonal Cycle Score [1] |
Overall Score [1] |
|||
|---|---|---|---|---|---|---|---|---|---|---|---|
| Benchmark | [-] | 356. | |||||||||
| CESM3_092H | [-] | 380. | 23.7 | 30.8 | 0.00 | 0.00 | 0.218 | 1.00 | 0.359 | ||
| CMIP6_001 | [-] | 365. | 8.95 | 17.0 | 0.344 | 0.511 | 0.366 | 0.977 | 0.555 | ||
| LE2_001 | [-] | 367. | 10.3 | 18.8 | 0.344 | 0.431 | 0.297 | 0.977 | 0.500 |
Download Data |
Period Mean (original grids) [W m-2] |
Bias [W m-2] |
RMSE [W m-2] |
Phase Shift [months] |
Bias Score [1] |
RMSE Score [1] |
Seasonal Cycle Score [1] |
Overall Score [1] |
|||
|---|---|---|---|---|---|---|---|---|---|---|---|
| Benchmark | [-] | 428. | |||||||||
| CESM3_092H | [-] | 443. | 15.7 | 26.4 | 0.730 | 0.246 | 0.270 | 0.947 | 0.433 | ||
| CMIP6_001 | [-] | 440. | 11.3 | 23.5 | 0.589 | 0.353 | 0.304 | 0.956 | 0.479 | ||
| LE2_001 | [-] | 440. | 11.6 | 24.0 | 0.546 | 0.343 | 0.296 | 0.959 | 0.473 |
Download Data |
Period Mean (original grids) [W m-2] |
Bias [W m-2] |
RMSE [W m-2] |
Phase Shift [months] |
Bias Score [1] |
RMSE Score [1] |
Seasonal Cycle Score [1] |
Overall Score [1] |
|||
|---|---|---|---|---|---|---|---|---|---|---|---|
| Benchmark | [-] | 361. | |||||||||
| CESM3_092H | [-] | 384. | 22.2 | 33.2 | 0.759 | 0.0857 | 0.0854 | 0.947 | 0.301 | ||
| CMIP6_001 | [-] | 374. | 12.7 | 24.6 | 0.885 | 0.204 | 0.189 | 0.938 | 0.380 | ||
| LE2_001 | [-] | 376. | 14.2 | 25.0 | 0.611 | 0.177 | 0.188 | 0.956 | 0.377 |
Download Data |
Period Mean (original grids) [W m-2] |
Bias [W m-2] |
RMSE [W m-2] |
Phase Shift [months] |
Bias Score [1] |
RMSE Score [1] |
Seasonal Cycle Score [1] |
Overall Score [1] |
|||
|---|---|---|---|---|---|---|---|---|---|---|---|
| Benchmark | [-] | 376. | |||||||||
| CESM3_092H | [-] | 396. | 19.3 | 31.6 | 0.778 | 0.128 | 0.119 | 0.939 | 0.326 | ||
| CMIP6_001 | [-] | 390. | 13.9 | 26.2 | 0.755 | 0.226 | 0.173 | 0.945 | 0.379 | ||
| LE2_001 | [-] | 391. | 14.6 | 26.5 | 0.632 | 0.212 | 0.165 | 0.954 | 0.374 |
Download Data |
Period Mean (original grids) [W m-2] |
Bias [W m-2] |
RMSE [W m-2] |
Phase Shift [months] |
Bias Score [1] |
RMSE Score [1] |
Seasonal Cycle Score [1] |
Overall Score [1] |
|||
|---|---|---|---|---|---|---|---|---|---|---|---|
| Benchmark | [-] | 285. | |||||||||
| CESM3_092H | [-] | 294. | 8.43 | 20.5 | 0.00 | 0.454 | 0.00 | 1.00 | 0.363 | ||
| CMIP6_001 | [-] | 299. | 13.9 | 25.8 | 0.00 | 0.275 | 0.00 | 1.00 | 0.319 | ||
| LE2_001 | [-] | 302. | 17.5 | 27.8 | 0.508 | 0.127 | 0.00 | 0.966 | 0.273 |
Download Data |
Period Mean (original grids) [W m-2] |
Bias [W m-2] |
RMSE [W m-2] |
Phase Shift [months] |
Bias Score [1] |
RMSE Score [1] |
Seasonal Cycle Score [1] |
Overall Score [1] |
|||
|---|---|---|---|---|---|---|---|---|---|---|---|
| Benchmark | [-] | 364. | |||||||||
| CESM3_092H | [-] | 388. | 24.2 | 37.6 | 0.964 | 0.0272 | 0.00 | 0.935 | 0.241 | ||
| CMIP6_001 | [-] | 381. | 17.6 | 31.6 | 1.03 | 0.163 | 0.00729 | 0.923 | 0.275 | ||
| LE2_001 | [-] | 381. | 17.2 | 32.3 | 0.774 | 0.178 | 0.00 | 0.948 | 0.281 |
Download Data |
Period Mean (original grids) [W m-2] |
Bias [W m-2] |
RMSE [W m-2] |
Phase Shift [months] |
Bias Score [1] |
RMSE Score [1] |
Seasonal Cycle Score [1] |
Overall Score [1] |
|||
|---|---|---|---|---|---|---|---|---|---|---|---|
| Benchmark | [-] | 325. | |||||||||
| CESM3_092H | [-] | 341. | 16.6 | 31.5 | 0.738 | 0.0219 | 0.00 | 0.950 | 0.243 | ||
| CMIP6_001 | [-] | 336. | 11.3 | 22.1 | 0.295 | 0.147 | 0.0875 | 0.980 | 0.326 | ||
| LE2_001 | [-] | 336. | 11.2 | 21.5 | 0.148 | 0.155 | 0.0799 | 0.990 | 0.326 |
Download Data |
Period Mean (original grids) [W m-2] |
Bias [W m-2] |
RMSE [W m-2] |
Phase Shift [months] |
Bias Score [1] |
RMSE Score [1] |
Seasonal Cycle Score [1] |
Overall Score [1] |
|||
|---|---|---|---|---|---|---|---|---|---|---|---|
| Benchmark | [-] | 388. | |||||||||
| CESM3_092H | [-] | 404. | 15.7 | 32.6 | 1.14 | 0.253 | 0.0819 | 0.884 | 0.325 | ||
| CMIP6_001 | [-] | 408. | 20.0 | 32.9 | 0.855 | 0.190 | 0.0692 | 0.930 | 0.315 | ||
| LE2_001 | [-] | 408. | 19.8 | 32.2 | 0.969 | 0.203 | 0.0528 | 0.922 | 0.308 |
Download Data |
Period Mean (original grids) [W m-2] |
Bias [W m-2] |
RMSE [W m-2] |
Phase Shift [months] |
Bias Score [1] |
RMSE Score [1] |
Seasonal Cycle Score [1] |
Overall Score [1] |
|||
|---|---|---|---|---|---|---|---|---|---|---|---|
| Benchmark | [-] | 450. | |||||||||
| CESM3_092H | [-] | 470. | 19.8 | 22.8 | 0.00 | 0.00 | 0.445 | 1.00 | 0.473 | ||
| CMIP6_001 | [-] | 466. | 15.6 | 18.9 | 0.00 | 0.0774 | 0.651 | 1.00 | 0.595 | ||
| LE2_001 | [-] | 466. | 15.7 | 20.3 | 0.00 | 0.0698 | 0.582 | 1.00 | 0.559 |
Temporally integrated period mean