Mean State
Download Data |
Period Mean (original grids) [Pg] |
Model Period Mean (intersection) [Pg] |
Benchmark Period Mean (intersection) [Pg] |
Model Period Mean (complement) [Pg] |
Benchmark Period Mean (complement) [Pg] |
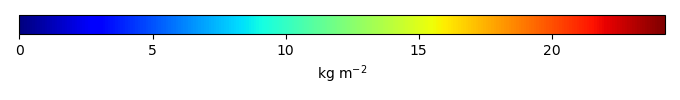
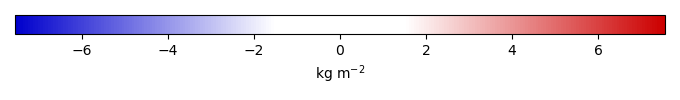
Bias [kg m-2] |
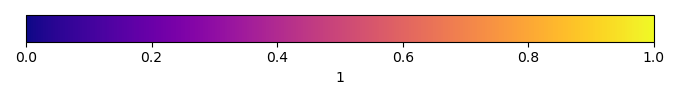
Bias Score [1] |
Spatial Distribution Score [1] |
Overall Score [1] |
|||
|---|---|---|---|---|---|---|---|---|---|---|---|---|
| Benchmark | [-] | 4.43 | ||||||||||
| CESM3_092H | [-] | 11.8 | 11.3 | 4.43 | 0.581 | 2.81 | 0.197 | 0.561 | 0.379 | |||
| CESM3_098bH | [-] | 12.2 | 11.7 | 4.43 | 0.618 | 2.94 | 0.185 | 0.567 | 0.376 | |||
| CMIP6_001 | [-] | 4.18 | 4.13 | 4.36 | 0.0947 | 0.0705 | -0.00357 | 0.492 | 0.764 | 0.628 | ||
| LE2_001 | [-] | 4.12 | 4.07 | 4.36 | 0.0925 | 0.0705 | -0.0248 | 0.495 | 0.765 | 0.630 |
Download Data |
Period Mean (original grids) [Pg] |
Model Period Mean (intersection) [Pg] |
Benchmark Period Mean (intersection) [Pg] |
Model Period Mean (complement) [Pg] |
Benchmark Period Mean (complement) [Pg] |
Bias [kg m-2] |
Bias Score [1] |
Spatial Distribution Score [1] |
Overall Score [1] |
|||
|---|---|---|---|---|---|---|---|---|---|---|---|---|
| Benchmark | [-] | 40.1 | ||||||||||
| CESM3_092H | [-] | 89.6 | 87.8 | 40.1 | 0.478 | 0.00333 | 5.66 | 0.319 | 0.359 | 0.339 | ||
| CESM3_098bH | [-] | 90.9 | 89.1 | 40.1 | 0.476 | 0.00333 | 5.80 | 0.311 | 0.353 | 0.332 | ||
| CMIP6_001 | [-] | 55.4 | 54.2 | 39.9 | 0.304 | 0.184 | 1.74 | 0.582 | 0.593 | 0.588 | ||
| LE2_001 | [-] | 55.8 | 54.6 | 39.9 | 0.309 | 0.184 | 1.79 | 0.578 | 0.594 | 0.586 |
Download Data |
Period Mean (original grids) [Pg] |
Model Period Mean (intersection) [Pg] |
Benchmark Period Mean (intersection) [Pg] |
Model Period Mean (complement) [Pg] |
Benchmark Period Mean (complement) [Pg] |
Bias [kg m-2] |
Bias Score [1] |
Spatial Distribution Score [1] |
Overall Score [1] |
|||
|---|---|---|---|---|---|---|---|---|---|---|---|---|
| Benchmark | [-] | 28.0 | ||||||||||
| CESM3_092H | [-] | 47.8 | 21.2 | 28.0 | 27.6 | 0.00891 | -0.337 | 0.499 | 0.493 | 0.496 | ||
| CESM3_098bH | [-] | 47.3 | 21.0 | 28.0 | 27.2 | 0.00891 | -0.355 | 0.497 | 0.492 | 0.494 | ||
| CMIP6_001 | [-] | 34.1 | 16.4 | 27.7 | 18.6 | 0.322 | -1.09 | 0.519 | 0.682 | 0.600 | ||
| LE2_001 | [-] | 34.2 | 16.6 | 27.7 | 18.5 | 0.322 | -1.06 | 0.518 | 0.676 | 0.597 |
Download Data |
Period Mean (original grids) [Pg] |
Model Period Mean (intersection) [Pg] |
Benchmark Period Mean (intersection) [Pg] |
Model Period Mean (complement) [Pg] |
Benchmark Period Mean (complement) [Pg] |
Bias [kg m-2] |
Bias Score [1] |
Spatial Distribution Score [1] |
Overall Score [1] |
|||
|---|---|---|---|---|---|---|---|---|---|---|---|---|
| Benchmark | [-] | 0.341 | ||||||||||
| CESM3_092H | [-] | 27.7 | 0.120 | 0.341 | 26.9 | -1.57 | 0.529 | 0.856 | 0.693 | |||
| CESM3_098bH | [-] | 28.0 | 0.143 | 0.341 | 27.2 | -1.41 | 0.548 | 0.889 | 0.719 | |||
| CMIP6_001 | [-] | 24.6 | 0.0710 | 0.341 | 23.7 | -1.88 | 0.466 | 0.554 | 0.510 | |||
| LE2_001 | [-] | 24.4 | 0.0686 | 0.341 | 23.6 | -1.90 | 0.461 | 0.582 | 0.522 |
Download Data |
Period Mean (original grids) [Pg] |
Model Period Mean (intersection) [Pg] |
Benchmark Period Mean (intersection) [Pg] |
Model Period Mean (complement) [Pg] |
Benchmark Period Mean (complement) [Pg] |
Bias [kg m-2] |
Bias Score [1] |
Spatial Distribution Score [1] |
Overall Score [1] |
|||
|---|---|---|---|---|---|---|---|---|---|---|---|---|
| Benchmark | [-] | 3.80 | ||||||||||
| CESM3_092H | [-] | 12.9 | 11.8 | 3.80 | 1.58 | 0.000494 | 3.32 | 0.162 | 0.495 | 0.328 | ||
| CESM3_098bH | [-] | 13.0 | 11.9 | 3.80 | 1.62 | 0.000494 | 3.38 | 0.157 | 0.499 | 0.328 | ||
| CMIP6_001 | [-] | 2.59 | 2.65 | 3.79 | 0.108 | 0.00634 | -0.434 | 0.430 | 0.678 | 0.554 | ||
| LE2_001 | [-] | 2.77 | 2.83 | 3.79 | 0.118 | 0.00634 | -0.360 | 0.425 | 0.665 | 0.545 |
Download Data |
Period Mean (original grids) [Pg] |
Model Period Mean (intersection) [Pg] |
Benchmark Period Mean (intersection) [Pg] |
Model Period Mean (complement) [Pg] |
Benchmark Period Mean (complement) [Pg] |
Bias [kg m-2] |
Bias Score [1] |
Spatial Distribution Score [1] |
Overall Score [1] |
|||
|---|---|---|---|---|---|---|---|---|---|---|---|---|
| Benchmark | [-] | 29.4 | ||||||||||
| CESM3_092H | [-] | 16.5 | 15.5 | 29.4 | 0.625 | 0.0360 | -1.74 | 0.511 | 0.684 | 0.598 | ||
| CESM3_098bH | [-] | 16.7 | 15.6 | 29.4 | 0.640 | 0.0360 | -1.71 | 0.510 | 0.684 | 0.597 | ||
| CMIP6_001 | [-] | 14.5 | 13.9 | 28.9 | 0.403 | 0.540 | -2.11 | 0.494 | 0.626 | 0.560 | ||
| LE2_001 | [-] | 14.6 | 14.0 | 28.9 | 0.399 | 0.540 | -2.09 | 0.490 | 0.610 | 0.550 |
Download Data |
Period Mean (original grids) [Pg] |
Model Period Mean (intersection) [Pg] |
Benchmark Period Mean (intersection) [Pg] |
Model Period Mean (complement) [Pg] |
Benchmark Period Mean (complement) [Pg] |
Bias [kg m-2] |
Bias Score [1] |
Spatial Distribution Score [1] |
Overall Score [1] |
|||
|---|---|---|---|---|---|---|---|---|---|---|---|---|
| Benchmark | [-] | 174. | ||||||||||
| CESM3_092H | [-] | 633. | 240. | 174. | 391. | 0.0606 | 1.82 | 0.392 | 0.507 | 0.450 | ||
| CESM3_098bH | [-] | 632. | 243. | 174. | 388. | 0.0606 | 1.88 | 0.388 | 0.504 | 0.446 | ||
| CMIP6_001 | [-] | 484. | 147. | 172. | 335. | 2.04 | -0.281 | 0.497 | 0.671 | 0.584 | ||
| LE2_001 | [-] | 483. | 148. | 172. | 333. | 2.04 | -0.250 | 0.495 | 0.667 | 0.581 |
Download Data |
Period Mean (original grids) [Pg] |
Model Period Mean (intersection) [Pg] |
Benchmark Period Mean (intersection) [Pg] |
Model Period Mean (complement) [Pg] |
Benchmark Period Mean (complement) [Pg] |
Bias [kg m-2] |
Bias Score [1] |
Spatial Distribution Score [1] |
Overall Score [1] |
|||
|---|---|---|---|---|---|---|---|---|---|---|---|---|
| Benchmark | [-] | 4.88 | ||||||||||
| CESM3_092H | [-] | 1.92 | 0.857 | 4.87 | 1.08 | 0.0107 | -2.75 | 0.469 | 0.270 | 0.370 | ||
| CESM3_098bH | [-] | 1.99 | 0.849 | 4.87 | 1.16 | 0.0107 | -2.75 | 0.470 | 0.257 | 0.363 | ||
| CMIP6_001 | [-] | 1.16 | 0.402 | 4.82 | 0.778 | 0.0615 | -3.09 | 0.419 | 0.148 | 0.283 | ||
| LE2_001 | [-] | 1.21 | 0.414 | 4.82 | 0.809 | 0.0615 | -3.08 | 0.421 | 0.156 | 0.288 |
Download Data |
Period Mean (original grids) [Pg] |
Model Period Mean (intersection) [Pg] |
Benchmark Period Mean (intersection) [Pg] |
Model Period Mean (complement) [Pg] |
Benchmark Period Mean (complement) [Pg] |
Bias [kg m-2] |
Bias Score [1] |
Spatial Distribution Score [1] |
Overall Score [1] |
|||
|---|---|---|---|---|---|---|---|---|---|---|---|---|
| Benchmark | [-] | 9.77 | ||||||||||
| CESM3_092H | [-] | 20.2 | 19.4 | 9.77 | 0.603 | 2.03 | 0.312 | 0.552 | 0.432 | |||
| CESM3_098bH | [-] | 20.9 | 20.1 | 9.77 | 0.665 | 2.16 | 0.299 | 0.559 | 0.429 | |||
| CMIP6_001 | [-] | 10.1 | 10.2 | 9.60 | 0.159 | 0.175 | 0.183 | 0.433 | 0.611 | 0.522 | ||
| LE2_001 | [-] | 10.3 | 10.4 | 9.60 | 0.162 | 0.175 | 0.227 | 0.430 | 0.605 | 0.517 |
Download Data |
Period Mean (original grids) [Pg] |
Model Period Mean (intersection) [Pg] |
Benchmark Period Mean (intersection) [Pg] |
Model Period Mean (complement) [Pg] |
Benchmark Period Mean (complement) [Pg] |
Bias [kg m-2] |
Bias Score [1] |
Spatial Distribution Score [1] |
Overall Score [1] |
|||
|---|---|---|---|---|---|---|---|---|---|---|---|---|
| Benchmark | [-] | 0.211 | ||||||||||
| CESM3_092H | [-] | 11.9 | 0.0624 | 0.211 | 11.4 | -1.15 | 0.562 | 0.831 | 0.697 | |||
| CESM3_098bH | [-] | 11.1 | 0.0692 | 0.211 | 10.7 | -1.08 | 0.585 | 0.853 | 0.719 | |||
| CMIP6_001 | [-] | 9.84 | 0.0158 | 0.210 | 9.59 | 0.000277 | -1.64 | 0.428 | 0.624 | 0.526 | ||
| LE2_001 | [-] | 9.97 | 0.0160 | 0.210 | 9.72 | 0.000277 | -1.64 | 0.428 | 0.580 | 0.504 |
Download Data |
Period Mean (original grids) [Pg] |
Model Period Mean (intersection) [Pg] |
Benchmark Period Mean (intersection) [Pg] |
Model Period Mean (complement) [Pg] |
Benchmark Period Mean (complement) [Pg] |
Bias [kg m-2] |
Bias Score [1] |
Spatial Distribution Score [1] |
Overall Score [1] |
|||
|---|---|---|---|---|---|---|---|---|---|---|---|---|
| Benchmark | [-] | 16.1 | ||||||||||
| CESM3_092H | [-] | 13.3 | 12.3 | 16.1 | 0.913 | -0.734 | 0.519 | 0.499 | 0.509 | |||
| CESM3_098bH | [-] | 13.4 | 12.3 | 16.1 | 0.911 | -0.722 | 0.520 | 0.501 | 0.510 | |||
| CMIP6_001 | [-] | 9.49 | 8.89 | 16.1 | 0.511 | 0.0548 | -1.64 | 0.535 | 0.616 | 0.575 | ||
| LE2_001 | [-] | 9.30 | 8.71 | 16.1 | 0.508 | 0.0548 | -1.69 | 0.534 | 0.621 | 0.577 |
Download Data |
Period Mean (original grids) [Pg] |
Model Period Mean (intersection) [Pg] |
Benchmark Period Mean (intersection) [Pg] |
Model Period Mean (complement) [Pg] |
Benchmark Period Mean (complement) [Pg] |
Bias [kg m-2] |
Bias Score [1] |
Spatial Distribution Score [1] |
Overall Score [1] |
|||
|---|---|---|---|---|---|---|---|---|---|---|---|---|
| Benchmark | [-] | 24.5 | ||||||||||
| CESM3_092H | [-] | 51.9 | 51.3 | 24.5 | 0.699 | 5.68 | 0.305 | 0.560 | 0.432 | |||
| CESM3_098bH | [-] | 52.0 | 51.4 | 24.5 | 0.705 | 5.71 | 0.304 | 0.558 | 0.431 | |||
| CMIP6_001 | [-] | 35.1 | 34.6 | 24.0 | 0.328 | 0.527 | 2.39 | 0.467 | 0.578 | 0.523 | ||
| LE2_001 | [-] | 35.5 | 35.0 | 24.0 | 0.332 | 0.527 | 2.47 | 0.461 | 0.581 | 0.521 |
Download Data |
Period Mean (original grids) [Pg] |
Model Period Mean (intersection) [Pg] |
Benchmark Period Mean (intersection) [Pg] |
Model Period Mean (complement) [Pg] |
Benchmark Period Mean (complement) [Pg] |
Bias [kg m-2] |
Bias Score [1] |
Spatial Distribution Score [1] |
Overall Score [1] |
|||
|---|---|---|---|---|---|---|---|---|---|---|---|---|
| Benchmark | [-] | 12.8 | ||||||||||
| CESM3_092H | [-] | 8.78 | 8.45 | 12.8 | 0.416 | 0.00114 | -1.00 | 0.572 | 0.861 | 0.717 | ||
| CESM3_098bH | [-] | 8.98 | 8.64 | 12.8 | 0.434 | 0.00114 | -0.952 | 0.575 | 0.858 | 0.716 | ||
| CMIP6_001 | [-] | 1.64 | 1.51 | 12.7 | 0.149 | 0.0995 | -3.07 | 0.430 | 0.570 | 0.500 | ||
| LE2_001 | [-] | 1.67 | 1.54 | 12.7 | 0.152 | 0.0995 | -3.07 | 0.432 | 0.572 | 0.502 |
Temporally integrated period mean