Mean State
Download Data |
Period Mean (original grids) [Pg] |
Model Period Mean (intersection) [Pg] |
Benchmark Period Mean (intersection) [Pg] |
Model Period Mean (complement) [Pg] |
Benchmark Period Mean (complement) [Pg] |
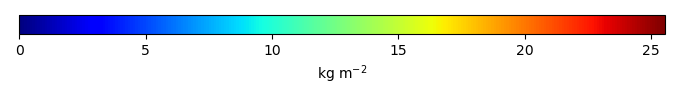
Bias [kg m-2] |
Bias Score [1] |
Spatial Distribution Score [1] |
Overall Score [1] |
|||
|---|---|---|---|---|---|---|---|---|---|---|---|---|
| Benchmark | [-] | 30.1 | ||||||||||
| CESM3_092H | [-] | 634. | 29.7 | 30.1 | 603. | 0.000154 | 0.389 | 0.368 | 0.842 | 0.605 | ||
| CESM3_098bH | [-] | 633. | 30.0 | 30.1 | 601. | 0.000154 | 0.420 | 0.367 | 0.841 | 0.604 | ||
| CMIP6_001 | [-] | 485. | 16.4 | 29.9 | 467. | 0.176 | -1.18 | 0.382 | 0.678 | 0.530 | ||
| LE2_001 | [-] | 484. | 16.3 | 29.9 | 466. | 0.176 | -1.19 | 0.381 | 0.677 | 0.529 |
Download Data |
Period Mean (original grids) [Pg] |
Model Period Mean (intersection) [Pg] |
Benchmark Period Mean (intersection) [Pg] |
Model Period Mean (complement) [Pg] |
Benchmark Period Mean (complement) [Pg] |
Bias [kg m-2] |
Bias Score [1] |
Spatial Distribution Score [1] |
Overall Score [1] |
|||
|---|---|---|---|---|---|---|---|---|---|---|---|---|
| Benchmark | [-] | 1.44 | ||||||||||
| CESM3_092H | [-] | 20.3 | 6.34 | 1.44 | 13.7 | 6.46e-06 | 4.60 | 0.0903 | 0.523 | 0.306 | ||
| CESM3_098bH | [-] | 21.0 | 6.38 | 1.44 | 14.4 | 6.46e-06 | 4.64 | 0.0898 | 0.528 | 0.309 | ||
| CMIP6_001 | [-] | 10.0 | 4.41 | 1.41 | 5.87 | 0.0279 | 2.74 | 0.169 | 0.574 | 0.372 | ||
| LE2_001 | [-] | 10.4 | 4.52 | 1.41 | 6.17 | 0.0279 | 2.84 | 0.163 | 0.568 | 0.365 |
Download Data |
Period Mean (original grids) [Pg] |
Model Period Mean (intersection) [Pg] |
Benchmark Period Mean (intersection) [Pg] |
Model Period Mean (complement) [Pg] |
Benchmark Period Mean (complement) [Pg] |
Bias [kg m-2] |
Bias Score [1] |
Spatial Distribution Score [1] |
Overall Score [1] |
|||
|---|---|---|---|---|---|---|---|---|---|---|---|---|
| Benchmark | [-] | 0.00649 | ||||||||||
| CESM3_092H | [-] | 11.9 | 0.0630 | 0.00649 | 11.4 | 0.720 | 0.0414 | 0.717 | 0.379 | |||
| CESM3_098bH | [-] | 11.1 | 0.0711 | 0.00649 | 10.6 | 0.830 | 0.0429 | 0.694 | 0.368 | |||
| CMIP6_001 | [-] | 9.84 | 0.0204 | 0.00649 | 9.59 | 0.164 | 0.0505 | 0.577 | 0.314 | |||
| LE2_001 | [-] | 9.97 | 0.0192 | 0.00649 | 9.71 | 0.148 | 0.0495 | 0.541 | 0.295 |
Download Data |
Period Mean (original grids) [Pg] |
Model Period Mean (intersection) [Pg] |
Benchmark Period Mean (intersection) [Pg] |
Model Period Mean (complement) [Pg] |
Benchmark Period Mean (complement) [Pg] |
Bias [kg m-2] |
Bias Score [1] |
Spatial Distribution Score [1] |
Overall Score [1] |
|||
|---|---|---|---|---|---|---|---|---|---|---|---|---|
| Benchmark | [-] | 17.4 | ||||||||||
| CESM3_092H | [-] | 13.3 | 12.9 | 17.4 | 0.322 | 6.59e-05 | -0.681 | 0.511 | 0.895 | 0.703 | ||
| CESM3_098bH | [-] | 13.4 | 12.9 | 17.4 | 0.324 | 6.59e-05 | -0.676 | 0.513 | 0.895 | 0.704 | ||
| CMIP6_001 | [-] | 9.53 | 9.25 | 17.3 | 0.198 | 0.0180 | -1.66 | 0.508 | 0.845 | 0.676 | ||
| LE2_001 | [-] | 9.33 | 9.05 | 17.3 | 0.197 | 0.0180 | -1.72 | 0.505 | 0.840 | 0.672 |
Download Data |
Period Mean (original grids) [Pg] |
Model Period Mean (intersection) [Pg] |
Benchmark Period Mean (intersection) [Pg] |
Model Period Mean (complement) [Pg] |
Benchmark Period Mean (complement) [Pg] |
Bias [kg m-2] |
Bias Score [1] |
Spatial Distribution Score [1] |
Overall Score [1] |
|||
|---|---|---|---|---|---|---|---|---|---|---|---|---|
| Benchmark | [-] | 1.52 | ||||||||||
| CESM3_092H | [-] | 51.9 | 1.95 | 1.52 | 50.0 | 4.02 | 0.363 | 0.869 | 0.616 | |||
| CESM3_098bH | [-] | 52.1 | 1.94 | 1.52 | 50.3 | 3.96 | 0.365 | 0.865 | 0.615 | |||
| CMIP6_001 | [-] | 35.2 | 1.15 | 1.46 | 33.8 | 0.0621 | 0.725 | 0.422 | 0.826 | 0.624 | ||
| LE2_001 | [-] | 35.6 | 1.16 | 1.46 | 34.3 | 0.0621 | 0.770 | 0.421 | 0.831 | 0.626 |
Download Data |
Period Mean (original grids) [Pg] |
Model Period Mean (intersection) [Pg] |
Benchmark Period Mean (intersection) [Pg] |
Model Period Mean (complement) [Pg] |
Benchmark Period Mean (complement) [Pg] |
Bias [kg m-2] |
Bias Score [1] |
Spatial Distribution Score [1] |
Overall Score [1] |
|||
|---|---|---|---|---|---|---|---|---|---|---|---|---|
| Benchmark | [-] | 9.78 | ||||||||||
| CESM3_092H | [-] | 8.76 | 8.47 | 9.78 | 0.386 | 8.13e-05 | -0.104 | 0.307 | 0.776 | 0.541 | ||
| CESM3_098bH | [-] | 9.01 | 8.70 | 9.78 | 0.402 | 8.13e-05 | -0.0409 | 0.302 | 0.778 | 0.540 | ||
| CMIP6_001 | [-] | 1.65 | 1.56 | 9.71 | 0.118 | 0.0683 | -2.12 | 0.316 | 0.208 | 0.262 | ||
| LE2_001 | [-] | 1.68 | 1.58 | 9.71 | 0.119 | 0.0683 | -2.11 | 0.317 | 0.209 | 0.263 |
Temporally integrated period mean