Mean State
Download Data |
Period Mean (original grids) [Pg] |
Model Period Mean (intersection) [Pg] |
Benchmark Period Mean (intersection) [Pg] |
Model Period Mean (complement) [Pg] |
Benchmark Period Mean (complement) [Pg] |
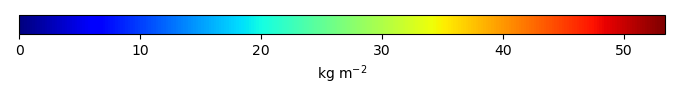
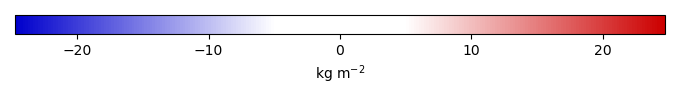
Bias [kg m-2] |
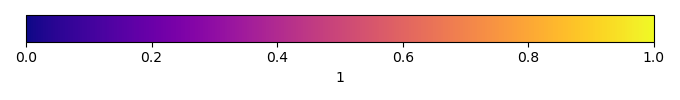
Bias Score [1] |
Spatial Distribution Score [1] |
Overall Score [1] |
|||
|---|---|---|---|---|---|---|---|---|---|---|---|---|
| Benchmark | [-] | 34.1 | ||||||||||
| CESM3_092H | [-] | 26.2 | 26.5 | 34.1 | 0.283 | 0.00195 | -1.31 | 0.739 | 0.935 | 0.837 | ||
| CESM3_098bH | [-] | 26.4 | 26.6 | 34.1 | 0.285 | 0.00195 | -1.27 | 0.740 | 0.936 | 0.838 | ||
| CMIP6_001 | [-] | 34.5 | 35.0 | 33.8 | 0.267 | 0.315 | 0.733 | 0.676 | 0.916 | 0.796 | ||
| LE2_001 | [-] | 34.2 | 34.8 | 33.8 | 0.266 | 0.315 | 0.675 | 0.679 | 0.918 | 0.799 |
Download Data |
Period Mean (original grids) [Pg] |
Model Period Mean (intersection) [Pg] |
Benchmark Period Mean (intersection) [Pg] |
Model Period Mean (complement) [Pg] |
Benchmark Period Mean (complement) [Pg] |
Bias [kg m-2] |
Bias Score [1] |
Spatial Distribution Score [1] |
Overall Score [1] |
|||
|---|---|---|---|---|---|---|---|---|---|---|---|---|
| Benchmark | [-] | 44.8 | ||||||||||
| CESM3_092H | [-] | 12.1 | 11.4 | 44.8 | 0.0335 | 0.0633 | -4.83 | 0.504 | 0.486 | 0.495 | ||
| CESM3_098bH | [-] | 12.3 | 11.5 | 44.8 | 0.0334 | 0.0633 | -4.81 | 0.505 | 0.489 | 0.497 | ||
| CMIP6_001 | [-] | 16.3 | 15.4 | 44.4 | 0.0240 | 0.478 | -4.21 | 0.499 | 0.840 | 0.669 | ||
| LE2_001 | [-] | 16.0 | 15.1 | 44.4 | 0.0237 | 0.478 | -4.25 | 0.499 | 0.840 | 0.670 |
Download Data |
Period Mean (original grids) [Pg] |
Model Period Mean (intersection) [Pg] |
Benchmark Period Mean (intersection) [Pg] |
Model Period Mean (complement) [Pg] |
Benchmark Period Mean (complement) [Pg] |
Bias [kg m-2] |
Bias Score [1] |
Spatial Distribution Score [1] |
Overall Score [1] |
|||
|---|---|---|---|---|---|---|---|---|---|---|---|---|
| Benchmark | [-] | 60.1 | ||||||||||
| CESM3_092H | [-] | 28.0 | 27.2 | 60.0 | 0.673 | 0.0611 | -3.10 | 0.573 | 0.832 | 0.703 | ||
| CESM3_098bH | [-] | 28.0 | 27.2 | 60.0 | 0.661 | 0.0611 | -3.12 | 0.572 | 0.831 | 0.702 | ||
| CMIP6_001 | [-] | 39.1 | 38.2 | 59.3 | 0.682 | 0.762 | -1.87 | 0.565 | 0.786 | 0.676 | ||
| LE2_001 | [-] | 38.6 | 37.7 | 59.3 | 0.676 | 0.762 | -1.92 | 0.562 | 0.785 | 0.674 |
Download Data |
Period Mean (original grids) [Pg] |
Model Period Mean (intersection) [Pg] |
Benchmark Period Mean (intersection) [Pg] |
Model Period Mean (complement) [Pg] |
Benchmark Period Mean (complement) [Pg] |
Bias [kg m-2] |
Bias Score [1] |
Spatial Distribution Score [1] |
Overall Score [1] |
|||
|---|---|---|---|---|---|---|---|---|---|---|---|---|
| Benchmark | [-] | 11.1 | ||||||||||
| CESM3_092H | [-] | 107. | 6.61 | 11.1 | 101. | 3.41 | 0.526 | 0.692 | 0.609 | |||
| CESM3_098bH | [-] | 106. | 6.63 | 11.1 | 99.4 | 3.43 | 0.528 | 0.695 | 0.612 | |||
| CMIP6_001 | [-] | 62.7 | 3.43 | 10.3 | 59.5 | 0.803 | -8.34 | 0.390 | 0.410 | 0.400 | ||
| LE2_001 | [-] | 62.3 | 3.43 | 10.3 | 59.1 | 0.803 | -8.37 | 0.390 | 0.411 | 0.400 |
Download Data |
Period Mean (original grids) [Pg] |
Model Period Mean (intersection) [Pg] |
Benchmark Period Mean (intersection) [Pg] |
Model Period Mean (complement) [Pg] |
Benchmark Period Mean (complement) [Pg] |
Bias [kg m-2] |
Bias Score [1] |
Spatial Distribution Score [1] |
Overall Score [1] |
|||
|---|---|---|---|---|---|---|---|---|---|---|---|---|
| Benchmark | [-] | 55.7 | ||||||||||
| CESM3_092H | [-] | 17.6 | 16.3 | 55.5 | 1.21 | 0.256 | -7.78 | 0.652 | 0.122 | 0.387 | ||
| CESM3_098bH | [-] | 17.6 | 16.3 | 55.5 | 1.21 | 0.256 | -7.77 | 0.652 | 0.123 | 0.387 | ||
| CMIP6_001 | [-] | 23.8 | 22.3 | 50.7 | 1.35 | 4.99 | -5.20 | 0.740 | 0.311 | 0.526 | ||
| LE2_001 | [-] | 23.7 | 22.2 | 50.7 | 1.35 | 4.99 | -5.23 | 0.740 | 0.305 | 0.523 |
Download Data |
Period Mean (original grids) [Pg] |
Model Period Mean (intersection) [Pg] |
Benchmark Period Mean (intersection) [Pg] |
Model Period Mean (complement) [Pg] |
Benchmark Period Mean (complement) [Pg] |
Bias [kg m-2] |
Bias Score [1] |
Spatial Distribution Score [1] |
Overall Score [1] |
|||
|---|---|---|---|---|---|---|---|---|---|---|---|---|
| Benchmark | [-] | 65.6 | ||||||||||
| CESM3_092H | [-] | 153. | 38.0 | 65.6 | 112. | 0.0110 | -5.84 | 0.634 | 0.728 | 0.681 | ||
| CESM3_098bH | [-] | 151. | 37.7 | 65.6 | 110. | 0.0110 | -5.92 | 0.633 | 0.724 | 0.679 | ||
| CMIP6_001 | [-] | 149. | 54.3 | 65.2 | 91.1 | 0.461 | -2.28 | 0.683 | 0.728 | 0.705 | ||
| LE2_001 | [-] | 149. | 54.3 | 65.2 | 91.7 | 0.461 | -2.29 | 0.683 | 0.727 | 0.705 |
Download Data |
Period Mean (original grids) [Pg] |
Model Period Mean (intersection) [Pg] |
Benchmark Period Mean (intersection) [Pg] |
Model Period Mean (complement) [Pg] |
Benchmark Period Mean (complement) [Pg] |
Bias [kg m-2] |
Bias Score [1] |
Spatial Distribution Score [1] |
Overall Score [1] |
|||
|---|---|---|---|---|---|---|---|---|---|---|---|---|
| Benchmark | [-] | 143. | ||||||||||
| CESM3_092H | [-] | 103. | 87.8 | 143. | 16.8 | 0.0553 | -2.88 | 0.569 | 0.818 | 0.693 | ||
| CESM3_098bH | [-] | 102. | 87.6 | 143. | 16.8 | 0.0553 | -2.89 | 0.568 | 0.817 | 0.692 | ||
| CMIP6_001 | [-] | 118. | 107. | 142. | 12.9 | 0.973 | -1.71 | 0.565 | 0.768 | 0.667 | ||
| LE2_001 | [-] | 116. | 106. | 142. | 12.7 | 0.973 | -1.78 | 0.566 | 0.771 | 0.669 |
Download Data |
Period Mean (original grids) [Pg] |
Model Period Mean (intersection) [Pg] |
Benchmark Period Mean (intersection) [Pg] |
Model Period Mean (complement) [Pg] |
Benchmark Period Mean (complement) [Pg] |
Bias [kg m-2] |
Bias Score [1] |
Spatial Distribution Score [1] |
Overall Score [1] |
|||
|---|---|---|---|---|---|---|---|---|---|---|---|---|
| Benchmark | [-] | 58.4 | ||||||||||
| CESM3_092H | [-] | 25.0 | 23.7 | 58.3 | 0.659 | 0.112 | -3.97 | 0.595 | 0.909 | 0.752 | ||
| CESM3_098bH | [-] | 25.0 | 23.7 | 58.3 | 0.662 | 0.112 | -3.96 | 0.597 | 0.910 | 0.754 | ||
| CMIP6_001 | [-] | 33.0 | 31.4 | 56.8 | 0.830 | 1.57 | -2.58 | 0.616 | 0.795 | 0.705 | ||
| LE2_001 | [-] | 32.9 | 31.3 | 56.8 | 0.828 | 1.57 | -2.60 | 0.616 | 0.797 | 0.706 |
Download Data |
Period Mean (original grids) [Pg] |
Model Period Mean (intersection) [Pg] |
Benchmark Period Mean (intersection) [Pg] |
Model Period Mean (complement) [Pg] |
Benchmark Period Mean (complement) [Pg] |
Bias [kg m-2] |
Bias Score [1] |
Spatial Distribution Score [1] |
Overall Score [1] |
|||
|---|---|---|---|---|---|---|---|---|---|---|---|---|
| Benchmark | [-] | 7.78 | ||||||||||
| CESM3_092H | [-] | 128. | 6.81 | 7.77 | 122. | 0.00477 | 8.70 | 0.463 | 0.562 | 0.512 | ||
| CESM3_098bH | [-] | 127. | 6.81 | 7.77 | 121. | 0.00477 | 8.66 | 0.463 | 0.568 | 0.515 | ||
| CMIP6_001 | [-] | 44.4 | 0.983 | 7.36 | 44.0 | 0.414 | -12.4 | 0.377 | 0.514 | 0.446 | ||
| LE2_001 | [-] | 44.2 | 0.972 | 7.36 | 43.8 | 0.414 | -12.5 | 0.377 | 0.518 | 0.448 |
Download Data |
Period Mean (original grids) [Pg] |
Model Period Mean (intersection) [Pg] |
Benchmark Period Mean (intersection) [Pg] |
Model Period Mean (complement) [Pg] |
Benchmark Period Mean (complement) [Pg] |
Bias [kg m-2] |
Bias Score [1] |
Spatial Distribution Score [1] |
Overall Score [1] |
|||
|---|---|---|---|---|---|---|---|---|---|---|---|---|
| Benchmark | [-] | 58.9 | ||||||||||
| CESM3_092H | [-] | 26.5 | 25.1 | 58.6 | 1.26 | 0.283 | -3.02 | 0.553 | 0.642 | 0.597 | ||
| CESM3_098bH | [-] | 26.4 | 25.1 | 58.6 | 1.25 | 0.283 | -3.03 | 0.553 | 0.645 | 0.599 | ||
| CMIP6_001 | [-] | 25.6 | 24.4 | 57.4 | 1.08 | 1.53 | -3.09 | 0.540 | 0.597 | 0.568 | ||
| LE2_001 | [-] | 25.3 | 24.1 | 57.4 | 1.06 | 1.53 | -3.13 | 0.539 | 0.602 | 0.570 |
Download Data |
Period Mean (original grids) [Pg] |
Model Period Mean (intersection) [Pg] |
Benchmark Period Mean (intersection) [Pg] |
Model Period Mean (complement) [Pg] |
Benchmark Period Mean (complement) [Pg] |
Bias [kg m-2] |
Bias Score [1] |
Spatial Distribution Score [1] |
Overall Score [1] |
|||
|---|---|---|---|---|---|---|---|---|---|---|---|---|
| Benchmark | [-] | 61.8 | ||||||||||
| CESM3_092H | [-] | 29.6 | 25.4 | 61.6 | 3.47 | 0.148 | -5.14 | 0.631 | 0.612 | 0.621 | ||
| CESM3_098bH | [-] | 29.3 | 25.1 | 61.6 | 3.48 | 0.148 | -5.21 | 0.627 | 0.615 | 0.621 | ||
| CMIP6_001 | [-] | 36.5 | 33.8 | 60.2 | 2.23 | 1.58 | -3.65 | 0.703 | 0.704 | 0.704 | ||
| LE2_001 | [-] | 36.5 | 33.7 | 60.2 | 2.26 | 1.58 | -3.68 | 0.703 | 0.703 | 0.703 |
Download Data |
Period Mean (original grids) [Pg] |
Model Period Mean (intersection) [Pg] |
Benchmark Period Mean (intersection) [Pg] |
Model Period Mean (complement) [Pg] |
Benchmark Period Mean (complement) [Pg] |
Bias [kg m-2] |
Bias Score [1] |
Spatial Distribution Score [1] |
Overall Score [1] |
|||
|---|---|---|---|---|---|---|---|---|---|---|---|---|
| Benchmark | [-] | 1.05e+03 | ||||||||||
| CESM3_092H | [-] | 1.00e+03 | 515. | 1.05e+03 | 485. | 1.60 | -3.71 | 0.585 | 0.836 | 0.710 | ||
| CESM3_098bH | [-] | 995. | 513. | 1.05e+03 | 481. | 1.60 | -3.72 | 0.584 | 0.835 | 0.710 | ||
| CMIP6_001 | [-] | 956. | 616. | 1.02e+03 | 337. | 23.7 | -2.63 | 0.583 | 0.163 | 0.373 | ||
| LE2_001 | [-] | 951. | 612. | 1.02e+03 | 337. | 23.7 | -2.67 | 0.583 | 0.163 | 0.373 |
Download Data |
Period Mean (original grids) [Pg] |
Model Period Mean (intersection) [Pg] |
Benchmark Period Mean (intersection) [Pg] |
Model Period Mean (complement) [Pg] |
Benchmark Period Mean (complement) [Pg] |
Bias [kg m-2] |
Bias Score [1] |
Spatial Distribution Score [1] |
Overall Score [1] |
|||
|---|---|---|---|---|---|---|---|---|---|---|---|---|
| Benchmark | [-] | 64.3 | ||||||||||
| CESM3_092H | [-] | 13.7 | 13.5 | 64.3 | 0.398 | 0.0301 | -2.96 | 0.450 | 0.826 | 0.638 | ||
| CESM3_098bH | [-] | 13.7 | 13.5 | 64.3 | 0.395 | 0.0301 | -2.95 | 0.451 | 0.826 | 0.638 | ||
| CMIP6_001 | [-] | 15.1 | 15.0 | 63.6 | 0.276 | 0.698 | -2.89 | 0.452 | 0.808 | 0.630 | ||
| LE2_001 | [-] | 15.1 | 15.0 | 63.6 | 0.273 | 0.698 | -2.89 | 0.452 | 0.808 | 0.630 |
Download Data |
Period Mean (original grids) [Pg] |
Model Period Mean (intersection) [Pg] |
Benchmark Period Mean (intersection) [Pg] |
Model Period Mean (complement) [Pg] |
Benchmark Period Mean (complement) [Pg] |
Bias [kg m-2] |
Bias Score [1] |
Spatial Distribution Score [1] |
Overall Score [1] |
|||
|---|---|---|---|---|---|---|---|---|---|---|---|---|
| Benchmark | [-] | 13.3 | ||||||||||
| CESM3_092H | [-] | 102. | 6.41 | 13.3 | 95.0 | 0.0146 | -0.848 | 0.464 | 0.721 | 0.593 | ||
| CESM3_098bH | [-] | 102. | 6.42 | 13.3 | 95.0 | 0.0146 | -0.808 | 0.467 | 0.725 | 0.596 | ||
| CMIP6_001 | [-] | 100. | 20.1 | 12.1 | 81.3 | 1.24 | 27.1 | 0.391 | 0.00924 | 0.200 | ||
| LE2_001 | [-] | 101. | 20.1 | 12.1 | 81.6 | 1.24 | 27.1 | 0.392 | 0.00925 | 0.201 |
Download Data |
Period Mean (original grids) [Pg] |
Model Period Mean (intersection) [Pg] |
Benchmark Period Mean (intersection) [Pg] |
Model Period Mean (complement) [Pg] |
Benchmark Period Mean (complement) [Pg] |
Bias [kg m-2] |
Bias Score [1] |
Spatial Distribution Score [1] |
Overall Score [1] |
|||
|---|---|---|---|---|---|---|---|---|---|---|---|---|
| Benchmark | [-] | 42.5 | ||||||||||
| CESM3_092H | [-] | 15.7 | 14.4 | 42.1 | 0.902 | 0.391 | -6.31 | 0.633 | 0.481 | 0.557 | ||
| CESM3_098bH | [-] | 15.6 | 14.3 | 42.1 | 0.896 | 0.391 | -6.34 | 0.632 | 0.478 | 0.555 | ||
| CMIP6_001 | [-] | 19.4 | 18.2 | 40.2 | 0.794 | 2.26 | -4.99 | 0.630 | 0.745 | 0.688 | ||
| LE2_001 | [-] | 19.0 | 17.8 | 40.2 | 0.791 | 2.26 | -5.11 | 0.628 | 0.741 | 0.684 |
Download Data |
Period Mean (original grids) [Pg] |
Model Period Mean (intersection) [Pg] |
Benchmark Period Mean (intersection) [Pg] |
Model Period Mean (complement) [Pg] |
Benchmark Period Mean (complement) [Pg] |
Bias [kg m-2] |
Bias Score [1] |
Spatial Distribution Score [1] |
Overall Score [1] |
|||
|---|---|---|---|---|---|---|---|---|---|---|---|---|
| Benchmark | [-] | 45.3 | ||||||||||
| CESM3_092H | [-] | 22.7 | 21.9 | 45.3 | 0.314 | 0.00775 | -5.36 | 0.653 | 0.282 | 0.468 | ||
| CESM3_098bH | [-] | 22.4 | 21.6 | 45.3 | 0.313 | 0.00775 | -5.42 | 0.649 | 0.279 | 0.464 | ||
| CMIP6_001 | [-] | 22.0 | 21.3 | 44.4 | 0.252 | 0.888 | -5.24 | 0.656 | 0.456 | 0.556 | ||
| LE2_001 | [-] | 21.8 | 21.2 | 44.4 | 0.248 | 0.888 | -5.28 | 0.654 | 0.454 | 0.554 |
Download Data |
Period Mean (original grids) [Pg] |
Model Period Mean (intersection) [Pg] |
Benchmark Period Mean (intersection) [Pg] |
Model Period Mean (complement) [Pg] |
Benchmark Period Mean (complement) [Pg] |
Bias [kg m-2] |
Bias Score [1] |
Spatial Distribution Score [1] |
Overall Score [1] |
|||
|---|---|---|---|---|---|---|---|---|---|---|---|---|
| Benchmark | [-] | 51.3 | ||||||||||
| CESM3_092H | [-] | 54.1 | 27.8 | 51.3 | 26.8 | -6.34 | 0.642 | 0.679 | 0.660 | |||
| CESM3_098bH | [-] | 53.5 | 27.5 | 51.3 | 26.6 | -6.45 | 0.639 | 0.674 | 0.657 | |||
| CMIP6_001 | [-] | 58.5 | 28.3 | 49.6 | 29.9 | 1.76 | -5.95 | 0.589 | 0.873 | 0.731 | ||
| LE2_001 | [-] | 58.3 | 28.2 | 49.6 | 29.9 | 1.76 | -6.00 | 0.589 | 0.873 | 0.731 |
Download Data |
Period Mean (original grids) [Pg] |
Model Period Mean (intersection) [Pg] |
Benchmark Period Mean (intersection) [Pg] |
Model Period Mean (complement) [Pg] |
Benchmark Period Mean (complement) [Pg] |
Bias [kg m-2] |
Bias Score [1] |
Spatial Distribution Score [1] |
Overall Score [1] |
|||
|---|---|---|---|---|---|---|---|---|---|---|---|---|
| Benchmark | [-] | 34.3 | ||||||||||
| CESM3_092H | [-] | 14.8 | 14.8 | 34.2 | 0.566 | 0.00992 | -4.60 | 0.567 | 0.868 | 0.718 | ||
| CESM3_098bH | [-] | 14.7 | 14.7 | 34.2 | 0.568 | 0.00992 | -4.63 | 0.566 | 0.871 | 0.718 | ||
| CMIP6_001 | [-] | 7.77 | 8.05 | 34.0 | 0.190 | 0.216 | -6.38 | 0.489 | 0.728 | 0.608 | ||
| LE2_001 | [-] | 7.68 | 7.96 | 34.0 | 0.187 | 0.216 | -6.40 | 0.487 | 0.726 | 0.606 |
Download Data |
Period Mean (original grids) [Pg] |
Model Period Mean (intersection) [Pg] |
Benchmark Period Mean (intersection) [Pg] |
Model Period Mean (complement) [Pg] |
Benchmark Period Mean (complement) [Pg] |
Bias [kg m-2] |
Bias Score [1] |
Spatial Distribution Score [1] |
Overall Score [1] |
|||
|---|---|---|---|---|---|---|---|---|---|---|---|---|
| Benchmark | [-] | 101. | ||||||||||
| CESM3_092H | [-] | 60.2 | 59.5 | 101. | 0.429 | 0.0749 | -4.50 | 0.716 | 0.225 | 0.470 | ||
| CESM3_098bH | [-] | 60.0 | 59.3 | 101. | 0.426 | 0.0749 | -4.52 | 0.715 | 0.228 | 0.471 | ||
| CMIP6_001 | [-] | 80.8 | 80.1 | 100. | 0.434 | 0.811 | -1.76 | 0.726 | 0.541 | 0.633 | ||
| LE2_001 | [-] | 80.5 | 79.8 | 100. | 0.433 | 0.811 | -1.80 | 0.726 | 0.542 | 0.634 |
Download Data |
Period Mean (original grids) [Pg] |
Model Period Mean (intersection) [Pg] |
Benchmark Period Mean (intersection) [Pg] |
Model Period Mean (complement) [Pg] |
Benchmark Period Mean (complement) [Pg] |
Bias [kg m-2] |
Bias Score [1] |
Spatial Distribution Score [1] |
Overall Score [1] |
|||
|---|---|---|---|---|---|---|---|---|---|---|---|---|
| Benchmark | [-] | 60.7 | ||||||||||
| CESM3_092H | [-] | 40.5 | 40.8 | 60.7 | 0.455 | 0.0488 | -2.58 | 0.656 | 0.820 | 0.738 | ||
| CESM3_098bH | [-] | 40.0 | 40.2 | 60.7 | 0.447 | 0.0488 | -2.67 | 0.654 | 0.815 | 0.734 | ||
| CMIP6_001 | [-] | 39.8 | 40.0 | 60.4 | 0.570 | 0.300 | -2.50 | 0.645 | 0.860 | 0.752 | ||
| LE2_001 | [-] | 39.7 | 39.9 | 60.4 | 0.572 | 0.300 | -2.51 | 0.645 | 0.857 | 0.751 |
Download Data |
Period Mean (original grids) [Pg] |
Model Period Mean (intersection) [Pg] |
Benchmark Period Mean (intersection) [Pg] |
Model Period Mean (complement) [Pg] |
Benchmark Period Mean (complement) [Pg] |
Bias [kg m-2] |
Bias Score [1] |
Spatial Distribution Score [1] |
Overall Score [1] |
|||
|---|---|---|---|---|---|---|---|---|---|---|---|---|
| Benchmark | [-] | 29.6 | ||||||||||
| CESM3_092H | [-] | 20.8 | 19.8 | 29.6 | 0.423 | 0.0296 | -1.91 | 0.597 | 0.481 | 0.539 | ||
| CESM3_098bH | [-] | 20.8 | 19.8 | 29.6 | 0.422 | 0.0296 | -1.91 | 0.599 | 0.478 | 0.539 | ||
| CMIP6_001 | [-] | 17.4 | 16.5 | 28.2 | 0.279 | 1.46 | -2.83 | 0.591 | 0.435 | 0.513 | ||
| LE2_001 | [-] | 17.3 | 16.4 | 28.2 | 0.278 | 1.46 | -2.86 | 0.592 | 0.433 | 0.513 |
Temporally integrated period mean