Mean State
Download Data |
Period Mean (original grids) [Pg] |
Model Period Mean (intersection) [Pg] |
Benchmark Period Mean (intersection) [Pg] |
Model Period Mean (complement) [Pg] |
Benchmark Period Mean (complement) [Pg] |
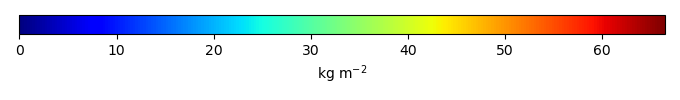
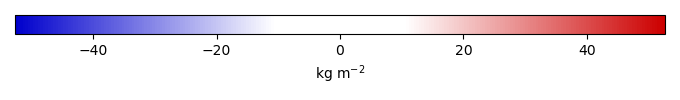
Bias [kg m-2] |
Bias Score [1] |
Spatial Distribution Score [1] |
Overall Score [1] |
|||
|---|---|---|---|---|---|---|---|---|---|---|---|---|
| Benchmark | [-] | 76.5 | ||||||||||
| CESM3_092H | [-] | 107. | 99.3 | 76.4 | 8.01 | 0.0272 | 9.97 | 0.558 | 0.508 | 0.533 | ||
| CESM3_098bH | [-] | 106. | 98.0 | 76.4 | 8.02 | 0.0272 | 9.51 | 0.562 | 0.525 | 0.544 | ||
| CMIP6_001 | [-] | 62.7 | 59.0 | 76.1 | 3.98 | 0.362 | -5.36 | 0.539 | 0.564 | 0.551 | ||
| LE2_001 | [-] | 62.3 | 58.6 | 76.1 | 3.97 | 0.362 | -5.50 | 0.540 | 0.568 | 0.554 |
Download Data |
Period Mean (original grids) [Pg] |
Model Period Mean (intersection) [Pg] |
Benchmark Period Mean (intersection) [Pg] |
Model Period Mean (complement) [Pg] |
Benchmark Period Mean (complement) [Pg] |
Bias [kg m-2] |
Bias Score [1] |
Spatial Distribution Score [1] |
Overall Score [1] |
|||
|---|---|---|---|---|---|---|---|---|---|---|---|---|
| Benchmark | [-] | 113. | ||||||||||
| CESM3_092H | [-] | 153. | 111. | 113. | 38.5 | -0.344 | 0.611 | 0.893 | 0.752 | |||
| CESM3_098bH | [-] | 151. | 110. | 113. | 38.1 | -0.618 | 0.616 | 0.894 | 0.755 | |||
| CMIP6_001 | [-] | 149. | 90.7 | 113. | 54.8 | 0.00185 | -4.71 | 0.630 | 0.706 | 0.668 | ||
| LE2_001 | [-] | 149. | 91.2 | 113. | 54.7 | 0.00185 | -4.59 | 0.632 | 0.697 | 0.665 |
Download Data |
Period Mean (original grids) [Pg] |
Model Period Mean (intersection) [Pg] |
Benchmark Period Mean (intersection) [Pg] |
Model Period Mean (complement) [Pg] |
Benchmark Period Mean (complement) [Pg] |
Bias [kg m-2] |
Bias Score [1] |
Spatial Distribution Score [1] |
Overall Score [1] |
|||
|---|---|---|---|---|---|---|---|---|---|---|---|---|
| Benchmark | [-] | 12.2 | ||||||||||
| CESM3_092H | [-] | 103. | 16.2 | 12.2 | 88.4 | 3.88 | 0.516 | 0.361 | 0.438 | |||
| CESM3_098bH | [-] | 102. | 16.2 | 12.2 | 88.2 | 3.86 | 0.516 | 0.372 | 0.444 | |||
| CMIP6_001 | [-] | 118. | 12.3 | 12.2 | 108. | 0.149 | 0.619 | 0.771 | 0.695 | |||
| LE2_001 | [-] | 116. | 12.1 | 12.2 | 107. | 0.00798 | 0.620 | 0.779 | 0.699 |
Download Data |
Period Mean (original grids) [Pg] |
Model Period Mean (intersection) [Pg] |
Benchmark Period Mean (intersection) [Pg] |
Model Period Mean (complement) [Pg] |
Benchmark Period Mean (complement) [Pg] |
Bias [kg m-2] |
Bias Score [1] |
Spatial Distribution Score [1] |
Overall Score [1] |
|||
|---|---|---|---|---|---|---|---|---|---|---|---|---|
| Benchmark | [-] | 97.3 | ||||||||||
| CESM3_092H | [-] | 128. | 121. | 97.3 | 7.89 | 8.43 | 0.564 | 0.506 | 0.535 | |||
| CESM3_098bH | [-] | 127. | 120. | 97.3 | 7.88 | 8.22 | 0.566 | 0.518 | 0.542 | |||
| CMIP6_001 | [-] | 44.4 | 43.8 | 97.2 | 1.26 | 0.0996 | -16.8 | 0.467 | 0.585 | 0.526 | ||
| LE2_001 | [-] | 44.2 | 43.6 | 97.2 | 1.25 | 0.0996 | -16.9 | 0.469 | 0.591 | 0.530 |
Download Data |
Period Mean (original grids) [Pg] |
Model Period Mean (intersection) [Pg] |
Benchmark Period Mean (intersection) [Pg] |
Model Period Mean (complement) [Pg] |
Benchmark Period Mean (complement) [Pg] |
Bias [kg m-2] |
Bias Score [1] |
Spatial Distribution Score [1] |
Overall Score [1] |
|||
|---|---|---|---|---|---|---|---|---|---|---|---|---|
| Benchmark | [-] | 5.12 | ||||||||||
| CESM3_092H | [-] | 29.6 | 2.67 | 5.12 | 26.2 | -8.97 | 0.543 | 0.457 | 0.500 | |||
| CESM3_098bH | [-] | 29.3 | 2.69 | 5.12 | 25.9 | -8.88 | 0.544 | 0.446 | 0.495 | |||
| CMIP6_001 | [-] | 36.5 | 1.64 | 5.12 | 34.4 | -13.0 | 0.487 | 0.316 | 0.401 | |||
| LE2_001 | [-] | 36.5 | 1.67 | 5.12 | 34.3 | -12.8 | 0.488 | 0.315 | 0.401 |
Download Data |
Period Mean (original grids) [Pg] |
Model Period Mean (intersection) [Pg] |
Benchmark Period Mean (intersection) [Pg] |
Model Period Mean (complement) [Pg] |
Benchmark Period Mean (complement) [Pg] |
Bias [kg m-2] |
Bias Score [1] |
Spatial Distribution Score [1] |
Overall Score [1] |
|||
|---|---|---|---|---|---|---|---|---|---|---|---|---|
| Benchmark | [-] | 473. | ||||||||||
| CESM3_092H | [-] | 1.00e+03 | 472. | 473. | 527. | 0.0272 | 0.737 | 0.569 | 0.776 | 0.672 | ||
| CESM3_098bH | [-] | 995. | 469. | 473. | 525. | 0.0272 | 0.585 | 0.571 | 0.785 | 0.678 | ||
| CMIP6_001 | [-] | 956. | 318. | 472. | 635. | 0.940 | -5.55 | 0.550 | 0.262 | 0.406 | ||
| LE2_001 | [-] | 951. | 318. | 472. | 631. | 0.940 | -5.55 | 0.551 | 0.262 | 0.407 |
Download Data |
Period Mean (original grids) [Pg] |
Model Period Mean (intersection) [Pg] |
Benchmark Period Mean (intersection) [Pg] |
Model Period Mean (complement) [Pg] |
Benchmark Period Mean (complement) [Pg] |
Bias [kg m-2] |
Bias Score [1] |
Spatial Distribution Score [1] |
Overall Score [1] |
|||
|---|---|---|---|---|---|---|---|---|---|---|---|---|
| Benchmark | [-] | 116. | ||||||||||
| CESM3_092H | [-] | 102. | 94.4 | 116. | 7.05 | -2.16 | 0.470 | 0.829 | 0.649 | |||
| CESM3_098bH | [-] | 102. | 94.4 | 116. | 7.09 | -2.15 | 0.473 | 0.829 | 0.651 | |||
| CMIP6_001 | [-] | 100. | 75.9 | 116. | 25.5 | 0.373 | -2.93 | 0.438 | 0.127 | 0.283 | ||
| LE2_001 | [-] | 101. | 76.3 | 116. | 25.5 | 0.373 | -2.89 | 0.438 | 0.128 | 0.283 |
Download Data |
Period Mean (original grids) [Pg] |
Model Period Mean (intersection) [Pg] |
Benchmark Period Mean (intersection) [Pg] |
Model Period Mean (complement) [Pg] |
Benchmark Period Mean (complement) [Pg] |
Bias [kg m-2] |
Bias Score [1] |
Spatial Distribution Score [1] |
Overall Score [1] |
|||
|---|---|---|---|---|---|---|---|---|---|---|---|---|
| Benchmark | [-] | 0.0131 | ||||||||||
| CESM3_092H | [-] | 22.7 | 0.0111 | 0.0131 | 22.2 | -0.768 | 0.878 | 2.81e-22 | 0.439 | |||
| CESM3_098bH | [-] | 22.4 | 0.0109 | 0.0131 | 21.9 | -0.870 | 0.863 | 3.37e-22 | 0.431 | |||
| CMIP6_001 | [-] | 22.0 | 0.0151 | 0.0131 | 21.6 | 0.916 | 0.856 | 2.56e-22 | 0.428 | |||
| LE2_001 | [-] | 21.8 | 0.0150 | 0.0131 | 21.4 | 0.874 | 0.863 | 2.22e-22 | 0.431 |
Download Data |
Period Mean (original grids) [Pg] |
Model Period Mean (intersection) [Pg] |
Benchmark Period Mean (intersection) [Pg] |
Model Period Mean (complement) [Pg] |
Benchmark Period Mean (complement) [Pg] |
Bias [kg m-2] |
Bias Score [1] |
Spatial Distribution Score [1] |
Overall Score [1] |
|||
|---|---|---|---|---|---|---|---|---|---|---|---|---|
| Benchmark | [-] | 46.1 | ||||||||||
| CESM3_092H | [-] | 54.1 | 26.6 | 46.1 | 28.0 | -9.38 | 0.548 | 0.324 | 0.436 | |||
| CESM3_098bH | [-] | 53.5 | 26.4 | 46.1 | 27.7 | -9.49 | 0.548 | 0.322 | 0.435 | |||
| CMIP6_001 | [-] | 58.5 | 29.8 | 46.1 | 28.5 | 0.00725 | -7.97 | 0.529 | 0.532 | 0.530 | ||
| LE2_001 | [-] | 58.3 | 29.7 | 46.1 | 28.3 | 0.00725 | -7.99 | 0.530 | 0.531 | 0.530 |
Download Data |
Period Mean (original grids) [Pg] |
Model Period Mean (intersection) [Pg] |
Benchmark Period Mean (intersection) [Pg] |
Model Period Mean (complement) [Pg] |
Benchmark Period Mean (complement) [Pg] |
Bias [kg m-2] |
Bias Score [1] |
Spatial Distribution Score [1] |
Overall Score [1] |
|||
|---|---|---|---|---|---|---|---|---|---|---|---|---|
| Benchmark | [-] | 0.232 | ||||||||||
| CESM3_092H | [-] | 14.8 | 0.396 | 0.232 | 14.9 | 2.26 | 0.417 | 0.795 | 0.606 | |||
| CESM3_098bH | [-] | 14.7 | 0.399 | 0.232 | 14.9 | 2.32 | 0.409 | 0.791 | 0.600 | |||
| CMIP6_001 | [-] | 7.77 | 0.127 | 0.232 | 8.11 | -2.51 | 0.558 | 0.242 | 0.400 | |||
| LE2_001 | [-] | 7.68 | 0.125 | 0.232 | 8.02 | -2.52 | 0.556 | 0.242 | 0.399 |
Temporally integrated period mean