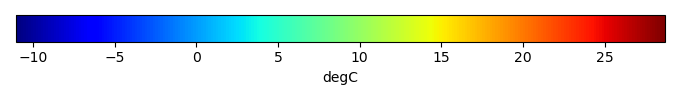
Mean State
Download Data |
Period Mean (original grids) [degC] |
Bias [degC] |
RMSE [degC] |
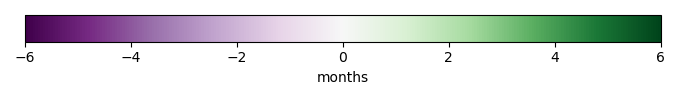
Phase Shift [months] |
Bias Score [1] |
RMSE Score [1] |
Seasonal Cycle Score [1] |
Overall Score [1] |
|||
|---|---|---|---|---|---|---|---|---|---|---|---|
| Benchmark | [-] | 24.8 | |||||||||
| CESM3_092H | [-] | 26.6 | 1.83 | 2.00 | 0.00 | 0.247 | 0.568 | 1.00 | 0.596 | ||
| CESM3_098bH | [-] | 26.7 | 1.90 | 2.30 | 0.508 | 0.239 | 0.526 | 0.966 | 0.564 | ||
| CMIP6_001 | [-] | 27.0 | 2.26 | 2.64 | 0.508 | 0.177 | 0.526 | 0.966 | 0.549 | ||
| LE2_001 | [-] | 27.1 | 2.27 | 2.58 | 0.508 | 0.176 | 0.531 | 0.966 | 0.551 |
Download Data |
Period Mean (original grids) [degC] |
Bias [degC] |
RMSE [degC] |
Phase Shift [months] |
Bias Score [1] |
RMSE Score [1] |
Seasonal Cycle Score [1] |
Overall Score [1] |
|||
|---|---|---|---|---|---|---|---|---|---|---|---|
| Benchmark | [-] | 27.8 | |||||||||
| CESM3_092H | [-] | 29.0 | 1.15 | 2.76 | 0.00 | 0.613 | 0.370 | 1.00 | 0.588 | ||
| CESM3_098bH | [-] | 29.1 | 1.27 | 2.45 | 0.00 | 0.584 | 0.424 | 1.00 | 0.608 | ||
| CMIP6_001 | [-] | 29.4 | 1.55 | 3.07 | 0.00 | 0.520 | 0.355 | 1.00 | 0.558 | ||
| LE2_001 | [-] | 29.4 | 1.54 | 3.15 | 0.00 | 0.524 | 0.332 | 1.00 | 0.547 |
Download Data |
Period Mean (original grids) [degC] |
Bias [degC] |
RMSE [degC] |
Phase Shift [months] |
Bias Score [1] |
RMSE Score [1] |
Seasonal Cycle Score [1] |
Overall Score [1] |
|||
|---|---|---|---|---|---|---|---|---|---|---|---|
| Benchmark | [-] | 22.3 | |||||||||
| CESM3_092H | [-] | 25.2 | 2.90 | 3.72 | 0.00 | 0.315 | 0.413 | 1.00 | 0.535 | ||
| CESM3_098bH | [-] | 25.3 | 2.99 | 3.81 | 0.00 | 0.304 | 0.417 | 1.00 | 0.534 | ||
| CMIP6_001 | [-] | 24.6 | 2.22 | 3.43 | 1.02 | 0.414 | 0.364 | 0.933 | 0.519 | ||
| LE2_001 | [-] | 24.6 | 2.30 | 3.42 | 1.02 | 0.401 | 0.369 | 0.933 | 0.518 |
Download Data |
Period Mean (original grids) [degC] |
Bias [degC] |
RMSE [degC] |
Phase Shift [months] |
Bias Score [1] |
RMSE Score [1] |
Seasonal Cycle Score [1] |
Overall Score [1] |
|||
|---|---|---|---|---|---|---|---|---|---|---|---|
| Benchmark | [-] | -11.8 | |||||||||
| CESM3_092H | [-] | -11.2 | 0.463 | 4.40 | 0.00 | 0.974 | 0.779 | 1.00 | 0.883 | ||
| CESM3_098bH | [-] | -10.3 | 1.46 | 4.86 | 0.00 | 0.920 | 0.775 | 1.00 | 0.868 | ||
| CMIP6_001 | [-] | -9.10 | 2.67 | 6.12 | 0.00 | 0.859 | 0.744 | 1.00 | 0.837 | ||
| LE2_001 | [-] | -8.91 | 2.85 | 6.68 | 0.508 | 0.850 | 0.721 | 0.966 | 0.815 |
Download Data |
Period Mean (original grids) [degC] |
Bias [degC] |
RMSE [degC] |
Phase Shift [months] |
Bias Score [1] |
RMSE Score [1] |
Seasonal Cycle Score [1] |
Overall Score [1] |
|||
|---|---|---|---|---|---|---|---|---|---|---|---|
| Benchmark | [-] | 25.3 | |||||||||
| CESM3_092H | [-] | 27.1 | 1.80 | 2.03 | 0.00 | 0.0704 | 0.425 | 1.00 | 0.480 | ||
| CESM3_098bH | [-] | 27.1 | 1.77 | 2.00 | 0.00 | 0.0738 | 0.360 | 1.00 | 0.448 | ||
| CMIP6_001 | [-] | 26.8 | 1.43 | 1.70 | 1.02 | 0.121 | 0.321 | 0.933 | 0.424 | ||
| LE2_001 | [-] | 26.8 | 1.43 | 1.66 | 1.02 | 0.121 | 0.345 | 0.933 | 0.436 |
Download Data |
Period Mean (original grids) [degC] |
Bias [degC] |
RMSE [degC] |
Phase Shift [months] |
Bias Score [1] |
RMSE Score [1] |
Seasonal Cycle Score [1] |
Overall Score [1] |
|||
|---|---|---|---|---|---|---|---|---|---|---|---|
| Benchmark | [-] | 3.61 | |||||||||
| CESM3_092H | [-] | 5.40 | 1.76 | 4.62 | 0.00 | 0.844 | 0.701 | 1.00 | 0.811 | ||
| CESM3_098bH | [-] | 6.32 | 2.73 | 5.59 | 0.517 | 0.771 | 0.665 | 0.965 | 0.766 | ||
| CMIP6_001 | [-] | 3.64 | 0.0328 | 4.13 | 0.00 | 0.891 | 0.697 | 1.00 | 0.821 | ||
| LE2_001 | [-] | 4.29 | 0.683 | 3.72 | 0.00 | 0.904 | 0.722 | 1.00 | 0.837 |
Download Data |
Period Mean (original grids) [degC] |
Bias [degC] |
RMSE [degC] |
Phase Shift [months] |
Bias Score [1] |
RMSE Score [1] |
Seasonal Cycle Score [1] |
Overall Score [1] |
|||
|---|---|---|---|---|---|---|---|---|---|---|---|
| Benchmark | [-] | 6.27 | |||||||||
| CESM3_092H | [-] | 8.79 | 2.53 | 4.24 | 0.0861 | 0.707 | 0.802 | 0.994 | 0.826 | ||
| CESM3_098bH | [-] | 9.05 | 2.78 | 4.44 | 0.258 | 0.691 | 0.786 | 0.983 | 0.811 | ||
| CMIP6_001 | [-] | 7.64 | 1.38 | 3.41 | 0.344 | 0.789 | 0.793 | 0.977 | 0.838 | ||
| LE2_001 | [-] | 7.88 | 1.62 | 3.44 | 0.344 | 0.777 | 0.803 | 0.977 | 0.840 |
Download Data |
Period Mean (original grids) [degC] |
Bias [degC] |
RMSE [degC] |
Phase Shift [months] |
Bias Score [1] |
RMSE Score [1] |
Seasonal Cycle Score [1] |
Overall Score [1] |
|||
|---|---|---|---|---|---|---|---|---|---|---|---|
| Benchmark | [-] | 20.6 | |||||||||
| CESM3_092H | [-] | 21.8 | 1.34 | 2.68 | 0.636 | 0.661 | 0.616 | 0.958 | 0.713 | ||
| CESM3_098bH | [-] | 21.7 | 1.12 | 2.56 | 0.728 | 0.675 | 0.624 | 0.952 | 0.719 | ||
| CMIP6_001 | [-] | 21.5 | 0.990 | 2.48 | 0.589 | 0.693 | 0.632 | 0.962 | 0.730 | ||
| LE2_001 | [-] | 21.5 | 0.979 | 2.35 | 0.590 | 0.697 | 0.637 | 0.962 | 0.733 |
Download Data |
Period Mean (original grids) [degC] |
Bias [degC] |
RMSE [degC] |
Phase Shift [months] |
Bias Score [1] |
RMSE Score [1] |
Seasonal Cycle Score [1] |
Overall Score [1] |
|||
|---|---|---|---|---|---|---|---|---|---|---|---|
| Benchmark | [-] | 9.37 | |||||||||
| CESM3_092H | [-] | 12.7 | 3.27 | 4.66 | 0.564 | 0.617 | 0.666 | 0.962 | 0.728 | ||
| CESM3_098bH | [-] | 13.1 | 3.80 | 4.93 | 0.517 | 0.578 | 0.674 | 0.965 | 0.723 | ||
| CMIP6_001 | [-] | 11.2 | 1.87 | 3.76 | 0.626 | 0.727 | 0.682 | 0.958 | 0.762 | ||
| LE2_001 | [-] | 11.5 | 2.14 | 3.90 | 0.344 | 0.708 | 0.674 | 0.977 | 0.758 |
Download Data |
Period Mean (original grids) [degC] |
Bias [degC] |
RMSE [degC] |
Phase Shift [months] |
Bias Score [1] |
RMSE Score [1] |
Seasonal Cycle Score [1] |
Overall Score [1] |
|||
|---|---|---|---|---|---|---|---|---|---|---|---|
| Benchmark | [-] | 10.4 | |||||||||
| CESM3_092H | [-] | 12.8 | 2.40 | 4.34 | 0.496 | 0.676 | 0.649 | 0.967 | 0.735 | ||
| CESM3_098bH | [-] | 13.2 | 2.83 | 4.52 | 0.526 | 0.646 | 0.655 | 0.965 | 0.730 | ||
| CMIP6_001 | [-] | 12.0 | 1.69 | 3.75 | 0.572 | 0.730 | 0.670 | 0.961 | 0.758 | ||
| LE2_001 | [-] | 12.1 | 1.81 | 3.79 | 0.485 | 0.724 | 0.664 | 0.967 | 0.755 |
Download Data |
Period Mean (original grids) [degC] |
Bias [degC] |
RMSE [degC] |
Phase Shift [months] |
Bias Score [1] |
RMSE Score [1] |
Seasonal Cycle Score [1] |
Overall Score [1] |
|||
|---|---|---|---|---|---|---|---|---|---|---|---|
| Benchmark | [-] | -7.46 | |||||||||
| CESM3_092H | [-] | -6.87 | 0.519 | 4.92 | 0.339 | 0.888 | 0.718 | 0.978 | 0.825 | ||
| CESM3_098bH | [-] | -6.31 | 1.26 | 5.10 | 0.339 | 0.882 | 0.739 | 0.978 | 0.834 | ||
| CMIP6_001 | [-] | -5.51 | 1.95 | 6.11 | 0.00 | 0.850 | 0.678 | 1.00 | 0.802 | ||
| LE2_001 | [-] | -4.44 | 3.02 | 6.89 | 0.339 | 0.814 | 0.667 | 0.978 | 0.781 |
Download Data |
Period Mean (original grids) [degC] |
Bias [degC] |
RMSE [degC] |
Phase Shift [months] |
Bias Score [1] |
RMSE Score [1] |
Seasonal Cycle Score [1] |
Overall Score [1] |
|||
|---|---|---|---|---|---|---|---|---|---|---|---|
| Benchmark | [-] | 25.3 | |||||||||
| CESM3_092H | [-] | 27.4 | 2.10 | 2.43 | 1.02 | 0.0143 | 0.296 | 0.933 | 0.385 | ||
| CESM3_098bH | [-] | 27.5 | 2.26 | 2.55 | 1.02 | 0.0106 | 0.266 | 0.933 | 0.369 | ||
| CMIP6_001 | [-] | 27.0 | 1.71 | 1.94 | 0.00 | 0.0320 | 0.256 | 1.00 | 0.386 | ||
| LE2_001 | [-] | 27.1 | 1.82 | 2.14 | 0.00 | 0.0256 | 0.247 | 1.00 | 0.380 |
Download Data |
Period Mean (original grids) [degC] |
Bias [degC] |
RMSE [degC] |
Phase Shift [months] |
Bias Score [1] |
RMSE Score [1] |
Seasonal Cycle Score [1] |
Overall Score [1] |
|||
|---|---|---|---|---|---|---|---|---|---|---|---|
| Benchmark | [-] | 9.23 | |||||||||
| CESM3_092H | [-] | 12.3 | 3.06 | 5.09 | 0.614 | 0.729 | 0.669 | 0.959 | 0.756 | ||
| CESM3_098bH | [-] | 12.8 | 3.52 | 5.25 | 0.670 | 0.693 | 0.684 | 0.955 | 0.754 | ||
| CMIP6_001 | [-] | 11.4 | 2.19 | 4.25 | 0.837 | 0.799 | 0.705 | 0.940 | 0.787 | ||
| LE2_001 | [-] | 11.4 | 2.13 | 4.22 | 0.782 | 0.804 | 0.695 | 0.944 | 0.784 |
Download Data |
Period Mean (original grids) [degC] |
Bias [degC] |
RMSE [degC] |
Phase Shift [months] |
Bias Score [1] |
RMSE Score [1] |
Seasonal Cycle Score [1] |
Overall Score [1] |
|||
|---|---|---|---|---|---|---|---|---|---|---|---|
| Benchmark | [-] | -0.0990 | |||||||||
| CESM3_092H | [-] | 1.73 | 1.82 | 5.52 | 0.0689 | 0.858 | 0.671 | 0.995 | 0.799 | ||
| CESM3_098bH | [-] | 2.49 | 2.59 | 5.68 | 0.138 | 0.816 | 0.686 | 0.991 | 0.795 | ||
| CMIP6_001 | [-] | 0.960 | 1.06 | 4.37 | 0.207 | 0.902 | 0.734 | 0.986 | 0.839 | ||
| LE2_001 | [-] | 1.14 | 1.24 | 4.33 | 0.0689 | 0.896 | 0.729 | 0.995 | 0.838 |
Download Data |
Period Mean (original grids) [degC] |
Bias [degC] |
RMSE [degC] |
Phase Shift [months] |
Bias Score [1] |
RMSE Score [1] |
Seasonal Cycle Score [1] |
Overall Score [1] |
|||
|---|---|---|---|---|---|---|---|---|---|---|---|
| Benchmark | [-] | 12.4 | |||||||||
| CESM3_092H | [-] | 14.3 | 1.92 | 4.01 | 0.735 | 0.770 | 0.635 | 0.951 | 0.747 | ||
| CESM3_098bH | [-] | 14.6 | 2.37 | 4.21 | 0.735 | 0.718 | 0.635 | 0.951 | 0.735 | ||
| CMIP6_001 | [-] | 14.6 | 2.24 | 3.90 | 0.698 | 0.730 | 0.657 | 0.953 | 0.749 | ||
| LE2_001 | [-] | 14.6 | 2.20 | 3.90 | 0.809 | 0.732 | 0.645 | 0.946 | 0.742 |
Download Data |
Period Mean (original grids) [degC] |
Bias [degC] |
RMSE [degC] |
Phase Shift [months] |
Bias Score [1] |
RMSE Score [1] |
Seasonal Cycle Score [1] |
Overall Score [1] |
|||
|---|---|---|---|---|---|---|---|---|---|---|---|
| Benchmark | [-] | 25.8 | |||||||||
| CESM3_092H | [-] | 28.3 | 2.55 | 3.17 | 0.339 | 0.0400 | 0.155 | 0.978 | 0.332 | ||
| CESM3_098bH | [-] | 28.4 | 2.67 | 3.23 | 0.339 | 0.0338 | 0.162 | 0.978 | 0.334 | ||
| CMIP6_001 | [-] | 27.3 | 1.55 | 1.81 | 0.339 | 0.150 | 0.336 | 0.978 | 0.450 | ||
| LE2_001 | [-] | 27.4 | 1.59 | 1.94 | 0.00 | 0.143 | 0.302 | 1.00 | 0.437 |
Download Data |
Period Mean (original grids) [degC] |
Bias [degC] |
RMSE [degC] |
Phase Shift [months] |
Bias Score [1] |
RMSE Score [1] |
Seasonal Cycle Score [1] |
Overall Score [1] |
|||
|---|---|---|---|---|---|---|---|---|---|---|---|
| Benchmark | [-] | 21.6 | |||||||||
| CESM3_092H | [-] | 23.4 | 1.78 | 2.67 | 0.00 | 0.666 | 0.630 | 1.00 | 0.732 | ||
| CESM3_098bH | [-] | 23.7 | 2.08 | 3.05 | 0.00 | 0.622 | 0.665 | 1.00 | 0.738 | ||
| CMIP6_001 | [-] | 23.6 | 1.99 | 3.11 | 0.00 | 0.635 | 0.637 | 1.00 | 0.727 | ||
| LE2_001 | [-] | 23.5 | 1.88 | 2.32 | 0.983 | 0.652 | 0.657 | 0.937 | 0.725 |
Download Data |
Period Mean (original grids) [degC] |
Bias [degC] |
RMSE [degC] |
Phase Shift [months] |
Bias Score [1] |
RMSE Score [1] |
Seasonal Cycle Score [1] |
Overall Score [1] |
|||
|---|---|---|---|---|---|---|---|---|---|---|---|
| Benchmark | [-] | 19.7 | |||||||||
| CESM3_092H | [-] | 18.4 | -1.32 | 2.61 | 0.00 | 0.809 | 0.685 | 1.00 | 0.795 | ||
| CESM3_098bH | [-] | 18.8 | -0.892 | 1.99 | 0.00 | 0.867 | 0.746 | 1.00 | 0.840 | ||
| CMIP6_001 | [-] | 18.0 | -1.66 | 2.78 | 0.00 | 0.766 | 0.676 | 1.00 | 0.780 | ||
| LE2_001 | [-] | 18.1 | -1.64 | 2.66 | 0.00 | 0.769 | 0.723 | 1.00 | 0.804 |
Temporally integrated period mean