Mean State
Download Data |
Period Mean (original grids) [W m-2] |
Model Period Mean (intersection) [W m-2] |
Benchmark Period Mean (intersection) [W m-2] |
Model Period Mean (complement) [W m-2] |
Benchmark Period Mean (complement) [W m-2] |
Bias [W m-2] |
RMSE [W m-2] |
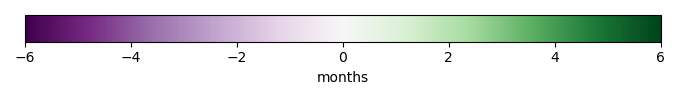
Phase Shift [months] |
Bias Score [1] |
RMSE Score [1] |
Seasonal Cycle Score [1] |
Spatial Distribution Score [1] |
Overall Score [1] |
|||
|---|---|---|---|---|---|---|---|---|---|---|---|---|---|---|---|---|
| Benchmark | [-] | 401. | ||||||||||||||
| CESM3_092H | [-] | 401. | 402. | 400. | 418. | 3.10 | 12.5 | 1.83 | 0.466 | 0.361 | 0.740 | 0.973 | 0.580 | |||
| CESM3_098bH | [-] | 403. | 403. | 400. | 418. | 4.62 | 12.8 | 1.62 | 0.400 | 0.405 | 0.773 | 0.942 | 0.585 | |||
| CMIP6_001 | [-] | 407. | 407. | 400. | 416. | 8.12 | 13.3 | 1.69 | 0.374 | 0.387 | 0.772 | 1.00 | 0.584 | |||
| LE2_001 | [-] | 407. | 407. | 400. | 416. | 8.42 | 13.4 | 1.91 | 0.371 | 0.387 | 0.725 | 0.999 | 0.574 |
Download Data |
Period Mean (original grids) [W m-2] |
Model Period Mean (intersection) [W m-2] |
Benchmark Period Mean (intersection) [W m-2] |
Model Period Mean (complement) [W m-2] |
Benchmark Period Mean (complement) [W m-2] |
Bias [W m-2] |
RMSE [W m-2] |
Phase Shift [months] |
Bias Score [1] |
RMSE Score [1] |
Seasonal Cycle Score [1] |
Spatial Distribution Score [1] |
Overall Score [1] |
|||
|---|---|---|---|---|---|---|---|---|---|---|---|---|---|---|---|---|
| Benchmark | [-] | 391. | ||||||||||||||
| CESM3_092H | [-] | 391. | 391. | 391. | 417. | 0.343 | 15.3 | 0.784 | 0.767 | 0.576 | 0.927 | 1.00 | 0.769 | |||
| CESM3_098bH | [-] | 395. | 395. | 391. | 417. | 4.50 | 14.0 | 0.674 | 0.718 | 0.652 | 0.938 | 1.00 | 0.792 | |||
| CMIP6_001 | [-] | 396. | 396. | 391. | 404. | 4.95 | 14.5 | 0.677 | 0.724 | 0.635 | 0.941 | 1.00 | 0.787 | |||
| LE2_001 | [-] | 396. | 396. | 391. | 404. | 4.97 | 15.1 | 0.695 | 0.729 | 0.621 | 0.938 | 0.999 | 0.782 |
Download Data |
Period Mean (original grids) [W m-2] |
Model Period Mean (intersection) [W m-2] |
Benchmark Period Mean (intersection) [W m-2] |
Model Period Mean (complement) [W m-2] |
Benchmark Period Mean (complement) [W m-2] |
Bias [W m-2] |
RMSE [W m-2] |
Phase Shift [months] |
Bias Score [1] |
RMSE Score [1] |
Seasonal Cycle Score [1] |
Spatial Distribution Score [1] |
Overall Score [1] |
|||
|---|---|---|---|---|---|---|---|---|---|---|---|---|---|---|---|---|
| Benchmark | [-] | 366. | ||||||||||||||
| CESM3_092H | [-] | 368. | 368. | 365. | 383. | 4.94 | 11.2 | 1.24 | 0.716 | 0.685 | 0.834 | 0.998 | 0.783 | |||
| CESM3_098bH | [-] | 365. | 365. | 365. | 382. | 2.12 | 10.9 | 1.51 | 0.748 | 0.669 | 0.800 | 0.999 | 0.777 | |||
| CMIP6_001 | [-] | 373. | 373. | 365. | 383. | 9.88 | 14.5 | 1.27 | 0.624 | 0.670 | 0.837 | 0.991 | 0.758 | |||
| LE2_001 | [-] | 373. | 373. | 365. | 383. | 10.1 | 14.6 | 1.32 | 0.617 | 0.669 | 0.834 | 0.992 | 0.756 |
Download Data |
Period Mean (original grids) [W m-2] |
Model Period Mean (intersection) [W m-2] |
Benchmark Period Mean (intersection) [W m-2] |
Model Period Mean (complement) [W m-2] |
Benchmark Period Mean (complement) [W m-2] |
Bias [W m-2] |
RMSE [W m-2] |
Phase Shift [months] |
Bias Score [1] |
RMSE Score [1] |
Seasonal Cycle Score [1] |
Spatial Distribution Score [1] |
Overall Score [1] |
|||
|---|---|---|---|---|---|---|---|---|---|---|---|---|---|---|---|---|
| Benchmark | [-] | 240. | ||||||||||||||
| CESM3_092H | [-] | 247. | 246. | 240. | 254. | 8.82 | 15.4 | 0.194 | 0.849 | 0.826 | 0.987 | 0.999 | 0.898 | |||
| CESM3_098bH | [-] | 250. | 250. | 240. | 253. | 12.9 | 17.8 | 0.195 | 0.797 | 0.831 | 0.987 | 1.00 | 0.889 | |||
| CMIP6_001 | [-] | 253. | 253. | 239. | 256. | 16.4 | 20.3 | 0.0967 | 0.754 | 0.839 | 0.993 | 0.999 | 0.885 | |||
| LE2_001 | [-] | 254. | 254. | 239. | 256. | 17.3 | 21.4 | 0.111 | 0.743 | 0.832 | 0.993 | 0.998 | 0.880 |
Download Data |
Period Mean (original grids) [W m-2] |
Model Period Mean (intersection) [W m-2] |
Benchmark Period Mean (intersection) [W m-2] |
Model Period Mean (complement) [W m-2] |
Benchmark Period Mean (complement) [W m-2] |
Bias [W m-2] |
RMSE [W m-2] |
Phase Shift [months] |
Bias Score [1] |
RMSE Score [1] |
Seasonal Cycle Score [1] |
Spatial Distribution Score [1] |
Overall Score [1] |
|||
|---|---|---|---|---|---|---|---|---|---|---|---|---|---|---|---|---|
| Benchmark | [-] | 413. | ||||||||||||||
| CESM3_092H | [-] | 424. | 424. | 412. | 422. | 15.2 | 16.4 | 1.25 | 0.131 | 0.517 | 0.807 | 0.701 | 0.535 | |||
| CESM3_098bH | [-] | 425. | 425. | 412. | 422. | 15.6 | 16.8 | 1.20 | 0.128 | 0.524 | 0.836 | 0.626 | 0.528 | |||
| CMIP6_001 | [-] | 424. | 424. | 411. | 419. | 15.5 | 17.2 | 1.56 | 0.117 | 0.438 | 0.790 | 0.709 | 0.498 | |||
| LE2_001 | [-] | 424. | 424. | 411. | 419. | 15.2 | 16.9 | 1.76 | 0.124 | 0.448 | 0.759 | 0.702 | 0.496 |
Download Data |
Period Mean (original grids) [W m-2] |
Model Period Mean (intersection) [W m-2] |
Benchmark Period Mean (intersection) [W m-2] |
Model Period Mean (complement) [W m-2] |
Benchmark Period Mean (complement) [W m-2] |
Bias [W m-2] |
RMSE [W m-2] |
Phase Shift [months] |
Bias Score [1] |
RMSE Score [1] |
Seasonal Cycle Score [1] |
Spatial Distribution Score [1] |
Overall Score [1] |
|||
|---|---|---|---|---|---|---|---|---|---|---|---|---|---|---|---|---|
| Benchmark | [-] | 264. | ||||||||||||||
| CESM3_092H | [-] | 272. | 272. | 265. | 281. | 8.40 | 13.9 | 0.0223 | 0.847 | 0.853 | 0.999 | 0.977 | 0.906 | |||
| CESM3_098bH | [-] | 278. | 277. | 264. | 281. | 13.7 | 17.9 | 0.115 | 0.784 | 0.852 | 0.992 | 0.983 | 0.892 | |||
| CMIP6_001 | [-] | 273. | 273. | 264. | 280. | 9.18 | 17.2 | 0.0155 | 0.845 | 0.801 | 0.999 | 0.994 | 0.888 | |||
| LE2_001 | [-] | 275. | 275. | 264. | 280. | 11.3 | 19.1 | 0.0221 | 0.818 | 0.789 | 0.999 | 0.998 | 0.878 |
Download Data |
Period Mean (original grids) [W m-2] |
Model Period Mean (intersection) [W m-2] |
Benchmark Period Mean (intersection) [W m-2] |
Model Period Mean (complement) [W m-2] |
Benchmark Period Mean (complement) [W m-2] |
Bias [W m-2] |
RMSE [W m-2] |
Phase Shift [months] |
Bias Score [1] |
RMSE Score [1] |
Seasonal Cycle Score [1] |
Spatial Distribution Score [1] |
Overall Score [1] |
|||
|---|---|---|---|---|---|---|---|---|---|---|---|---|---|---|---|---|
| Benchmark | [-] | 297. | ||||||||||||||
| CESM3_092H | [-] | 293. | 292. | 298. | 367. | -1.06 | 16.3 | 0.107 | 0.820 | 0.786 | 0.993 | 0.993 | 0.876 | |||
| CESM3_098bH | [-] | 295. | 295. | 297. | 367. | 1.93 | 16.5 | 0.210 | 0.810 | 0.790 | 0.985 | 0.995 | 0.874 | |||
| CMIP6_001 | [-] | 292. | 292. | 297. | 354. | -1.73 | 13.9 | 0.110 | 0.846 | 0.809 | 0.991 | 0.998 | 0.891 | |||
| LE2_001 | [-] | 294. | 294. | 297. | 354. | 0.0134 | 14.0 | 0.103 | 0.843 | 0.807 | 0.992 | 0.998 | 0.889 |
Download Data |
Period Mean (original grids) [W m-2] |
Model Period Mean (intersection) [W m-2] |
Benchmark Period Mean (intersection) [W m-2] |
Model Period Mean (complement) [W m-2] |
Benchmark Period Mean (complement) [W m-2] |
Bias [W m-2] |
RMSE [W m-2] |
Phase Shift [months] |
Bias Score [1] |
RMSE Score [1] |
Seasonal Cycle Score [1] |
Spatial Distribution Score [1] |
Overall Score [1] |
|||
|---|---|---|---|---|---|---|---|---|---|---|---|---|---|---|---|---|
| Benchmark | [-] | 386. | ||||||||||||||
| CESM3_092H | [-] | 377. | 378. | 386. | 415. | -0.607 | 18.9 | 0.689 | 0.670 | 0.608 | 0.939 | 0.976 | 0.760 | |||
| CESM3_098bH | [-] | 378. | 378. | 386. | 415. | -0.0556 | 18.3 | 0.646 | 0.688 | 0.595 | 0.941 | 0.986 | 0.761 | |||
| CMIP6_001 | [-] | 380. | 380. | 384. | 415. | 1.40 | 15.6 | 0.666 | 0.728 | 0.632 | 0.940 | 0.993 | 0.785 | |||
| LE2_001 | [-] | 381. | 381. | 384. | 415. | 2.10 | 15.9 | 0.724 | 0.726 | 0.621 | 0.936 | 0.993 | 0.779 |
Download Data |
Period Mean (original grids) [W m-2] |
Model Period Mean (intersection) [W m-2] |
Benchmark Period Mean (intersection) [W m-2] |
Model Period Mean (complement) [W m-2] |
Benchmark Period Mean (complement) [W m-2] |
Bias [W m-2] |
RMSE [W m-2] |
Phase Shift [months] |
Bias Score [1] |
RMSE Score [1] |
Seasonal Cycle Score [1] |
Spatial Distribution Score [1] |
Overall Score [1] |
|||
|---|---|---|---|---|---|---|---|---|---|---|---|---|---|---|---|---|
| Benchmark | [-] | 242. | ||||||||||||||
| CESM3_092H | [-] | 255. | 256. | 242. | 260. | 14.7 | 18.3 | 0.221 | 0.767 | 0.842 | 0.985 | 0.988 | 0.885 | |||
| CESM3_098bH | [-] | 260. | 261. | 242. | 260. | 19.8 | 23.0 | 0.205 | 0.702 | 0.833 | 0.986 | 0.996 | 0.870 | |||
| CMIP6_001 | [-] | 262. | 262. | 242. | 251. | 20.8 | 25.7 | 0.128 | 0.698 | 0.791 | 0.991 | 0.959 | 0.846 | |||
| LE2_001 | [-] | 264. | 264. | 242. | 251. | 22.7 | 28.0 | 0.229 | 0.674 | 0.775 | 0.985 | 0.967 | 0.835 |
Download Data |
Period Mean (original grids) [W m-2] |
Model Period Mean (intersection) [W m-2] |
Benchmark Period Mean (intersection) [W m-2] |
Model Period Mean (complement) [W m-2] |
Benchmark Period Mean (complement) [W m-2] |
Bias [W m-2] |
RMSE [W m-2] |
Phase Shift [months] |
Bias Score [1] |
RMSE Score [1] |
Seasonal Cycle Score [1] |
Spatial Distribution Score [1] |
Overall Score [1] |
|||
|---|---|---|---|---|---|---|---|---|---|---|---|---|---|---|---|---|
| Benchmark | [-] | 353. | ||||||||||||||
| CESM3_092H | [-] | 357. | 357. | 352. | 373. | 5.91 | 10.3 | 0.384 | 0.796 | 0.796 | 0.973 | 0.998 | 0.872 | |||
| CESM3_098bH | [-] | 351. | 351. | 352. | 373. | 0.213 | 9.94 | 0.758 | 0.840 | 0.776 | 0.935 | 0.999 | 0.865 | |||
| CMIP6_001 | [-] | 359. | 359. | 352. | 360. | 7.12 | 10.5 | 0.521 | 0.787 | 0.813 | 0.962 | 0.999 | 0.875 | |||
| LE2_001 | [-] | 357. | 357. | 352. | 360. | 5.67 | 10.6 | 0.571 | 0.803 | 0.794 | 0.960 | 1.00 | 0.870 |
Download Data |
Period Mean (original grids) [W m-2] |
Model Period Mean (intersection) [W m-2] |
Benchmark Period Mean (intersection) [W m-2] |
Model Period Mean (complement) [W m-2] |
Benchmark Period Mean (complement) [W m-2] |
Bias [W m-2] |
RMSE [W m-2] |
Phase Shift [months] |
Bias Score [1] |
RMSE Score [1] |
Seasonal Cycle Score [1] |
Spatial Distribution Score [1] |
Overall Score [1] |
|||
|---|---|---|---|---|---|---|---|---|---|---|---|---|---|---|---|---|
| Benchmark | [-] | 312. | ||||||||||||||
| CESM3_092H | [-] | 320. | 321. | 311. | 329. | 11.4 | 15.0 | 0.395 | 0.685 | 0.781 | 0.973 | 0.972 | 0.839 | |||
| CESM3_098bH | [-] | 322. | 322. | 311. | 329. | 13.8 | 16.8 | 0.425 | 0.639 | 0.784 | 0.971 | 0.970 | 0.830 | |||
| CMIP6_001 | [-] | 316. | 316. | 310. | 327. | 7.60 | 13.0 | 0.269 | 0.741 | 0.786 | 0.982 | 0.953 | 0.849 | |||
| LE2_001 | [-] | 316. | 316. | 310. | 327. | 7.82 | 13.4 | 0.238 | 0.737 | 0.775 | 0.984 | 0.954 | 0.845 |
Download Data |
Period Mean (original grids) [W m-2] |
Model Period Mean (intersection) [W m-2] |
Benchmark Period Mean (intersection) [W m-2] |
Model Period Mean (complement) [W m-2] |
Benchmark Period Mean (complement) [W m-2] |
Bias [W m-2] |
RMSE [W m-2] |
Phase Shift [months] |
Bias Score [1] |
RMSE Score [1] |
Seasonal Cycle Score [1] |
Spatial Distribution Score [1] |
Overall Score [1] |
|||
|---|---|---|---|---|---|---|---|---|---|---|---|---|---|---|---|---|
| Benchmark | [-] | 316. | ||||||||||||||
| CESM3_092H | [-] | 313. | 313. | 316. | 375. | 1.98 | 15.4 | 0.661 | 0.695 | 0.689 | 0.918 | 0.994 | 0.797 | |||
| CESM3_098bH | [-] | 314. | 314. | 315. | 375. | 3.33 | 16.2 | 0.678 | 0.677 | 0.687 | 0.918 | 0.994 | 0.793 | |||
| CMIP6_001 | [-] | 314. | 314. | 314. | 359. | 3.58 | 15.1 | 0.686 | 0.696 | 0.698 | 0.916 | 0.997 | 0.801 | |||
| LE2_001 | [-] | 315. | 314. | 314. | 359. | 4.02 | 15.5 | 0.711 | 0.694 | 0.692 | 0.912 | 0.997 | 0.797 |
Download Data |
Period Mean (original grids) [W m-2] |
Model Period Mean (intersection) [W m-2] |
Benchmark Period Mean (intersection) [W m-2] |
Model Period Mean (complement) [W m-2] |
Benchmark Period Mean (complement) [W m-2] |
Bias [W m-2] |
RMSE [W m-2] |
Phase Shift [months] |
Bias Score [1] |
RMSE Score [1] |
Seasonal Cycle Score [1] |
Spatial Distribution Score [1] |
Overall Score [1] |
|||
|---|---|---|---|---|---|---|---|---|---|---|---|---|---|---|---|---|
| Benchmark | [-] | 348. | ||||||||||||||
| CESM3_092H | [-] | 342. | 342. | 348. | 373. | -4.07 | 14.3 | 0.261 | 0.777 | 0.767 | 0.979 | 1.00 | 0.858 | |||
| CESM3_098bH | [-] | 346. | 345. | 348. | 373. | -0.633 | 14.4 | 0.247 | 0.775 | 0.770 | 0.982 | 0.999 | 0.859 | |||
| CMIP6_001 | [-] | 339. | 338. | 347. | 371. | -7.20 | 13.4 | 0.786 | 0.770 | 0.793 | 0.916 | 0.998 | 0.854 | |||
| LE2_001 | [-] | 339. | 339. | 347. | 371. | -7.07 | 13.8 | 0.796 | 0.769 | 0.780 | 0.911 | 0.999 | 0.848 |
Download Data |
Period Mean (original grids) [W m-2] |
Model Period Mean (intersection) [W m-2] |
Benchmark Period Mean (intersection) [W m-2] |
Model Period Mean (complement) [W m-2] |
Benchmark Period Mean (complement) [W m-2] |
Bias [W m-2] |
RMSE [W m-2] |
Phase Shift [months] |
Bias Score [1] |
RMSE Score [1] |
Seasonal Cycle Score [1] |
Spatial Distribution Score [1] |
Overall Score [1] |
|||
|---|---|---|---|---|---|---|---|---|---|---|---|---|---|---|---|---|
| Benchmark | [-] | 246. | ||||||||||||||
| CESM3_092H | [-] | 255. | 255. | 246. | 251. | 8.66 | 18.8 | 0.311 | 0.838 | 0.745 | 0.979 | 0.998 | 0.861 | |||
| CESM3_098bH | [-] | 260. | 259. | 246. | 251. | 13.5 | 22.4 | 0.355 | 0.768 | 0.728 | 0.976 | 0.998 | 0.840 | |||
| CMIP6_001 | [-] | 262. | 262. | 245. | 258. | 16.8 | 21.3 | 0.177 | 0.728 | 0.806 | 0.988 | 0.997 | 0.865 | |||
| LE2_001 | [-] | 263. | 263. | 245. | 258. | 18.0 | 22.3 | 0.204 | 0.711 | 0.808 | 0.986 | 0.999 | 0.862 |
Download Data |
Period Mean (original grids) [W m-2] |
Model Period Mean (intersection) [W m-2] |
Benchmark Period Mean (intersection) [W m-2] |
Model Period Mean (complement) [W m-2] |
Benchmark Period Mean (complement) [W m-2] |
Bias [W m-2] |
RMSE [W m-2] |
Phase Shift [months] |
Bias Score [1] |
RMSE Score [1] |
Seasonal Cycle Score [1] |
Spatial Distribution Score [1] |
Overall Score [1] |
|||
|---|---|---|---|---|---|---|---|---|---|---|---|---|---|---|---|---|
| Benchmark | [-] | 376. | ||||||||||||||
| CESM3_092H | [-] | 370. | 370. | 375. | 406. | 6.71 | 14.8 | 1.50 | 0.596 | 0.665 | 0.788 | 0.998 | 0.743 | |||
| CESM3_098bH | [-] | 371. | 370. | 375. | 406. | 7.35 | 15.5 | 1.44 | 0.584 | 0.645 | 0.802 | 0.998 | 0.735 | |||
| CMIP6_001 | [-] | 372. | 372. | 370. | 403. | 8.68 | 15.1 | 1.55 | 0.601 | 0.687 | 0.780 | 0.985 | 0.748 | |||
| LE2_001 | [-] | 373. | 373. | 370. | 403. | 9.48 | 15.7 | 1.48 | 0.590 | 0.681 | 0.783 | 0.982 | 0.743 |
Download Data |
Period Mean (original grids) [W m-2] |
Model Period Mean (intersection) [W m-2] |
Benchmark Period Mean (intersection) [W m-2] |
Model Period Mean (complement) [W m-2] |
Benchmark Period Mean (complement) [W m-2] |
Bias [W m-2] |
RMSE [W m-2] |
Phase Shift [months] |
Bias Score [1] |
RMSE Score [1] |
Seasonal Cycle Score [1] |
Spatial Distribution Score [1] |
Overall Score [1] |
|||
|---|---|---|---|---|---|---|---|---|---|---|---|---|---|---|---|---|
| Benchmark | [-] | 333. | ||||||||||||||
| CESM3_092H | [-] | 335. | 335. | 332. | 382. | 6.37 | 14.2 | 0.285 | 0.855 | 0.782 | 0.981 | 0.998 | 0.880 | |||
| CESM3_098bH | [-] | 336. | 337. | 333. | 382. | 7.81 | 14.2 | 0.139 | 0.834 | 0.805 | 0.991 | 0.996 | 0.886 | |||
| CMIP6_001 | [-] | 333. | 333. | 331. | 372. | 5.07 | 11.8 | 0.440 | 0.873 | 0.825 | 0.970 | 0.990 | 0.897 | |||
| LE2_001 | [-] | 334. | 335. | 331. | 372. | 6.30 | 12.8 | 0.557 | 0.854 | 0.824 | 0.963 | 0.984 | 0.890 |
Download Data |
Period Mean (original grids) [W m-2] |
Model Period Mean (intersection) [W m-2] |
Benchmark Period Mean (intersection) [W m-2] |
Model Period Mean (complement) [W m-2] |
Benchmark Period Mean (complement) [W m-2] |
Bias [W m-2] |
RMSE [W m-2] |
Phase Shift [months] |
Bias Score [1] |
RMSE Score [1] |
Seasonal Cycle Score [1] |
Spatial Distribution Score [1] |
Overall Score [1] |
|||
|---|---|---|---|---|---|---|---|---|---|---|---|---|---|---|---|---|
| Benchmark | [-] | 278. | ||||||||||||||
| CESM3_092H | [-] | 283. | 284. | 278. | 310. | 8.12 | 15.3 | 0.208 | 0.812 | 0.776 | 0.986 | 0.996 | 0.869 | |||
| CESM3_098bH | [-] | 287. | 287. | 278. | 309. | 11.3 | 17.3 | 0.122 | 0.763 | 0.773 | 0.992 | 0.997 | 0.860 | |||
| CMIP6_001 | [-] | 285. | 285. | 277. | 302. | 9.45 | 14.7 | 0.275 | 0.798 | 0.830 | 0.982 | 0.984 | 0.885 | |||
| LE2_001 | [-] | 283. | 283. | 277. | 302. | 8.20 | 14.5 | 0.0807 | 0.816 | 0.809 | 0.995 | 0.981 | 0.882 |
Download Data |
Period Mean (original grids) [W m-2] |
Model Period Mean (intersection) [W m-2] |
Benchmark Period Mean (intersection) [W m-2] |
Model Period Mean (complement) [W m-2] |
Benchmark Period Mean (complement) [W m-2] |
Bias [W m-2] |
RMSE [W m-2] |
Phase Shift [months] |
Bias Score [1] |
RMSE Score [1] |
Seasonal Cycle Score [1] |
Spatial Distribution Score [1] |
Overall Score [1] |
|||
|---|---|---|---|---|---|---|---|---|---|---|---|---|---|---|---|---|
| Benchmark | [-] | 296. | ||||||||||||||
| CESM3_092H | [-] | 297. | 299. | 296. | 324. | 3.24 | 13.1 | 0.722 | 0.802 | 0.771 | 0.951 | 0.999 | 0.859 | |||
| CESM3_098bH | [-] | 298. | 299. | 296. | 323. | 4.41 | 12.8 | 0.414 | 0.790 | 0.787 | 0.972 | 0.999 | 0.867 | |||
| CMIP6_001 | [-] | 299. | 300. | 296. | 323. | 5.08 | 11.1 | 0.495 | 0.798 | 0.834 | 0.967 | 0.999 | 0.887 | |||
| LE2_001 | [-] | 299. | 300. | 296. | 323. | 4.88 | 11.8 | 0.557 | 0.802 | 0.809 | 0.963 | 1.00 | 0.876 |
Download Data |
Period Mean (original grids) [W m-2] |
Model Period Mean (intersection) [W m-2] |
Benchmark Period Mean (intersection) [W m-2] |
Model Period Mean (complement) [W m-2] |
Benchmark Period Mean (complement) [W m-2] |
Bias [W m-2] |
RMSE [W m-2] |
Phase Shift [months] |
Bias Score [1] |
RMSE Score [1] |
Seasonal Cycle Score [1] |
Spatial Distribution Score [1] |
Overall Score [1] |
|||
|---|---|---|---|---|---|---|---|---|---|---|---|---|---|---|---|---|
| Benchmark | [-] | 411. | ||||||||||||||
| CESM3_092H | [-] | 411. | 411. | 411. | 417. | 0.229 | 14.3 | 3.07 | 0.455 | 0.394 | 0.496 | 0.999 | 0.548 | |||
| CESM3_098bH | [-] | 411. | 411. | 412. | 417. | 0.232 | 16.0 | 2.87 | 0.431 | 0.344 | 0.538 | 0.998 | 0.531 | |||
| CMIP6_001 | [-] | 412. | 412. | 411. | 418. | 1.07 | 15.8 | 3.13 | 0.437 | 0.338 | 0.474 | 0.994 | 0.516 | |||
| LE2_001 | [-] | 412. | 412. | 411. | 418. | 1.16 | 15.8 | 3.20 | 0.434 | 0.346 | 0.459 | 0.995 | 0.516 |
Download Data |
Period Mean (original grids) [W m-2] |
Model Period Mean (intersection) [W m-2] |
Benchmark Period Mean (intersection) [W m-2] |
Model Period Mean (complement) [W m-2] |
Benchmark Period Mean (complement) [W m-2] |
Bias [W m-2] |
RMSE [W m-2] |
Phase Shift [months] |
Bias Score [1] |
RMSE Score [1] |
Seasonal Cycle Score [1] |
Spatial Distribution Score [1] |
Overall Score [1] |
|||
|---|---|---|---|---|---|---|---|---|---|---|---|---|---|---|---|---|
| Benchmark | [-] | 379. | ||||||||||||||
| CESM3_092H | [-] | 377. | 376. | 379. | 373. | -2.45 | 12.2 | 1.41 | 0.762 | 0.652 | 0.791 | 1.00 | 0.771 | |||
| CESM3_098bH | [-] | 373. | 372. | 379. | 373. | -6.70 | 14.3 | 1.45 | 0.685 | 0.638 | 0.792 | 0.996 | 0.750 | |||
| CMIP6_001 | [-] | 379. | 378. | 379. | 374. | -1.05 | 11.7 | 1.01 | 0.771 | 0.661 | 0.883 | 1.00 | 0.795 | |||
| LE2_001 | [-] | 379. | 378. | 379. | 374. | -0.910 | 11.8 | 1.07 | 0.773 | 0.660 | 0.867 | 1.00 | 0.792 |
Download Data |
Period Mean (original grids) [W m-2] |
Model Period Mean (intersection) [W m-2] |
Benchmark Period Mean (intersection) [W m-2] |
Model Period Mean (complement) [W m-2] |
Benchmark Period Mean (complement) [W m-2] |
Bias [W m-2] |
RMSE [W m-2] |
Phase Shift [months] |
Bias Score [1] |
RMSE Score [1] |
Seasonal Cycle Score [1] |
Spatial Distribution Score [1] |
Overall Score [1] |
|||
|---|---|---|---|---|---|---|---|---|---|---|---|---|---|---|---|---|
| Benchmark | [-] | 304. | ||||||||||||||
| CESM3_092H | [-] | 303. | 302. | 303. | 349. | 5.27 | 23.2 | 0.691 | 0.439 | 0.570 | 0.946 | 0.987 | 0.702 | |||
| CESM3_098bH | [-] | 300. | 300. | 303. | 348. | 2.81 | 22.5 | 0.698 | 0.439 | 0.602 | 0.946 | 0.982 | 0.714 | |||
| CMIP6_001 | [-] | 301. | 301. | 299. | 344. | 6.22 | 20.9 | 0.609 | 0.477 | 0.620 | 0.959 | 0.997 | 0.735 | |||
| LE2_001 | [-] | 302. | 301. | 299. | 344. | 6.98 | 21.0 | 0.514 | 0.473 | 0.620 | 0.964 | 0.996 | 0.735 |
Temporally integrated period mean