Mean State
Download Data |
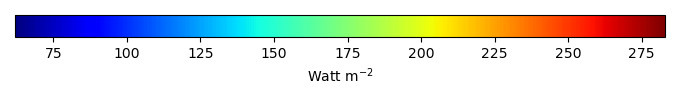
Period Mean (original grids) [Watt m-2] |
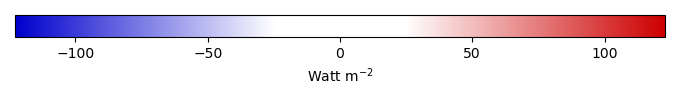
Bias [Watt m-2] |
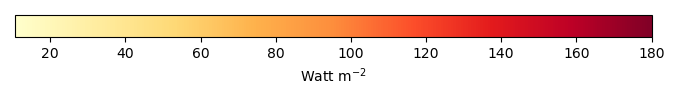
RMSE [Watt m-2] |
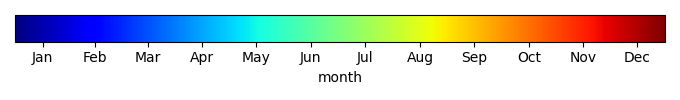
Phase Shift [months] |
Bias Score [1] |
RMSE Score [1] |
Seasonal Cycle Score [1] |
Overall Score [1] |
|||
|---|---|---|---|---|---|---|---|---|---|---|---|
| Benchmark | [-] | 199. | |||||||||
| CESM3_092H | [-] | 206. | 7.56 | 32.6 | 0.983 | 0.759 | 0.319 | 0.937 | 0.584 | ||
| CESM3_098bH | [-] | 188. | -10.3 | 28.9 | 0.983 | 0.687 | 0.370 | 0.937 | 0.591 | ||
| CMIP6_001 | [-] | 213. | 14.5 | 34.5 | 0.983 | 0.590 | 0.328 | 0.937 | 0.546 | ||
| LE2_001 | [-] | 212. | 13.0 | 34.9 | 0.983 | 0.623 | 0.313 | 0.937 | 0.546 |
Download Data |
Period Mean (original grids) [Watt m-2] |
Bias [Watt m-2] |
RMSE [Watt m-2] |
Phase Shift [months] |
Bias Score [1] |
RMSE Score [1] |
Seasonal Cycle Score [1] |
Overall Score [1] |
|||
|---|---|---|---|---|---|---|---|---|---|---|---|
| Benchmark | [-] | 242. | |||||||||
| CESM3_092H | [-] | 249. | 6.68 | 19.7 | 0.00 | 0.909 | 0.775 | 1.00 | 0.865 | ||
| CESM3_098bH | [-] | 249. | 6.99 | 24.2 | 0.00 | 0.905 | 0.732 | 1.00 | 0.842 | ||
| CMIP6_001 | [-] | 228. | -14.1 | 20.4 | 0.00 | 0.817 | 0.759 | 1.00 | 0.834 | ||
| LE2_001 | [-] | 228. | -14.2 | 23.7 | 0.00 | 0.817 | 0.726 | 1.00 | 0.817 |
Download Data |
Period Mean (original grids) [Watt m-2] |
Bias [Watt m-2] |
RMSE [Watt m-2] |
Phase Shift [months] |
Bias Score [1] |
RMSE Score [1] |
Seasonal Cycle Score [1] |
Overall Score [1] |
|||
|---|---|---|---|---|---|---|---|---|---|---|---|
| Benchmark | [-] | 105. | |||||||||
| CESM3_092H | [-] | 87.3 | -17.9 | 22.1 | 0.00 | 0.804 | 0.725 | 1.00 | 0.814 | ||
| CESM3_098bH | [-] | 84.1 | -21.2 | 29.2 | 1.02 | 0.773 | 0.725 | 0.933 | 0.789 | ||
| CMIP6_001 | [-] | 80.3 | -24.9 | 24.4 | 0.00 | 0.739 | 0.754 | 1.00 | 0.812 | ||
| LE2_001 | [-] | 78.7 | -26.5 | 25.3 | 0.00 | 0.725 | 0.782 | 1.00 | 0.822 |
Download Data |
Period Mean (original grids) [Watt m-2] |
Bias [Watt m-2] |
RMSE [Watt m-2] |
Phase Shift [months] |
Bias Score [1] |
RMSE Score [1] |
Seasonal Cycle Score [1] |
Overall Score [1] |
|||
|---|---|---|---|---|---|---|---|---|---|---|---|
| Benchmark | [-] | 153. | |||||||||
| CESM3_092H | [-] | 174. | 21.8 | 31.1 | 1.02 | 0.496 | 0.647 | 0.932 | 0.680 | ||
| CESM3_098bH | [-] | 170. | 17.7 | 31.3 | 1.02 | 0.537 | 0.610 | 0.932 | 0.672 | ||
| CMIP6_001 | [-] | 170. | 15.9 | 33.4 | 0.339 | 0.564 | 0.587 | 0.978 | 0.679 | ||
| LE2_001 | [-] | 170. | 16.2 | 33.0 | 0.683 | 0.561 | 0.604 | 0.954 | 0.681 |
Download Data |
Period Mean (original grids) [Watt m-2] |
Bias [Watt m-2] |
RMSE [Watt m-2] |
Phase Shift [months] |
Bias Score [1] |
RMSE Score [1] |
Seasonal Cycle Score [1] |
Overall Score [1] |
|||
|---|---|---|---|---|---|---|---|---|---|---|---|
| Benchmark | [-] | 222. | |||||||||
| CESM3_092H | [-] | 222. | -0.324 | 38.4 | 0.517 | 0.761 | 0.495 | 0.965 | 0.679 | ||
| CESM3_098bH | [-] | 220. | -1.79 | 36.2 | 0.258 | 0.757 | 0.518 | 0.983 | 0.694 | ||
| CMIP6_001 | [-] | 218. | -4.16 | 37.5 | 0.00 | 0.770 | 0.493 | 1.00 | 0.689 | ||
| LE2_001 | [-] | 221. | -1.41 | 37.3 | 0.258 | 0.790 | 0.495 | 0.983 | 0.691 |
Download Data |
Period Mean (original grids) [Watt m-2] |
Bias [Watt m-2] |
RMSE [Watt m-2] |
Phase Shift [months] |
Bias Score [1] |
RMSE Score [1] |
Seasonal Cycle Score [1] |
Overall Score [1] |
|||
|---|---|---|---|---|---|---|---|---|---|---|---|
| Benchmark | [-] | 135. | |||||||||
| CESM3_092H | [-] | 153. | 17.5 | 35.0 | 0.127 | 0.799 | 0.694 | 0.992 | 0.794 | ||
| CESM3_098bH | [-] | 150. | 14.6 | 33.5 | 0.254 | 0.815 | 0.692 | 0.983 | 0.795 | ||
| CMIP6_001 | [-] | 145. | 9.52 | 31.1 | 0.381 | 0.851 | 0.705 | 0.975 | 0.809 | ||
| LE2_001 | [-] | 146. | 10.4 | 30.9 | 0.254 | 0.844 | 0.709 | 0.983 | 0.811 |
Download Data |
Period Mean (original grids) [Watt m-2] |
Bias [Watt m-2] |
RMSE [Watt m-2] |
Phase Shift [months] |
Bias Score [1] |
RMSE Score [1] |
Seasonal Cycle Score [1] |
Overall Score [1] |
|||
|---|---|---|---|---|---|---|---|---|---|---|---|
| Benchmark | [-] | 177. | |||||||||
| CESM3_092H | [-] | 189. | 13.2 | 39.2 | 0.621 | 0.637 | 0.631 | 0.929 | 0.707 | ||
| CESM3_098bH | [-] | 187. | 10.6 | 37.5 | 0.572 | 0.648 | 0.622 | 0.933 | 0.706 | ||
| CMIP6_001 | [-] | 182. | 5.24 | 36.8 | 0.520 | 0.683 | 0.627 | 0.929 | 0.716 | ||
| LE2_001 | [-] | 182. | 5.57 | 35.1 | 0.646 | 0.681 | 0.616 | 0.923 | 0.709 |
Download Data |
Period Mean (original grids) [Watt m-2] |
Bias [Watt m-2] |
RMSE [Watt m-2] |
Phase Shift [months] |
Bias Score [1] |
RMSE Score [1] |
Seasonal Cycle Score [1] |
Overall Score [1] |
|||
|---|---|---|---|---|---|---|---|---|---|---|---|
| Benchmark | [-] | 249. | |||||||||
| CESM3_092H | [-] | 273. | 18.4 | 26.4 | 0.508 | 0.504 | 0.756 | 0.966 | 0.746 | ||
| CESM3_098bH | [-] | 266. | 14.1 | 22.9 | 0.00 | 0.539 | 0.758 | 1.00 | 0.764 | ||
| CMIP6_001 | [-] | 268. | 10.9 | 21.8 | 0.508 | 0.569 | 0.750 | 0.966 | 0.759 | ||
| LE2_001 | [-] | 267. | 10.5 | 22.1 | 1.02 | 0.574 | 0.753 | 0.933 | 0.753 |
Download Data |
Period Mean (original grids) [Watt m-2] |
Bias [Watt m-2] |
RMSE [Watt m-2] |
Phase Shift [months] |
Bias Score [1] |
RMSE Score [1] |
Seasonal Cycle Score [1] |
Overall Score [1] |
|||
|---|---|---|---|---|---|---|---|---|---|---|---|
| Benchmark | [-] | 151. | |||||||||
| CESM3_092H | [-] | 88.1 | -63.2 | 21.9 | 1.02 | 0.481 | 0.400 | 0.933 | 0.554 | ||
| CESM3_098bH | [-] | 87.2 | -64.1 | 22.5 | 1.02 | 0.480 | 0.386 | 0.933 | 0.546 | ||
| CMIP6_001 | [-] | 90.3 | -61.0 | 13.3 | 0.00 | 0.489 | 0.442 | 1.00 | 0.593 | ||
| LE2_001 | [-] | 88.9 | -62.4 | 21.4 | 0.508 | 0.497 | 0.441 | 0.966 | 0.586 |
Download Data |
Period Mean (original grids) [Watt m-2] |
Bias [Watt m-2] |
RMSE [Watt m-2] |
Phase Shift [months] |
Bias Score [1] |
RMSE Score [1] |
Seasonal Cycle Score [1] |
Overall Score [1] |
|||
|---|---|---|---|---|---|---|---|---|---|---|---|
| Benchmark | [-] | 187. | |||||||||
| CESM3_092H | [-] | 209. | 21.8 | 43.0 | 0.436 | 0.682 | 0.694 | 0.971 | 0.760 | ||
| CESM3_098bH | [-] | 204. | 17.4 | 41.2 | 0.00 | 0.711 | 0.690 | 1.00 | 0.773 | ||
| CMIP6_001 | [-] | 193. | 6.52 | 36.7 | 0.00 | 0.803 | 0.686 | 1.00 | 0.794 | ||
| LE2_001 | [-] | 193. | 6.51 | 37.5 | 0.145 | 0.797 | 0.682 | 0.990 | 0.788 |
Download Data |
Period Mean (original grids) [Watt m-2] |
Bias [Watt m-2] |
RMSE [Watt m-2] |
Phase Shift [months] |
Bias Score [1] |
RMSE Score [1] |
Seasonal Cycle Score [1] |
Overall Score [1] |
|||
|---|---|---|---|---|---|---|---|---|---|---|---|
| Benchmark | [-] | 162. | |||||||||
| CESM3_092H | [-] | 182. | 20.5 | 30.9 | 0.00 | 0.775 | 0.763 | 1.00 | 0.825 | ||
| CESM3_098bH | [-] | 182. | 20.0 | 30.8 | 0.00 | 0.780 | 0.751 | 1.00 | 0.820 | ||
| CMIP6_001 | [-] | 170. | 8.54 | 24.3 | 0.00 | 0.899 | 0.762 | 1.00 | 0.856 | ||
| LE2_001 | [-] | 170. | 8.27 | 23.5 | 0.00 | 0.902 | 0.765 | 1.00 | 0.858 |
Download Data |
Period Mean (original grids) [Watt m-2] |
Bias [Watt m-2] |
RMSE [Watt m-2] |
Phase Shift [months] |
Bias Score [1] |
RMSE Score [1] |
Seasonal Cycle Score [1] |
Overall Score [1] |
|||
|---|---|---|---|---|---|---|---|---|---|---|---|
| Benchmark | [-] | 193. | |||||||||
| CESM3_092H | [-] | 218. | 24.9 | 33.3 | 0.00 | 0.718 | 0.766 | 1.00 | 0.812 | ||
| CESM3_098bH | [-] | 214. | 20.7 | 29.4 | 0.00 | 0.760 | 0.764 | 1.00 | 0.822 | ||
| CMIP6_001 | [-] | 212. | 19.2 | 30.0 | 0.00 | 0.772 | 0.748 | 1.00 | 0.817 | ||
| LE2_001 | [-] | 210. | 17.4 | 27.8 | 0.508 | 0.791 | 0.756 | 0.966 | 0.818 |
Download Data |
Period Mean (original grids) [Watt m-2] |
Bias [Watt m-2] |
RMSE [Watt m-2] |
Phase Shift [months] |
Bias Score [1] |
RMSE Score [1] |
Seasonal Cycle Score [1] |
Overall Score [1] |
|||
|---|---|---|---|---|---|---|---|---|---|---|---|
| Benchmark | [-] | 195. | |||||||||
| CESM3_092H | [-] | 225. | 29.9 | 23.6 | 4.08 | 0.115 | 0.491 | 0.244 | 0.335 | ||
| CESM3_098bH | [-] | 225. | 29.5 | 12.8 | 4.08 | 0.117 | 0.255 | 0.244 | 0.218 | ||
| CMIP6_001 | [-] | 223. | 27.2 | 27.8 | 4.08 | 0.138 | 0.795 | 0.244 | 0.493 | ||
| LE2_001 | [-] | 225. | 29.9 | 36.1 | 4.08 | 0.114 | 0.0926 | 0.244 | 0.136 |
Download Data |
Period Mean (original grids) [Watt m-2] |
Bias [Watt m-2] |
RMSE [Watt m-2] |
Phase Shift [months] |
Bias Score [1] |
RMSE Score [1] |
Seasonal Cycle Score [1] |
Overall Score [1] |
|||
|---|---|---|---|---|---|---|---|---|---|---|---|
| Benchmark | [-] | 208. | |||||||||
| CESM3_092H | [-] | 223. | 14.9 | 33.8 | 1.78 | 0.701 | 0.539 | 0.703 | 0.620 | ||
| CESM3_098bH | [-] | 226. | 17.9 | 38.3 | 2.04 | 0.659 | 0.531 | 0.686 | 0.602 | ||
| CMIP6_001 | [-] | 212. | 3.81 | 36.7 | 2.54 | 0.773 | 0.454 | 0.578 | 0.565 | ||
| LE2_001 | [-] | 214. | 5.45 | 35.6 | 2.29 | 0.732 | 0.494 | 0.623 | 0.586 |
Temporally integrated period mean