Mean State
Download Data |
Period Mean (original grids) [mm d-1] |
Model Period Mean (intersection) [mm d-1] |
Benchmark Period Mean (intersection) [mm d-1] |
Model Period Mean (complement) [mm d-1] |
Benchmark Period Mean (complement) [mm d-1] |
Bias [mm d-1] |
RMSE [mm d-1] |
Phase Shift [months] |
Bias Score [1] |
RMSE Score [1] |
Seasonal Cycle Score [1] |
Spatial Distribution Score [1] |
Overall Score [1] |
|||
|---|---|---|---|---|---|---|---|---|---|---|---|---|---|---|---|---|
| Benchmark | [-] | 1.02 | ||||||||||||||
| CESM3_092H | [-] | 1.45 | 1.43 | 1.02 | 2.38 | 0.446 | 1.08 | 1.94 | 0.345 | 0.488 | 0.698 | 0.875 | 0.579 | |||
| CESM3_098bH | [-] | 1.51 | 1.49 | 1.02 | 2.58 | 0.514 | 1.08 | 1.93 | 0.343 | 0.512 | 0.701 | 0.846 | 0.583 | |||
| CMIP6_001 | [-] | 1.60 | 1.61 | 1.02 | 1.62 | 1.05 | 0.590 | 1.13 | 2.05 | 0.389 | 0.519 | 0.687 | 0.904 | 0.604 | ||
| LE2_001 | [-] | 1.68 | 1.68 | 1.02 | 1.61 | 1.05 | 0.661 | 1.18 | 2.07 | 0.337 | 0.500 | 0.680 | 0.899 | 0.583 |
Download Data |
Period Mean (original grids) [mm d-1] |
Model Period Mean (intersection) [mm d-1] |
Benchmark Period Mean (intersection) [mm d-1] |
Model Period Mean (complement) [mm d-1] |
Benchmark Period Mean (complement) [mm d-1] |
Bias [mm d-1] |
RMSE [mm d-1] |
Phase Shift [months] |
Bias Score [1] |
RMSE Score [1] |
Seasonal Cycle Score [1] |
Spatial Distribution Score [1] |
Overall Score [1] |
|||
|---|---|---|---|---|---|---|---|---|---|---|---|---|---|---|---|---|
| Benchmark | [-] | 0.410 | ||||||||||||||
| CESM3_092H | [-] | 1.73 | 1.72 | 0.410 | 2.06 | 1.31 | 1.70 | 1.00 | 0.0615 | 0.252 | 0.885 | 0.559 | 0.402 | |||
| CESM3_098bH | [-] | 1.82 | 1.81 | 0.410 | 2.16 | 1.40 | 1.78 | 1.02 | 0.0519 | 0.238 | 0.882 | 0.547 | 0.392 | |||
| CMIP6_001 | [-] | 0.879 | 0.862 | 0.409 | 0.928 | 3.13 | 0.446 | 0.812 | 0.931 | 0.355 | 0.436 | 0.891 | 0.724 | 0.568 | ||
| LE2_001 | [-] | 0.919 | 0.901 | 0.409 | 0.932 | 3.13 | 0.485 | 0.853 | 0.989 | 0.333 | 0.425 | 0.887 | 0.705 | 0.555 |
Download Data |
Period Mean (original grids) [mm d-1] |
Model Period Mean (intersection) [mm d-1] |
Benchmark Period Mean (intersection) [mm d-1] |
Model Period Mean (complement) [mm d-1] |
Benchmark Period Mean (complement) [mm d-1] |
Bias [mm d-1] |
RMSE [mm d-1] |
Phase Shift [months] |
Bias Score [1] |
RMSE Score [1] |
Seasonal Cycle Score [1] |
Spatial Distribution Score [1] |
Overall Score [1] |
|||
|---|---|---|---|---|---|---|---|---|---|---|---|---|---|---|---|---|
| Benchmark | [-] | 0.407 | ||||||||||||||
| CESM3_092H | [-] | 1.08 | 1.09 | 0.407 | 0.963 | 0.672 | 1.02 | 1.30 | 0.244 | 0.482 | 0.820 | 0.756 | 0.557 | |||
| CESM3_098bH | [-] | 1.07 | 1.08 | 0.407 | 0.957 | 0.662 | 0.993 | 1.31 | 0.248 | 0.499 | 0.822 | 0.763 | 0.566 | |||
| CMIP6_001 | [-] | 0.879 | 0.892 | 0.406 | 0.585 | 0.696 | 0.476 | 0.908 | 1.34 | 0.327 | 0.501 | 0.818 | 0.831 | 0.596 | ||
| LE2_001 | [-] | 0.925 | 0.939 | 0.406 | 0.628 | 0.696 | 0.522 | 0.965 | 1.41 | 0.310 | 0.485 | 0.808 | 0.813 | 0.580 |
Download Data |
Period Mean (original grids) [mm d-1] |
Model Period Mean (intersection) [mm d-1] |
Benchmark Period Mean (intersection) [mm d-1] |
Model Period Mean (complement) [mm d-1] |
Benchmark Period Mean (complement) [mm d-1] |
Bias [mm d-1] |
RMSE [mm d-1] |
Phase Shift [months] |
Bias Score [1] |
RMSE Score [1] |
Seasonal Cycle Score [1] |
Spatial Distribution Score [1] |
Overall Score [1] |
|||
|---|---|---|---|---|---|---|---|---|---|---|---|---|---|---|---|---|
| Benchmark | [-] | 0.970 | ||||||||||||||
| CESM3_092H | [-] | 1.15 | 1.12 | 0.970 | 1.30 | 0.168 | 1.54 | 0.910 | 0.284 | 0.201 | 0.919 | 0.821 | 0.485 | |||
| CESM3_098bH | [-] | 1.15 | 1.13 | 0.970 | 1.30 | 0.175 | 1.55 | 0.931 | 0.263 | 0.202 | 0.916 | 0.793 | 0.475 | |||
| CMIP6_001 | [-] | 0.973 | 0.932 | 0.968 | 1.27 | 2.16 | -0.0193 | 1.31 | 0.666 | 0.386 | 0.267 | 0.943 | 0.771 | 0.527 | ||
| LE2_001 | [-] | 1.03 | 0.987 | 0.968 | 1.39 | 2.16 | 0.0355 | 1.36 | 0.631 | 0.349 | 0.237 | 0.946 | 0.805 | 0.515 |
Download Data |
Period Mean (original grids) [mm d-1] |
Model Period Mean (intersection) [mm d-1] |
Benchmark Period Mean (intersection) [mm d-1] |
Model Period Mean (complement) [mm d-1] |
Benchmark Period Mean (complement) [mm d-1] |
Bias [mm d-1] |
RMSE [mm d-1] |
Phase Shift [months] |
Bias Score [1] |
RMSE Score [1] |
Seasonal Cycle Score [1] |
Spatial Distribution Score [1] |
Overall Score [1] |
|||
|---|---|---|---|---|---|---|---|---|---|---|---|---|---|---|---|---|
| Benchmark | [-] | 2.63 | ||||||||||||||
| CESM3_092H | [-] | 5.12 | 5.53 | 2.63 | 4.30 | 1.57 | 2.71 | 3.40 | 1.53 | 0.241 | 0.574 | 0.778 | 0.849 | 0.603 | ||
| CESM3_098bH | [-] | 5.37 | 5.84 | 2.63 | 4.42 | 1.57 | 2.99 | 3.66 | 1.53 | 0.223 | 0.575 | 0.772 | 0.769 | 0.583 | ||
| CMIP6_001 | [-] | 6.45 | 7.08 | 2.64 | 4.98 | 1.86 | 4.12 | 4.76 | 1.68 | 0.131 | 0.508 | 0.753 | 0.570 | 0.494 | ||
| LE2_001 | [-] | 6.12 | 6.74 | 2.64 | 4.68 | 1.86 | 3.79 | 4.52 | 1.71 | 0.145 | 0.509 | 0.748 | 0.558 | 0.494 |
Download Data |
Period Mean (original grids) [mm d-1] |
Model Period Mean (intersection) [mm d-1] |
Benchmark Period Mean (intersection) [mm d-1] |
Model Period Mean (complement) [mm d-1] |
Benchmark Period Mean (complement) [mm d-1] |
Bias [mm d-1] |
RMSE [mm d-1] |
Phase Shift [months] |
Bias Score [1] |
RMSE Score [1] |
Seasonal Cycle Score [1] |
Spatial Distribution Score [1] |
Overall Score [1] |
|||
|---|---|---|---|---|---|---|---|---|---|---|---|---|---|---|---|---|
| Benchmark | [-] | 0.789 | ||||||||||||||
| CESM3_092H | [-] | 0.724 | 0.721 | 0.789 | 1.08 | -0.0636 | 0.736 | 1.00 | 0.493 | 0.541 | 0.883 | 0.917 | 0.675 | |||
| CESM3_098bH | [-] | 0.751 | 0.747 | 0.789 | 1.13 | -0.0372 | 0.763 | 1.05 | 0.487 | 0.522 | 0.882 | 0.920 | 0.666 | |||
| CMIP6_001 | [-] | 0.647 | 0.641 | 0.789 | 0.992 | 1.06 | -0.144 | 0.667 | 0.719 | 0.489 | 0.594 | 0.914 | 0.890 | 0.696 | ||
| LE2_001 | [-] | 0.626 | 0.619 | 0.789 | 1.02 | 1.06 | -0.166 | 0.677 | 0.741 | 0.474 | 0.593 | 0.912 | 0.899 | 0.694 |
Download Data |
Period Mean (original grids) [mm d-1] |
Model Period Mean (intersection) [mm d-1] |
Benchmark Period Mean (intersection) [mm d-1] |
Model Period Mean (complement) [mm d-1] |
Benchmark Period Mean (complement) [mm d-1] |
Bias [mm d-1] |
RMSE [mm d-1] |
Phase Shift [months] |
Bias Score [1] |
RMSE Score [1] |
Seasonal Cycle Score [1] |
Spatial Distribution Score [1] |
Overall Score [1] |
|||
|---|---|---|---|---|---|---|---|---|---|---|---|---|---|---|---|---|
| Benchmark | [-] | 0.522 | ||||||||||||||
| CESM3_092H | [-] | 0.770 | 0.798 | 0.522 | 0.644 | 0.296 | 0.733 | 1.32 | 0.425 | 0.539 | 0.833 | 0.719 | 0.611 | |||
| CESM3_098bH | [-] | 0.730 | 0.758 | 0.522 | 0.636 | 0.257 | 0.700 | 1.35 | 0.428 | 0.542 | 0.829 | 0.741 | 0.616 | |||
| CMIP6_001 | [-] | 0.683 | 0.697 | 0.522 | 0.811 | 1.99 | 0.190 | 0.673 | 1.15 | 0.427 | 0.533 | 0.846 | 0.736 | 0.615 | ||
| LE2_001 | [-] | 0.704 | 0.720 | 0.522 | 0.793 | 1.99 | 0.213 | 0.690 | 1.25 | 0.419 | 0.527 | 0.832 | 0.725 | 0.606 |
Download Data |
Period Mean (original grids) [mm d-1] |
Model Period Mean (intersection) [mm d-1] |
Benchmark Period Mean (intersection) [mm d-1] |
Model Period Mean (complement) [mm d-1] |
Benchmark Period Mean (complement) [mm d-1] |
Bias [mm d-1] |
RMSE [mm d-1] |
Phase Shift [months] |
Bias Score [1] |
RMSE Score [1] |
Seasonal Cycle Score [1] |
Spatial Distribution Score [1] |
Overall Score [1] |
|||
|---|---|---|---|---|---|---|---|---|---|---|---|---|---|---|---|---|
| Benchmark | [-] | 1.39 | ||||||||||||||
| CESM3_092H | [-] | 1.99 | 1.87 | 1.39 | 2.67 | 0.510 | 1.71 | 1.17 | 0.378 | 0.396 | 0.859 | 0.904 | 0.587 | |||
| CESM3_098bH | [-] | 2.15 | 2.00 | 1.39 | 3.03 | 0.651 | 1.80 | 1.13 | 0.354 | 0.388 | 0.864 | 0.898 | 0.579 | |||
| CMIP6_001 | [-] | 1.73 | 1.60 | 1.39 | 2.55 | 1.89 | 0.252 | 1.83 | 1.06 | 0.369 | 0.319 | 0.875 | 0.868 | 0.550 | ||
| LE2_001 | [-] | 1.79 | 1.65 | 1.39 | 2.64 | 1.89 | 0.301 | 1.88 | 1.06 | 0.357 | 0.311 | 0.875 | 0.863 | 0.544 |
Download Data |
Period Mean (original grids) [mm d-1] |
Model Period Mean (intersection) [mm d-1] |
Benchmark Period Mean (intersection) [mm d-1] |
Model Period Mean (complement) [mm d-1] |
Benchmark Period Mean (complement) [mm d-1] |
Bias [mm d-1] |
RMSE [mm d-1] |
Phase Shift [months] |
Bias Score [1] |
RMSE Score [1] |
Seasonal Cycle Score [1] |
Spatial Distribution Score [1] |
Overall Score [1] |
|||
|---|---|---|---|---|---|---|---|---|---|---|---|---|---|---|---|---|
| Benchmark | [-] | 1.09 | ||||||||||||||
| CESM3_092H | [-] | 0.829 | 0.822 | 1.09 | 0.869 | -0.261 | 1.45 | 0.740 | 0.390 | 0.261 | 0.944 | 0.594 | 0.490 | |||
| CESM3_098bH | [-] | 0.833 | 0.832 | 1.09 | 0.838 | -0.251 | 1.47 | 0.794 | 0.392 | 0.254 | 0.936 | 0.531 | 0.473 | |||
| CMIP6_001 | [-] | 0.932 | 0.917 | 1.09 | 1.01 | 0.971 | -0.167 | 1.26 | 0.421 | 0.388 | 0.308 | 0.971 | 0.750 | 0.545 | ||
| LE2_001 | [-] | 0.914 | 0.893 | 1.09 | 1.03 | 0.971 | -0.192 | 1.18 | 0.395 | 0.402 | 0.335 | 0.973 | 0.754 | 0.560 |
Download Data |
Period Mean (original grids) [mm d-1] |
Model Period Mean (intersection) [mm d-1] |
Benchmark Period Mean (intersection) [mm d-1] |
Model Period Mean (complement) [mm d-1] |
Benchmark Period Mean (complement) [mm d-1] |
Bias [mm d-1] |
RMSE [mm d-1] |
Phase Shift [months] |
Bias Score [1] |
RMSE Score [1] |
Seasonal Cycle Score [1] |
Spatial Distribution Score [1] |
Overall Score [1] |
|||
|---|---|---|---|---|---|---|---|---|---|---|---|---|---|---|---|---|
| Benchmark | [-] | 0.232 | ||||||||||||||
| CESM3_092H | [-] | 0.524 | 0.492 | 0.232 | 0.897 | 0.285 | 0.503 | 1.57 | 0.151 | 0.544 | 0.784 | 0.617 | 0.528 | |||
| CESM3_098bH | [-] | 0.452 | 0.417 | 0.232 | 0.859 | 0.212 | 0.428 | 1.47 | 0.200 | 0.574 | 0.796 | 0.610 | 0.551 | |||
| CMIP6_001 | [-] | 0.365 | 0.347 | 0.229 | 0.575 | 1.40 | 0.138 | 0.342 | 1.38 | 0.214 | 0.634 | 0.821 | 0.660 | 0.593 | ||
| LE2_001 | [-] | 0.343 | 0.325 | 0.229 | 0.556 | 1.40 | 0.115 | 0.332 | 1.45 | 0.235 | 0.612 | 0.811 | 0.655 | 0.585 |
Download Data |
Period Mean (original grids) [mm d-1] |
Model Period Mean (intersection) [mm d-1] |
Benchmark Period Mean (intersection) [mm d-1] |
Model Period Mean (complement) [mm d-1] |
Benchmark Period Mean (complement) [mm d-1] |
Bias [mm d-1] |
RMSE [mm d-1] |
Phase Shift [months] |
Bias Score [1] |
RMSE Score [1] |
Seasonal Cycle Score [1] |
Spatial Distribution Score [1] |
Overall Score [1] |
|||
|---|---|---|---|---|---|---|---|---|---|---|---|---|---|---|---|---|
| Benchmark | [-] | 0.925 | ||||||||||||||
| CESM3_092H | [-] | 1.10 | 1.09 | 0.925 | 1.17 | 0.159 | 0.689 | 1.80 | 0.330 | 0.569 | 0.746 | 0.912 | 0.625 | |||
| CESM3_098bH | [-] | 1.14 | 1.14 | 0.925 | 1.22 | 0.208 | 0.714 | 1.84 | 0.310 | 0.564 | 0.739 | 0.922 | 0.620 | |||
| CMIP6_001 | [-] | 0.915 | 0.869 | 0.925 | 1.23 | 1.06 | -0.0687 | 0.671 | 1.74 | 0.434 | 0.553 | 0.750 | 0.949 | 0.647 | ||
| LE2_001 | [-] | 0.917 | 0.865 | 0.925 | 1.27 | 1.06 | -0.0725 | 0.678 | 1.73 | 0.438 | 0.555 | 0.752 | 0.946 | 0.649 |
Download Data |
Period Mean (original grids) [mm d-1] |
Model Period Mean (intersection) [mm d-1] |
Benchmark Period Mean (intersection) [mm d-1] |
Model Period Mean (complement) [mm d-1] |
Benchmark Period Mean (complement) [mm d-1] |
Bias [mm d-1] |
RMSE [mm d-1] |
Phase Shift [months] |
Bias Score [1] |
RMSE Score [1] |
Seasonal Cycle Score [1] |
Spatial Distribution Score [1] |
Overall Score [1] |
|||
|---|---|---|---|---|---|---|---|---|---|---|---|---|---|---|---|---|
| Benchmark | [-] | 0.818 | ||||||||||||||
| CESM3_092H | [-] | 0.997 | 1.06 | 0.818 | 0.687 | 1.57 | 0.264 | 1.08 | 1.40 | 0.364 | 0.499 | 0.813 | 0.836 | 0.602 | ||
| CESM3_098bH | [-] | 0.994 | 1.05 | 0.818 | 0.711 | 1.57 | 0.256 | 1.08 | 1.40 | 0.362 | 0.502 | 0.812 | 0.833 | 0.602 | ||
| CMIP6_001 | [-] | 0.900 | 0.964 | 0.817 | 0.581 | 1.14 | 0.166 | 0.958 | 1.35 | 0.423 | 0.526 | 0.815 | 0.853 | 0.629 | ||
| LE2_001 | [-] | 0.898 | 0.965 | 0.817 | 0.563 | 1.14 | 0.166 | 0.966 | 1.36 | 0.417 | 0.520 | 0.815 | 0.855 | 0.625 |
Download Data |
Period Mean (original grids) [mm d-1] |
Model Period Mean (intersection) [mm d-1] |
Benchmark Period Mean (intersection) [mm d-1] |
Model Period Mean (complement) [mm d-1] |
Benchmark Period Mean (complement) [mm d-1] |
Bias [mm d-1] |
RMSE [mm d-1] |
Phase Shift [months] |
Bias Score [1] |
RMSE Score [1] |
Seasonal Cycle Score [1] |
Spatial Distribution Score [1] |
Overall Score [1] |
|||
|---|---|---|---|---|---|---|---|---|---|---|---|---|---|---|---|---|
| Benchmark | [-] | 0.0614 | ||||||||||||||
| CESM3_092H | [-] | 0.0629 | 0.0638 | 0.0614 | 0.00288 | 0.00360 | 0.101 | 2.09 | 0.619 | 0.681 | 0.684 | 0.840 | 0.701 | |||
| CESM3_098bH | [-] | 0.0687 | 0.0698 | 0.0614 | 0.0113 | 0.00944 | 0.106 | 2.15 | 0.591 | 0.672 | 0.670 | 0.838 | 0.689 | |||
| CMIP6_001 | [-] | 0.0329 | 0.0348 | 0.0612 | -0.0473 | 0.165 | -0.0263 | 0.101 | 2.28 | 0.692 | 0.723 | 0.644 | 0.822 | 0.721 | ||
| LE2_001 | [-] | 0.0347 | 0.0368 | 0.0612 | -0.0476 | 0.165 | -0.0242 | 0.103 | 2.25 | 0.690 | 0.719 | 0.652 | 0.825 | 0.721 |
Download Data |
Period Mean (original grids) [mm d-1] |
Model Period Mean (intersection) [mm d-1] |
Benchmark Period Mean (intersection) [mm d-1] |
Model Period Mean (complement) [mm d-1] |
Benchmark Period Mean (complement) [mm d-1] |
Bias [mm d-1] |
RMSE [mm d-1] |
Phase Shift [months] |
Bias Score [1] |
RMSE Score [1] |
Seasonal Cycle Score [1] |
Spatial Distribution Score [1] |
Overall Score [1] |
|||
|---|---|---|---|---|---|---|---|---|---|---|---|---|---|---|---|---|
| Benchmark | [-] | 0.944 | ||||||||||||||
| CESM3_092H | [-] | 1.15 | 1.23 | 0.944 | 0.886 | 0.283 | 1.27 | 0.934 | 0.334 | 0.326 | 0.907 | 0.907 | 0.560 | |||
| CESM3_098bH | [-] | 1.15 | 1.22 | 0.944 | 0.893 | 0.282 | 1.30 | 1.00 | 0.346 | 0.306 | 0.900 | 0.907 | 0.553 | |||
| CMIP6_001 | [-] | 1.07 | 1.11 | 0.944 | 0.927 | 1.65 | 0.194 | 1.16 | 0.745 | 0.383 | 0.339 | 0.922 | 0.937 | 0.584 | ||
| LE2_001 | [-] | 1.07 | 1.11 | 0.944 | 0.934 | 1.65 | 0.194 | 1.17 | 0.779 | 0.362 | 0.347 | 0.917 | 0.935 | 0.582 |
Download Data |
Period Mean (original grids) [mm d-1] |
Model Period Mean (intersection) [mm d-1] |
Benchmark Period Mean (intersection) [mm d-1] |
Model Period Mean (complement) [mm d-1] |
Benchmark Period Mean (complement) [mm d-1] |
Bias [mm d-1] |
RMSE [mm d-1] |
Phase Shift [months] |
Bias Score [1] |
RMSE Score [1] |
Seasonal Cycle Score [1] |
Spatial Distribution Score [1] |
Overall Score [1] |
|||
|---|---|---|---|---|---|---|---|---|---|---|---|---|---|---|---|---|
| Benchmark | [-] | 0.988 | ||||||||||||||
| CESM3_092H | [-] | 1.53 | 1.48 | 0.988 | 1.59 | 0.531 | 1.67 | 1.17 | 0.215 | 0.359 | 0.849 | 0.822 | 0.521 | |||
| CESM3_098bH | [-] | 1.41 | 1.40 | 0.988 | 1.34 | 0.430 | 1.67 | 1.30 | 0.208 | 0.363 | 0.828 | 0.804 | 0.513 | |||
| CMIP6_001 | [-] | 0.930 | 0.863 | 0.989 | 1.14 | 0.916 | -0.105 | 1.12 | 1.48 | 0.308 | 0.487 | 0.791 | 0.860 | 0.586 | ||
| LE2_001 | [-] | 0.964 | 0.894 | 0.989 | 1.19 | 0.916 | -0.0733 | 1.13 | 1.53 | 0.312 | 0.492 | 0.789 | 0.875 | 0.592 |
Download Data |
Period Mean (original grids) [mm d-1] |
Model Period Mean (intersection) [mm d-1] |
Benchmark Period Mean (intersection) [mm d-1] |
Model Period Mean (complement) [mm d-1] |
Benchmark Period Mean (complement) [mm d-1] |
Bias [mm d-1] |
RMSE [mm d-1] |
Phase Shift [months] |
Bias Score [1] |
RMSE Score [1] |
Seasonal Cycle Score [1] |
Spatial Distribution Score [1] |
Overall Score [1] |
|||
|---|---|---|---|---|---|---|---|---|---|---|---|---|---|---|---|---|
| Benchmark | [-] | 0.867 | ||||||||||||||
| CESM3_092H | [-] | 0.845 | 0.849 | 0.867 | 0.946 | -0.0126 | 0.545 | 1.24 | 0.500 | 0.707 | 0.833 | 0.899 | 0.729 | |||
| CESM3_098bH | [-] | 0.834 | 0.843 | 0.867 | 0.861 | -0.0215 | 0.524 | 1.18 | 0.502 | 0.720 | 0.846 | 0.910 | 0.740 | |||
| CMIP6_001 | [-] | 0.968 | 0.990 | 0.867 | 0.883 | 0.524 | 0.125 | 0.527 | 1.12 | 0.525 | 0.701 | 0.859 | 0.900 | 0.737 | ||
| LE2_001 | [-] | 0.937 | 0.958 | 0.867 | 0.854 | 0.524 | 0.0910 | 0.520 | 1.12 | 0.541 | 0.693 | 0.863 | 0.926 | 0.743 |
Download Data |
Period Mean (original grids) [mm d-1] |
Model Period Mean (intersection) [mm d-1] |
Benchmark Period Mean (intersection) [mm d-1] |
Model Period Mean (complement) [mm d-1] |
Benchmark Period Mean (complement) [mm d-1] |
Bias [mm d-1] |
RMSE [mm d-1] |
Phase Shift [months] |
Bias Score [1] |
RMSE Score [1] |
Seasonal Cycle Score [1] |
Spatial Distribution Score [1] |
Overall Score [1] |
|||
|---|---|---|---|---|---|---|---|---|---|---|---|---|---|---|---|---|
| Benchmark | [-] | 1.16 | ||||||||||||||
| CESM3_092H | [-] | 1.22 | 1.09 | 1.16 | 2.62 | -0.0377 | 0.967 | 0.936 | 0.516 | 0.556 | 0.897 | 0.954 | 0.696 | |||
| CESM3_098bH | [-] | 1.25 | 1.12 | 1.16 | 2.66 | -0.00863 | 0.972 | 0.971 | 0.517 | 0.553 | 0.894 | 0.958 | 0.695 | |||
| CMIP6_001 | [-] | 1.12 | 1.00 | 1.16 | 2.77 | 4.10 | -0.131 | 0.926 | 0.802 | 0.524 | 0.550 | 0.912 | 0.966 | 0.700 | ||
| LE2_001 | [-] | 1.07 | 0.953 | 1.16 | 2.70 | 4.10 | -0.180 | 0.955 | 0.863 | 0.513 | 0.540 | 0.906 | 0.959 | 0.691 |
Download Data |
Period Mean (original grids) [mm d-1] |
Model Period Mean (intersection) [mm d-1] |
Benchmark Period Mean (intersection) [mm d-1] |
Model Period Mean (complement) [mm d-1] |
Benchmark Period Mean (complement) [mm d-1] |
Bias [mm d-1] |
RMSE [mm d-1] |
Phase Shift [months] |
Bias Score [1] |
RMSE Score [1] |
Seasonal Cycle Score [1] |
Spatial Distribution Score [1] |
Overall Score [1] |
|||
|---|---|---|---|---|---|---|---|---|---|---|---|---|---|---|---|---|
| Benchmark | [-] | 0.294 | ||||||||||||||
| CESM3_092H | [-] | 0.590 | 0.570 | 0.294 | 1.30 | 0.286 | 0.562 | 1.55 | 0.219 | 0.446 | 0.786 | 0.820 | 0.543 | |||
| CESM3_098bH | [-] | 0.583 | 0.564 | 0.294 | 1.24 | 0.278 | 0.544 | 1.56 | 0.210 | 0.469 | 0.783 | 0.815 | 0.549 | |||
| CMIP6_001 | [-] | 0.453 | 0.433 | 0.293 | 1.47 | 1.98 | 0.151 | 0.476 | 1.86 | 0.310 | 0.473 | 0.727 | 0.884 | 0.573 | ||
| LE2_001 | [-] | 0.507 | 0.486 | 0.293 | 1.49 | 1.98 | 0.203 | 0.535 | 1.78 | 0.279 | 0.431 | 0.743 | 0.883 | 0.553 |
Download Data |
Period Mean (original grids) [mm d-1] |
Model Period Mean (intersection) [mm d-1] |
Benchmark Period Mean (intersection) [mm d-1] |
Model Period Mean (complement) [mm d-1] |
Benchmark Period Mean (complement) [mm d-1] |
Bias [mm d-1] |
RMSE [mm d-1] |
Phase Shift [months] |
Bias Score [1] |
RMSE Score [1] |
Seasonal Cycle Score [1] |
Spatial Distribution Score [1] |
Overall Score [1] |
|||
|---|---|---|---|---|---|---|---|---|---|---|---|---|---|---|---|---|
| Benchmark | [-] | 3.21 | ||||||||||||||
| CESM3_092H | [-] | 1.97 | 1.96 | 3.21 | 2.62 | -1.20 | 2.94 | 0.879 | 0.196 | 0.410 | 0.902 | 0.741 | 0.532 | |||
| CESM3_098bH | [-] | 1.79 | 1.77 | 3.21 | 2.40 | -1.39 | 2.98 | 0.855 | 0.178 | 0.407 | 0.913 | 0.771 | 0.535 | |||
| CMIP6_001 | [-] | 2.25 | 2.29 | 3.21 | 1.47 | 0.835 | -0.891 | 2.45 | 0.814 | 0.305 | 0.407 | 0.913 | 0.916 | 0.590 | ||
| LE2_001 | [-] | 2.24 | 2.27 | 3.21 | 1.49 | 0.835 | -0.909 | 2.46 | 0.844 | 0.300 | 0.409 | 0.911 | 0.915 | 0.589 |
Download Data |
Period Mean (original grids) [mm d-1] |
Model Period Mean (intersection) [mm d-1] |
Benchmark Period Mean (intersection) [mm d-1] |
Model Period Mean (complement) [mm d-1] |
Benchmark Period Mean (complement) [mm d-1] |
Bias [mm d-1] |
RMSE [mm d-1] |
Phase Shift [months] |
Bias Score [1] |
RMSE Score [1] |
Seasonal Cycle Score [1] |
Spatial Distribution Score [1] |
Overall Score [1] |
|||
|---|---|---|---|---|---|---|---|---|---|---|---|---|---|---|---|---|
| Benchmark | [-] | 0.652 | ||||||||||||||
| CESM3_092H | [-] | 0.985 | 1.00 | 0.652 | 0.884 | 0.348 | 1.05 | 2.08 | 0.486 | 0.626 | 0.681 | 0.794 | 0.642 | |||
| CESM3_098bH | [-] | 0.825 | 0.848 | 0.652 | 0.673 | 0.192 | 0.857 | 1.91 | 0.527 | 0.666 | 0.714 | 0.835 | 0.682 | |||
| CMIP6_001 | [-] | 1.02 | 1.04 | 0.652 | 0.644 | 1.26 | 0.376 | 1.12 | 2.00 | 0.507 | 0.598 | 0.705 | 0.732 | 0.628 | ||
| LE2_001 | [-] | 0.949 | 0.962 | 0.652 | 0.648 | 1.26 | 0.303 | 1.02 | 1.83 | 0.555 | 0.628 | 0.733 | 0.740 | 0.657 |
Download Data |
Period Mean (original grids) [mm d-1] |
Model Period Mean (intersection) [mm d-1] |
Benchmark Period Mean (intersection) [mm d-1] |
Model Period Mean (complement) [mm d-1] |
Benchmark Period Mean (complement) [mm d-1] |
Bias [mm d-1] |
RMSE [mm d-1] |
Phase Shift [months] |
Bias Score [1] |
RMSE Score [1] |
Seasonal Cycle Score [1] |
Spatial Distribution Score [1] |
Overall Score [1] |
|||
|---|---|---|---|---|---|---|---|---|---|---|---|---|---|---|---|---|
| Benchmark | [-] | 0.550 | ||||||||||||||
| CESM3_092H | [-] | 2.07 | 2.09 | 0.550 | 2.06 | 1.50 | 2.22 | 1.70 | 0.169 | 0.341 | 0.755 | 0.544 | 0.430 | |||
| CESM3_098bH | [-] | 2.09 | 2.10 | 0.550 | 2.11 | 1.52 | 2.24 | 1.71 | 0.167 | 0.340 | 0.754 | 0.553 | 0.431 | |||
| CMIP6_001 | [-] | 1.42 | 1.46 | 0.550 | 1.37 | 0.305 | 0.960 | 1.63 | 1.83 | 0.287 | 0.410 | 0.735 | 0.573 | 0.483 | ||
| LE2_001 | [-] | 1.42 | 1.46 | 0.550 | 1.38 | 0.305 | 0.964 | 1.65 | 1.74 | 0.296 | 0.407 | 0.748 | 0.572 | 0.486 |
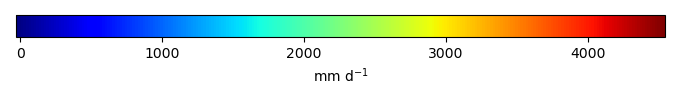
Temporally integrated period mean